Abstract
This study aims to assess how climate change will affect the intensity of soil erosion in the Vistula River basin by the mid-21st century. A simulation framework based on the SWAT–MUSLE model was applied, calibrated, and validated against observed streamflow data and driven by climatic forcings from the EURO-CORDEX ensemble (the RACMO22E, HIRHAM5, and RCA4 models forced by EC-EARTH GCM) under the RCP 4.5 and RCP 8.5 scenarios. Simulations were conducted at a daily time step for the years 2021–2050 and compared to the reference period 2013–2018. The analysis included the decadal and seasonal aggregation of the sediment yield (SYLD, t ha−1 yr−1). The results indicate that, relative to the baseline value (~1.84 t ha−1 yr−1), the SYLD increases under both scenarios. In RCP 4.5, the rise culminates during 2031–2040 and then stabilizes in 2041–2050. Under RCP 8.5, a continuous upward trend is observed, with the highest values projected for 2041–2050, particularly for the HIRHAM5 realization. The largest relative increases occur in summer (JJA) and, in the final decade, also in autumn (SON); in the early horizon, autumn may locally exhibit declines that later shift to increases. The spread among RCM realizations remains significant and should be interpreted as an expression of projection uncertainty. The practical implications include prioritizing soil protection measures in sub-catchments with high LS factors and soils susceptible to water erosion, strengthening runoff and sediment control in summer, and planning maintenance of small-scale retention infrastructure. Study limitations arise from the inherent structure of the MUSLE model, bias correction procedures for climate data, and the representation of extreme events. Therefore, greater emphasis is placed on the direction and seasonality of changes rather than absolute numerical values.
Keywords:
Vistula River; MUSLE; water erosion; sediment yield; SWAT; climate change; EURO-CORDEX; RCP scenarios 1. Introduction
Water erosion is one of the most important processes driving soil degradation worldwide, with far-reaching consequences for agricultural productivity, soil organic carbon storage, water quality, and river system functioning [1]. Its intensity depends on the interaction between rainfall characteristics, topography, soil properties, and land use, making erosion processes particularly sensitive to ongoing and projected climate change (e.g., impacts on hydrological balance under future climate scenarios) [2].
Recent climate projections consistently indicate an increase in the frequency and intensity of extreme precipitation events in many regions, even where changes in total annual rainfall remain moderate [3]. Such changes are expected to enhance surface runoff generation and sediment mobilization, potentially leading to non-linear responses of erosion processes at the catchment scale.
Numerous modeling approaches have been developed to assess soil erosion and sediment yields [4]. Empirical models of the USLE [5,6] family, including the RUSLE [7], remain widely used for long-term assessments of average soil losses, particularly at the hillslope scale [4]. However, their reliance on rainfall erosivity indices limits their ability to capture event-driven erosion dynamics. In contrast, the Modified Universal Soil Loss Equation (MUSLE) [8] explicitly incorporates the runoff volume and peak discharge, enabling a direct linkage between the hydrological response and sediment yield. As a result, the MUSLE has increasingly been implemented within distributed hydrological models, such as the SWAT, to assess erosion processes at the watershed scale [9].
Despite this progress, relatively few studies have applied the SWAT–MUSLE frameworks to large river basins under future climate scenarios, and even fewer have focused on the seasonal reorganization of erosion processes and the associated uncertainty arising from different regional climate model realizations [4,10]. These methodological limitations and research gaps are particularly relevant to large, climatically diverse river basins, such as those found in Central Europe.
Central Europe represents a particularly sensitive region for climate-driven erosion change due to its transitional climate regime and the increasing occurrence of high-intensity rainfall events. In Poland, large river basins are dominated by agricultural land use and soils with limited resistance to water erosion, which enhances their vulnerability to changes in runoff dynamics [11]. The Vistula River basin (Figure 1), covering approximately 61% of the country’s territory and encompassing lowland, upland, and mountain environments, provides an ideal case study for assessing climate-induced changes in sediment yields at the basin scale.
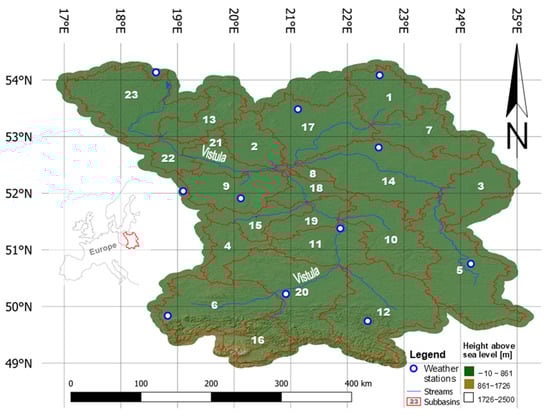
Figure 1.
The boundaries of the Vistula River basin and its major tributaries, together with their catchment areas (own study).
Previous hydrological modeling studies have shown that future climate scenarios may significantly alter the water balance and runoff regime of the basin, suggesting potential implications for erosion and sediment transport pathways [12].
The hydrological mosaic of the Vistula basin—from mountainous headwaters to wide lowland valleys—creates considerable spatial variability in erosion conditions. Local morphometric factors (slope gradient, slope length, valley incision), soil properties, and land cover modify the rainfall–runoff response and generate distinct erosion potentials in different parts of the river system. In the Lower Vistula, as typical of large lowland rivers, erosion-prone areas are located on valley edge zones and glacial uplands. These findings have been confirmed using approaches that combine remotely sensed environmental data, classical soil loss models (the USLE), and maximum entropy modeling [13]. Analyses of 2 smaller Middle Vistula upland sub-catchments of Bystra river using the SWAT [14] and Grodarz stream using physical modeling in Erosion 3D [15] have revealed that these landscapes are highly prone to superficial water erosion caused by steep terrain and loess soils.
At the national scale, qualitative indicators of water erosion risk—potential and actual water erosion—show a substantial share of areas affected by surface water erosion of moderate to very high intensity, accounting for around 15% of Poland’s territory [16]. Moreover, about 7% of the country is affected by gully erosion of moderate to very high severity, with a gully network density exceeding 0.5 km km−2 [11]. European estimates of the soil erosion intensity and risk for Poland, prepared in 2015 [17] at 100 m spatial resolution, are based on digital elevation models at 25 m resolution [18] and soil erodibility factor (USLE-K) data at 500 m resolution [19], which do not adequately capture the heterogeneity of the Polish terrain and post-glacial, highly diverse soil cover [20]. Therefore, we decided to conduct the simulation-based modeling of the water erosion intensity in the Vistula basin using high-resolution spatial datasets available to us.
Recent hydrological modeling of the entire Vistula basin using the SWAT [13]—calibrated and validated against discharge data at the Tczew gauge—indicates that, in the 2021–2050 perspective, an increase in the actual evapotranspiration and spatially differentiated changes in the precipitation and total runoff should be expected, depending on the climate scenario (RCP 4.5/8.5) and regional EURO-CORDEX projections [21]. In many lowland sub-catchments, a decrease in the mean annual runoff is projected (particularly under RCP 4.5), while northwestern and southern basins may experience an increase. Changes in the number of dry days and increasing temperature further modulate the runoff formation and erosion potential. Although no uniform trend in the total runoff emerges at the basin scale, the projected shifts in the water balance may lead to a reorganization of sediment sources and delivery pathways to river channels [13].
In light of these findings and previous studies on the spatial erosion susceptibility in the Middle and Lower Vistula valley [14,15,22,23], a synthetic assessment of the current and future erosion conditions in the Vistula basin is needed—combining a process-based perspective (water balance, runoff regime) with landscape vulnerability mapping. Against this background, the objective of this study is to assess how projected climate change may affect the sediment yield dynamics in the Vistula River basin by the mid-21st century. Using a SWAT–MUSLE modeling framework driven by an ensemble of EURO-CORDEX regional climate projections under the RCP 4.5 and RCP 8.5 scenarios, this study focuses on (i) relative changes in sediment yields compared to a recent reference period, (ii) differences between emission pathways and regional climate model realizations, and (iii) the seasonal and decadal reorganization of the erosion intensity.
Given the inherent uncertainties associated with climate projections and event-based erosion modeling, particular emphasis is placed on robust patterns in the direction, timing, and seasonality of change rather than on absolute sediment yield values.
2. Materials and Methods
2.1. Modeling Approach
The methodological framework was designed to test the hypothesis that projected changes in precipitation intensity and seasonal runoff regimes under future climate scenarios will lead to the non-linear and seasonally differentiated response of sediment yields at the basin scale. The SWAT–MUSLE modeling chain was therefore applied not to predict absolute sediment loads but to assess the relative changes, temporal trajectories, and spatial reorganization of the erosion risk.
To assess soil erosion, we applied the same modeling framework used in the reference study for the Vistula River basin [13]: the Soil and Water Assessment Tool (SWAT) [9] was implemented using QSWAT3 (v1.1) [24] within QGIS 3.10.13 “Coruna”, with computations performed in SWAT Editor (2012.10.23) and calibration/validation conducted in SWAT-CUP (v5.2.1) using the SUFI-2 algorithm [25].
The physical modeling of superficial water erosion consists of two physically distinct components: water dynamics reflected in hydrological models and sediment dynamics reflected in erosion models [26]. In empirical models like the USLE, the hydrological component is reduced into the rainfall erosivity USLE-R, covering all the components of water energy influencing the soil surface. In this paper’s approach, the hydrological model within the SWAT calculates the single-event superficial overland flow that feeds the MUSLE, providing values for the sediment discharge, deposition, and SYLD for the whole Vistula catchment and its sub-catchments. Overland flow, not rain energy, remains the main factor providing the energy feeding the catchment’s response in sediment yield. From the erosion model perspective, the main factors affecting this response remain the landscape (USLE-LS) and soil susceptibility to erosion (USLE-K) factors. The cover/management (USLE-C) and support practice (USLE-P) factors were set to typical values, taken from the SWAT database [9] and re-classified to the CORINE Land Cover 2018 database downloaded from the EEA website (access date 7 July 2025): https://land.copernicus.eu/en/products/corine-land-cover/clc2018. USLE-LS values were calculated from 50 m resolution DEM. A resolution of 50 m remains a tradeoff between high resolution and computational capacity, remaining far below the threshold of 90 m, which was set as the absolute minimum to reflect the upland and mountainous landscapes’ LS in our previous research [20]. The USLE-K was derived from long-term model experiments with artificial rain, making direct relation to the soil dataset used in the study—Polish agri-soil maps of 1:25,000 [27].
The hydrological model was calibrated and validated using monthly discharge data at the Tczew gauge (2013–2018) following a five-year warm-up period. It was subsequently run for the projection period 2021–2050 under the RCP 4.5 and RCP 8.5 scenarios. The spatial framework consisted of 23 sub-catchments and 1055 Hydrological Response Units (HRUs), including a five-band elevation subdivision for areas with significant relief differences [9].
The USLE model and its derivatives are not designed to be rigorously validated using river suspended sediment transport data [10]. In 43% of the MUSLE modeling cases investigated by Sadeghi et al. [10], the researchers did not undertake any calibration because the model produced reasonable results. In the case of Vistula, the reference soil erosion value equals 1.84 t ha−1 yr−1, which corresponds well to the mean value of 1.79 t ha−1 yr−1 for arable land in Poland without the GAEC P reduction scheme, as estimated in a 2015 pan-EU study [18]. We consider the erosion model estimation quality to be solid, due to the USLE-K strong experimental base and high quality of DEM, which was the source of the USLE-LS factor. However, due to the lack of full calibration against the SYLD variable, the analysis focuses solely on change values relative to the modeled 2013–2018 period. The land use structure is assumed to remain stable within the investigated time horizon.
2.2. Sediment and Erosion Module
Before the emergence of GIS technology, studying erosion required laborious and time-consuming measurement techniques, both in the field and during office-based analysis. In the 1960s, the USLE (Universal Soil Loss Equation) became widely used for calculating soil loss caused by surface runoff [5,6]. This model was refined in subsequent handbooks [7], emphasizing its applicability to cropland conservation planning east of the Rocky Mountains. However, limitations in predicting event-based sediment yields at the watershed scale prompted the development of the Modified Universal Soil Loss Equation (MUSLE), which adapts the USLE framework by replacing the rainfall factor with a runoff energy term derived from watershed hydrology [8].
Unlike the USLE’s focus on long-term averages, the MUSLE enables single-storm predictions of sediment yields, making it suitable for dynamic hydrological assessments. Key differences between the MUSLE and its predecessor lie in the mechanistic incorporation of runoff volume and peak flow rates, calculated via standard hydrological models, to better capture the energy driving sediment transport [8]. Comprehensive reviews highlight the MUSLE’s global adoption for watershed-scale erosion modeling, with over 200 applications documented across diverse climates and land uses, underscoring its versatility despite challenges in parameter calibration for non-agricultural settings [10]. In contrast to the USLE’s reliance on climatic indices alone, the MUSLE’s hydrological integration reduces overestimation in low-runoff events and enhances accuracy for ephemeral streams, as demonstrated in early validations against measured sediment data [8]. This shift from erosivity to runoff-based drivers positions the MUSLE as a bridge toward more process-oriented erosion prediction.
The Revised Universal Soil Loss Equation (RUSLE), building directly on the USLE [7], introduces subfactor refinements and database enhancements for improved spatial variability in erosion estimates, such as seasonal C-factor adjustments and GIS-compatible LS computations, without altering the core multiplicative structure. While the RUSLE maintains the hillslope focus of the USLE for conservation planning [7], it diverges from the MUSLE by retaining the rainfall erosivity factor rather than adopting runoff hydrology, limiting its utility for event-specific sediment yields in larger basins [4]. Global statistical analyses of erosion models reveal that the RUSLE excels in long-term soil loss assessments across agroecosystems, with prediction errors under 20% in temperate zones, whereas the MUSLE’s strengths in hydrological linkage make it preferable for integrated watershed management [4]. These distinctions underscore complementary roles: the RUSLE for refined hillslope conservation and the MUSLE for basin-scale dynamics.
Soil erosion and sediment yields from HRUs were estimated using the Modified Universal Soil Loss Equation (MUSLE) implemented in the SWAT. The equation is based on runoff energy, with the cover/management (C) and support practice (P) factors, as well as the topographic LS factor. The results were aggregated to the sub-catchment and stream reach levels.
Calculations were performed at a daily time step and aggregated to monthly and seasonal values for comparison between the reference period (2013–2018) and projection horizons (2021–2030; 2031–2040; 2041–2050) [28].
2.3. Climate Scenarios
Daily meteorological data used in the climate scenario analysis for 2021–2050 were obtained from the EURO-CORDEX database (Coordinated Regional Climate Downscaling Experiment—Europe) [29], which provides high-resolution regional climate projections for Europe. Three regional climate models (RCMs) were used: KNMI–RACMO22E, DMI–HIRHAM5, and SMHI–RCA4, all driven by the EC-EARTH Global Climate Model (GCM), under two radiative forcing scenarios: RCP 4.5 and RCP 8.5 [21,30,31]. The climate projections used in this study were previously subjected to a bias correction procedure performed by the Swedish Meteorological and Hydrological Institute (SMHI), using the Distribution-Based Scaling (DBS) method and regional reanalysis MESAN (mesoscale analysis) dataset from the period 1989–2010, which adjusts the statistical distribution of modeled climate variables to match observations and reduces systematic biases typical for raw RCM output [32]. Since the downloaded data were performed on the rotated polar grid, we applied bilinear interpolation to remap this dataset to a regular geographic latitude/longitude grid by using CDO (climate data operators) software version 2.5.0.
The data obtained from the climate scenarios were compiled into databases for the same meteorological stations that were used to run the SWAT model (Materials and Methods Section) (Table 1).

Table 1.
Data obtained from climate scenarios used in the SWAT model.
2.4. Model Calibration and Performance Assessment
The performance of the hydrological component (a prerequisite for reliable erosion modeling) was evaluated using standard SWAT-CUP performance statistics, including the Nash–Sutcliffe Efficiency (NSE), coefficient of determination (R2), and Percent Bias (PBIAS), together with SUFI-2 sensitivity analysis [25]. To account for uncertainty in the hydrological modeling, the SWAT model was calibrated and validated using the SUFI-2 algorithm implemented in SWAT-CUP, which quantifies parameter uncertainty through the 95% prediction uncertainty (95PPU) band and provides a sensitivity analysis of key model parameters. This combined approach enables both the correction of climate model bias and the explicit assessment of uncertainty in simulated hydrological responses under future climate scenarios. The obtained performance indicators confirm that the model meets the quality criteria for both calibration and validation. During the calibration period, the model achieved Nash–Sutcliffe = 0.77 and R2 = 0.78, with p-factor = 0.81 and r-factor = 1.13, indicating a good agreement between simulated and observed flows and an appropriate representation of uncertainty (95PPU). In the validation period, the results also remain at an acceptable level (Nash–Sutcliffe = 0.73; R2 = 0.75; p-factor = 0.77; r-factor = 1.17), confirming the model’s stability and its ability to reliably reproduce streamflow dynamics in an independent dataset.
The validation mechanism for the Modified Universal Soil Loss Equation (MUSLE) is tied to its empirical nature as a derivative of the USLE, designed specifically to predict sediment yields from individual storm events [8,10]. The MUSLE replaces the rainfall erosivity factor (R) of the USLE with the runoff volume, which allows it to be applied to individual storm events and has resulted in the satisfactory prediction of measured sediment yields in some cases. However, the MUSLE cannot be rigorously validated using river suspended sediment transport data [10]. This fundamental limitation persists because the underlying conceptual flaw of USLE-type algorithms regarding erosion fluxes is not overcome in the MUSLE. USLE-type models, including the MUSLE, are designed to estimate the risk of on-site erosion, predicting the gross erosion rate—the mass of soil moved on a specific hillslope. These models focus solely on the physical process of soil detachment and transport on the hillslope and, critically, do not simulate the process of soil deposition or sedimentation. In contrast, river suspended sediment transport data represent net erosion rates or catchment sediment yields—the amount of soil actually removed from the area, which is the result *after* deposition processes are accounted for. The model output (gross erosion) and the observed data (net sediment yield) therefore represent different flow quantities. For this reason, modeling results based on the RUSLE-derived MUSLE have been found to be unsuccessful when compared to the sediment yields of small catchments across the US and its territories [33]. Considering potential high uncertainty in model calibration against the SYLD variable, this paper focuses on the relative values of soil erosion in future climate, evaluated against 2013–2018 modeling results as a reference. The ratios depend solely on superficial outflow, which remains a part of the catchment hydrological balance, which was calibrated against measured values for the reference period.
2.5. Input Dataset
The Table 2 summarizes the datasets used as inputs to the MUSLE model.
Table 2.
Input dataset used in the SWAT–MUSLE simulations.
3. Climate Projection Scenarios
To ensure comparability with the reference study for the Vistula River basin, the same set of EURO-CORDEX projections was applied. The ensemble comprised three regional climate models (RCMs) driven by the EC-EARTH Global Climate Model (GCM) (labeled A–C, as in the reference study) and two radiative forcing pathways: RCP 4.5 and RCP 8.5 (Table 3). The data were obtained as daily time series for 2021–2050 at a spatial resolution of 0.11° (~12.5 km), in accordance with EURO-CORDEX standards. Temperature and precipitation were bias-corrected using the Distribution-Based Scaling (DBS) method, with the MESAN reanalysis serving as the reference dataset. Each bias-corrected climate dataset was assigned to the same meteorological stations used for hydrological model calibration. Additionally, decadal CO2 concentration trajectories (2021–2030, 2031–2040, and 2041–2050) were incorporated according to the corresponding RCP scenarios [13,21,30].
Table 3.
Overview of climate projections used in this study.
Operational Notes
The selected projections followed the recommended EURO-CORDEX protocol regarding spatial resolution, temporal frequency (daily data), and station-based assignment. The Distribution-Based Scaling (DBS) method—a parametric variant of quantile mapping—and the MESAN reanalysis system were implemented in accordance with the SMHI guidelines. The simulations also incorporated CO2 concentration trajectories defined within the RCP framework, consistent with the PIK/IIASA databases, thereby ensuring a coherent representation of radiative forcing effects across the decadal periods (2021–2030, 2031–2040, and 2041–2050) [21,30,31,32].
4. Simulation Results for RCP 4.5 and RCP 8.5 Scenarios: 2021–2050
Based on the “Sediment Yield” plots (A/B/C = three RCM realizations), distinctly different erosion responses were obtained for the RCP 4.5 and RCP 8.5 scenarios during the 2021–2050 period. Under RCP 4.5, the simulations indicate a slight overall increase in the mean sediment yield, with a pronounced “hump” (peak) during 2031–2040, followed by a return to levels close to the baseline in 2041–2050. In contrast, RCP 8.5 shows a systematic upward trend toward the end of the projection horizon, most clearly expressed in realization “B”. At the same time, inter-annual variability remains high under both emission pathways (Figure 2).
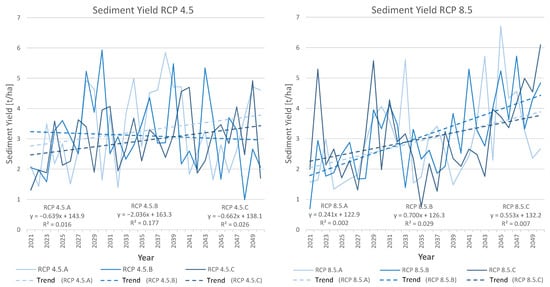
Figure 2.
Average annual erosion [t ha−1] in the Vistula River basin in 2021–2050 for selected climate projections in the RCP 4.5 and RCP 8.5 scenarios, including the trend line (own study).
The trends of the simulated sediment yield patterns for the RCP4.5 and RCP8.5 scenarios in general follow the simulated surface runoff patterns (Figure 3), indicating a sharp growth trend in RCP8.5, with RCP4.5 varying throughout the three investigated RCM realizations. The years representing the maxima are (as expected) repeated in both variables.
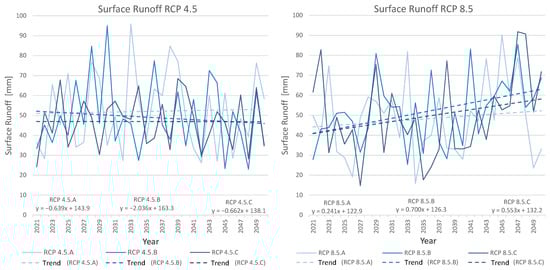
Figure 3.
Annual total surface runoff [mm] in the Vistula River basin in 2021–2050 for selected climate projections in the RCP 4.5 and RCP 8.5 scenarios, including the trend line (own study).
4.1. Analysis of the RCP 4.5 Scenario
The ensemble average for the RCP 4.5 scenario indicates a weak but positive linear trend in the sediment yield, quantified at approximately +0.20 t ha−1 per decade across the 30-year period (Table 4). The long-term average SYLD under this scenario is 3.11 t ha−1. Temporally, the RCP 4.5 pathway is characterized by a pronounced mid-horizon intensity peak, or “hump,” during the 2031–2040 interval. This peak is subsequently followed by a return to levels closer to the baseline in the final decade (2041–2050). This projected stabilization translates to a marginal average increase of only +3% when comparing the mean SYLD of the final decade (2041–2050) to that of the initial decade (2021–2030). The minimum average SYLD (1.79 t ha−1) appears early in the series in 2022, while the maximum average SYLD (4.52 t ha−1) is projected to occur in 2028. The projection uncertainty under RCP 4.5 is considerable, highlighted by the spread among the three RCM realizations (Table 4).
Table 4.
Numerical summary (2021–2050), units [t ha−1].
- Realizations A (RACMO22E) and C (RCA4) exhibit moderate positive trends (+0.35 and +0.33 t ha−1 per decade, respectively). Realization C projects the largest increase (+21%) in this scenario when comparing the final decade to the initial decade.
- In contrast, realization B (HIRHAM5) uniquely projects a negative trend (–0.09 t ha−1 per decade), resulting in a 15% decrease in the average SYLD by the end of the period compared to the beginning.
These conflicting outcomes suggest that the long-term erosion risk under the RCP 4.5 scenario appears relatively stable but remains highly sensitive to extreme weather events characterized by precipitation deficits or abundance.
4.2. Analysis of the RCP 8.5 Scenario
The RCP 8.5 scenario demonstrates a systematic and sustained cumulative upward trend in the sediment yield throughout the 2021–2050 horizon. The ensemble average trend is significantly steeper than that in RCP 4.5, quantified at +0.69 t ha−1 per decade (Table 4). This sustained growth trajectory culminates in the highest projected SYLD values occurring in the final decade (2041–2050), representing a substantial +58% increase relative to the initial decade (2021–2030). The overall average SYLD for the period is 3.03 t ha−1. The range of average SYLD values spans from a minimum of 1.42 t ha−1 in 2021 to a maximum of 5.22 t ha−1 in the mid-2040s.
All three RCM realizations consistently project significant positive trends under RCP 8.5:
- Realization B (HIRHAM5) exhibits the most substantial intensification, projecting the strongest trend among all models and scenarios (+0.91 t ha−1 per decade). This leads to the largest relative change: an 82% increase in the average SYLD between the initial and final decades.
- Realizations A (RACMO22E) and C (RCA4) also project robust increases (+63% and +35% changes, respectively).
This convergence towards systematically increased SYLDs under RCP 8.5 strongly suggests an elevated likelihood of increased sediment delivery to surface water bodies in the latter half of the simulation period.
4.3. Methodological Note on Uncertainty
The considerable spread observed among the RCM realizations underscores the intrinsic model uncertainty associated with climate projections. As the simulation framework relies on the MUSLE model and incorporates bias correction procedures for climate data, the results are subject to cumulative uncertainties. Consequently, interpretation of these findings must prudently prioritize the direction and timing (seasonality) of projected changes and the consistency among RCM outputs, rather than focusing exclusively on the derived absolute numerical values.
5. Simulated Changes in Sediment Yield Across Decadal and Seasonal Scales: 2021–2050
This chapter presents a detailed quantitative analysis of projected changes in the sediment yield (SYLD), aggregated across seasonal and decadal intervals, based on the three regional climate model (RCM) realizations (A, B, C) under the RCP 4.5 and RCP 8.5 scenarios. These projections are rigorously compared against the established average SYLD for the reference period (2013–2018), which totaled 1.84 t ha−1 yr−1. The simulation outcomes consistently indicate a basin-wide intensification of the SYLD relative to this baseline across all climate projections.
5.1. Decadal Trajectories of Sediment Yield
The modeling results reveal fundamentally different temporal trajectories for the erosion risk under the two RCP pathways, as summarized by the decadal average annual SYLD values (Table 5).
Table 5.
Comparison of erosion (SYLD, t ha−1) for different seasons during the SWAT simulation period (2013–2018) with climate projections (RCP 4.5.A; RCP 4.5.B; RCP 4.5.C; RCP 8.5.A; RCP 8.5.B; RCP 8.5.C) for the years 2021–2030, 2031–2040, and 2041–2050 in the Vistula River basin. Dark-red shading indicates a large percentage decrease in the SYLD (t ha−1) and light red indicates a small decrease; dark blue indicates a large increase in the SYLD and light blue indicates a small increase (own study).
5.1.1. RCP 4.5 Scenario: Mid-Horizon Peak
The RCP 4.5 pathway is characterized by a non-linear temporal pattern, exhibiting a pronounced “hump” (intensity peak) in the mid-projection horizon (2031–2040).
- The highest ensemble average annual SYLD values are attained in the 2031–2040 decade, with RCM realization A (RACMO22E) projecting a peak annual average of 4.11 t ha−1 yr−1, representing a substantial increase of +124% relative to the baseline.
- This intensification is followed by a stabilization phase in the final decade (2041–2050). The average annual SYLD values across the RCM ensemble in 2041–2050 (ranging from 2.79 to 3.16 t ha−1 yr−1) generally return to levels comparable to or slightly above those of the initial decade (2021–2030). For instance, realization A stabilizes to 2.96 t ha−1 yr−1 by the final decade, a +62% increase over the baseline.
- RCM realization C (RCA4) projects the highest average annual SYLD in the final decade for RCP 4.5, reaching 3.16 t ha−1 yr−1.
5.1.2. RCP 8.5 Scenario: Cumulative Upward Growth
In contrast, the RCP 8.5 scenario demonstrates a systematic and cumulative upward trend in sediment loading throughout the entire projection horizon.
- The highest projected SYLD values occur unequivocally in the final decade (2041–2050).
- During this critical interval, all three RCM realizations project average annual SYLDs exceeding 3.77 t ha−1 yr−1, correlating to relative increases ranging from +106% to +131% compared to the reference period.
- The highest annual average erosion risk is consistently attributed to RCM realization B (HIRHAM5) in the 2041–2050 decade, reaching 4.23 t ha−1 yr−1 (+131%).
- The final decade’s intensification solidifies the forecast that the highest risk of increased sediment supply will occur towards the end of the analyzed period.
5.2. Seasonal Reorganization of Erosion Intensity
Analysis of the seasonal aggregation reveals a profound reorganization of the erosion intensity, with the most significant relative changes concentrated in the summer and autumn periods.
5.2.1. Summer (JJA) Intensification
The summer season (June, July, August (JJA)) demonstrates the strongest relative increases across all scenarios, RCMs, and decadal intervals, suggesting heightened vulnerability due to anticipated increases in the convective rainfall intensity.
- The maximum recorded relative increase in the SYLD is observed in JJA under RCP 4.5 (realization A) during 2031–2040, reaching +276%.
- Similarly, under the RCP 8.5 pathway, JJA registers near-maximal intensification, peaking at +272% in the final decade (2041–2050) (realization B).
5.2.2. Autumn (SON) Transition
Autumn (September, October, November (SON)) exhibits a highly dynamic temporal shift, transforming from periods of potential decline in the early horizon to periods of dramatic intensification later in the series.
- In the initial decade (2021–2030), some RCM projections indicate local declines in the autumn SYLD, such as −39% (RCP 8.5, realization A) and −23% (RCP 4.5, realization C).
- However, by the final decade (2041–2050), massive increases dominate the projections. The single largest seasonal percentage increase in the entire study is found here: +176% (RCP 8.5, realization C). This convergence underscores the emergent erosion threat during the autumn season in the latter half of the projection.
5.2.3. Winter (DJF) and Spring (MAM) Changes
Changes in the winter (December, January, February (DJF)) and spring (March, April, May (MAM)) SYLDs are generally more moderate initially but become significant by the 2041–2050 decade, particularly under the high-emission scenario (RCP 8.5).
- By the final decade, winter (DJF) increases reach +141% (RCP 8.5, realization C).
- In spring (MAM) under RCP 8.5 (2041–2050), increases are consistent, ranging from approximately +78% to +82%.
5.3. Implications of RCM Disparity
The persistent and significant spread between the results of the individual RCM realizations (A, B, C) emphasizes the projection uncertainty inherent in climate model ensembles. The observed high model dependency necessitates that interpretation of these findings prioritizes the direction and seasonality of changes—such as the clear summer–autumn intensification and the cumulative growth trajectory under RCP 8.5—rather than assigning undue emphasis to the absolute numerical values derived from any single realization.
5.4. Comparative Analysis of Sediment Yield Changes Relative to the 2013–2018 Baseline
The interpretation below is based on the provided difference maps, where positive values indicate an increase in soil erosion and sediment transport and negative values indicate a reduction compared to the 2013–2018 reference model.
For the purpose of the regional analysis of sediment yields, the Vistula River basin was divided into five hydrologically coherent sub-regions, each composed of groups of adjacent sub-catchments (Figure 1):
- Region 1—Northwestern
Sub-catchments: 2, 13, 21, 22, 23
- Region 2—Northeastern
Sub-catchments: 1, 7, 17
- Region 3—Central–Western
Sub-catchments: 9, 11, 15, 18, 19
- Region 4—Central–Eastern
Sub-catchments: 3, 5, 8, 10, 14
- Region 5—Southern (Carpathian/upland region)
Sub-catchments: 4, 6, 12, 16, 20
5.4.1. RCP 4.5—Short Summary (2021–2030) (Figure 4)
Across all models, the spatial pattern is similar:
- Central regions (3 and 4): clear decreases in sediment yield (SY); strongest in Model A, moderate in Model C, and weakest in Model B.
- Northern regions (1 and 2): clear increases in sediment yield (SY) in Model B and both increases and decreases in sediment yield (SY) in Models A and B.
- Southern region (5): noticeable SY increase, especially in Model C.
Overall: Model B predicts the greatest intensification of erosion, particularly in the northern and southern regions.
5.4.2. RCP 8.5—Short Summary (2021–2030) (Figure 4)
- Across all models, the spatial pattern is similar: central regions: persistent decreases in SYs in all models, with the strongest in Model A.
- Northern and southern regions: increases in SYs, with the strongest in Model C.
Overall conclusions for both RCP 4.5 and RCP 8.5:
- Erosion decreases in the central part of the Vistula basin in most models.
- Erosion increases in the northern and southern regions in most models.
- The RCP 4.5.B model shows the highest percentage increases in erosion in the north and south, followed by the RCP 8.5.C model.

Figure 4.
Comparison of sediment yield changes across the five regions of the Vistula River basin for the period 2021–2030 relative to 2013–2018, under the RCP 4.5 and RCP 8.5 climate scenarios, where (A, B, C) represent the applied climate projections. Blue indicates a percentage decrease in the sediment yield and red indicates a percentage increase compared to the reference period (own study).

5.4.3. RCP 4.5—Short Summary (2031–2040) (Figure 5)
- Model A (RCP 4.5)
- Northwest and northeast: moderate increases (+33% to +56%).
- Central regions: decreases; strongest in the central–west (−34%).
- Southern region: very strong increase (+123%).
Model A shows a pronounced rise in erosion in the south and moderate growth in the north and east, while central regions experience reductions.
- Model B (RCP 4.5)
- North: strong increases (+25% to +92%).
- Central regions: decreases (−51%).
- South: substantial increase (+69%).
Model B intensifies erosion more strongly than Model A, especially in the northern region. Central reduction remains. In the southern region, erosion is weaker compared to that in Model A.
- Model C (RCP 4.5)
- North: highest increases among all models (+29% to +111%).
- Central regions: weak to moderate decreases (−8%).
- South: large increase (+64%).
Model C produces the strongest erosion response, with very large increases in the north in the southern region; erosion is weaker compared to Model A.
- Summary for RCP 4.5:
- Central regions show decreases in SYs in the western part in all models.
Northern and southern regions shows strong increases, especially in Models A and C. RCP 8.5—Short analysis.

Figure 5.
Comparison of sediment yield changes across the five regions of the Vistula River basin for the period 2031–2040 relative to 2013–2018, considering the RCP 4.5 and RCP 8.5 climate scenarios, with (A, B, C) denoting the respective climate models used in the analysis. Blue indicates a percentage decrease in the sediment yield while red indicates a percentage increase compared to the reference period (own study).

5.4.4. RCP 8.5—Short Summary (2031–2040) (Figure 5)
- North: increases (+3% to +61%).
- Central regions: decreases (−11% to −67%).
- South: increase (+52%).
Model A shows a moderate rise in erosion in the south and north, while central regions experience reductions.
- Model B (RCP 8.5)
- North: small increases (+24%).
- Central regions: decreases (−2% to −64%).
- South: moderate increase (+57%).
Model B shows increases in the northwestern and southern parts, as well as decreases in the central region and the northwest.
- Model C (RCP 8.5)
- North: very strong increases (+97%).
- Central regions: consistent decreases (−7% to −54%).
- South: moderate increases (+41%).
Similarly to Model B, Model C shows increases in the northwestern and southern parts, as well as decreases in the central region and the northwest.
- Summary for RCP 8.5:
- Central regions consistently show decreases in SYs across all models.
- North (particularly in the northwestern part) and south show increases in SYs.
- Overall conclusions for both RCP 4.5 and RCP 8.5:
- Central regions: stable decreases in erosion in most models.
- Northern and southern regions: increases in SYs, with the largest growth predicted by Model C in the northwest.
5.4.5. RCP 4.5—Short Summary (2041–2050) (Figure 6)
- Model A (RCP 4.5)
- North: moderate increases (+9% to +59%).
- Central regions: SY decreases (−6% to −52%).
- South: strong increase (+55%).
Model A shows a clear north–south increase in erosion, while the central basin continues to show reductions.
- Model B (RCP 4.5)
- North: increase in the northwest (+69%) and decrease in the northeast (−13%).
- Central regions: decrease in the central–west (−57%) and increase in the central–east (+35%).
- South: increase (+55%).
The western part in Model B shows similar values to those in Model A.
- Model C (RCP 4.5)
- North: increase in the northwest (+51%) and decrease in the northeast (−10%).
- Central regions: moderate SY decreases (−3% to −59%).
- South: strong increase (+74%).
The western part in Model C again shows similar values to those in Model A and Model B.
- Summary for RCP 4.5
- Central regions continue to show decreases in SYs in most models.
- Northern–east and southern regions show clear increases.

Figure 6.
Comparison of sediment yield changes across the five regions of the Vistula River basin for the period 2041–2050 relative to 2013–2018, incorporating climate projections A, B, and C within the RCP 4.5 and RCP 8.5 scenarios. Blue indicates a percentage decrease in the sediment yield while red indicates a percentage increase compared to the reference period (own study).

5.4.6. RCP 8.5—Short Summary (2041–2050) (Figure 6)
- Model A (RCP 8.5)
- North: very large increases (+39% to +188%).
- Central regions: decrease in the central–west (−35%) and increase in the central–east (+17%).
- South: very strong increase (+108%).
Model A shows a strong increase in erosion across most of the study area.
- Model B (RCP 8.5)
- North: major increases (+50% to +166%).
- Central regions: decrease in the central–west (−28%) and high increase in the central–east (+81%).
- South: very strong increase (+133%).
Model B shows a strong increase in erosion across most of the study area, similar to Model A.
- Model C (RCP 8.5)
- North: increases (+28% to +80%).
- Central regions: decrease in the central–west (−7%) and high increase in the central–east (+65%).
- South: strong increases (+113%).
Model C shows a strong increase in erosion across most of the study area, similar to Model A and Model B.
- Summary for RCP 8.5
- Northern and southern regions show very large increases in SYs, often exceeding +100%.
- Central regions remain zones of decreasing SYs, though reductions weaken relative to earlier decades.
- All models show much stronger erosion intensification than under RCP 4.5.
- Overall conclusion for 2041–2050:
- RCP 8.5 produces much larger sediment yield increases than RCP 4.5, especially in northern and southern regions.
- The central basin remains a zone of decreasing SYs, but the magnitude of reductions becomes smaller over time.
5.4.7. Short Inter-Decadal Summary (2021–2030 vs. 2031–2040 vs. 2041–2050)
- General trend over timeAcross all climate scenarios (RCP 4.5 and 8.5) and models (A, B, C), the pattern becomes progressively stronger with each decade:
- 2021–2030: small to moderate changes.
- 2031–2040: clear intensification of spatial contrasts.
- 2041–2050: strongest increases, especially under RCP 8.5.
- Northern regions (Regions 1–2)
- 2021–2030: mild to moderate increases in SYs.
- 2031–2040: stronger increases, particularly under Models B and C.
- 2041–2050: very strong increases, often exceeding +100 under RCP 8.5.
- Central regions (Regions 3–4)
- 2021–2030: clear decreases in SYs (−4% to −78%); strongest in RCP 8.5.A.
- 2031–2040: reductions persist but weaken.
- 2041–2050: a decrease in erosion (from −7% to −57%) in the central–western part, while in the central–eastern part, an increase in erosion in most models.
- Southern region (Region 5—Carpathian/upland)
- 2021–2030: moderate increases.
- 2031–2040: stronger, widespread increases (often +41% to +123%).
- 2041–2050: the largest increases of all regions, consistently +100 or more under RCP 8.5.
- Differences between RCP 4.5 and RCP 8.5
- In 2021–2030, differences between scenarios are very small.
- In 2031–2040, RCP 8.5 begins to diverge, especially in northern and southern regions.
- In 2041–2050, RCP 8.5 shows dramatically larger increases than RCP 4.5 in most regions.
- Overall three-decade synthesis
- Erosion increases over time, especially in the north and south of the basin.
- Central regions continue to show reductions, but these reductions become weaker in later decades.
- RCP 8.5 amplifies changes significantly after 2040, leading to the highest erosion risk.
6. Discussion
The projected sediment yield (SYLD) trajectories for the Vistula basin under RCP 4.5 and RCP 8.5 indicate that future climate conditions will substantially intensify erosion processes, although the nature and timing of these changes differ markedly between scenarios. The calculated average erosion intensity for the reference period (2013–2018) was 1.84 t ha−1 yr−1. This value already exceeds the tolerable soil loss threshold generally recognized in Europe (typically 0.3–1.4 t ha−1 yr−1) [34]. All climate projections, except for one RCM realization under RCP 4.5, indicate a likelihood of exceeding further critical thresholds, such as 2 t ha−1 yr−1 and 3 t ha−1 yr−1. For context, the earlier pan-European assessment (RUSLE2015) estimated the mean soil loss for all erosion-prone lands across the entire European Union (EU) in 2010 at 2.46 t ha−1 yr−1 [18], while the average rate specifically for Poland in 2010 was considerably lower, at 0.96 t ha−1 yr−1, with the mean value for farmland at 1.61 t ha−1 yr−1 and that for farmland without GAEC schemes (USLE-P = 1 everywhere) at 1.71 t ha−1 yr−1. The more recent baseline used for European projections (2016) [35] for EU and UK agricultural soils was even higher, at 3.07 t ha−1 yr−1. For future projections, a significant difference emerges when comparing the anticipated climate change impacts in the Vistula basin (MUSLE) against the pan-European agricultural areas (RUSLE). The European-scale projection study [35] estimated that the mean soil loss in EU and UK agricultural soils by 2050 would increase by +13% to +22.5% over the 2016 baseline, depending on the RCP scenario (from 3.07 t ha−1 yr−1 to up to 3.76 t ha−1 yr−1 in RCP 8.5). In sharp contrast, the Vistula basin study projects dramatically higher relative increases in the SYLD by the 2041–2050 decade compared to its 2013–2018 baseline (1.84 t ha−1 yr−1): Under the moderate-emission scenario (RCP 4.5), the average annual SYLD increase in the Vistula basin is projected to range from +62% to +72% (depending on the RCM model, compared to 1.84 t ha−1 yr−1). Under the high-emission scenario (RCP 8.5), the projected increase in the SYLD is even more substantial, ranging from +106% to +131%. The variable SYLD representing sediment yield (net erosion) is hardly directly compararable with soil loss (gross erosion); hence, the comparisons above are provided only for a very general overview of modeling assessments for the area of Poland.
The spatial distribution of the sediment yield corresponds to the erosivity of rainfall, reflected by the distribution of changes in the frequency of storms, indirectly indicated in Figure 7, Figure 8 and Figure 9 representing the number of days with precipitation exceeding 10 mm a day. In areas with erosion exceeding a 200% increase in the years 2021–2030 for RCP 4.5, the average number of days with precipitation exceeding 10 mm/d is higher than 20, and the maximum in 2030 equals 22 days (Figure 7, Figure 8 and Figure 9).
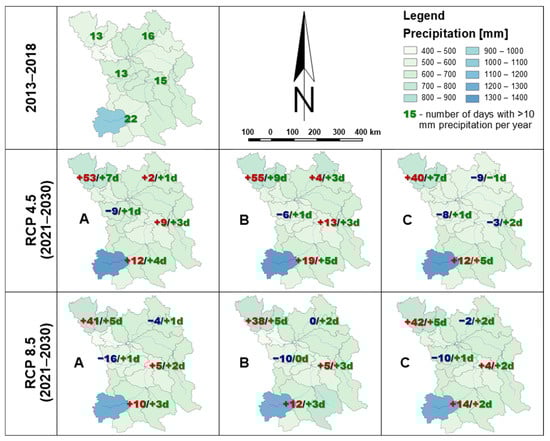
Figure 7.
Change in number of days with precipitation exceeding 10 mm in the years 2021–2030 compared to reference period 2013–2018. Values represent percentages in red (increase) and blue (decrease) and number of days in green.
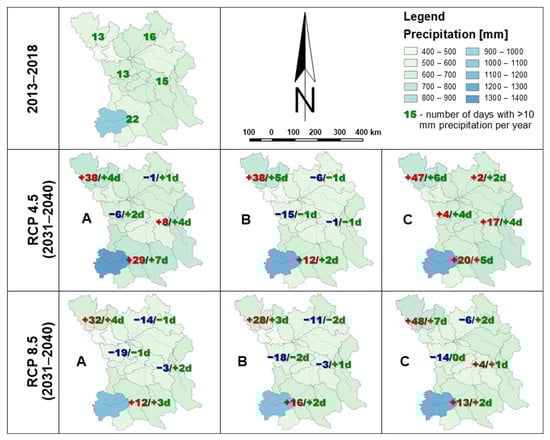
Figure 8.
Change in number of days with precipitation exceeding 10 mm in the years 2031–2040 compared to reference period 2013–2018. Values represent percentages in red (increase) and blue (decrease) and number of days in green.
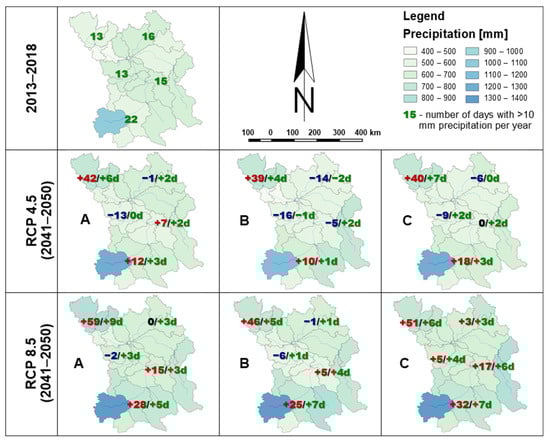
Figure 9.
Change in number of days with precipitation exceeding 10 mm in the years 2041–2050 compared to the reference period 2013–2018. Values represent percentages in red (increase) and blue (decrease) and number of days in green.
The expected progressive intensification of erosion poses a significant threat to the water capacity and buffering capabilities of Polish soils, particularly considering that 54% are sandy, including 21% classified as very light sandy soils (<10% clay content). Erosion intensification threatens the thickness of the topsoil humus layer, which constitutes the principal reservoir of soil organic matter.
The non-linear pattern observed under RCP 4.5, characterized by a pronounced mid-horizon peak (2031–2040) followed by partial stabilization (2041–2050), reflects the behavior observed in earlier studies from Polish mountain and upland catchments. Similar mid-century intensifications associated with increases in convective rainfall have been reported in SWAT-based simulations for the Carpathians [22] and in basin-scale analyses showing the episodic amplification of sediment fluxes in response to transient increases in rainfall erosivity [23]. These studies highlight that moderate-emission scenarios typically produce temporary increases in erosive rainfall that may later weaken as temperature-driven soil moisture deficits and shifting storm dynamics counterbalance the initial intensification.
By contrast, the persistent and cumulative rise in the sediment yield under RCP 8.5 is consistent with continental-scale projections showing strong and uninterrupted increases in rainfall erosivity and sediment transport under high-emission pathways. European modeling studies using RUSLE2015 and WaTEM/SEDEM [36] consistently indicate that under RCP 8.5, the increasing frequency and magnitude of heavy rainfall events continue to amplify the erosion risk throughout the 21st century. The magnitude of the SYLD increases in the present study—reaching an ensemble average of +58% and peaking at +131% in the final decade—is notably higher than the 22% increase projected for Poland in macro-scale assessments using the RUSLE. This disparity is likely attributed to the modeling approach: the MUSLE model utilized here is a single-event summation model based on runoff energy, making it highly sensitive to the temporal distribution and intensity of precipitation. The greater projected increases obtained by the MUSLE reflect the heightened sensitivity to local, high-intensity runoff events, which are poorly captured by annual-statistics models like the RUSLE. The current results align more closely with projections for other Central European mountain-influenced regions, such as the Alps and Carpathians [37,38].
The large disparities among the three RCM realizations demonstrate the strong dependence of erosion projections on how climate models represent precipitation intensities and intra-annual storm distributions. Similar divergence has been documented in Polish catchments [22,23] and in large European river basins such as the Elbe and Danube [39,40], where individual RCM structures lead to highly variable representations of convective rainfall. In the Vistula case, this uncertainty is especially visible under RCP 4.5, where realization B uniquely projects declining long-term SYLDs, while realizations A and C show clear increases. Under RCP 8.5, however, all realizations converge toward significantly rising sediment yields, reinforcing the interpretation that high-emission conditions exert a sufficiently strong climatic forcing to overcome model-specific precipitation biases.
Seasonal disaggregation reveals a profound reorganization of erosion processes, with the strongest intensification observed in summer (JJA) and autumn (SON). The summer amplification (up to +276% under RCP 4.5 and +272% under RCP 8.5) corresponds with widely acknowledged trends of increasing convective rainfall intensity in Central Europe [3]. Similar seasonal shifts toward more energetic warm-season rainfall have been identified in Polish uplands [41] and in European catchments subject to intensified storm rainfall [42]. The strengthened autumn erosion signal (up to +176% by 2041–2050 under RCP 8.5) reflects the projected shift toward wetter and more variable autumn conditions across the region [43] and is consistent with studies noting increasingly frequent late-season storm events that generate substantial sediment pulses [36]. Although winter (DJF) and spring (MAM) changes are more moderate initially, their progressive growth by 2041–2050—especially under RCP 8.5—mirrors observed and projected reductions in the snow cover and soil frost duration in Central Europe [44]. These changes have been shown to enhance winter runoff and allow erosive winter rainfall events to contribute more substantially to sediment mobilization, a trend documented in Baltic and Czech upland regions [38,40].
Relative to the baseline period (2013–2018), all future simulations indicate markedly elevated sediment yields across decades and seasons. This general intensification is in line with earlier reconstructions of sediment dynamics in Polish catchments, which demonstrate that baseline conditions underestimate the potential for future erosion under a warming climate [45]. It also corresponds with long-term European trends indicating the increasing susceptibility of agricultural and upland landscapes to climate-driven soil loss [35]. Despite these consistencies, the inherent projection uncertainty, arising from the spread among RCM realizations and the cumulative effect of using bias-corrected climate inputs with an event-sensitive model like the MUSLE, is significant. As recommended in ensemble-based European analyses [36], interpretation should emphasize robust patterns—direction of change, timing, and seasonal concentration of erosion risk—rather than any specific numerical estimates. The consistent signals observed here collectively suggest that the Vistula basin will experience increasing sediment mobilization and transport pressure over the coming decades, with the most pronounced impacts emerging in high-emission futures.
The limitations of the model used stem from the nature of the MUSLE model, which is a single-event summation model—this means that the model calculates erosion using single events (rainstorms, runoff episodes). For example, two years with the same rainfall may result in different SYLD values if in one year the rain came in several heavy downpours (high erosion) and in the other it was more evenly distributed (lower erosion). This increases the sensitivity of the results to when and how it rains, which better reflects real conditions compared to the USLE and RUSLE models, which are based on annual statistics.
Climate error correction can also introduce uncertainty. Climate projections need to be “tuned” to local conditions. Different correction methods can give slightly different precipitation/temperature series, which translates into different SYLDs. The representation of climate extremes is also imperfect in some cases. Climate and hydrological models do not always accurately reflect extremes (e.g., very short but exceptionally intense downpours). And it is precisely these extreme events that may be responsible for showing high erosion values in calculations.
In summary, due to the cumulative uncertainties of the calculations, it is more reasonable to focus the interpretation on the direction and timing of changes (e.g., increase in 2041–2050; strongest in summer and autumn) and on the consistency between RCM implementations (whether different models show a similar picture) than on individual numerical values subjected to error.
7. Conclusions
The modeling results for the Vistula basin under future climate conditions reveal that the sediment yield dynamics are highly sensitive to projected changes in precipitation intensity, runoff generation, and seasonal hydrological patterns. The analysis demonstrates that both the RCP 4.5 and RCP 8.5 scenarios lead to basin-wide increases in sediment yields relative to the 2013–2018 reference period, although the timing, magnitude, and persistence of these increases differ substantially between pathways.
Under the moderate-emission scenario (RCP 4.5), the sediment yield trajectories exhibit a non-linear response characterized by a pronounced intensification during the mid-century period (2031–2040) followed by partial stabilization in the final decade of the simulation. This suggests that moderate warming may lead to temporary peaks in erosive rainfall and runoff, after which counteracting processes—including soil moisture limitations and altered storm dynamics—reduce the long-term rate of increase. However, the substantial spread among the RCM realizations under this scenario underscores the high uncertainty associated with mid-range climate projections and highlights the strong dependence of modeled sediment yields on the structure and behavior of individual climate models.
The high-emission pathway (RCP 8.5) produces a fundamentally different response, with all RCM realizations showing a persistent and cumulative increase in sediment yields across the entire 2021–2050 horizon. The strongest intensification occurs in the final decade, where the average annual SYLD exceeds the baseline by more than 100% in all realizations. This consistent upward trajectory reflects the sustained growth in rainfall erosivity expected under high-emission warming and indicates that the Vistula basin is likely to experience markedly greater sediment mobilization, delivering increased debris loads to river systems in the latter half of the century.
Seasonal analysis reveals a clear reorganization of erosion processes, with the largest increases occurring in summer and autumn—seasons in which the future convective and late-season rainfall intensity is projected to rise most sharply. Winter and spring also show progressive increases, particularly in the RCP 8.5 scenario, reflecting reduced snow cover durations and more frequent erosive winter rainfall.
Together, these results indicate that the Vistula basin is likely to face heightened erosion pressures under future climate conditions, with the risk particularly pronounced under high-emission trajectories. While the absolute magnitude of sediment yield change remains uncertain due to differences among RCM realizations, several patterns emerge with high confidence:
- Erosion rates will increase across all scenarios and decades relative to the historical baseline.
- Seasonal erosion regimes will intensify, especially in summer and autumn.
- High-emission conditions will lead to sustained, long-term increases in sediment yields with limited signs of stabilization.
These findings emphasize the need for early adaptation strategies aimed at mitigating soil erosion and protecting water resources. Measures may include enhanced land cover management, targeted soil conservation practices, the reinforcement of riparian zones, and the development of sediment management strategies for reservoirs and downstream infrastructure. Given the magnitude of the projected changes, such interventions will be critical for reducing sediment-related risks in the Vistula basin throughout the coming decades.
The practical implications are as follows:
- Priorities for soil protection and debris control measures in sub-basins with high LS and erodible soils.
- Strengthening summer risk management (intercropping, crop residue retention, contour farming, buffer strips) and planning for the maintenance of reservoirs/ditches in view of higher loads in the final decade.
Author Contributions
Conceptualization, R.W. and D.B.; methodology, D.B., R.W., A.K.-B. and J.K.; software, D.B.; validation, R.W. and D.B.; formal analysis, D.B., R.W., B.B. and J.K.; investigation, R.W.; resources, R.W. and B.B.; data curation, R.W. and A.K.-B.; writing—original draft preparation, D.B.; review and editing, R.W.; visualization, D.B.; supervision, R.W.; project administration, R.W. and B.B.; funding acquisition, B.B. All authors have read and agreed to the published version of the manuscript.
Funding
This research was funded by the Ministry of Agriculture and Rural Development of Poland, grants: IUNG-PIB DC 3.0. “Shaping soil retention as part of agricultural drought prevention and rational water management” and IUNG-PIB DC 2.1 “Protection of agriculturally used soils, including analytical support for implementation work related to the Directive of the European Parliament and of the Council on soil monitoring and soil resilience”.
Data Availability Statement
The data presented in this study are available upon request from the corresponding author due to source data ownership restrictions.
Conflicts of Interest
The authors declare no conflicts of interest.
Abbreviations
The following abbreviations are used in this manuscript:
| RCM | Regional Climate Model |
| RCP | Representative Concentration Pathway |
| SON | September, October, November |
| JJA | June, July, August |
| DJF | December, January, February |
| MAM | March, April, May |
| SYLD | Sediment Load [t ha−1 yr−1] |
| MUSLE | Modified Universal Soil Loss Equation |
| RUSLE | Revised Universal Soil Loss Equation |
References
- FAO. Soil Erosion: The Greatest Challenge to Sustainable Soil Management; FAO: Rome, Italy, 2019; p. 100. Available online: https://www.fao.org/3/ca4395en/ca4395en.pdf (accessed on 3 July 2025).
- FAO; ITPS. Status of the World’s Soil Resources (SWSR)—Main Report; Food and Agriculture Organization of the United Nations and Intergovernmental Technical Panel on Soils; FAO: Rome, Italy, 2015; p. 650. Available online: https://www.fao.org/3/i5199e/i5199e.pdf (accessed on 2 July 2025).
- Fischer, E.M.; Knutti, R. Observed heavy precipitation increase confirms theory and early models. Nat. Clim. Change 2016, 6, 986–991. [Google Scholar] [CrossRef]
- Borrelli, P.; Alewell, C.; Alvarez, P.; Anache, J.A.A.; Baartman, J.; Ballabio, C.; Bezak, N.; Biddoccu, M.; Cerdà, A.; Chalise, D.; et al. Soil Erosion Modelling: A Global Review and Statistical Analysis. Sci. Total Environ. 2021, 780, 146494. [Google Scholar] [CrossRef]
- Wischmeier, W.H.; Smith, D.D. Prediction Rainfall Erosion Losses from Cropland East of the Rocky Mountains: A Guide for Selection of Practices for Soil and Water Conservation. In Agricultural Handbook; Agricultural Research Service, US Department of Agriculture: Washington, DC, USA, 1965; Volume 282, pp. 1–47. [Google Scholar]
- Wischmeier, W.H.; Wischmeier, W.H.; Smith, D.D.; States, U.; Administration, S.E.; University, P.; Station, A.E. Predicting Rainfall Erosion Losses: A Guide to Conservation Planning; USDA: Washington, DC, USA, 1978; p. 58. Available online: https://handle.nal.usda.gov/10113/CAT79706928 (accessed on 1 July 2024).
- Renard, K.G.; Foster, G.R.; Weesies, G.A.; Mccool, D.K.; Yoder, D.C. Predicting Soil Erosion by Water: A Guide to Conservation Planning with the Revised Universal Soil Loss Equation (RUSLE); Agricultural Research Service, US Department of Agriculture: Washington, DC, USA, 1997.
- Williams, J.R.; Berndt, H.D. Sediment Yield Prediction Based on Watershed Hydrology. Trans. ASAE 1977, 20, 1100–1104. [Google Scholar] [CrossRef]
- Neitsch, S.L.; Arnold, J.G.; Kiniry, J.R.; Williams, J.R. Soil and Water Assessment Tool Theoretical Documentation; Version 2009; Texas A&M University: College Station, TX, USA, 2011; Available online: https://xueshu.baidu.com/usercenter/paper/show?paperid=13ffb51241a467670984c25be07234e6 (accessed on 5 July 2025).
- Sadeghi, S.H.; Gholami, L.; Darvishan, A.K.; Saeidi, P. A Review of the Application of the MUSLE Model Worldwide. Hydrol. Sci. J. 2014, 59, 365–375. [Google Scholar] [CrossRef]
- Józefaciuk, A.; Nowocień, E.; Wawer, R. Erozja gleb w polsce—skutki środowiskowe i gospodarcze, działania zaradcze. Monogr. I Rozpr. Nauk. IUNG-PIB 2014, 44, 264. [Google Scholar]
- Badora, D.; Wawer, R.; Król-Badziak, A.; Nieróbca, A.; Kozyra, J.; Jurga, B. Hydrological Balance in the Vistula Catchment under Future Climates. Water 2023, 15, 4168. [Google Scholar] [CrossRef]
- Brzezińska, M.; Szatten, D.; Babiński, Z. Prediction of Erosion-Prone Areas in the Catchments of Big Lowland Rivers: Implementation of Maximum Entropy Modelling—Using the Example of the Lower Vistula River (Poland). Remote Sens. 2021, 13, 4775. [Google Scholar] [CrossRef]
- Badora, D.; Wawer, R.; Nieróbca, A.; Król-Badziak, A.; Kozyra, J.; Jurga, B.; Nowocie’n, E. Simulating the Effects of Agricultural Adaptation Practices onto the Soil Water Content in Future Climate Using SWATModelonUpland Bystra River Catchment. Water 2022, 14, 2288. [Google Scholar] [CrossRef]
- Wawer, R. Digital Modelling of Grodarz Stream Watershed to Manage Water Erosion. Ph.D. Thesis, IUNG-PIB, Puławy, Poland, 2003; p. 230. [Google Scholar]
- Wawer, R.; Nowocień, E. Wind and water erosion in Poland. Erozja wodna i wietrzna w Polsce. Stud. Rap. IUNG-PIB Z. 2018, 58, 57–79. [Google Scholar]
- Panagos, P.; Borrelli, P.; Poesen, J.; Ballabio, C.; Lugato, E.; Meusburger, K.; Montanarella, L.; Alewell, C. The new assessment of soil loss by water erosion in Europe. Environ. Sci. Policy 2015, 54, 438–447. [Google Scholar] [CrossRef]
- Panagos, P.; Borrelli, P.; Meusburger, K. A New European Slope Length and Steepness Factor (LS-Factor) for Modeling Soil Erosion by Water. Geosciences 2015, 5, 117–126. [Google Scholar] [CrossRef]
- Panagos, P.; Meusburger, K.; Ballabio, C.; Borrelli, P.; Alewell, C. Soil erodibility in Europe: A high-resolution dataset based on LUCAS. Sci. Total Environ. 2014, 479–480, 189–200. [Google Scholar] [CrossRef]
- Badora, D.; Wawer, R. Evaluation of methods for determining the LS index at different resolutions for soil erosion modeling using the RUSLE method. Pol. J. Agron. 2023, 52, 110–122. Available online: https://journals.iung.pl/wydane/PJA52_12.pdf (accessed on 2 July 2025).
- Vautard, R.; Kadygrov, N.; Iles, C.; Boberg, F.; Buonomo, E.; Bülow, K.; Coppola, E.; Corre, L.; van Meijgaard, E.; Nogherotto, R.; et al. Evaluation of the Large EURO-CORDEX Regional Climate Model Ensemble. J. Geophys. Res. 2021, 126. [Google Scholar] [CrossRef]
- Szalińska, E.; Orlińska-Woźniak, P.; Wilk, P. Sediment load variability in response to climate and land use changes in a Carpathian catchment (Raba River, Poland). J. Soils Sediments 2020, 20, 2641–2652. [Google Scholar] [CrossRef]
- Orlińska-Woźniak, P.; Szalińska, W.; Wilk, P.; Jakusik, E.; Skalak, P.; Wypych, A.; Arnold, J. Assessment of sediment yield in a Carpathian catchment under climate and land-use change. Sci. Total Environ. 2020, 716, 137068. [Google Scholar]
- Dile, Y.; Srinivasan, R.; George, C. QSWAT3 Manual; Version 1.1; Texas A&M University: College Station, TX, USA, 2020; Available online: https://swat.tamu.edu/software/qswat/ (accessed on 4 July 2025).
- Abbaspour, K.C. SWAT-CUP: SWAT Calibration and Uncertainty Programs—User Manual; Eawag: Swiss Federal Institute of Aquatic Science and Technology: Zurich, Switzerland, 2015; Available online: https://swat.tamu.edu/ (accessed on 4 July 2024).
- Schmidt, J. (Ed.) Soil Erosion: Application of Physically Based Models; Springer: Berlin/Heidelberg, Germany, 2001; p. 340. [Google Scholar]
- Wawer, R.; Nowocien, E.; Podoslki, B. Real and Calculated KUSLE Erodibility Factor for Selected Polish Soils. Pol. J. Environ. Stud. 2005, 14, 655–658. [Google Scholar]
- Yang, W.; Andréasson, J.; Graham, L.P.; Olsson, J.; Rosberg, J.; Wetterhall, F. Distribution-based scaling to improve usability of RCM projections. Hydrol. Res. 2010, 41, 211–229. [Google Scholar] [CrossRef]
- Copernicus Climate Data Store (CDS): CORDEX Regional Climate Model Data on Single Levels. Available online: https://cds.climate.copernicus.eu/ (accessed on 5 July 2025).
- Jacob, D.; Petersen, J.; Eggert, B.; Alias, A.; Christensen, O.B.; Bouwer, L.M.; Braun, A.; Colette, A.; Deque, M.; Georgievski, G.; et al. EURO-CORDEX: New high-resolution climate change projections for European impact research. Reg. Environ. Change 2014, 14, 563–578. [Google Scholar] [CrossRef]
- Hennemuth, B.; Illy, T.; Jacob, D.; Keup-Thiel, E.; Katragkou, E.; Kotlarski, S.; Nikulin, G.; Otto, J.; Rechid, D.; Remke, T.; et al. Guidance for EURO-CORDEX Climate Projections Data Use; Version 1.0; EURO-CORDEX Community: Hamburg, Germany, 2017. [Google Scholar]
- Häggmark, L.; Ivarsson, K.I.; Gollvik, S.; Olofsson, P.O. MESAN—An operational mesoscale analysis system. Tellus A 2000, 52, 2–20. [Google Scholar] [CrossRef]
- Alewell, C.; Borrelli, P.; Meusburger, K.; Panagos, P. Using the USLE: Chances, challenges and limitations of soil erosion modelling. Int. Soil Water Conserv. Res. 2019, 7, 203–225. [Google Scholar] [CrossRef]
- Verheijen, F.G.A.; Jones, R.J.; Rickson, R.J.; Smith, C.J. Tolerable versus actual soil erosion rates in Europe. Earth-Sci. Rev. 2009, 94, 23–38. [Google Scholar] [CrossRef]
- Panagos, P.; Ballabio, C.; Himics, M.; Scarpa, S.; Matthews, F.; Bogonos, M.; Poesen, J.; Borrelli, P. Projections of soil loss by water erosion in Europe by 2050. Environ. Sci. Policy 2021, 124, 380–392. [Google Scholar] [CrossRef]
- Borrelli, P.; Robinson, D.A.; Panagos, P.; Ballabio, C.; Alewell, C.; Meusburger, K.; Modugno, S.; Schütt, B.; Ferro, V.; Bagarello, V.; et al. An assessment of the global impact of 21st century land use change on soil erosion. Nat. Commun. 2017, 8, 2013. [Google Scholar] [CrossRef]
- Nearing, M.A.; Pruski, F.F.; O’Neal, M.R. Expected climate change impacts on soil erosion rates: A review. J. Soil Water Conserv. 2004, 59, 43–50. [Google Scholar] [CrossRef]
- Nunes, J.P.; Jacinto, R.; Keizer, J.J.; Ferreira, A.J.D. Combining empirical rainfall–runoff–soil loss relationships with a spatially distributed hydrological model to predict the impacts of climate change on soil erosion in a Mediterranean catchment. J. Hydrol. 2013, 502, 239–252. [Google Scholar]
- Bosch, D.D.; Sheridan, J.M.; Davis, F.M. Climate change and watershed hydrology. Trans. ASABE 2010, 53, 85–94. [Google Scholar]
- Mullan, D. Soil erosion under future climate: Modelling the impact of precipitation and temperature changes in the UK and Europe. Catena 2013, 102, 73–86. [Google Scholar]
- Banasik, K.; Hejduk, L. Rainfall erosivity for East-Central Poland. Annals of Warsaw University of Life Sciences—SGGW. Land Reclam. 2012, 44, 67–77. [Google Scholar]
- Cerdan, O.; Govers, G.; Le Bissonnais, Y.; Van Oost, K.; Poesen, J.; Saby, N.; Gobin, A.; Vacca, A.; Quinton, J.; Auerswald, K.; et al. Rates and spatial variations of soil erosion in Europe: A study based on erosion plot data. Geomorphology 2010, 122, 167–177. [Google Scholar] [CrossRef]
- Kjellström, E.; Nikulin, G.; Strandberg, G.; Christensen, O.B.; Jacob, D.; Keuler, K.; Lenderink, G.; van Meijgaard, E.; Schär, C.; Somot, S.; et al. European climate change at global warming levels of 1.5 and 2 °C above preindustrial levels as simulated by the EURO-CORDEX regional climate models. Earth Syst. Dyn. 2018, 9, 459–478. [Google Scholar] [CrossRef]
- Beniston, M.; Farinotti, D.; Stoffel, M.; Andreassen, L.M.; Coppola, E.; Eckert, N.; Fantini, A.; Giacona, F.; Hauck, C.; Huss, M.; et al. The European mountain cryosphere: A review. Sci. Total Environ. 2018, 493, 1138–1151. [Google Scholar]
- Banasik, K.; Górski, D.; Popek, Z. Long-term sediment yield from a small agricultural catchment in Poland. Catena 2008, 73, 109–118. [Google Scholar]


Disclaimer/Publisher’s Note: The statements, opinions and data contained in all publications are solely those of the individual author(s) and contributor(s) and not of MDPI and/or the editor(s). MDPI and/or the editor(s) disclaim responsibility for any injury to people or property resulting from any ideas, methods, instructions or products referred to in the content. |
© 2026 by the authors. Licensee MDPI, Basel, Switzerland. This article is an open access article distributed under the terms and conditions of the Creative Commons Attribution (CC BY) license.