Abstract
Although blood transfusion eco-compensation—a metaphorical term in the Chinese eco-compensation literature referring to short-term direct compensation—can balance stakeholder interests in securing ecological flows (e-flows) in water-scarce rivers, it often fails to enhance the productivity of disadvantaged stakeholders or expand long-term development opportunities. To overcome this limitation, this study introduces hematopoiesis eco-compensation, a metaphorical term for capacity-building, longer-term development-oriented compensation that improves irrigation water-use efficiency and agricultural productivity through water-saving infrastructure upgrades, enhanced irrigation technologies, and technical training. Based on this distinction, we developed a hybrid eco-compensation mechanism integrating the two approaches using a cost–expenditure method and applied it to the mainstream section of the Weihe River and the Baojixia Yuanshang Irrigation District in Northwest China under typical hydrological conditions. The main findings are as follows: (1) Compensation standards for both approaches increase with higher ecological flow targets, with average values of 2762 CNY ha−1 and 1386 CNY ha−1, respectively. (2) The two approaches differ in terms of participants, standards, and implementation methods, yet they are complementary and indispensable under current conditions. (3) Hematopoiesis eco-compensation generates positive ecological and economic effects, increasing the annual value of riverine ecosystem services by approximately 126 million CNY and the annual economic benefits of the irrigation district by approximately 467 million CNY. This study provides a theoretical foundation and practical guidance for establishing long-term compensation mechanisms to maintain ecological flows in water-scarce regions.
1. Introduction
Historically, water resource managers prioritized economic development, particularly agricultural production, over sustaining e-flow requirements in rivers for ecosystems and human well-being [1,2]. This widespread neglect compromised aquatic ecosystem health, causing severe outcomes such as flow cessation and channel shrinkage, and significantly reduced the capacity of rivers to supply high-quality ecological products and services [3]. Addressing this degradation requires allocating more water to meet basic e-flow requirements in rivers; however, this essential measure intensifies the conflict between providing e-flow for rivers and agricultural water use [4]. As an economic tool for reconciling conflicting interests, eco-compensation has drawn extensive attention from domestic and international scholars [5]. Various mechanisms have been developed to achieve specific riverine conservation goals, such as water-quality protection and maintenance of e-flow in rivers [6,7]. Current research focuses mainly on blood transfusion compensation [8], which directly transfers funds or in-kind support to compensate for economic losses caused by ecological protection, mainly in the form of cash payments, material subsidies, and production inputs, emphasizing short-term livelihood security and cost reimbursement [9]. In Chinese eco-compensation literature, “blood transfusion eco-compensation” is a metaphor for short-term direct compensation, contrasted with longer-term capacity-building approaches discussed later. Existing studies indicate that although blood transfusion compensation can help reconcile the need to secure e-flow in rivers with economic development in water-scarce regions, it easily leads to dependency and does not enhance recipients’ production capacity or long-term benefit acquisition [10,11]. There is an urgent need to develop compensation mechanisms that simultaneously strengthen ecological protection and promote economic development while ensuring e-flow for rivers in water-scarce regions.
In recent years, research on compensation mechanisms for securing e-flow in rivers in water-scarce regions has increased [12,13,14]. These studies can be broadly divided into two categories. The first focuses on eco-compensation mechanisms based on the costs of maintaining e-flow in rivers. For instance, Pang et al. (2013, 2014) [10,15] developed a model to quantify compensation for provision of e-flow in rivers in the Yellow River Basin using crop-water production functions. They further analyzed the drawbacks of direct financial subsidies and emphasized the benefits of incentive-driven compensation for water conservation, arguing that monetary payments fail to stimulate regional endogenous motivation. Similarly, Cheng et al. (2018) [11] and Zhang et al. (2019) [16] constructed a compensation standard calculation method and an agricultural compensation framework for the Guanzhong section of the Weihe River mainstream. Their approach incorporated the unit value of agricultural water and the agricultural water deficit resulting from river e-flow maintenance. Beyond monetary payments, they also considered alternatives such as knowledge-based compensation and emphasized their potential benefits. The second category concerns compensation mechanisms based on the premium value associated with securing e-flow in rivers [17]. For example, Feng (2022) [18] integrated emergy analysis with the ecological footprint model to quantify the value of e-flow in rivers and its spillover effects. By introducing an eco-compensation coefficient and a cost-sharing coefficient, she established compensation standards and mechanisms for value spillovers, identifying government agencies and downstream beneficiaries as the principal parties involved. Both streams of literature concur that blood transfusion eco-compensation fails to address the root causes of socio-ecological conflicts. Instead, resolving these conflicts requires hematopoiesis compensation mechanisms grounded in professional skills and technical capacity building. Consequently, some scholars have studied the effects of hematopoiesis eco-compensation mechanisms [19]. Hematopoiesis eco-compensation enhances the self-development capacity of compensated regions or groups by fostering capacity building and improving development conditions, primarily through indirect measures such as technical training, industry support, employment provision, and project support, thereby promoting long-term coordination between ecological protection and economic development [20,21]. This concept aligns with development-oriented, capacity-building PES logic, emphasizing long-term capacity enhancement and conditional incentives to foster synergies between ecological conservation and livelihoods [22,23]. For instance, Li et al. (2024) [24] employed endogenous switching regression and Probit models to analyze the impacts of blood transfusion and hematopoiesis eco-compensation policies on household livelihoods and employment across different regions. Their findings reveal significant disparities in policy applicability among demographic groups in China. These studies have advanced the understanding of eco-compensation mechanisms that reconcile ecological conservation and economic development. They propose hematopoiesis eco-compensation approaches to enhance regional endogenous capacity [25,26] and have identified suitable target groups for such interventions [24]. Nevertheless, in water-scarce regions, quantitative modeling and systematic empirical research on hematopoiesis eco-compensation remain limited.
Based on the above issues, this study constructs a hybrid of blood transfusion and hematopoiesis eco-compensation mechanism to secure e-flow in rivers in water-scarce basins. This cost-based approach integrates identified pathways for enhancing the productivity of irrigation districts. We applied and validated the model to the Baoji section of the Weihe River—a typical water-scarce basin—by quantifying the hybrid eco-compensation standard for maintaining e-flow in rivers at the Linjiacun cross-section. Furthermore, we established the hybrid compensation framework and analyzed the ecological and economic effectiveness of its hematopoiesis component. The model provides a scientific basis for determining compensation criteria aimed at maintaining e-flow in rivers.
2. Research Methods
This study adopts a mixed ecological compensation mechanism that integrates hematopoiesis eco-compensation and blood transfusion eco-compensation. The primary methodological advantage of this approach lies in its ability to incorporate, within a unified analytical framework, both the agricultural water-use constraints induced by river e-flow protection and the functional pathways of different compensation modes. By doing so, it avoids imposing an a priori assumption of a single compensation form on farmers’ behavioral responses. In water-scarce regions dominated by smallholder agriculture and characterized by pronounced heterogeneity among farm households, this mixed-mechanism framework is conducive to a consistent analysis of the cost structures and allocation patterns associated with different compensation modes. It thus provides a solid methodological basis for the estimation of compensation standards and the comparative evaluation of alternative ecological compensation mechanisms. Building on prior research on hematopoiesis eco-compensation mechanisms [20,25,27], this study further conceptualizes the compensation mechanism for securing e-flow in rivers as a benefit regulation framework centered on fostering endogenous development capacity in affected regions. Through the implementation of multiple complementary strategies, the mechanism seeks to align river e-flow protection with socioeconomic development, thereby promoting the long-term and sustainable conservation of ecological flows. The essence of this hematopoiesis mechanism lies in its dual role: securing e-flow targets in rivers while simultaneously enhancing the productive capacity and income-generating opportunities of affected stakeholders.
Current research indicates that key approaches for synergistically enhancing e-flow security in rivers and socioeconomic development include hematopoiesis compensation measures such as modernizing water-saving infrastructure, building farmers’ multidisciplinary technical capacity, and facilitating industrial transformation through policy and project support [16,28]. Smallholder family farms dominate Chinese agriculture. Given that households with varying income sources and age structures exhibit distinct preferences for either blood transfusion or hematopoiesis compensation [24], both mechanisms are essential. This study therefore integrates these pathways to establish a hybrid agricultural compensation mechanism for sustaining e-flows in rivers, as shown in Figure 1.
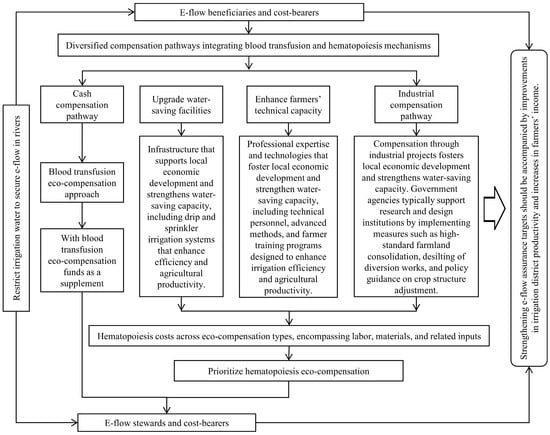
Figure 1.
A hybrid eco-compensation framework for protecting e-flows in rivers.
2.1. Analysis of the Scale of Water-Saving Measures Required to Secure e-Flow in Rivers
2.1.1. Agricultural Irrigation Deficits for Securing e-Flow in Rivers
The streamflow after diversion by hydraulic projects is defined as the remaining flow. The e-flow deficit is the difference between the remaining flow and the river’s e-flow requirement, as expressed in Equation (1). Agricultural irrigation deficits refer to the reduction in gross irrigation diversion at the canal head. Since multiple sectors typically withdraw water from a single diversion structure, agricultural irrigation deficits are calculated as the product of gross diverted irrigation water and the agricultural withdrawal proportion allocated at the diversion head, as shown in Equation (1).
where WAL denotes the agricultural water deficit under e-flow constraints, 108 m3; α denotes the agricultural water diversion ratio, dimensionless, defined as the ratio of agricultural diversion volume to the total diversion volume of all sectors; WL refers to the total water deficit required to meet the e-flow target, 108 m3; WR,i indicates the residual flow in the typical river on the i-th day after diversion, 108 m3; WEF,i represents the e-flow requirement for the i-th day, 108 m3.
2.1.2. Determination of the Scale of Water-Saving Measures Required to Meet e-Flow Requirements Under Different Assurance Targets
Research shows that agricultural water-saving irrigation is essential for securing e-flows in the water-scarce regions of Northwest China. This study classifies existing measures into three categories. Type 1 covers infrastructure management and optimization, which conserve water without introducing new sources or altering irrigation methods. Examples include land leveling in irrigation districts, enhancing soil or crop cover, and optimizing cropping patterns to reduce overall water demand. Type 2 covers upgraded water-saving technologies that rely solely on existing water sources. These measures alter irrigation methods without introducing additional supplies, such as adopting gated pipe irrigation or converting border irrigation to narrow or short borders. For subsequent calculations, they are grouped with Type 1. Type 3 involves advanced water-saving technologies that require both modified irrigation practices and supplementary water sources, including sprinkler and drip irrigation.
Principles for implementing agricultural water-saving irrigation measures: (1) Eliminate unnecessary water losses and ensure full implementation of Type 1 measures. (2) Select site-specific measures suited to local conditions and available resources, consistent with the characteristics of the study area. (3) Minimize the total cost across all categories of water-saving measures. (4) Restrict groundwater extraction within ecological thresholds. (5) Adjust irrigation strategies according to inflow variability in representative years.
This study quantifies the scale of water-saving measures by irrigated area. The scale is calculated as the ratio of total water savings to the water-saving irrigation quota. If Type 1 measures alone satisfy both the e-flow requirement and the initial agricultural diversion, their scale is given by Equation (2) S1. The initial diversion refers to irrigation withdrawals before accounting for the river’s e-flow requirements. If Type 1 measures are insufficient, the required area of Type 3 measures is determined by the ratio of the deficit—defined as the gap between the river’s e-flow requirement and the savings achieved by Type 1 measures—to the irrigation quota, as shown in Equation (2) S2.
where SWS denotes the total required area of all water-saving measures for securing e-flows in rivers, m2; S1 and S2 denote the required areas of Type 1 and Type 3 water-saving measures for e-flow assurance, m2; Si and Sj denote the areas of the i-th Type 1 and j-th Type 3 measures for e-flow assurance, m2; W1SW denotes the total water savings from Type 1 measures, 108 m3; WBS denotes the total water savings from Type 3 measures, 108 m3; ηi denotes the allocation coefficient of the i-th Type 1 measure, dimensionless, with measures selected in ascending order of cost; βj denotes the allocation coefficient of the j-th Type 3 measure, dimensionless, with measures also selected in ascending order of cost; WD,j denotes the irrigation quota for the j-th Type 3 measure, 108 m3; μi denotes the water-saving efficiency coefficient of the i-th Type 1 measure, dimensionless; ζ denotes the irrigation water-use efficiency coefficient, dimensionless; i and j denote the indices of the i-th Type 1 and j-th Type 3 measures, dimensionless; n and m denote the total numbers of Type 1 and Type 3 measures, respectively.
2.2. Costs of Hybrid Blood Transfusion and Hematopoiesis Compensation Under e-Flow Assurance in Rivers
2.2.1. Input Cost of Blood Transfusion Compensation
Agricultural losses due to river e-flow assurance are defined as blood transfusion compensation costs, calculated as the product of the irrigation water deficit under e-flow conditions, the effective marginal benefit of irrigation water, and the irrigation water-use efficiency. The marginal benefit is estimated using a modified Cobb–Douglas production function, which captures the marginal response of agricultural output to irrigation input and has demonstrated good fit and regional applicability in the Baojixia Irrigation District [29]. Accordingly, the blood transfusion compensation cost is computed as shown in Equation (3).
where LAL denotes the blood transfusion compensation cost for maintaining e-flow in rivers, 108 CNY; v denotes the marginal economic benefit of agricultural irrigation water, CNY per m3; Ao denotes a constant term, dimensionless; t denotes the time variable in the long-term series, years; λ denotes the technological progress coefficient, dimensionless; I denotes other agricultural production input costs, 108 CNY; W denotes the total agricultural irrigation water use, 108 m3; Y denotes the total agricultural output value in the study area, 108 CNY; ρ and γ denote the elasticities of other input costs and agricultural irrigation water use with respect to output value, respectively, dimensionless.
2.2.2. Investment Cost of Hematopoiesis Compensation
In this study, the investment cost of hematopoiesis compensation is defined as the cost of water-saving measures that satisfy both the e-flow requirements for rivers and agricultural irrigation water demand. The calculation procedure is given below.
The investment cost of water-saving measures to maintain e-flow in rivers includes expenditures on improving or constructing agricultural water-saving irrigation infrastructure. These cover new construction, rehabilitation, and dredging of diversion projects, as calculated using Equation (4).
where CTS denotes the total investment cost of water-saving measures, labor, technology, and energy consumption, 108 CNY; C1 refers to the investment cost of Type 1 water-saving measures, 108 CNY; C2 refers to the cost of implementing Type 3 water-saving measures, 108 CNY; C0 denotes other costs, 108 CNY.
The investment cost of Type 1 water-saving measures includes material expenses, management fees, labor costs, and energy consumption. Labor cost is defined as the product of labor quantity, working hours, and the market wage of each type of personnel, as expressed in Equation (5).
where CMT denotes the cost of materials, 108 CNY; CE represents the energy cost of water-saving measures, in 108 CNY; NL is the number of laborers required to implement measures to secure e-flow in rivers, persons; t is the implementation period of e-flow measures, days; f denotes the market wage of laborers, CNY per day; Ne and Np are the numbers of experts and technical staff, respectively, persons; te and tp are their respective working durations, days per year; ce and cp denote the daily remuneration of experts and technical staff, respectively, CNY per day.
Type 3 water-saving measures, in addition to the costs included in Type 1, also require groundwater use fees. These fees are generally calculated as the product of usage duration and the unit cost per time unit, and the cost is determined using Equation (6).
where cj denotes the unit material cost of Type 3 water-saving measures, CNY per ha; Sj represents the additional area of Type 3 water-saving measures, ha; CM denotes the management and maintenance cost of Type 3 water-saving measures, 108 CNY; CL represents the labor cost, including experts, technical staff, and construction workers, calculated using Equation (6), 108 CNY; j is the j-th Type 3 water-saving measure, dimensionless; m is the total number of Type 3 water-saving measures, dimensionless; p denotes the unit water resource use fee per hour, CNY per h, which is typically set at 2 CNY per h in northwestern China based on survey data.
2.3. Compensation Standards for Hybrid Blood Transfusion and Hematopoiesis Approaches to Secure e-Flow in Rivers
Blood transfusion and hematopoiesis compensation costs are defined as the amounts required to secure e-flow in rivers [10,16]. The standards for these two approaches are expressed as the ratios of eco-compensation volumes under different e-flow assurance targets for rivers to the corresponding water deficits and water-saving volumes, respectively. The calculation method is shown in Equation (7). For international comparability, monetary values involved in the above calculations are converted from Chinese yuan (CNY) to U.S. dollars (USD) using the exchange-rate formula USD = CNY/ER, where ER denotes the USD–CNY exchange rate.
where fc denotes the eco-compensation standard corresponding to different levels of e-flow assurance for rivers, CNY per m3; fCT and fCH represent the blood transfusion and hematopoiesis compensation standards, respectively, CNY per m3; SCT is the area of loss caused by e-flow assurance, m3; CTS,max denotes the maximum hematopoiesis investment cost for e-flow assurance, 108 CNY.
3. Case Study
3.1. Study Area
The Weihe River, the largest tributary of the Yellow River Basin, originates from Niaoshu Mountain in Gansu Province and flows through parts of Gansu and Shaanxi [11]. It enters Shaanxi at Baoji City and joins the Yellow River at Tongguan in Weinan. The Baoji section of the Weihe River includes most administrative areas of Baoji and Xianyang. This reach lies between the Linjiacun and Weijiapu sections, as shown in Figure 2.
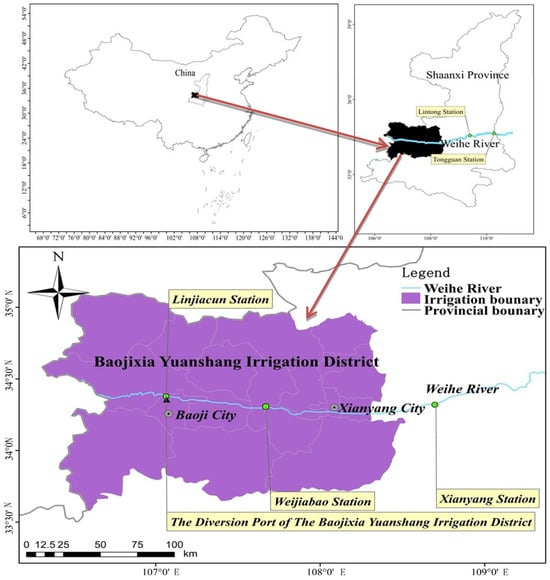
Figure 2.
Location of the Baoji section of the Weihe River and Baojixia Yuanshang Irrigation District (BYID) [11].
The Baoji section of the Weihe River, a typical water-scarce river in Northwest China, faces severe water shortages. Total water resources are limited, with most allocated to irrigation and a smaller share allocated to domestic use. Near the Linjiacun hydrological station, the Linjiacun Diversion Dam diverts water to the Baojixia Yuanshang Irrigation District on the plateau. Agricultural use consumes 60–90% of the river runoff, yet crop river ecological water demand remains unmet. This overextraction severely reduces e-flow and drives continuous ecological degradation, leading to irreversible impacts such as flow interruption and channel shrinkage [3]. The irrigation district relies primarily on canal systems, which have low water-use efficiency [30]. Combined with high agricultural withdrawals, this inefficiency has intensified the conflict between agricultural water use and e-flow. Since 2016, authorities have provided cash payments to affected sectors through a blood transfusion compensation approach. However, this form of compensation does not improve production capacity or stimulate the intrinsic motivation of stakeholders, as it lacks a hematopoiesis component. As a result, it limits the coordination of ecological protection and economic development in the Baoji section of the Weihe River. Conversely, applying only a hematopoiesis standard fails to generate sufficient incentives for participation. Therefore, a long-term hybrid compensation mechanism that integrates blood transfusion and hematopoiesis elements is urgently needed to secure e-flow, promote ecological–economic synergy, and strengthen stakeholder engagement in the Baoji section.
3.2. e-Flow Target at the Linjiacun Section of the Weihe River
Methods for calculating e-flow are generally classified into four categories: hydrological, hydraulic, habitat simulation, and holistic approaches [31]. These methods have been applied to the Linjiacun section in the Weihe River. Xu et al. (2016) [32] combined multiple techniques and identified 6 m3/s as a long-term e-flow target. Using the wetted perimeter method and R2CROSS, they further determined 12 m3/s as the flow required to sustain fish populations. More recently, Cheng and Li (2023) [33] integrated objectives of water quality improvement, biodiversity protection, and sediment–water balance with a hydraulic model to develop an e-flow method, yielding a recommended flow of 5.66 m3/s.
From the perspective of coordinated ecological protection and economic development, the Shaanxi Provincial Government proposed 5 m3/s as the e-flow for the Linjiacun section in the Weihe River [34]. In 2018, the provincial government and an expert panel in Xi’an discussed the feasibility of higher targets of 8 and 10 m3/s and introduced additional intermediate values of 6, 8, 10, and 12 m3/s [35]. Based on these considerations, this study adopts 5, 5.66, 6, 7, 8, 9, 10, 11, and 12 m3/s as alternative e-flow targets for the Linjiacun section of the Weihe River mainstream.
3.3. Data Sources
The data used in this study were primarily sourced from the Hydrological Yearbook of the People’s Republic of China, Volume IV: Hydrological Data of the Yellow River Basin, Book 7—Jing–Luo–Wei Region (Weihe River System) (a paper version that has been publicly released) [36], Shaanxi Statistical Yearbook [37], Shaanxi Provincial Regional Statistical Yearbook (a paper version that has been publicly released) [38], Shaanxi Water Resources Statistical Yearbook [39], Water Resources Bulletin of Shaanxi Province [40], High-Standard Farmland Construction Plan of Shaanxi Province (2021–2030) [41], and Sustainable Land Management in China’s Irrigated Areas [42].
4. Results and Discussion
4.1. Scale of Water-Saving Measures Required Under Different e-Flow Assurance Targets in Rivers
4.1.1. Agricultural Water Deficit Under Different e-Flow Assurance Targets for Rivers
Using long-term runoff records (1965–2023) from the Linjiacun hydrological station and frequency analysis software, we identified three representative years: a normal water year (50% exceedance probability), a dry water year (75% exceedance probability), and an extremely dry water year (90% exceedance probability). Agricultural irrigation in the Baojixia Yuanshang Irrigation District accounts for about 48.1% of total water diversion, according to the Shaanxi Water Resources Statistical Yearbook. Based on Equation (1) and different e-flow targets, we estimated the agricultural water deficit for these three representative years at the Linjiacun station of the Weihe River. The results are shown in Table 1.

Table 1.
Agricultural water deficit under different e-flow assurance targets in rivers.
4.1.2. Demand for Water-Saving Measures in Representative Years Under Different e-Flow Assurance Targets
The Baojixia Yuanshang Irrigation District currently adopts water-saving practices such as plastic film mulching, land leveling, and canal dredging [43,44,45]. Studies in demonstration areas of the district have evaluated these measures and their combined effects. Plastic film mulching reduced winter wheat water consumption by 10–20% [46,47]. Land leveling decreased irrigation water use by about 20% [48]. Canal dredging enhanced channel conveyance capacity and reduced irrigation demand by 10% [49]. Compared with flood irrigation, sprinkler irrigation saved 30–40% of water [50], as shown in Table 2. Several scholars have examined the combined effects of water-saving measures [44,51]. For example, Yang et al. (2011) [52] reported that engineering measures such as land leveling and furrow length optimization, combined with sprinkler irrigation, increased the irrigation water use coefficient in the Guanzhong Irrigation District from about 0.50 to above 0.78, while also raising crop yields by 10–30%. The Agricultural Water-Saving Action Plan of Baoji City during the 14th Five-Year Plan (2022) indicated that combining canal dredging [53], plastic film mulching, and land leveling could reduce water use in the Baojixia Yuanshang Irrigation District by 30–40% [54], as shown in Table 2.
Table 2.
Water-saving coefficients of different measures and demonstration sites in the Baojixia Yuanshang irrigation district.
Building on the above findings, this study applied the cumulative effects of Type 1 water-saving measures to estimate total savings. Because Type 1 measures are mandatory, we determined the required scale of additional interventions using Equation (2). Specifically, we combined the agricultural water deficit under e-flow targets with the shortfall remaining after Type 1 savings and then applied the water-saving coefficients of Type 2 measures to quantify their required scale. The results are presented in Figure 3.
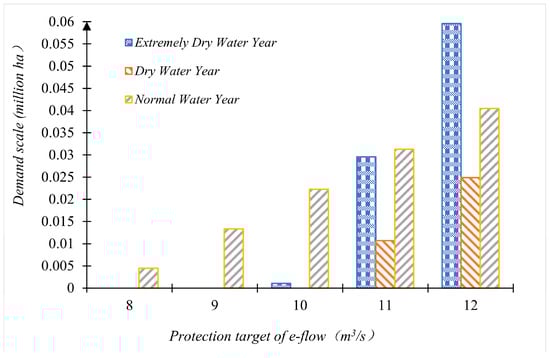
Figure 3.
Water-saving scale demand for different e-flow protection targets in various representative years.
Figure 3 shows that in dry and extremely dry representative years, higher diversion volumes combined with the improved efficiency of Type 1 water-saving measures allow the Baojixia Yuanshang Irrigation District to meet e-flow targets up to 10 m3/s without additional sprinkler facilities. In normal water years, no extra sprinkler facilities are needed until the target reaches 8 m3/s. After implementing Type 1 measures, the e-flow target at the Linjiacun section of the Baoji reach of the Weihe River can be increased to 10 m3/s.
4.2. Costs of Hematopoiesis Water-Saving Measures and Associated Labor
Based on the classification of water-saving measures—land leveling, mulching, canal dredging, and sprinkler irrigation—we estimated the costs of Type 1 and Type 2 measures, together with their supporting materials, as detailed below.
4.2.1. Cost of Type 1 Water-Saving Measures
At present, land leveling and plastic film mulching cover only about 20% of the irrigated area (56,667 ha) supplied by the Weihe River, leaving roughly 45,333 ha still requiring these water-saving measures. Land leveling depends on manual labor and mechanized tillage. Typically, one agricultural tiller operated by two workers is used. Fuel costs for plowing 0.67 ha are about 360 CNY, and a single machine can level up to 5.33 ha per day. Labor costs are 150 CNY per person per day. Plastic film mulching, the dominant form of soil cover, reduces irrigation demand while enhancing yields. According to the Shaanxi Statistical Yearbook, each mu requires about 3 kg of plastic film, with a market price of 20 CNY per kg.
Canal dredging reduces agricultural water diversion and supports e-flow, but it requires intensive labor. The Baojixia Plateau Irrigation District covers farmland in eight counties under Baoji and Xianyang. Each county includes about 9~13 administrative towns. Assuming one fixed canal management station per town, with 10 workers assigned (five permanent staff and five seasonal workers during the 3-month irrigation period), the labor requirement is substantial. At the current wage of about 3600 CNY per worker per month, the total labor cost is estimated at 25.92 million CNY.
Efficient water conservation through land leveling, mulching, and canal dredging requires professional staff to deliver technical consultation and training to farmers. These specialists must be recruited and compensated at prevailing market wages. The Baojixia Plateau Irrigation District spans farmland in eight counties across Baoji and Xianyang. Assuming one consultation and training center per county, each staffed with 24 professionals, every technician would oversee one township and work year-round. At the current wage of about 6000 CNY per month per person, the annual personnel cost is estimated at 6.91 million CNY.
4.2.2. Cost of Type 2 Water-Saving Measures
According to the Shaanxi Water Resources Bulletin over the past decade, the Baojixia Yuanshang Irrigation District has an exploitable groundwater reserve of 54 million m3 remaining after accounting for current extraction. Using this groundwater to support additional mobile sprinkler irrigation can help meet part of the e-flow requirement in rivers at the Linjiacun section of the mainstem of the Weihe River in Baoji. In representative normal, dry, and extremely dry water years, the irrigation quotas for mobile sprinklers are 900, 1200, and 1500 m3 per ha, respectively. The costs of mobile sprinkler irrigation include materials, labor, operation, management, and energy costs. Market surveys show a unit cost of 3375~4500 CNY per ha in the Baojixia Yuanshang Irrigation District. Adopting the median value of 3750 CNY per ha and assuming a service life of 10 years yields an annual cost of 375 CNY per ha per year.
By combining the scale requirements of water-saving measures identified in Section 2.1.2 with their associated costs, we estimated the expense of achieving different e-flow targets for the Linjiacun section of the mainstem of the Weihe River in Baoji under representative years. The results are presented in Figure 4.
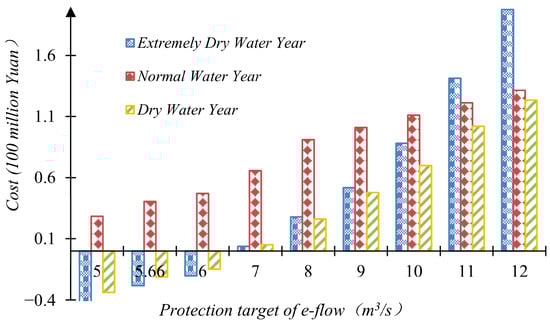
Figure 4.
The cost of various water-saving measures for ensuring e-flow during different representative years.
In dry and extremely dry water years, irrigation withdrawals are high. Under these conditions, water savings from Category 1 measures can meet the e-flow targets at the Linjiacun section up to 11 and 10 m3/s, respectively. Any surplus can be allocated to domestic water supply, generating economic benefits. The net cost equals the water-saving cost minus these benefits; a negative value indicates a net economic gain and no need for compensation. The results are presented in Figure 4.
4.3. Cost of Restricting Agricultural Irrigation to Ensure e-Flow
Cheng et al. (2021) [28] and Gao et al. (2018) [29] applied an improved production function method to estimate the marginal benefit of agricultural water use in the Baojixia Yuanshang Irrigation District from 2000 to 2015. Using Equation (3) and the agricultural water deficits associated with different e-flow targets at the Linjiacun section of the Weihe River (Table 1), they calculated the costs of restricting agricultural irrigation to secure e-flow under representative normal, dry, and extremely dry water years. The results are shown in Figure 5.
Figure 5.
The cost for limiting agricultural water use to ensure e-flow in rivers.
Figure 5 shows that the cost of securing e-flow at the Linjiacun section of the Weihe River rises with higher flow targets. The cost peaks in representative extremely dry water years, averaging 172 million CNY, and is lowest in representative normal water years, averaging 144 million CNY.
4.4. Hybrid Compensation Criteria Across Representative Years Under Varying e-Flow Targets
The compensation standard for securing e-flow in rivers is defined as the ratio of compensation volume to the corresponding affected area (or water-saving area). Based on the compensation volumes and affected (or water-saving) areas shown in Figure 4 and Figure 5, we calculated hematopoiesis and blood transfusion eco-compensation standards for different e-flow targets across representative years. The results are shown in Figure 6A,B.
Figure 6.
Compensation standard for losses of water-saving measures and limiting agricultural water use for ensuring e-flow: (A) hematopoietic compensation standard; (B) blood transfusion compensation standard.
As shown in Figure 6A,B, for a given representative year, the blood transfusion eco-compensation standard increases with higher e-flow targets. The standard reaches its maximum in extremely dry water years (201.96 CNY per m3) and its minimum in normal water years (180.65 CNY per m3). The hematopoiesis compensation standard follows the same trend. In dry and extremely dry water years, no compensation is required at targets of 5, 5.66, and 6 m3/s. This outcome reflects the role of improved water-use efficiency and water-rights conversion in generating alternative benefits that offset losses. For example, at the 5 m3/s target, reallocating irrigation water to domestic supply produces 109 million CNY, which not only compensates for the loss but also yields an additional 34 million CNY of net benefit. In contrast, compensation is needed for these same targets in normal water years. The key reason is that irrigation withdrawals in dry and extremely dry water years are nearly twice those in normal water years, providing greater water-saving potential and reducing the need for compensation.
In the same representative year and under identical e-flow targets, hematopoiesis compensation requires lower volumes and unit standards than the blood transfusion approach. For example, in an extremely dry water year with a target of 12 m3/s, the hematopoiesis mechanism requires 198 million CNY and 304.06 CNY per m3, compared with 269 million CNY and 316.47 CNY per m3 for the blood transfusion mechanism. By lowering compensation needs, hybrid compensation reduces the financial burden of river ecosystem protection and helps mitigate the persistent funding gap for ecological conservation.
4.5. Complex Relationships Between Blood Transfusion and Hematopoiesis Eco-Compensation Mechanisms
4.5.1. Differences Between Blood Transfusion and Hematopoiesis Eco-Compensation Mechanisms
The blood transfusion eco-compensation mechanism for e-flow in rivers assurance is commonly carried out by higher-level and local government agencies, which serve as the compensating entities, while the recipients are farmers in irrigation districts affected by reduced water supply. Compensation is most often provided in cash to offset income losses from reduced grain yields resulting from water reallocation to assure e-flow in rivers. As shown in Figure 5 and Figure 6B, government agencies determine compensation volumes and standards and directly disburse payments to the affected farmers.
The hematopoiesis eco-compensation mechanism is typically organized by higher-level and local government agencies together with domestic water users. The recipients include providers of water-saving facilities (e.g., sprinkler irrigation systems, mulching materials), experts who offer technical guidance and farmer training, and laborers engaged in canal dredging and land leveling. Compensation usually takes the form of technical support, project-based funding, or in-kind assistance, with compensation volumes and standards illustrated in Figure 4 and Figure 6A. In representative years, the structure of this mechanism shifts with e-flow targets. For instance, in a dry water year with a target of 6 m3/s, domestic water users act as the compensating entities, and the recipients are mainly laborers, experts, and mulching material suppliers. When the target rises to 10 m3/s, government agencies assume the role of compensating entities, and all of the above groups are included as recipients. Even under the same target, the mechanism differs across representative years; for example, in normal and dry water years, both the actors involved and the compensation standards show clear variation.
Therefore, the eco-compensating entities, recipients, forms of compensation, and the compensation volume and standards differ noticeably between the blood transfusion and hematopoiesis mechanisms for e-flow assurance in rivers. These differences result in substantial divergence between the two approaches. In addition, the structure of the hematopoiesis eco-compensation mechanism changes considerably with runoff conditions and e-flow targets.
4.5.2. Connections Between Blood Transfusion and Hematopoiesis Eco-Compensation Mechanisms
China’s agricultural sector is dominated by household-based smallholder farming [55,56]. Household income sources and demographic structures vary widely, shaping different preferences for blood transfusion and hematopoiesis eco-compensation. Families with stable off-farm employment and income tend to prefer blood transfusion eco-compensation, whereas those relying primarily on agricultural production and possessing sufficient labor force are more inclined toward hematopoiesis eco-compensation [57]. The Baojixia Yuanshang Irrigation District on the loess tableland reflects this household-centered smallholder economy. Marked differences in income sources and demographic composition across households mean that neither a purely blood transfusion nor a solely hematopoiesis mechanism can meet the diverse compensation needs in the region. Instead, a hybrid eco-compensation approach that integrates both mechanisms is essential; without either component, the regional compensation system would remain incomplete.
In the Baojixia Yuanshang Irrigation District on the loess tableland, some households engage in off-farm employment and cannot manage farming, while others lack the labor needed for agricultural production. Supported by national and local policies and facilitated by the benefits of land transfer [58], such as those outlined in the Opinions of the CPC Central Committee and the State Council on Advancing Key Tasks for Rural Revitalization in 2023 [59], large-scale land transfers have emerged, consolidating fragmented plots into larger fields. Land transfers now account for over 60% of the cultivated area, and the proportion continues to rise (Research Report On Rural Revitalization Of Shaanxi (a paper version that has been publicly released)) [60]. This shift promotes the adoption of water-saving practices, and households managing consolidated fields tend to prefer hematopoiesis eco-compensation mechanisms [24]. However, some households, particularly those with aging members and limited labor, still rely on blood transfusion eco-compensation [24,61]. Therefore, the regional compensation system should prioritize hematopoiesis mechanisms while retaining blood transfusion measures as a supplementary component.
Therefore, in the Baojixia Yuanshang Irrigation District, and more broadly within China’s smallholder-based agricultural systems, blood transfusion and hematopoiesis eco-compensation mechanisms, while differing in function, are both indispensable. Rather than representing opposing approaches, they operate as complementary components. A framework that gives primacy to hematopoiesis eco-compensation mechanisms and integrates blood transfusion eco-compensation mechanisms provides a stable and durable foundation for riverine ecological conservation.
4.6. Ecological and Economic Effects of Hematopoiesis Eco-Compensation Under e-Flow Assurance
This study uses the value of riverine ecological products as the ecological indicator for evaluating the hematopoiesis eco-compensation effects of e-flow assurance in rivers. The value was quantified using the equivalent factor method [14]. The economic indicator of hematopoiesis eco-compensation under e-flow assurance in rivers is defined as the sum of the incremental grain yield value, calculated as the product of yield increase and grain price, and the water rights trading value, derived from reallocating water saved through reduced irrigation withdrawals to municipal supply. In the Baojixia Yuanshang Irrigation District, land leveling increases grain yield by 5~15%, plastic film mulching by 10~30%, and sprinkler irrigation by up to 30% [44,62]. The combined application of land leveling, canal desilting, and mulching raises yield by 20~30%, with an average increase of 25% (Implementation Plan for Gradually Upgrading All Permanent Basic Farmland to High-Standard Farmland in Shaanxi Province (2023–2035)) [63]. The resulting ecological and economic effects of hematopoiesis eco-compensation under e-flow assurance in rivers are shown in Figure 7A,B.
Figure 7.
Ecological and economic effects of hematopoiesis eco-compensation for e-flow protection in rivers: (A) ecological effects under different e-flow targets; (B) economic effects under different e-flow targets.
At the ecological level, hematopoiesis eco-compensation can raise the e-flow target from 5 m3/s to 12 m3/s, increasing the value of riverine ecological products by 126 million CNY and bringing the total to 498 million CNY. The ecological gains are derived from several mechanisms: higher discharge enhances longitudinal connectivity, delivers nutrients to riparian vegetation, and improves water purification capacity [64]; sustains water–sediment dynamics and reduces flood risk by preventing channel morphological changes [65]; meets habitat requirements of aquatic organisms and supports biodiversity [2]; and improves living environments and river landscapes, thereby strengthening urban identity and attracting investment and tourism [66].
At the economic level, the effects of hematopoiesis eco-compensation display a characteristic “decline–rebound” trajectory. In representative normal water years, net benefits decline modestly until the e-flow reaches 8 m3/s (minimum 399 million CNY), after which they rise steadily to nearly 700 million CNY. In dry water years, net benefits fall to a trough of 395 million CNY before 11 m3/s, then rebound to 484 million CNY beyond this threshold. In extremely dry water years, they decrease before 10 m3/s but subsequently recover to 500 million CNY. These dynamics demonstrate that the hematopoiesis eco-compensation enhances irrigation productivity in the Baojixia Yuanshang Irrigation District and increases household income. For instance, under an e-flow target of 12 m3/s, investments of 131, 123, and 198 million CNY in normal, dry, and extremely dry water years yield returns of 686, 485, and 490 million CNY, respectively.
In summary, the hematopoiesis eco-compensation mechanism improved the security of e-flow and associated ecological functions at the Linjiacun section of the Weihe River mainstream, while also enhancing agricultural productivity in the Baojixia Yuanshang Irrigation District and increasing farmers’ economic returns.
4.7. Analysis and Discussion of Model Results
Current studies propose various mechanisms to compensate for e-flow deficits or associated value spillovers; however, most adopt a blood transfusion eco-compensation. These mechanisms can mitigate the escalating conflict between e-flow conservation and economic development in the water-scarce regions of Northwest China, but they do little to enhance irrigation productivity or increase farmers’ incomes. To overcome this limitation, several scholars have advanced the concept of hematopoiesis eco-compensation. However, existing research remains largely qualitative or confined to preliminary conceptual frameworks, and studies explicitly addressing hematopoiesis eco-compensation mechanisms for e-flow provision are still absent. This lack of theoretical foundation continues to constrain practical application.
Drawing on the key issues in the irrigation district and the concept of hematopoiesis compensation, this study proposes three hematopoiesis compensation pathways. On this basis, we develop a hybrid compensation mechanism—integrating blood transfusion and hematopoiesis approaches—using a cost-based method to secure e-flow in water-scarce regions. This framework not only fills the research gap left by the absence of hematopoiesis mechanisms directly addressing e-flow provision but also moves the study of such mechanisms beyond qualitative discussion and preliminary conceptualization to quantitative analysis and calculation. The advantages of the hybrid eco-compensation mechanism are reflected in four aspects.
(1) The hybrid eco-compensation mechanism accommodates the heterogeneous preferences of smallholder households for compensation modes, with households having non-agricultural stable incomes tending to favor blood transfusion eco-compensation, while labor-rich agricultural households prefer hematopoiesis eco-compensation. This approach effectively overcomes the limitation of previous studies that focus on a single compensation method.
(2) The hybrid mechanism reduces the financial requirements for securing river ecological flows. Blood transfusion eco-compensation typically demands substantial funding; for example, under a high-flow year with a target ecological flow of 12 m3/s, the cost of blood transfusion eco-compensation reaches 224 million CNY, whereas hematopoiesis eco-compensation requires only 131 million CNY, a reduction of nearly 50%. Compared with relying solely on blood transfusion eco-compensation, the hybrid approach achieves ecological protection and economic development at lower cost while avoiding crop losses and food security risks.
(3) The hybrid mechanism increases household income and employment opportunities. Hematopoiesis eco-compensation can generate an additional 467 million CNY for affected households in the Baoji Gorge Plateau irrigation area. Long-term engagement of local farmers in canal management and the implementation of water-saving measures improves residents’ production skills and irrigation water-use efficiency, addressing the limited attention to long-term household income and skill development in previous studies.
(4) The hybrid mechanism improves compensation equity. More than 60% of households in the irrigation district are smallholders, with substantial disparities in inputs and outputs. Blood transfusion eco-compensation, calculated based on crop losses per unit area, lacks household-level resolution and cannot meet differentiated needs. In contrast, hematopoiesis eco-compensation, targeting individuals who provide labor, expertise, and infrastructure, effectively mitigates inequities arising from differences in input and output.
5. Conclusions
Building on the definition and identified pathways of hematopoiesis compensation, this study employed a cost-based method to construct a hybrid eco-compensation mechanism for securing e-flow in rivers. Using the Baoji section of the mainstem of the Weihe River and the Baojixia Plateau Irrigation District as case studies, the main findings are as follows: (1) The unit compensation standards for both blood transfusion and hematopoiesis mechanisms rise with increasing e-flow targets, averaging 2762 CNY per ha and 1386 CNY per ha, respectively. (2) The two mechanisms differ in compensation actors, standards, and modalities, yet both are indispensable and mutually reinforcing. (3) Hematopoiesis compensation increased the value of riverine ecological products by 126 million CNY and generated greater economic benefits, averaging 467 million CNY. (4) The model structure and results were analyzed in depth to evaluate robustness and applicability.
Author Contributions
Conceptualization, B.C.; Methodology, B.C.; Investigation, Q.D.; Resources, B.C. and H.L.; Data Curation, Q.D., W.C. and Q.L.; Writing—Original Draft Preparation, B.C. and Q.D.; Writing—Review and Editing, B.C. and H.L.; Visualization, Q.D., W.C., Q.L. and Y.S.; Supervision, B.C. and H.L.; Funding Acquisition, B.C. All authors have read and agreed to the published version of the manuscript.
Funding
This research was supported by the National Natural Science Foundation of China (Grant No. 52309033).
Data Availability Statement
The original contributions presented in this study are included in the article. Further inquiries can be directed to the corresponding authors.
Acknowledgments
We are so grateful to the editors and the anonymous reviewers for their insightful comments and suggestions.
Conflicts of Interest
The authors declare no conflicts of interest.
References
- Poff, N.L.; Richter, B.D.; Arthington, A.H.; Bunn, S.E.; Naiman, R.J.; Kendy, E.; Acreman, M.; Apse, C.; Bledsoe, B.P.; Freeman, M.C. The Ecological Limits of Hydrologic Alteration (ELOHA): A New Framework for Developing Regional Environmental Flow Standards. Freshw. Biol. 2010, 55, 147–170. [Google Scholar] [CrossRef]
- McCabe, C.L.; Matthaei, C.D.; Tonkin, J.D. The Ecological Benefits of More Room for Rivers. Nat. Water 2025, 3, 260–270. [Google Scholar] [CrossRef]
- Papadaki, C.; Mitropoulos, P.; Panagopoulos, Y.; Dimitriou, E. Addressing Large Scale Patterns of No-Flow Events in Rivers: An in-Depth Analysis with Achelous Software. J. Hydrol. 2024, 645, 132160. [Google Scholar] [CrossRef]
- Acreman, M. Environmental Flows—Basics for Novices. WIREs Water 2016, 3, 622–628. [Google Scholar] [CrossRef]
- Ezzine-de-Blas, D.; Wunder, S.; Ruiz-Pérez, M.; Moreno-Sanchez, R.D.P. Global Patterns in the Implementation of Payments for Environmental Services. PLoS ONE 2016, 11, e0149847. [Google Scholar] [CrossRef]
- Bennett, D.E.; Gosnell, H.; Lurie, S.; Duncan, S. Utility Engagement with Payments for Watershed Services in the United States. Ecosyst. Serv. 2014, 8, 56–64. [Google Scholar] [CrossRef]
- Bellver-Domingo, A.; Hernández-Sancho, F.; Molinos-Senante, M. A Review of Payment for Ecosystem Services for the Economic Internalization of Environmental Externalities: A Water Perspective. Geoforum 2016, 70, 115–118. [Google Scholar] [CrossRef]
- Pan, X.L.; Xu, L.Y.; Yang, Z.F.; Yu, B. Payments for Ecosystem Services in China: Policy, Practice, and Progress. J. Clean. Prod. 2017, 158, 200–208. [Google Scholar] [CrossRef]
- Gao, W.J.; Shi, X.S. Research on the Development and Revolution of Social Mentality in the Period of Reform and Opening-up. Dev. Res. 2015, 39, 10–14. [Google Scholar]
- Pang, A.P.; Sun, T.; Yang, Z.F. Economic Compensation Standard for Irrigation Processes to Safeguard Environmental Flows in the Yellow River Estuary, China. J. Hydrol. 2013, 482, 129–138. [Google Scholar] [CrossRef]
- Cheng, B.; Li, H.E. Agricultural Economic Losses Caused by Protection of the Ecological Basic Flow of Rivers. J. Hydrol. 2018, 564, 68–75. [Google Scholar] [CrossRef]
- Qureshi, M.E.; Schwabe, K.; Connor, J.; Kirby, M. Environmental Water Incentive Policy and Return Flows. Water Resour. Res. 2010, 46, 2008WR007445. [Google Scholar] [CrossRef]
- Sisto, N.P. Environmental Flows for Rivers and Economic Compensation for Irrigators. J. Environ. Manag. 2009, 90, 1236–1240. [Google Scholar] [CrossRef]
- Cheng, B.; Li, H.E.; Cheng, W.J.; Li, J.K. Fund Allocation Modeling of Compensation Subjects for Various Protection Levels of the Ecological Flow in Rivers under Runoff Variations. J. Environ. Manag. 2024, 370, 122690. [Google Scholar] [CrossRef]
- Pang, A.P.; Sun, T. Bayesian Networks for Environmental Flow Decision-Making and an Application in the Yellow River Estuary, China. Hydrol. Earth Syst. Sci. 2014, 18, 1641–1651. [Google Scholar] [CrossRef]
- Zhang, Q.; Li, H.E.; Gao, Z.Y.; Cheng, B.; Jia, B.K.; Dang, F. Study on Agricultural Compensation Mechanism Based on River Flow Protection for Basic Ecological Demand in Irrigation District—Baoji Section of the Weihe River as an Example. Agric. Res. Arid. Area 2019, 37, 51–57. [Google Scholar]
- Zhou, Z.X.; Sun, X.R.; Zhang, X.T.; Wang, Y. Inter-Regional Ecological Compensation in the Yellow River Basin Based on the Value of Ecosystem Services. J. Environ. Manag. 2022, 322, 116073. [Google Scholar] [CrossRef] [PubMed]
- Feng, Y.X. Research on Ecological Compensation Standard Based on Overflow Value of River Ecological Base Flow Major: Hydrology and Water Resources. Master’s Thesis, Xi’an University of Technology, Xi’an, China, 2022. Available online: https://link.cnki.net/doi/10.27398/d.cnki.gxalu.2022.001436 (accessed on 7 October 2025).
- Wen, Q.; Fang, J.; Li, X.; Su, F. Impact of Ecological Compensation on Farmers’ Livelihood Strategies in Energy Development Regions in China: A Case Study of Yulin City. Land 2022, 11, 965. [Google Scholar] [CrossRef]
- Le, T.-A.T.; Vodden, K.; Wu, J.; Bullock, R.; Sabau, G. Payments for Ecosystem Services Programs: A Global Review of Contributions towards Sustainability. Heliyon 2024, 10, e22361. [Google Scholar] [CrossRef] [PubMed]
- Schomers, S.; Matzdorf, B. Payments for Ecosystem Services: A Review and Comparison of Developing and Industrialized Countries. Ecosyst. Serv. 2013, 6, 16–30. [Google Scholar] [CrossRef]
- Hejnowicz, A.P.; Raffaelli, D.G.; Rudd, M.A.; White, P.C.L. Evaluating the Outcomes of Payments for Ecosystem Services Programmes Using a Capital Asset Framework. Ecosyst. Serv. 2014, 9, 83–97. [Google Scholar] [CrossRef]
- Brownson, K.; Guinessey, E.; Carranza, M.; Esquivel, M.; Hesselbach, H.; Ramirez, L.M.; Villa, L. Community-Based Payments for Ecosystem Services (CB-PES): Implications of Community Involvement for Program Outcomes. Ecosyst. Serv. 2019, 39, 100974. [Google Scholar] [CrossRef]
- Li, T.; Zhang, X.H.; Jin, C. Effects of Ecological Compensation Policy Differences on Farmers’ Employment and Income. China Land Sci. 2024, 38, 38–47. [Google Scholar]
- Muradian, R.; Corbera, E.; Pascual, U.; Kosoy, N.; May, P.H. Reconciling Theory and Practice: An Alternative Conceptual Framework for Understanding Payments for Environmental Services. Ecol. Econ. 2010, 69, 1202–1208. [Google Scholar] [CrossRef]
- Clements, T.; John, A.; Nielsen, K.; An, D.; Tan, S.; Milner-Gulland, E.J. Payments for Biodiversity Conservation in the Context of Weak Institutions: Comparison of Three Programs from Cambodia. Ecol. Econ. 2010, 69, 1283–1291. [Google Scholar] [CrossRef]
- Li, X.H.; Wang, Y.Z.; Yang, R.J.; Zhang, L.; Zhang, Y.; Liu, Q.; Song, Z.W. From “Blood Transfusion” to “Hematopoiesis”: Watershed Eco-Compensation in China. Environ. Sci. Pollut. Res. 2022, 29, 49583–49597. [Google Scholar] [CrossRef] [PubMed]
- Cheng, B.; Li, H.E. Improving Water Saving Measures Is the Necessary Way to Protect the Ecological Base Flow of Rivers in Water Shortage Areas of Northwest China. Ecol. Indic. 2021, 123, 107347. [Google Scholar] [CrossRef]
- Gao, Z.; Li, H.; Zhang, Q.; Cheng, B.; Jia, B.; Tian, R. Analysis of Irrigation Benefit of Baoji Gorge Irrigation District Using Ridge Regression of CD Production Function. Agric. Res. Arid. Areas 2018, 36, 39–46. [Google Scholar]
- Perry, C. Accounting for Water Use: Terminology and Implications for Saving Water and Increasing Production. Agric. Water Manag. 2011, 98, 1840–1846. [Google Scholar] [CrossRef]
- Chen, A.; Sui, X.; Liao, W.; Chen, K. Review Study on Instream Ecological Base Flow in China. J. China Inst. Water Resour. Hydropower Res. 2016, 14, 401–411. [Google Scholar]
- Xu, Z.X.; Wu, W.; Yu, S.Y. Ecological Baseflow: Progress and Challenge. Shuili Fadian Xuebao/J. Hydroelectr. Eng. 2016, 35, 1–11. [Google Scholar]
- Cheng, B.; Li, H.E. Determination of River Ecological Base Flow Based on the Coupling Relationship of Sediment–Water Quality–Biodiversity in Water Shortage Area of Northwest China. Sustainability 2023, 15, 13431. [Google Scholar] [CrossRef]
- Shaanxi Provincial Development and Reform Commission, China. Reply to Proposal No. 173 at the Second Session of the 12th Shaanxi Provincial People’s Congress. 2014. Available online: https://sndrc.shaanxi.gov.cn/zfxxgk/fdzdgknr/jytablqk/2014nrddbjy/202305/t20230524_3132812.html (accessed on 7 October 2025).
- Shaanxi Provincial Department of Water Resources, China. Reply to Proposal No. 375 at the Second Session of the 12th Shaanxi Provincial Committee of the Chinese People’s Political Consultative Conference (CPPCC). 2019. Available online: https://slt.shaanxi.gov.cn/zfxxgk/fdzdgknr/jyta/201911/t20191108_2008277.html (accessed on 7 October 2025).
- Bureau of Hydrology, Ministry of Water Resources of the People’s Republic of China. Annual Hydrological Report, P.R. China: Volume IV, Hydrological Data of Yellow River Basin, Book 7 (Jing, Luo, Wei Region: Weihe River Basin) (1965–2023); Bureau of Hydrology: Beijing, China, 2023. [Google Scholar]
- Shaanxi Provincial Bureau of Statistics; Shaanxi Survey Team, National Bureau of Statistics of China. Shaanxi Statistical Yearbook (2000–2024). Available online: https://tjj.shaanxi.gov.cn/tjsj/ndsj/tjnj/ (accessed on 7 October 2025).
- Shaanxi Provincial Bureau of Statistics. Shaanxi Regional Statistical Yearbook (2000–2023); China Statistics Press: Beijing, China, 2023. [Google Scholar]
- Shaanxi Provincial Department of Water Resources. Water Statistical Yearbook of Shaanxi (2000–2022). Available online: https://slt.shaanxi.gov.cn/zfxxgk/fdzdgknr/tjxx/ (accessed on 7 October 2025).
- Shaanxi Provincial Department of Water Resources, China. Water Resources Bulletin (2013–2023). Available online: https://slt.shaanxi.gov.cn/zfxxgk/fdzdgknr/zdgz/szygb/ (accessed on 7 October 2025).
- Shaanxi Provincial Department of Agriculture and Rural Affairs, China. High-Standard Farmland Construction Plan of Shaanxi Province (2021–2030). Available online: https://nynct.shaanxi.gov.cn/xxgk/gknr/zc/twj/202212/t20221202_2756689.html (accessed on 7 October 2025).
- Ministry of Justice of the People’s Republic of China. Sustainable Land Management in China’s Irrigated Areas. 2021. Available online: https://www.moj.gov.cn/pub/sfbgw/flfggz/flfggzxzfg/202107/t20210731_433018.html (accessed on 7 October 2025).
- Ma, D.D.; Chen, L.; Qu, H.C.; Wang, Y.L.; Misselbrook, T.; Jiang, R. Impacts of Plastic Film Mulching on Crop Yields, Soil Water, Nitrate, and Organic Carbon in Northwestern China: A Meta-Analysis. Agric. Water Manag. 2018, 202, 166–173. [Google Scholar] [CrossRef]
- Gao, J.; Zhuo, L.; Duan, X.M.; Wu, P.T. Agricultural Water-Saving Potentials with Water Footprint Benchmarking under Different Tillage Practices for Crop Production in an Irrigation District. Agric. Water Manag. 2023, 282, 108274. [Google Scholar] [CrossRef]
- Li, S.Z.; Fan, T.L.; Zhao, H.; Li, C.D.; Zhao, G.B.; Zhao, G.; Dang, Y.; Wang, L.; Zhang, J.J.; Tang, X.M.; et al. Effects of Different Plastic Film Mulching Cultivation Models on Yield, Water Use Efficiency and Quality of Maize. Acta Pratacult. Sin. 2020, 29, 182. [Google Scholar] [CrossRef]
- Liu, Z.H.; Zhao, C.X.; Zhang, P.; Jia, Z.K. Long-Term Effects of Plastic Mulching on Soil Structure, Organic Carbon and Yield of Rainfed Maize. Agric. Water Manag. 2023, 287, 108447. [Google Scholar] [CrossRef]
- Li, X.; Zhang, Y.; Wang, Z. Effects of plastic mulching on soil water conservation and crop yield in arid regions. Agric. Water Manag. 2021, 255, 107382. [Google Scholar]
- Kang, Y.C.; Gao, J.; Shao, H.; Zhang, Y.Y.; Li, J.; Gao, Z. Evaluating the Flow and Sediment Effects of Gully Land Consolidation on the Loess Plateau, China. J. Hydrol. 2021, 600, 126535. [Google Scholar] [CrossRef]
- Wang, H.J. Agricultural Soil and Water Engineering Research Field: Efficient Utilization of Soil and Water Resources. Ph.D. Thesis, Northwest Agriculture and Forestry University, Xianyang, China, 2017. [Google Scholar]
- Zhang, T.; Tan, Q.; Zhang, T.Y.; He, L.J.; Yu, X.N.; Zhang, S. A Multi-Objective Optimization Decision-Making Methodology for Fostering Synergies in the Water-Energy-Food Nexus. J. Clean. Prod. 2024, 479, 144051. [Google Scholar] [CrossRef]
- Wen, Y.Q.; Shang, S.H.; Yang, J. Optimization of Irrigation Scheduling for Spring Wheat with Mulching and Limited Irrigation Water in an Arid Climate. Agric. Water Manag. 2017, 192, 33–44. [Google Scholar] [CrossRef]
- Yang, H.Y.; Liu, H.J.; Wang, H.X. Study on Water-Saving Modes at Field Scale in the Guanzhong Irrigation Area of Shaanxi Province. Water Sav. Irrig. 2011, 11, 1–4+8. [Google Scholar]
- People’s Government of Baoji City, China. 14th Five-Year Plan Action Plan for Agricultural Water Conservation of Baoji City. Available online: http://www.baoji.gov.cn/col9816/col17241/col9826/col9988/202211/t20221107_794292.html (accessed on 7 October 2025).
- Chai, X.D. Analysis of Construction Measures for Continued Construction of Supporting Facilities and Water Saving. Value Eng. 2025, 44, 34–36. [Google Scholar]
- Deng, O.P.; Ran, J.; Huang, S.; Duan, J.K.; Reis, S.; Zhang, J.B.; Zhu, Y.G.; Xu, J.M.; Gu, B.J. Managing Fragmented Croplands for Environmental and Economic Benefits in China. Nat. Food 2024, 5, 230–240. [Google Scholar] [CrossRef] [PubMed]
- Xu, X.B.; Zhao, Q.R.; Guo, J.B.; Li, C.; Li, J.; Niu, K.Y.; Jin, S.Q.; Fu, C.; Gaffney, P.P.J.; Xu, Y.; et al. Inequality in Agricultural Greenhouse Gas Emissions Intensity Has Risen in Rural China from 1993 to 2020. Nat. Food 2024, 5, 916–928. [Google Scholar] [CrossRef]
- Xu, J.; Zhang, Z.F. The Effect of Family Off-Farm Work on Farmers’ Participation in Farmland Transfer. China Land Sci. 2020, 34, 99–107. [Google Scholar]
- Ji, X.Y.; Wang, Y.T.; Yang, L.; Li, C.; Chen, L.D. The Impact of Cropland Transfer on Rural Household Income in China: The Moderating Effects of Education. Land Use Policy 2025, 148, 107399. [Google Scholar] [CrossRef]
- Central People’s Government of the People’s Republic of China. Opinions of the Central Committee of the Communist Party of China and the State Council on Doing a Good Job in Key Work for Comprehensively Promoting Rural Revitalization in 2023. 2023. Available online: https://www.gov.cn/zhengce/2023-02/13/content_5741370.htm (accessed on 7 October 2025).
- Shaanxi Academy of Social Sciences. Research Report on Rural Revitalization of Shaanxi; Social Sciences Academic Press (SSAP): Beijing, China, 2023. [Google Scholar]
- Ren, C.C.; Zhou, X.Y.; Wang, C.; Guo, Y.L.; Diao, Y.; Shen, S.S.; Reis, S.; Li, W.Y.; Xu, J.M.; Gu, B.J. Ageing Threatens Sustainability of Smallholder Farming in China. Nature 2023, 616, 96–103. [Google Scholar] [CrossRef]
- Huang, T.; Wu, Q.; Yuan, Y.; Zhang, X.; Sun, R.; Hao, R.; Yang, X.; Li, C.; Qin, X.; Song, F.; et al. Effects of Plastic Film Mulching on Yield, Water Use Efficiency, and Nitrogen Use Efficiency of Different Crops in China: A Meta-Analysis. Field Crops Res. 2024, 312, 109407. [Google Scholar] [CrossRef]
- Department of Agriculture and Rural Affairs of Shaanxi Province, China. Implementation Plan for Gradually Upgrading All Permanent Basic Farmland to High-Standard Farmland in Shaanxi Province (2023–2035). Available online: https://nynct.shaanxi.gov.cn/xxgk/gknr/zc/qtwj/202405/t20240528_2755685.html (accessed on 7 October 2025).
- He, F.Z.; Zarfl, C.; Tockner, K.; Olden, J.D.; Campos, Z.; Muniz, F.; Svenning, J.-C.; Jähnig, S.C. Hydropower Impacts on Riverine Biodiversity. Nat. Rev. Earth Environ. 2024, 5, 755–772. [Google Scholar] [CrossRef]
- Yue, S.Y.; Li, H.E.; Cheng, B. Variation of Economic Value Produced by Environmental Flow in Water-Scarce Basins of Northwest China. J. Water Clim. Change 2021, 12, 955–968. [Google Scholar] [CrossRef]
- Guimarães, L.F.; Teixeira, F.C.; Pereira, J.N.; Becker, B.R.; Oliveira, A.K.B.; Lima, A.F.; Veról, A.P.; Miguez, M.G. The Challenges of Urban River Restoration and the Proposition of a Framework towards River Restoration Goals. J. Clean. Prod. 2021, 316, 128330. [Google Scholar] [CrossRef]
Disclaimer/Publisher’s Note: The statements, opinions and data contained in all publications are solely those of the individual author(s) and contributor(s) and not of MDPI and/or the editor(s). MDPI and/or the editor(s) disclaim responsibility for any injury to people or property resulting from any ideas, methods, instructions or products referred to in the content. |
© 2026 by the authors. Licensee MDPI, Basel, Switzerland. This article is an open access article distributed under the terms and conditions of the Creative Commons Attribution (CC BY) license.