Abstract
The intensification of extreme rainfall events under changing climate regimes has heightened concerns over nutrient losses from paddy agriculture, particularly nitrogen (N), a primary contributor to non-point source pollution. Despite advances in drainage management, limited studies have integrated probabilistic rainfall modeling with N transport simulation to evaluate mitigation strategies in rice-based systems. This study addresses this critical gap by coupling the Log-Pearson Type III (LP-III) distribution with the DRAINMOD-N II model to simulate N dynamics under varying rainfall exceedance probabilities and drainage design configurations in the Kunshan region of eastern China. The DRAINMOD-N II showed good performance, with R2 values of 0.70 and 0.69, AAD of 0.05 and 0.39 mg L−1, and RMSE of 0.14 and 0.91 mg L−1 for NO3−-N and NH4+-N during calibration, and R2 values of 0.88 and 0.72, AAD of 0.06 and 0.21 mg L−1, and RMSE of 0.10 and 0.34 mg L−1 during validation. Using around 50 years of historical precipitation data, we developed intensity–duration–frequency (IDF) curves via LP-III to derive return-period rainfall scenarios (2%, 5%, 10%, and 20%). These scenarios were then input into a validated DRAINMOD-N II model to assess nitrate-nitrogen (NO3−-N) and ammonium-nitrogen (NH4+-N) losses across multiple drain spacing (1000–2000 cm) and depth (80–120 cm) treatments. Results demonstrated that NO3−-N and NH4+-N losses increase with rainfall intensity, with up to 57.9% and 45.1% greater leaching, respectively, under 2% exceedance events compared to 20%. However, wider drain spacing substantially mitigated N losses, reducing NO3−-N and NH4+-N loads by up to 18% and 12%, respectively, across extreme rainfall scenarios. The integrated framework developed in this study highlights the efficacy of drainage design optimization in reducing nutrient losses while maintaining hydrological resilience under extreme weather conditions.
1. Introduction
Rice (Oryza sativa L.) serves as the world’s most significant nutritional crops and feeding nearly half of the global population. In the next three decades, overall global consumption is expected to increase by another 116 million tons [1]. Rice is regarded as the utmost significant food crop in China, cultivated on almost 30 million hectares of land [2]. In the interest of increasing food demand to fulfil the expanding population, rice cultivation must be increase by up to 70% by 2050 [3]. However, rice productivity in China is constrained by labour shortages and environmental degradation [4,5]. Rice cultivation, however, is water-intensive, typically requiring two to three times more water than upland cereals such as wheat or maize [6]. While rice is adapted to flooded conditions, inadequate drainage particularly during rainy season leads to prolonged waterlogging, which could disrupt root oxygen supply, weakens nutrient uptake, and reduces crop productivity [7]. Excess soil water also enhances nitrogen (N) losses through leaching and runoff, lowering fertilizer use efficiency and contributing to non-point source pollution [8]. Consequently, proper crop management, specifically improving drainage and drainage design, is therefore essential to reach the potential for high rice yields [9].
Many studies around the world have found that managing drainage is more effective than irrigation for sustainable agriculture [10]. Drainage also directly decreases waterlogging stress by swiftly eliminating excess water, improving soil aeration and providing oxygen to roots, thus preventing root suffocation and enhancing soil permeability. In poorly drained soils, even daily rainfall of 3–5 cm can significantly delay crop growth [11]. Study on the Yangtze River basin revealed that subsurface drainage treatments lowered groundwater levels, improved soil moisture conditions and increased rice yields by 8.0% and 6.0% compared with surface drainage controls [12].
Beyond yield, non-point source pollution from farms has also become a subject of increasing concern [13], due to increasing awareness of environmental protection and its harmful impact [14]. Pollutants including pesticides and fertilizers lost in agricultural drainage have emerged as crucial elements of non-point source pollution, according to pertinent studies [15]. In addition, the loss of phosphorus and N elements in drainage discharge has become an essential cause of eutrophication of water bodies [16]. Traditional drainage in paddy fields releases high N levels into water bodies. Controlled irrigation can reduce N runoff by 20–30%, while drainage structures cut flow and nitrate loads by 25–48% [17].
Intensity–duration–frequency (IDF) relationships, which link rainfall intensity, duration, and return period, are widely used to quantify extremes and assess climate impacts. Several probability distributions Gumbel, Generalised Extreme Value, Pearson Type III and Log-Pearson Type III are used in IDF analyses [18]. The selection of a specific distribution is context-dependent and influenced by factors such as regional climate characteristics, rainfall aggregation scale, data availability, and study objectives [19]. In this study, the LP-III distribution was adopted to generate rainfall exceedance scenarios for coupling with an agricultural drainage and N transport model (DRAINMOD-N II), an application for which such integrations remain relatively rare. Furthermore, field-scale models offer tools for evaluating water and nutrient transport and designing drainage systems. Major models include CREAMS, GLEAMS, LEACHM, RZWQM, EPIC, DRAINMOD, the Soil and Water Assessment Tool (SWAT) and the Model for Urban Stormwater Improvement Conceptualization (MUSICX). DRAINMOD-N II has been widely applied globally; when properly calibrated, it can provide accurate predictions, and it remains one of the few field-scale models capable of coupling hydrologic and N dynamics using detailed drainage design parameters [20].
It is crucial to consider extreme precipitation when evaluating drainage and pollution control. Precipitation is the main factor influencing drainage flow and the movement of non-point source pollutants. Hydrologic risk and nutrient loss both increase with rainfall intensity [21]. Climate change is projected to increase the frequency and intensity of heavy rainfall in rice-producing regions, simultaneously raising flood risk and the potential for nutrient export to surface and subsurface water bodies [22,23,24]. Recent studies have shown that climate change introduces non-stationarity in extreme rainfall characteristics, leading to shifts in rainfall intensity distributions and increased uncertainty in hydrologic design and drainage system performance [25]. Such climate-driven changes, together with land-use and urbanization effects, may influence runoff generation, nutrient transport, and N leaching processes, underscoring the need to interpret drainage and pollution control results within a changing climatic context [26]. However, most studies evaluate water-table control and nutrient mitigation separately [17] and few studies combine probabilistic extreme-rainfall characterization with mechanistic N transport models to evaluate how drainage design (drain spacing and depth) modulates both flood risk and N export in rice–wheat rotation systems [27]. Despite advances in drainage and nutrient transport modeling, N losses from rice-based systems under extreme rainfall remain poorly quantified. Although IDF analysis is widely used to characterize rainfall extremes, its integration with field-scale mechanistic N transport models for paddy systems is limited. Here, we address this gap by coupling probabilistic extreme-rainfall characterization with a process-based drainage and nitrogen model to quantify how rainfall exceedance probabilities interact with drain spacing and depth to regulate nitrate and ammonium losses.
This study uniquely combines around 50 years of historical rainfall data with the LP-III distribution to generate rainfall exceedance probabilities (LP-III distribution, validated by prior study [28]; as the most suitable method for modeling extreme rainfall). These probabilistic rainfall inputs were then integrated into DRAINMOD-N II to simulate extreme-rainfall scenarios and assess N losses under different drainage designs. This study aims; (1) to calibrate and validate DRAINMOD-N II for simulating N dynamics, (2) quantify how drain spacing (1000, 1500, 2000 cm) and drain depth (80, 100, 120 cm) influence nitrate (NO3−-N) and ammonium (NH4+-N) losses under varying hydrological conditions; and (3) to optimize drainage design as a strategy to mitigate the impact of rainfall variability on nitrogen dynamics for rice cultivation. By addressing gaps in extreme-rainfall modelling, drainage design and pollution reduction, this research provides supporting sustainable rice production, reducing fertilizer losses and mitigating N-driven water pollution. By optimizing drainage design for extreme rainfall conditions, the proposed framework contributes to climate-resilient agricultural management and the protection of downstream aquatic ecosystems. Figure 1 presents the methodological framework of the study.
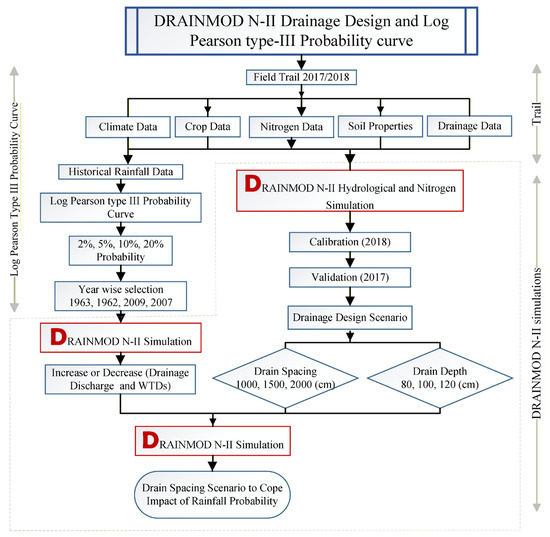
Figure 1.
Integrated Simulation Framework of Nitrogen Dynamics Using Log Pearson Type III Rainfall probability and DRAINMOD-N II.
2. Materials and Methods
2.1. Overview of the Research Area
The field experiment was carried out at the Kunshan Experimental Research Station, affiliated with the State Key Laboratory of Hydrology-Water Resources and Hydraulic Engineering, Hohai University, China as shown in Figure 2. The study period extended from June to October in both 2017 and 2018. The study area is located in the Taihu Basin plain, a low-lying region characterized by a dense water network and a subtropical monsoon climate. The region has an average annual temperature of 15.5 °C, annual precipitation of 1097.1 mm, and annual evaporation of 1365.9 mm. The average annual sunshine duration is approximately 2085.9 h, and the mean relative humidity is 83%. The dominant cropping system is a rice–wheat rotation. The soil in the experimental plots is classified as dark-yellow hydromorphic paddy soil with a heavy loam texture. The bulk density of the 0–30 cm soil layer was measured at 1.30 g cm−3. Soil chemical properties included an organic matter content of 30.3 g kg−1, total N of 1.79 g kg−1, total phosphorus of 1.40 g kg−1, and total potassium of 20.86 g kg−1. The saturated soil moisture content was recorded as 52.0% at 0–20 cm depth, 50.1% at 20–30 cm, and 47.9% at 30–40 cm. These agroecological and hydrological conditions provided a representative setting for simulating N dynamics and evaluating the performance of drainage design strategies under monsoon-influenced climatic conditions.
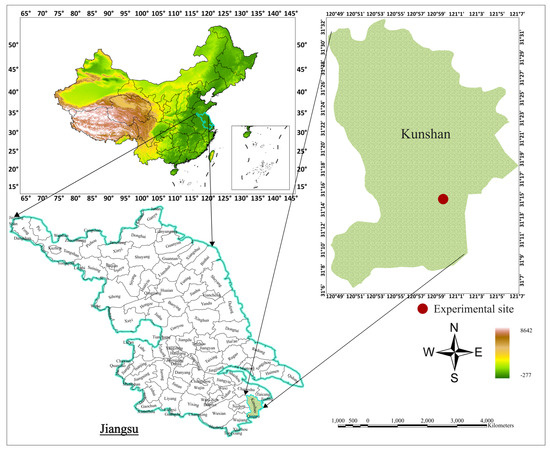
Figure 2.
Study area map mentioning Kunshan Experimental site.
2.2. Experiment Details
The experiment was carried out on six standard impermeable plots at the Kunshan experimental research station. Each plot covered 150 m2 (10 m × 15 m) and was surrounded by an impermeable concrete wall that was coated from inside. Figure 3 presents the experimental plot layout, designed to replicate the actual field conditions. The gap (ridge width) between the two experimental plots was 40 cm. The 1–3 test plot’s subsurface drainage pipes were arranged perpendicular to the drainage. The subsurface drain depth from the soil surface was 60 cm below the field surface. An observation well was installed near the drain on one side, and at the surface drainage outlet, a drainage box, flow meter, and water level gauge were set up along with an underground water level monitoring device. For test plots 4–6, drainage pipes (60 cm from the field surface) were installed parallel to the drainage outlet. Simulating side seepage near the drainage, drainage boxes, flow meters, and water level gauges were set up at the surface drainage outlet. Drainage D1 for plots 1, 2, 3, and D6 for plots 4, 5, 6 (with partitions in D6, not connected to each other) have flow meters and water level gauges set up at their respective drainage outlets.
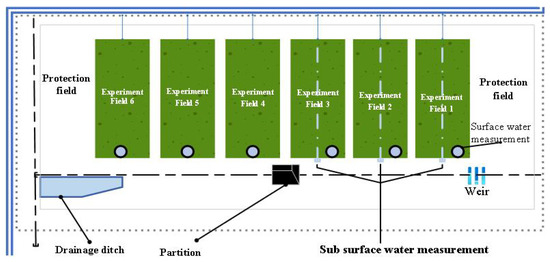
Figure 3.
Field design indicating important elements of the experimental research plots.
2.3. Design and Layout of Controlled Drainage (CD)
To improve the anti-clogging performance of the subsurface drainage system, an inverted filter structure was constructed around the drainage pipes. The filter was composed of sequential layers of large stones, medium-sized stones, crushed melon seed gravel, and plain soil, arranged from the pipe outward, as illustrated in Figure 4a. This configuration was designed to enhance sediment filtration and maintain pipe permeability throughout the experimental period. In plots 1, 2, and 3, vertical drainage pipes were installed according to the layout shown in Figure 4b. A drainage control system was incorporated at the external face of the anti-seepage wall enclosing each pipe. This system consisted of multiple tee-joint pipes installed at incremental heights. An underground observation pipe was positioned adjacent to the drainage pipe to monitor water table fluctuations within the rice field. Drainage control was achieved by selectively opening or closing the outlets of the tee-joint system. This allowed for precise regulation of the drainage height, enabling discharge at five fixed levels: 10 cm, 20 cm, 30 cm, 40 cm, and 50 cm below the field surface. Figure 5 shows the weir installed in the experimental field, serving as the drainage outlet for CD strategies.
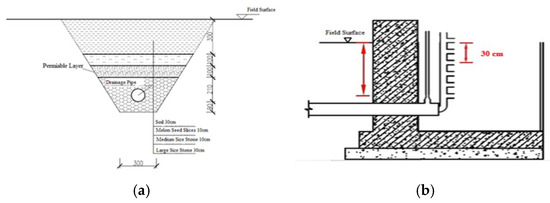
Figure 4.
(a) Improvement of CD design (b) Structure of the CD.
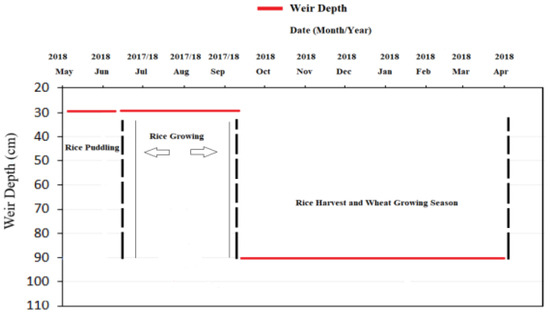
Figure 5.
Drainage outlet for controlled drainage strategies.
2.4. Meteorological Data 2017/18
The meteorological data from July to September 2017/18 included daily rainfall, temperature (maximum (Tmax) and minimum temperature (Tmin)). A measurement of the irrigation depth (mm day−1) was made. Using the Thornthwaite method, potential evapotranspiration (PET) was determined. Table 1 contains irrigation schedule and root depth across rice growth stages.

Table 1.
Soil moisture in the root zone of rice control irrigation.
2.5. Nitrogen Water Sample Collection and Analysis Method
The nitrogen (N) analysis in this study focused on quantifying concentrations and losses of nitrate-nitrogen (NO3−-N) and ammonium-nitrogen (NH4+-N) in the drainage outflow. Water samples were collected at regular intervals from the drainage outlets of each plot. NH4+-N concentrations were determined directly using the indophenol blue spectrophotometric method, without any extraction step. UV spectrophotometry was used to measure the amounts of NO3−-N. Based on its unique absorption properties, the concentration of NO3−-N was computed by measuring the absorbance of UV light flowing through the water sample. The total N loss through drainage was estimated using the following equation:
where
- L is the N loss in drainage, kg·ha−1;
- Di+1 is the displacement of the sampling interval from the ith to the i + 1, mm;
- Ci+1 is the N mass concentration of the i + 1 sample, mg L−1.
2.6. Paddy Field Fertilization Management
The farmer’s habitual fertilization scheme was adopted, and the fertilization time and N application amount are shown in Table 2.
Table 2.
Nitrogen application time and amount of fertilizer.
2.7. DRAINMOD-N II Description
DRAINMOD-N II (Version 6.1.105) is a one-dimensional, deterministic hydrologic model developed by Wayne Skaggs at North Carolina State University in the 1980s. The model is designed to simulate the hydrological behaviour of artificially drained agricultural lands, particularly those with shallow water tables. DRAINMOD calculates water table dynamics, infiltration, drainage, surface runoff, and evapotranspiration based on a daily water balance applied to a representative soil profile midway between two drains. It requires input data related to soil properties, climatic variables, and crop parameters. The model is especially effective in low-permeability soils where subsurface drainage is a key management concern. For subsurface flow computations, DRAINMOD applies the steady-state Hooghoudt equation to estimate daily water table depths across varying drain spacings. These simulations serve as the hydrological foundation for the N transport module, DRAINMOD-N II, which integrates N cycling processes with water movement.
Data for DRAINMOD-N II Parameterization (Nitrogen Simulation)
The DRAINMOD-N II model was parameterized and calibrated using field-monitored water quality and drainage data collected in 2018. The model was calibrated using the daily concentrations and monthly losses of NH4+-N and NO3−-N from drainage outflow. Optimizing the agreement between simulated and observed N concentrations and losses required changing critical model parameters followed by previously published sensitivity and uncertainty analyses [29,30] during the calibration process. The model was then validated using data gathered in 2017, using the same format for daily and monthly NO3−-N and NH4+-N outputs. Table 3 represents drainage design parameters.
Table 3.
Drainage design from research area used for DRAINMOD-N II calibration.
Effective root depth, planting and harvesting dates, and stress counting thresholds were among the crop input characteristics. Crop-specific attributes such as species type (legume or non-legume), N uptake dynamics, and yield response factors were also incorporated. Nitrogen uptake during the crop growth cycle was defined using a cumulative uptake function, which describes the relative N uptake at different phenological stages. The N uptake function developed by a study [31] was applied to represent site-specific crop dynamics. Because of this parameterization, the model was able to faithfully represent the N transport mechanisms taking place in the tile-drained paddy field system as well as the temporal patterns of WTD changes. Table 4 contains crop data required for the model.
Table 4.
DRAINMOD-N II parameters for crop data.
DRAINMOD-N II’s transformation parameters comprise important processes such volatilization, nitrification, denitrification, fertilizer factor, and pH adjustment. In addition, characteristics of soil organic matter (SOM), including the decomposition rates (Kdec) and carbon-to-nitrogen (C/N) ratios, are defined through the model’s organic matter pools. These SOM pools represent different fractions with distinct decay potentials. In this investigation, the nitrogen dynamics simulation was conducted using the methods outlined by a previous study [32].
Table 5 presents the input parameters related to the NH4+ distribution coefficient and the initial transport conditions used in the DRAINMOD-N II simulation. Table 6 outlines the N transformation parameters, including those based on Michaelis–Menten kinetics. Table 7 provides the initial conditions for organic matter, detailing the configuration of soil organic matter (SOM) pools and litter compartments. Most of the parameter values were estimated based on approximations consistent with the methodology described in the literature [32].
Table 5.
DRAINMOD-N II’s initial transport parameters and NH4 distribution coefficient.
Table 6.
DRAINMOD-N II’s input parameters.
Table 7.
Initial DRAINMOD-N II settings (organic matter).
2.8. Log Pearson Type III (L P III Curve) Frequency Analysis
We used the Log-Pearson Type III (LP-III) distribution to characterize extreme seasonal rainfall for hydrological risk scenarios. Annual seasonal precipitation was extracted from Kunshan paddy field historical data of the 1961–2010 observational record. The LP-III depths for return periods corresponding to exceedance probabilities of 20%, 10%, 5%, and 2% (corresponding to 50-, 20-, 10-, and 5-year return periods) were used to generate hydrological scenarios that were input to DRAINMOD-N II. This study focuses on 24-h rainfall frequency analysis derived from daily observations. These distribution functions were used to calculate the mean and standard deviation.
- KT = Pearson frequency factor which depends on return period (T);
- P*ave = Average of Log Precipitation;
- P* = Logarithm of Precipitation;
- S* = Standard of deviation of P* data;
- Cs = Skew coefficient for Log Pearson method.
2.9. DRAINMOD-N II’s Drainage Design Scenarios
Based on DRAINMOD-N II’s simulations, drainage design scenarios were generated after successful calibration of the model. The selected subsurface drain spacing (1000–2000 cm) and drain depth (80–120 cm) ranges were chosen based on the literature [33]. In addition, preliminary simulations across a wider range of configurations indicated that these combinations provided stable hydrologic performance and realistic N loss responses in DRAINMOD-N II; therefore, they were selected for detailed scenario analysis rather than for purely theoretical sensitivity testing. The input data for the scenario simulations was the same as that used in the calibration period. For every scenario simulation, the mean NO3−-N and NH4+-N were calculated and presented graphically for CD.
Multi-Objective Evaluation Framework
DRAINMOD-N II results were evaluated for two complementary objectives: (i) hydrological performance, quantified by seasonal mean and percentile WTD (below surface), and peak drainage flow, and (ii) water-quality performance, quantified by seasonal cumulative NO3−-N and NH4+-N mass exported and mean concentration in drainage. CD was modeled by applying adjustable outlet stage controls that alter drain outflow when target WTD thresholds were met. This approach allows explicit quantification of how a design reduces waterlogging risk while changing both drainage volume and nitrogen export.
2.10. Model Parameterization and Calibration
Both the hydrologic and nitrogen dynamics of DRAINMOD-N II were calibrated. Hydrologic calibration (WTD and drainage) was performed first, followed by nitrogen calibration (NO3−-N and NH4+-N) to minimize discrepancies between simulated and observed N concentrations and loads. DRAINMOD-N II was calibrated by adjusting the most uncertain and sensitive parameters to minimize discrepancies between simulated and observed data while their feasible ranges followed previously published sensitivity and uncertainty analyses [29,30].
2.10.1. Hydrological Simulation
Hydrological performance of the DRAINMOD-N II model was evaluated using two key indicators: drainage discharge and groundwater table depth (WTD). Statistical measures and graphical comparisons were used to evaluate both parameters. The accuracy of the model was assessed using quantitative indicators, and the agreement between the simulated and observed values was visualized using time-series charts. While drainage flow data has been the only focus of many earlier studies for model calibration and validation, more recent research has highlighted the significance of including WTD data to increase model reliability [34,35,36]. Moreover, few studies [37,38] have relied only on WTDs for model calibration and validation. The hydrological simulation results presented here build upon the framework established by a previous study [39], providing the foundation for subsequent N transport simulations using the DRAINMOD-N II model.
2.10.2. Nitrogen Simulations
Model calibration is the process of minimizing differences between simulated and actual outputs by modifying input parameters. This study focused on the monthly losses and daily concentrations of NO3−-N and NH4+-N in the drainage water, calibrating the DRAINMOD-N II model using data from the 2018 rice-growing season. NO3−-N and NH4+-N field measurements obtained during the 2017 paddy growing season were used to validate the performance of DRAINMOD-N II. Calibration was conducted under a drainage configuration consisting of 100 cm drain spacing and 60 cm drain depth.
2.11. Statistical Analysis
The DRAINMOD-N II calibration was based on the trial-and-error method [40] by changing a few input parameters, until the best resemblance among simulated data and observed data was achieved. The time series data for WTDs and drainage were simulated and compared to the observed data. The coefficient of determination (R2), Root Mean Square Error (RMSE), and Average Absolute Deviation (AAD) were calculated using Equations (3), (4), and (5), respectively.
3. Results
3.1. Calibration of DRAINMOD-N II (Nitrogen Simulations)
As shown in Table 8, Figure 6 and Figure 7, the model exhibited strong performance during the calibration phase. The coefficient of determination (R2) reached 0.70 for NO3−-N and 0.69 for NH4+-N, indicating a strong correlation between observed and predicted concentrations. The average absolute deviation (AAD) was 0.05 mg L−1 for NO3−-N and 0.39 mg L−1 for NH4+-N, suggesting minimal deviation from observed values. Additionally, the root mean square error (RMSE) values were 0.14 mg L−1 for NO3−-N and 0.91 mg L−1 for NH4+-N, further supporting the model’s ability to replicate field conditions accurately.
Table 8.
Statistical analysis of nitrogen simulation of Daily Concentration and Monthly Losses.
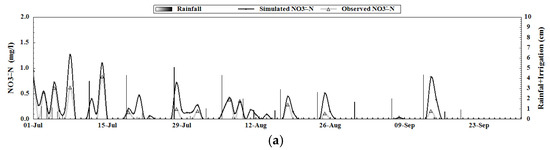
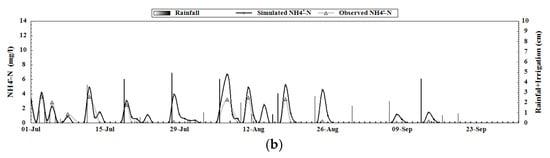
Figure 6.
(a) The DRAINMOD-N II calibration graph for NO3−-N, and (b) the DRAINMOD-N II calibration graph for NH4+-N.
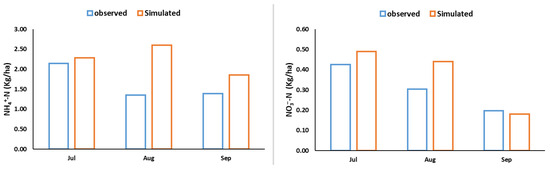
Figure 7.
Calibration of nitrogen losses for NO3−-N and NH4+-N.
3.2. Validation of DRAINMOD-N II (Nitrogen Simulations)
Nitrate-nitrogen (NO3−-N) and ammonium-nitrogen (NH4+-N) field measurements obtained during the 2017 paddy growing season were used to validate the performance of DRAINMOD-N II. With a coefficient of determination (R2) of 0.88 for NO3−-N, the model showed outstanding predictive performance and explained a significant amount of the variation in observed values. The average absolute deviation (AAD) and root mean square error (RMSE) were 0.06 mg L−1 and 0.10 mg L−1, respectively, confirming a close match between the simulated and observed values.
The hydrographs (Figure 8) demonstrate that the model also performed effectively in the case of NH4+-N. The R2 value was 0.72, indicating good correlation between simulated and observed concentrations. The corresponding AAD and RMSE were 0.21 mg L−1 and 0.34 mg L−1, respectively. Monthly simulation results for both N species are presented in Table 8, while Figure 9 illustrates the seasonal dynamics of N losses during the validation period.
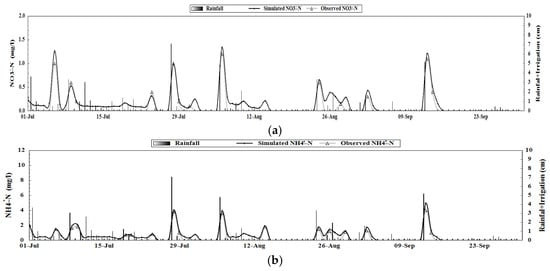
Figure 8.
(a) The DRAINMOD-N II validation graph for NH4+-N, and (b) the DRAINMOD-N II validation graph for NO3−-N.
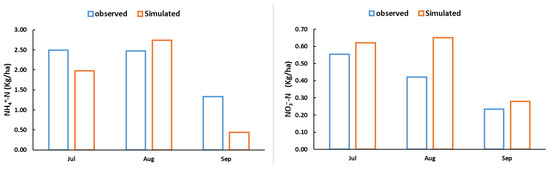
Figure 9.
Calibration of nitrogen losses for NO3−-N and NH4+-N.
3.3. The Effect of Drain Spacing and Drain Depth Scenario on NO3−-N and NH4+-N Losses and Concentration
Model simulations using DRAINMOD-N II demonstrated a consistent reduction in NO3−-N losses with increased drain spacing. When spacing was widened from 1000 cm to 2000 cm, average NO3−-N losses declined by 3%, 5%, and 7% under drain depths of 80 cm, 100 cm, and 120 cm, respectively (Figure 10). For example, at a constant drain depth of 120 cm, increasing spacing from 1000 cm to 2000 cm produced a 7% reduction in nitrate losses. In contrast, increasing drain depth was associated with elevated NO3−-N losses. Raising the drain depth from 80 cm to 120 cm increased losses by 6%, 3%, and 4% at drain spacings of 1000 cm, 1500 cm, and 2000 cm, respectively. NH4+-N losses also declined with increasing drain spacing. When spacing increased from 1000 cm to 2000 cm, losses decreased by 13%, 10%, and 9% under drain depths of 80 cm, 100 cm, and 120 cm, respectively (Figure 10). Drain depth exhibited minimal influence on NH4+-N losses, with negligible variation across the depth scenarios.
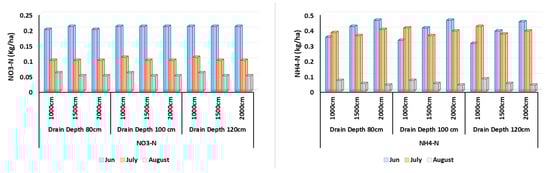
Figure 10.
Response of NO3−-N and NH4+-N losses under different drain spacing and drain depth scenarios.
With respect to nutrient concentrations, NO3−-N concentrations in drainage water increased with greater drain spacing. Average concentrations rose by 59%, 58%, and 66% at drain depths of 80 cm, 100 cm, and 120 cm, respectively, when spacing widened from 1000 cm to 2000 cm (Figure 11). Similarly, NH4+-N concentrations increased by 42%, 42%, and 66% at the same drain depths when spacing increased from 1000 cm to 2000 cm. Conversely, increasing drain depth slightly reduced NH4+-N concentrations by 14%, 1%, and 1% at drain spacings of 1000 cm, 1500 cm, and 2000 cm, respectively.
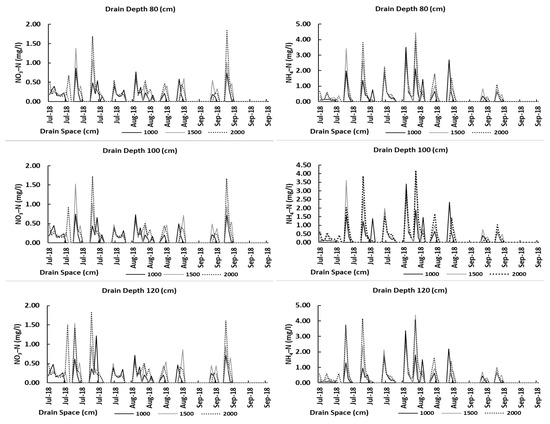
Figure 11.
Response of NO3−-N and NH4+-N concentration under different drain spacing and drain depth scenarios.
3.4. Frequency Analysis of Historical Rainfall
Figure 12 and Figure 13 present LP-III curve and historical precipitation patterns during the rice-growing season in Kunshan, China, respectively. Rainfall corresponding to exceedance probabilities of 20%, 10%, 5%, and 2% was estimated at approximately 500 mm, 580 mm, 650 mm, and 745 mm, respectively. These results reveal a marked increase in rainfall magnitude with decreasing exceedance probability, indicating that extreme precipitation events, though rare, are significantly more intense. Compared to the 20% threshold, rainfall increases by 16% at the 10% level, 30% at the 5% level, and nearly 49% at the 2% level. Incremental increases between adjacent thresholds were also substantial: 12% between the 10% and 5% levels, and 14.6% between the 5% and 2% levels. These quantitative findings highlight a non-linear escalation in rainfall severity with decreasing probability, underscoring the potential for intensified hydrological stress in rice-based systems. High-intensity rainfall events, albeit infrequent, can aggravate waterlogging, reduce nitrogen use efficiency, and increase both surface runoff and nutrient leaching. Such conditions pose a risk to both crop yield and soil fertility. To evaluate the environmental impacts of these extreme rainfall events, the derived rainfall thresholds were used as input scenarios in the DRAINMOD-N II model. These enabled simulations of N leaching and runoff under varying precipitation intensities. Under future climate variability, the integrated analysis offers a useful framework for creating N management plans that minimize losses while preserving rice productivity.
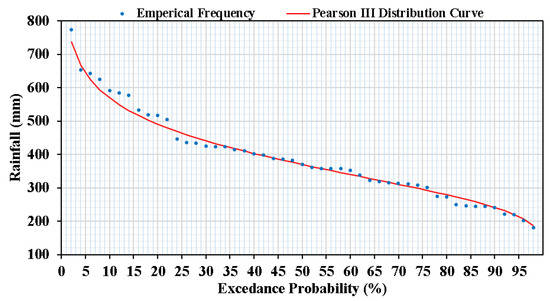
Figure 12.
Log-Pearson Type III Probability Curve for the Kunshan Paddy, 1961–2010.
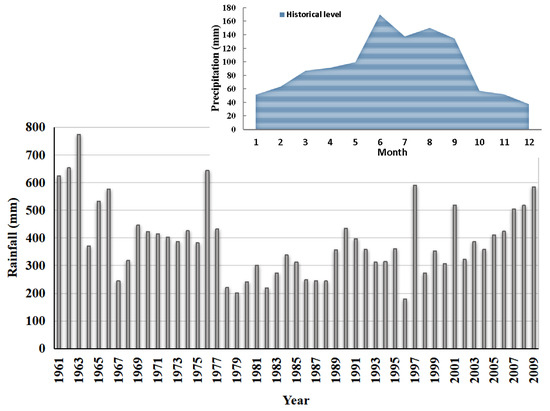
Figure 13.
Historical precipitation during the rice-growing season in Kunshan, China. The inset in the upper right corner (blue) shows the average monthly historical precipitation (mm) for the region.
Response of NO3−-N and NH4+-N Under Extreme Rainfall Probabilities
Figure 14 and Figure 15 present the simulated nitrate and ammonium N losses and concentration in response to varying rainfall intensities, derived from LP-III-based exceedance probabilities using the DRAINMOD-N II model. The figure clearly indicates that N losses, particularly nitrate, increase substantially with decreasing rainfall probability, reflecting the impact of more extreme precipitation events.
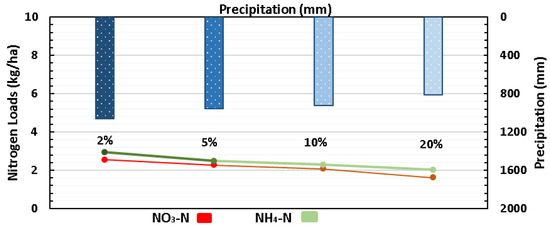
Figure 14.
Response of paddy’s nitrogen losses under different hydrological conditions.
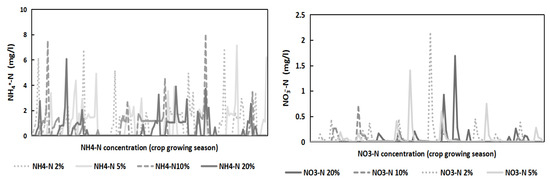
Figure 15.
DRAINMOD-N II daily seasonal nitrogen concentrations under different hydrological conditions.
At a 2% exceedance probability, NO3−-N losses were markedly higher than at the 5%, 10%, and 20% levels, with relative increases of 11.39%, 38.06%, and 57.89%, respectively. Under a 5% exceedance probability, NO3−-N losses exceeded those at the 10% and 20% levels by 9.62% and 41.20%. Even the 10% scenario resulted in a 28.82% increase compared to the 20% scenario. These results demonstrate the strong relationship between rainfall intensity and nitrate mobility in paddy systems. The enhanced drainage discharge under high-intensity events likely accelerates nitrate leaching, while reducing crop uptake efficiency due to waterlogging stress.
Correspondingly at the 2% exceedance level, NH4+-N losses increased by 18.04%, 28.14%, and 45.10% relative to the 5%, 10%, and 20% scenarios, respectively. Likewise, at 5% exceedance, losses were 8.55% and 22.92% greater than at 10% and 20%. The NH4+-N load under the 10% scenario remained 13.24% higher than the 20% scenario. Although ammonium is less mobile than nitrate due to stronger adsorption to soil particles, intense rainfall events can still elevate its transport through surface runoff and lateral flow.
These results highlight the vulnerability of paddy systems to extreme rainfall, especially in terms of nutrient loss. The disproportionate increase in NO3−-N loss relative to rainfall intensity underscores the need for adaptive nutrient and drainage management strategies. Such strategies should account for projected increases in extreme precipitation under climate change to safeguard both yield sustainability.
4. Discussions
4.1. Model Performance and Evaluation
DRAINMOD-N II demonstrated strong ability in reproducing the temporal dynamics of NO3−-N and NH4+-N losses in this study, despite a slight tendency to overestimate both forms during calibration. Similar patterns of overestimation have been noted in previous evaluations of nitrogen-transport models under field conditions [41,42,43].
Overall, for calibration and validation the statistical indicators confirmed that the model correctly reproduced N dynamics. For NO3−-N and NH4+-N, calibration R2 values (0.70 and 0.69 for concentrations; 0.81 and 0.67 for losses) indicate strong explanatory power given the complexity of N cycling in paddy field. The comparatively low AAD (0.08 kg ha−1) and RMSE (0.09 kg ha−1) for NO3−-N further support model reliability. These results align with previous studies [44], which reported R2 values ranging from 0.91 to 0.94 for NO3−-N simulations using DRAINMOD-N II, and another study [44,45] that observed comparable agreement based on AAD and RMSE values of 0.51 and 1.43 mg L−1, respectively. Similarly, the authors of [40] found that their NO3−-N simulations deviated by an average of only 0.05 kg·ha−1·month−1, reinforcing the model’s suitability.
Researchers have shown a strong correlation between subsurface water movement and N mobility in agricultural soils [46]. Our findings reinforce the idea that N losses through NO3−-N and NH4+-N were closely synchronized with variations in drainage fluxes, consistent with earlier observations in paddy and upland systems [47,48,49]. Moreover, this study is consistent with the hydrological simulation results [39]; the peaks in N losses consistently coincided with high-flow periods triggered by rainfall or irrigation events, highlighting the sensitivity of paddy-field nitrogen pathways to hydrological pulses. The strong agreement between modeled and observed seasonal N losses further indicates that the model accurately captures the coupled effects of water table dynamics, soil redox fluctuations, and N transformations, all of which govern nitrogen transport in flooded agroecosystems.
Numerous studies have used the DRAINMOD-N II to model nitrogen and hydrological losses during crop-growing seasons in a variety of cropping and meteorological conditions. For example, research [43] used DRAINMOD-N II to assess nitrate losses and various drainage configurations throughout the northern Iranian canola season. In cold-climate applications, a study [50] successfully simulated potato’s hydrology in the southern Manitoban prairies, while another study [38] assessed seasonal drainage performance under canola cultivation in Canada. Several other studies have likewise focused on crop-specific growing seasons in the application of DRAINMOD-N II [51]. Across these diverse contexts, the model has consistently shown reliable performance in representing nitrogen responses to hydrological drivers. Our results extend this evidence base to paddy field systems, where alternating flooded and drained periods create particularly complex nitrogen cycling environments.
In particular, drainage discharge was a primary driver of nitrogen mobilization, as evidenced by sharp increases in N loss during heavy rainfall and irrigation events. Ultimately, by demonstrating accurately capturing N responses to hydrological fluctuations, this study confirms that DRAINMOD-N II is a dependable tool for evaluating alternative drainage and irrigation strategies in paddy fields. Its ability to simulate N losses under different flow regimes makes it highly valuable for designing management practices that balance crop water needs with the imperative to minimize N pollution and improve environmental sustainability.
4.2. Interpretation of Drain Spacing and Depth Effects on Nitrogen Dynamics
Wider drain spacing results in lower NO3−-N and NH4+-N losses, which is consistent with research by [35,52], who linked these decreases to improved soil moisture retention and anaerobic conditions in the root zone, which promote denitrification. Increased spacing restricts the direct flow of N to tile drains by slowing subsurface drainage [53,54]. Conversely, the observed increase in NO3−-N losses with greater drain depth likely results from enhanced nitrate leaching.
The increase in nutrient concentrations (NO3−-N and NH4+-N) with wider drain spacing likely results from a dilution effect, where reduced drainage volumes concentrate solutes in the effluent. Similar patterns were reported by researchers [43], who observed increased nitrate concentrations at spacings up to 50 m. Research [55], however, documented stable nitrate concentrations across spacings, with seasonal variations linked to crop uptake and fertilizer timing. The limited response of NH4+-N concentrations to drain depth is consistent with its lower mobility in soil. Small declines at greater depths may result from surface retention and slower transport mechanisms, as suggested by researchers [56] and corroborated by similar findings in fine-textured soils.
These results have important implications for nutrient management in heavy-textured paddy fields. Although wider spacing and shallower drains can mitigate total N losses, elevated nutrient concentrations in drainage water pose risks for downstream water quality, particularly under intensifying rainfall regimes. Similar concerns were raised by studies in North Carolina and the Midwest [57,58,59].
Importantly, drainage system design interacts with soil physical and management conditions. A study [60] emphasized that improved subsurface drainage enhances soil aeration and hydraulic conductivity, which can inadvertently increase preferential flow pathways and accelerate nitrate transport, particularly after fertilization or intense rainfall events. This highlights the role of nutrient timing and rate management alongside drainage configuration. Soil texture, organic matter content, tillage practice, cropping system, and rainfall intensity all act as co-drivers of NO3−-N concentrations in drainage outflows, and their interactions must be considered in design and management strategies.
Best management practices (BMPs)—including optimized fertilizer scheduling, CD structures, and cover cropping—should be integrated with drainage design to balance water removal efficiency and nutrient retention. While this study highlights consistent patterns, it is limited by the controlled model assumptions, which may not fully capture field-scale heterogeneity in soil properties, crop rotations, and rainfall variability.
4.3. Drain Spacing Strategy to Mitigate Rainfall-Induced Nitrogen Losses
To cope with the impacts of extreme rainfall events on N transport, optimized subsurface drainage design emerges as a critical strategy in tile-drained paddy landscapes such as those in Kunshan. Previous studies [34] have reported that excessively wide drain spacing may compromise crop yields, reducing relative yield to 90%, due to delayed water removal and subsequent root zone water stress. Hence, there is a need to balance agronomic and environmental goals by improving drainage strategies that retain soil moisture for crop use while minimizing nutrient leaching.
Simulations using DRAINMOD-N II demonstrated that increasing drain spacing significantly reduced N losses across various rainfall intensities. Notably, when the drain spacing was extended to 2000 cm, NO3−-N loads were reduced by 15%, 13%, 9%, and 18% under rainfall exceedance probabilities of 2%, 5%, 10%, and 20%, respectively. Similarly, NH4+-N losses declined by 10%, 12%, 12%, and 9% across the same rainfall scenarios. These reductions align with prior research emphasizing the close relationship between N transport and subsurface water fluxes in agricultural soils [39,40,41]. The observed mitigation potential of wider drain spacing is attributed to increased soil water retention and reduced hydraulic conductivity gradients, which collectively limit N mobility and promote denitrification under saturated, low-oxygen conditions. As illustrated in Figure 16, this approach is particularly effective under extreme precipitation scenarios, making it a viable strategy for enhancing the resilience of paddy systems to climate-induced hydrological variability.
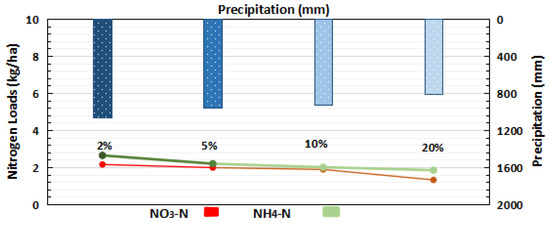
Figure 16.
The response after implementing the drain spacing strategy to cope with the impact of rainfall events on nitrogen.
5. Policy Recommendations
This study underscores the importance of site-specific, scientifically designed drainage systems in minimizing nitrogen losses from paddy fields, particularly under extreme rainfall conditions. Policymakers should prioritize the deployment of precision drainage infrastructure-tailored to local hydrological risks-by adjusting drain spacing and depth to simultaneously protect yields and safeguard environmental health.
National and regional water resource agencies should institutionalize the integration of probabilistic rainfall frequency analysis (e.g., LP-III distribution) with process-based nitrogen transport models (e.g., DRAINMOD-N II) into agricultural water management frameworks. These tools can inform the design of early warning systems, regionally adaptive drainage guidelines, and nutrient loss mitigation policies. In tandem, enforcement of regulatory thresholds for nitrogen concentrations in drainage outflows is essential to prevent downstream water quality deterioration.
At the farm level, technical support programs and economic incentives should promote the adoption of wider drain spacing, which, as demonstrated in this study, can reduce NO3−-N and NH4+-N losses by up to 18% and 12%, respectively, under extreme rainfall scenarios. Farmer education initiatives should advocate for integrated water-nutrient management practices, including the use of CD systems responsive to seasonal precipitation forecasts. Moreover, future agricultural policies should proactively consider projected changes in precipitation regimes and incorporate hydrological-nutrient simulation tools into regional land-use planning. This will be vital for ensuring both agricultural resilience and long-term water resource sustainability.
6. Conclusions
This study developed an integrated modeling approach by coupling Log-Pearson Type III rainfall frequency analysis with the DRAINMOD-N II model to evaluate N loss dynamics in paddy fields under multiple drainage design scenarios. The objective was to determine how return-period rainfall interacts with drain spacing and drain depth to influence N transport and losses, and to provide a scientific basis for climate-resilient drainage design.
The simulation results showed that N losses (NO3−-N and NH4+-N) were strongly controlled by rainfall intensity and hydrological response. High-exceedance rainfall events substantially increased N export, while wider drain spacing consistently reduced N leaching. In contrast, deeper drains increased N movement, indicating a trade-off between drainage efficiency and nutrient retention. Calibration and validation results confirmed that the LP-III–DRAINMOD-N II framework can reliably simulate water–nitrogen processes in paddy’s systems.
While the DRAINMOD-N II model delivered valuable insight, the analysis was limited to a single region, two crop growing seasons and N gas-phase losses were not simulated. LP-III was used for rainfall frequency estimation; however, alternative distributions such as GEV may better represent the tail behavior of extreme rainfall. Future work should therefore include multi-site, long-term validation, incorporate denitrification/volatilization pathways, evaluate the economic feasibility of drainage layouts, and compare LP-III vs. GEV under climate-change-driven non-stationary rainfall to improve uncertainty robustness.
Overall, this framework advances drainage–nitrogen modeling under extreme rainfall and provides actionable evidence for designing sustainable, climate-adaptive drainage systems that can reduce N losses while maintaining ecofriendly paddy systems.
Author Contributions
A.U.R.K.: Writing—review and editing, Writing—original draft, Visualization, Methodology, Formal analysis, Data curation. F.H.: Writing—review and editing, Writing—original draft, Visualization, Methodology, Investigation. J.X.: Validation, Supervision, Resources, Funding acquisition. K.A.: Methodology, Formal analysis, Review. M.M.A.: Writing—review and editing. S.F.R.: Validation, and writing—review and editing. R.O.: Visualization, Conceptualization. P.C.: Writing—Review and editing, Project Administration, Conceptualization. Z.L.: Writing—review and editing. All authors have read and agreed to the published version of the manuscript.
Funding
This work was supported by the Fundamental Research Funds for the Central Universities (B210205014), The Science Foundation of Jiangxi Provincial Water Conservancy Department in China (202022ZDKT07), and the Hohai University under Youth Science and Technology Fund Project with grant number B250201140.
Data Availability Statement
The original contributions presented in this study are included in the article. Further inquiries can be directed to the corresponding authors.
Conflicts of Interest
The authors declare no conflicts of interest.
References
- Tan, Y.; Zhang, Y.; Luo, B.; Yang, M.; Shen, Q.; Miller, A.J.; Xu, G.; Fan, X.; Tang, Z.; Tan, Y.; et al. Overexpression of a PH-Sensitive Nitrate Transporter in Rice Increases Crop Yields. Proc. Natl. Acad. Sci. USA 2016, 113, 7118–7123, Erratum in Proc. Natl. Acad. Sci. USA 2017, 114, E7650. https://doi.org/10.1073/pnas.1714238114.. [Google Scholar]
- Song, Y.; Wang, C.; Linderholm, H.W.; Fu, Y.; Cai, W.; Xu, J.; Zhuang, L.; Wu, M.; Shi, Y.; Wang, G.; et al. The Negative Impact of Increasing Temperatures on Rice Yields in Southern China. Sci. Total Environ. 2022, 820, 153262. [Google Scholar] [CrossRef] [PubMed]
- Prosekov, A.Y.; Ivanova, S.A. Food Security: The Challenge of the Present. Geoforum 2018, 91, 73–77. [Google Scholar] [CrossRef]
- Peng, S. Reflection on China’s Rice Production Strategies During the Transition Period. Sci. Sin. Vitae 2014, 44, 845–850. [Google Scholar] [CrossRef]
- Hameed, F.; Xu, J.; Rahim, S.F.; Wei, Q.; Khalil, A.U.R.; Liao, Q. Optimizing Nitrogen Options for Improving Nitrogen Use Efficiency of Rice under Different Water Regimes. Agronomy 2019, 9, 39. [Google Scholar] [CrossRef]
- Bouman, B.A.M.; Lampayan, R.M.; Tuong, T.P. Water Management in Irrigated Rice: Coping with Water Scarcity; International Rice Research Institute: Los Baños, Philippines, 2007. [Google Scholar]
- Kato, Y.; Katsura, K. Rice Adaptation to Aerobic Soils: Physiological Considerations and Implications for Agronomy. Plant Prod. Sci. 2014, 17, 29–39. [Google Scholar] [CrossRef]
- Ju, X.-T.; Xing, G.-X.; Chen, X.-P.; Zhang, S.-L.; Zhang, L.-J.; Liu, X.-J.; Cui, Z.-L.; Yin, B.; Christie, P.; Zhu, Z.-L.; et al. Reducing Environmental Risk by Improving N Management in Intensive Chinese Agricultural Systems. Proc. Natl. Acad. Sci. USA 2009, 106, 3041–3046. [Google Scholar] [CrossRef]
- Hameed, F.; Xu, J.; Rahim, S.F.; Wei, Q.; Liao, Q.; Khalil, A.U.R.; Ahmed, S. Rice Growth and Nitrogen Uptake Simulation by Using Oryza (V3) Model Considering Variability in Parameters. Pak. J. Agric. Sci. 2019, 56, 245–259. [Google Scholar] [CrossRef]
- Ritzema, H.P. Drain for Gain: Making Water Management Worth Its Salt, Subsurface Drainage Practices in Irrigated Agriculture in Semi-Arid and Arid Regions; Taylor & Francis Group: Oxfordshire, UK, 2009; ISBN 9780415498579. [Google Scholar]
- Zhang, Y.; Chen, X.; Geng, S.; Zhang, X. A Review of Soil Waterlogging Impacts, Mechanisms, and Adaptive Strategies. Front. Plant Sci. 2025, 16, 1545912. [Google Scholar] [CrossRef]
- Qi, B.; Yang, S.; Li, D.; Qin, D.; Zheng, X.; Hu, J.; Zhou, X.; Liu, H. Effects of Drainage Technology on Water-logging Reduction and Rice Yield in Mid-Lower Reaches of Yangtze River. Agronomy 2025, 15, 905. [Google Scholar] [CrossRef]
- Pang, A.; Wang, D. Evaluation of Agricultural and Rural Pollution under Environmental Measures in the Yangtze River Economic Belt, China. Sci. Rep. 2023, 13, 15495. [Google Scholar] [CrossRef] [PubMed]
- Tian, Y.; Shen, J.; Feng, J.; Wang, T.; Jiao, Y.; Wang, X. Research Advancements on Agricultural Non-Point Source Pollution in Major Lake and Reservoir Watersheds of China: Status, Sources, Monitoring, and Prospects. Ecol. Indic. 2025, 178, 113981. [Google Scholar] [CrossRef]
- Hussain, F.; Ahmed, S.; Muhammad Zaigham Abbas Naqvi, S.; Awais, M.; Zhang, Y.; Zhang, H.; Raghavan, V.; Zang, Y.; Zhao, G.; Hu, J. Agricultural Non-Point Source Pollution: Comprehensive Analysis of Sources and Assessment Methods. Agriculture 2025, 15, 531. [Google Scholar] [CrossRef]
- Nuruzzaman, M.; Bahar, M.M.; Naidu, R. Diffuse Soil Pollution from Agriculture: Impacts and Remediation. Sci. Total Environ. 2025, 962, 178398. [Google Scholar] [CrossRef] [PubMed]
- Yu, Y.; Xu, J.; Zhang, P.; Meng, Y.; Xiong, Y. Controlled Irrigation and Drainage Reduce Rainfall Runoff and Nitrogen Loss in Paddy Fields. Int. J. Environ. Res. Public Health 2021, 18, 3348. [Google Scholar] [CrossRef]
- Nhat, L.M.; Tachikawa, Y.; Takara, K. Establishment of Intensity-Duration-Frequency Curves for Precipitation in the Monsoon Area of Vietnam; Kyoto University: Kyoto, Japan, 2006. [Google Scholar]
- Temel, I.; Asikoglu, O.L.; Alp, H. Examining the Probabilistic Characteristics of Maximum Rainfall in Türkiye. Atmosphere 2025, 16, 1177. [Google Scholar] [CrossRef]
- Zheng, S.; Xiao, M.; Miao, Z. Nitrogen Losses in Paddy Field Drainage Modified by Different Water Level Regulations. Pol. J. Environ. Stud. 2017, 26, 1393–1401. [Google Scholar] [CrossRef]
- Liu, Z.; Xiong, Y.; Xu, J. Flood Simulation and Flood Risk Reduction Strategy in Irrigated Areas. Water 2023, 15, 192. [Google Scholar] [CrossRef]
- Hameed, F.; Afzal, M.M.; Khalil, A.U.R.; Xu, J.; Rahim, S.F.; Osman, R.; Ahmad, K.; Li, Y.; Ning, T. Integrated Water and Nitrogen Management Sustains Rice Yield and Efficiency under Changing Climate Scenarios. Agric. Syst. 2026, 231, 104540. [Google Scholar] [CrossRef]
- Li, S.; Zhuang, Y.; Liu, H.; Wang, Z.; Zhang, F.; Lv, M.; Zhai, L.; Fan, X.; Niu, S.; Chen, J.; et al. Enhancing Rice Production Sustainability and Resilience via Reactivating Small Water Bodies for Irrigation and Drainage. Nat. Commun. 2023, 14, 3794. [Google Scholar] [CrossRef]
- Hameed, F.; Rahim, S.F.; Khalil, A.U.R.; Ray, R.L.; Junzeng, X.; Hamoud, A.Y.; Ali, A.; Tangyuan, N. Comparing Genotype and Climate Change Effects on Simulated Historical Rice Yields Using AquaCrop. Rice Sci. 2025, 32, 845–856. [Google Scholar] [CrossRef]
- Hossain, I.; Gato-Trinidad, S.; Imteaz, M.; Rayburg, S. Future Scenarios of Design Rainfall Due to Upcoming Climate Changes in NSW, Australia. Atmosphere 2024, 15, 1101. [Google Scholar] [CrossRef]
- Balacumaresan, H.; Hossain, I.; Imteaz, M.A. Climate Change Impacts on Design Rainfall Extremes Employing Empirical Disaggregation-Based Rainfall Intensities: A Case Study for East Melbourne. Sustain. Water Resour. Manag. 2025, 11, 134. [Google Scholar] [CrossRef]
- Sung, J.H.; Kang, D.H.; Seo, Y.-H.; Kim, B.S. Analysis of Extreme Rainfall Characteristics in 2022 and Projection of Extreme Rainfall Based on Climate Change Scenarios. Water 2023, 15, 3986. [Google Scholar] [CrossRef]
- Ogunlela, A.O. Stochastic Analysis of Rainfall Events in Ilorin, Nigeria. J. Agric. Res. Dev. 2001, 1, 39–50. [Google Scholar] [CrossRef]
- Wang, X.; Youssef, M.A.; Skaggs, R.W.; Atwood, J.D.; Frankenberger, J.R. Sensitivity Analyses of the Nitrogen Simulation Model, DRAINMOD-N II. Trans. Am. Soc. Agric. Eng. 2005, 48, 2205–2212. [Google Scholar] [CrossRef]
- Wang, X.; Frankenberger, J.R.; Kladivko, E.J. Uncertainties in DRAINMOD Predictions of Subsurface Drain Flow for an Indiana Silt Loam Using the GLUE Methodology. Hydrol. Process. 2006, 20, 3069–3084. [Google Scholar] [CrossRef]
- Shaffer, M.J.; Halvorson, A.D.; Pierce, F.J. Nitrate Leaching and Economic Analysis Package (NLEAP): Model Description and Application. In Managing Nitrogen for Groundwater Quality and Farm Profitability; American Society of Agronomy; Crop Science Society of America; Soil Science Society of America: Madison, WI, USA, 2015; pp. 285–322. [Google Scholar] [CrossRef]
- Youssef, M.A.; Skaggs, R.W.; Chescheir, G.M.; Gilliam, J.W. Field Evaluation of a Model for Predicting Nitrogen Losses from Drained Lands. J. Environ. Qual. 2006, 35, 2026–2042. [Google Scholar] [CrossRef]
- Cheng, C.; Luo, W.; Zhong, J.; Li, S.; Sun, S. Subsurface Drainage System Layout to Meet High Assurance Rate of Waterlogging Control in Coastal Mud-Flat Farmlands in Jiangsu. Trans. Chin. Soc. Agric. Eng. 2017, 33, 35–40. [Google Scholar]
- Singh, R.; Helmers, M.J.; Qi, Z. Calibration and Validation of DRAINMOD to Design Subsurface Drainage Systems for Iowa’s Tile Landscapes. Agric. Water Manag. 2006, 85, 221–232. [Google Scholar] [CrossRef]
- Luo, W.; Sands, G.R.; Youssef, M.; Strock, J.S.; Song, I.; Canelon, D. Modeling the Impact of Alternative Drainage Practices in the Northern Corn-Belt with DRAINMOD-NII. Agric. Water Manag. 2010, 97, 389–398. [Google Scholar] [CrossRef]
- Wang, S.; Prasher, S.O.; Patel, R.M.; Yang, C.C.; Kim, S.H.; Madani, A.; Macdonald, P.M.; Robertson, S.D. Fate and Transport of Nitrogen Compounds in a Cold Region Soil Using DRAINMOD. Comput. Electron. Agric. 2006, 53, 113–121. [Google Scholar] [CrossRef]
- Awad, A.; Luo, W.; Zou, J. DRAINMOD Simulation of Paddy Field Drainage Strategies and Adaptation to Future Climate Change in Lower Reaches of the Yangtze River Basin. Irrig. Drain. 2021, 70, 819–831. [Google Scholar] [CrossRef]
- Ndulue, E.; Sri Ranjan, R. DRAINMOD Simulation of Drain Spacing Impact on Canola Yield in Heavy Clay Soils in the Canadian Prairies. Irrig. Drain. 2022, 71, 711–727. [Google Scholar] [CrossRef]
- Khalil, A.U.R.; Xu, J.; Hameed, F.; Ali, A.; Rahim, S.F.; Awad, A.; Wei, Q.; Ali, A.M. Controlled Drainage, to Cope with the Adverse Impacts of Climate Change on Paddy Field’s Hydrology: A Simulation Study Using the Drainmod Model, Kunshan, China. Pak. J. Agric. Sci. 2022, 59, 187–198. [Google Scholar] [CrossRef]
- Dayyani, S.; Madramootoo, C.A.; Prasher, S.O.; Madani, A.; Enright, P. Modeling Water Table Depth, Drain Outflow, and Nitrogen Losses in a Cold Climate Using DRAINMOD 5.1. Trans. ASABE 2010, 53, 385–395. [Google Scholar] [CrossRef]
- Salazar, O.; Wesström, I.; Youssef, M.A.; Skaggs, R.W.; Joel, A. Evaluation of the DRAINMOD-N II Model for Predicting Nitrogen Losses in a Loamy Sand under Cultivation in South-East Sweden. Agric. Water Manag. 2009, 96, 267–281. [Google Scholar] [CrossRef]
- Hassanpour, B.; Parsinejad, M.; Yazdani, M.R.; Dalivand, F.S.; Kossari, H. Evaluation of Modified DRAINMOD in Predicting Groundwater Table Fluctuations and Yield of Canola in Paddy Fields under Snowy Conditions (Case Study: Rasht Iran). Irrig. Drain. 2011, 60, 660–667. [Google Scholar] [CrossRef]
- Hashemi, S.Z.; Darzi-Naftchali, A.; Qi, Z. Assessing Water and Nitrate-N Losses from Subsurface-Drained Paddy Lands by DRAINMOD-N II. Irrig. Drain. 2020, 69, 776–787. [Google Scholar] [CrossRef]
- Helwig, T.G.; Madramootoo, C.A.; Dodds, G.T. Modelling Nitrate Losses in Drainage Water Using DRAINMOD 5.0. Agric. Water Manag. 2002, 56, 153–168. [Google Scholar] [CrossRef]
- Hashemi Garmdareh, S.E.; Malekian, R.; Madani, A.; Gordon, R. Simulation of Nitrate-N Leaching in No-Till Fields with DRAINMOD-N II in a Cold-Humid Region. Irrig. Drain. 2018, 67, 65–72. [Google Scholar] [CrossRef]
- Addiscott, T.M.; Armstrong, A.C.; Leeds Harrison, P.B. Modeling the Interaction Between Leaching and Entrapped Diffusion. In Physical Nonequilibrium in Soils: Modeling and Application; Selim, H.M., Ma, L., Eds.; Taylor & Francis: London, UK, 2022; pp. 223–241. [Google Scholar]
- Xu, C.; Li, Y.; Li, Q.; Mao, L.; Lin, W.; Xiaojing, Q.; Zheng, Q. Determination of 15N and 18O Isotope Abundance in the Extractable Soil Nitrate by the Denitrifier Method. J. Agro-Environ. Sci. 2016, 9, 1829–1836. [Google Scholar]
- Zhu, Y.; Yang, J.; Ye, M.; Sun, H.; Shi, L. Development and Application of a Fully Integrated Model for Unsaturated-Saturated Nitrogen Reactive Transport. Agric. Water Manag. 2017, 180, 35–49. [Google Scholar] [CrossRef]
- Zhuang, J.; Peng, J.; Zhu, Y.; Leng, Y.; Zhu, X.; Huang, W. The Internal Erosion Process and Effects of Undisturbed Loess Due to Water Infiltration. Landslides 2021, 18, 629–638. [Google Scholar] [CrossRef]
- Satchithanantham, S.; Sri Ranjan, R. Evaluation of DRAINMOD for Potato Crop under Cold Conditions in the Canadian Prairies. Trans. ASABE 2015, 58, 307–317. [Google Scholar] [CrossRef]
- Darzi-Naftchali, A.; Mirlatifi, S.M.; Shahnazari, A.; Ejlali, F.; Mahdian, M.H. Evaluation of DRAINMOD Model for Predicting Water Table Depth and Drain Discharge in Subsurface-Drained Paddy Fields. Iran. J. Irrig. Drain. 2015, 9, 583–593. [Google Scholar]
- Brevé, M.A.; Skaggs, R.W.; Parsons, J.E.; Gilliam, J.W. Using the DRAINMOD-N Model to Study Effects of Drainage System Design and Management on Crop Productivity, Profitability and NO3-N Losses in Drainage Water. Agric. Water Manag. 1998, 35, 227–243. [Google Scholar] [CrossRef]
- Hwang, S.; Singh, S.; Bhattarai, R.; Jeong, H.; Cooke, R.A. Impact of Subsurface Drainage System Design on Nitrate Loss and Crop Production. Appl. Sci. 2024, 14, 10180. [Google Scholar] [CrossRef]
- Kladivko, E.J.; Bowling, L.C. Long-term Impacts of Drain Spacing, Crop Management, and Weather on Nitrate Leaching to Subsurface Drains. J. Environ. Qual. 2021, 50, 627–638. [Google Scholar] [CrossRef]
- Kladivko, E.J.; Frankenberger, J.R.; Jaynes, D.B.; Meek, D.W.; Jenkinson, B.J.; Jenkinson, N.R.F.A. Nitrate Leaching to Subsurface Drains as Affected by Drain Spacing. J. Environ. Qual. 2004, 33, 1803–1813. [Google Scholar] [CrossRef]
- Singh, M.; Bhattacharya, A.K.; Nair, T.V.R.; Singh, A.K. Ammonium Losses through Subsurface Drainage Effluent from Rice Fields of Coastal Saline Sodic Clay Soils. Water Air Soil Pollut. 2001, 127, 1–14. [Google Scholar] [CrossRef]
- Kale, S. Field-Evaluation of DRAINMOD-S for Predicting Soil and Drainage Water Salinity under Semi-Arid Conditions in Turkey. Span. J. Agric. Res. 2011, 9, 1142. [Google Scholar] [CrossRef]
- Cooke, R.; Nehmelman, J.; Kalita, P. Effect of Tile Depth on Nitrate Transport from Tile Drainage Systems; American Society of Agricultural and Biological Engineers: St. Joseph, MI, USA, 2002. [Google Scholar] [CrossRef]
- Yoon, K.S.; Choi, J.K.; Son, J.G.; Cho, Y. Concentration Profile of Nitrogen and Phosphorus in Leachate of a Paddy Plot during the Rice Cultivation Period in Southern Korea. Commun. Soil Sci. Plant Anal. 2006, 37, 1957–1972. [Google Scholar] [CrossRef]
- Talukolaee, M.J.; Naftchali, A.D.; Parvariji, L.Z.; Ahmadi, M.Z. Investigating Long-Term Effects of Subsurface Drainage on Soil Structure in Paddy Fields. Soil Tillage Res. 2018, 177, 155–160. [Google Scholar] [CrossRef]


Disclaimer/Publisher’s Note: The statements, opinions and data contained in all publications are solely those of the individual author(s) and contributor(s) and not of MDPI and/or the editor(s). MDPI and/or the editor(s) disclaim responsibility for any injury to people or property resulting from any ideas, methods, instructions or products referred to in the content. |
© 2026 by the authors. Licensee MDPI, Basel, Switzerland. This article is an open access article distributed under the terms and conditions of the Creative Commons Attribution (CC BY) license.