Abstract
Valley contraction poses a significant threat to high-arch dams, making the prediction of valley deformation a critical task in assessing the long-term performance of dams. The Baihetan dam is currently undergoing compression due to valley contraction, and its complex control mechanisms present major challenges in predicting valley deformation. This paper proposes a hybrid model to predict valley deformation in Baihetan, which integrates numerical simulation and statistical analysis to identify the main causes of river valley deformation and make predictions based on extrapolation. A transient numerical seepage model has been used to comprehensively characterize the complex seepage field in the Baihetan dam site area over nearly a decade following impoundment. The hybrid model was developed based on this foundation to determine the contribution of each factor using monitoring data. The model can then be used for time series extrapolation to predict long-term deformation. By June 2028, the valley near the dam is projected to experience a deformation rate of less than 1 mm per month, with a maximum contraction of approximately 26.7 mm. This study provides a basis for assessing the long-term operational safety of the Baihetan and offers valuable reference for similar studies on valley deformation.
1. Introduction
A significant number of high-arch dams have been built in southwestern China due to the ever-increasing demand for energy and the need for environmental protection. While these dams provide green energy for daily life, they also present greater engineering safety challenges. The completion of 300-m-class high-arch dams such as Jinping I, Xiluodu and Baihetan [1,2,3] has led to greater attention being given to the engineering hazard of river valley contraction exerting pressure on dam structures, a phenomenon which is frequently documented in the literature. Synchronous and persistent contraction has been observed at different elevations in the river valleys upstream and downstream of the Xiluodu Hydropower Station in southwestern China. Statistical data from May 2013, when impoundment commenced, to April 2022 indicates that the maximum valley contraction approached 88.2 mm. To date, river valley contraction at Xiluodu continues. This substantial contraction may compromise operational safety and pose a significant threat to the structural stability of the dam [4].
The mechanism of river valley contraction induced by impoundment is complex, and attempts have been made to explain this phenomenon from multiple perspectives. Numerous studies [1,5] attribute valley contraction primarily to reduced effective stress, which induces plastic deformation in weak strata. The view that changes in mechanical properties induced by reservoir impoundment constitute the main control mechanism for valley deformation is widely accepted in engineering practice [6]. The Zeuzier arch dam in Switzerland developed cracks due to valley contraction. This significant valley contraction was attributed to the construction of a 400 m-deep tunnel below the dam’s foundation during its operational period. The altered seepage field that resulted increased the effective stress within the rock mass [7]. The Beauregard arch dam in Italy also experienced cracking due to persistent valley contraction following impoundment. Barla et al. [8] conducted a detailed analysis incorporating monitoring data and concluded that the primary cause was the deformation of the deep left-bank slope and a reduction in the shear strength of the slip plane following impoundment. Several alternative perspectives have been proposed to explain the unconventional valley contraction observed following the impoundment at Xiluodu. Due to the alternating distribution of impermeable and permeable strata at the dam site, some studies attribute the contraction to changes in hydrogeological conditions after impoundment. These changes primarily involve the elastic deformation of the valley’s vertical slopes due to the pressure of the reservoir water, as well as the swelling of highly permeable rock strata absorbing water [9]. Additionally, some studies suggest that the hydrogeological conditions at the dam site changed following impoundment, triggering creep deformation in the rock mass of the reservoir bank [10,11]. It is also worth noting that monitoring data on water temperature from the dam site has been examined. Certain numerical simulations attribute valley deformation to the contraction of the bedrock following impoundment, which is caused by the cooling effects of downward seepage [4,12]. Currently, valley contraction deformation is being analyzed from multiple perspectives, though research into its complex mechanisms is ongoing.
The urgent need for safety assessments due to the continuous contraction of river valleys has prompted numerous studies to adopt mathematical statistics and machine learning methods for this purpose. The application of statistical methods to predict river valley deformation primarily involves fitting monitoring data to appropriate functional forms to forecast valley deformation progression [13]. It also involves identifying potential factors influencing river valley deformation, followed by multiple regression analysis [14]. The widespread application of machine learning theory has also led to the use of relevant predictive analytical methods in valley deformation prediction research. Machine learning approaches that account for data noise are extensively utilized when combining river valley deformation monitoring data. For example, Sun et al. [15] presented a model that integrates ensemble empirical mode decomposition with interval threshold denoising to predict valley deformation at Xiluodu. In recent years, identifying the key factors influencing river valley deformation and addressing time-series instability have received increasing attention. The VMD-SSA-LSSVM hybrid model [16], for example, has been used to predict valley deformation at Baihetan.
Machine learning and statistical methods have long been used in the traditional prediction of slope deformation, and a few recent reports have attempted to address river valley contraction forecasting. As river valley deformation is usually monitored through manual measurements taken monthly or less frequently, limited monitoring data is often available even after years of reservoir operation. This presents a significant challenge to the application of machine learning approaches. Acquiring sufficiently large datasets is time-consuming, which makes it difficult to meet the urgent demand for river valley contraction prediction. Unlike machine learning, which relies heavily on sizeable datasets, statistical methods are more tolerant of small sample sizes and are thus more widely applied in current river valley contraction forecasting. By establishing correlations between valley deformation and potential influencing factors, statistical methods can help to identify the main causes of valley contraction [14]. Several key factors affecting river valley deformation have been identified, including reservoir water level, temperature and creep [17,18,19,20]. However, statistical models integrating these factors have proven ineffective in certain applications [21]. Extensive research indicates that valley contraction is closely linked to changes in the groundwater level in the dam site area following impoundment. Li et al. [9,14] employed numerical methods to characterize the Xiluodu confined aquifer and further to construct an analytical model of valley deformation with integrated inversion techniques. This revealed a significant correlation between valley contraction and fluctuations in the groundwater level in the dam site area. Chen et al. [22] investigated the dynamic response of groundwater on a basin scale after the impoundment of the Xiluodu reservoir. By analyzing the temporal law of groundwater level fluctuations, they inferred the time at which valley deformation would tend to stabilize. In summary, integrating the primary drivers of river valley deformation into the forecasting model is crucial for predicting such processes. Deformation stems from multiple interrelated factors, including reservoir water level fluctuations, changes in groundwater levels, temperature variations, and time-dependent effects. When constructing the prediction model, it is important to recognize that river valley deformation is a multidimensional phenomenon influenced by several concurrent factors.
To overcome the challenges posed by sparse monitoring data and the absence of primary driving forces in river valley deformation prediction, this paper proposes a hybrid model integrating numerical simulation and mathematical statistics for forecasting river valley deformation. This approach has been applied to predict the Baihetan river valley deformation. Firstly, a numerical model was established to describe the complex, unsteady seepage field in the dam site area, based on the hydrogeological conditions of the study area and the characteristics of reservoir operation. Secondly, the hybrid model was developed by incorporating reservoir water level, groundwater level, temperature and creep to quantify the contributions of the primary drivers to valley contraction. After validating the accuracy of the model by comparing it with valley width monitoring data from the test dataset, the model extrapolates temporal processes to achieve long-term deformation prediction for the Baihetan river valley. This research provides the basis for evaluating the long-term operational safety of the Baihetan Hydropower Station and offers valuable reference for similar studies on valley deformation.
2. Project Overview and Valley Width Monitoring System
2.1. Project Overview
The Baihetan Hydropower Station is located at the border between the Yunnan and Sichuan provinces of China, as shown in Figure 1. With a crest elevation of 834 m and a maximum dam height of 289 m, it is the world’s second-largest hydropower station. The project’s design calls for normal and dead pool water levels of 825 and 765 m, respectively [23]. Baihetan began impounding in April 2021 with an initial water level elevation of around 640 m. Around three months later, the water level had risen to an elevation of 775 m, enabling the first generating units to start operating. By September of that year, the water level had risen to an elevation of 816.5 m, marking the peak elevation of the initial impoundment. In November 2022, the reservoir level reached its normal impoundment level of an elevation of 825 m for the first time.
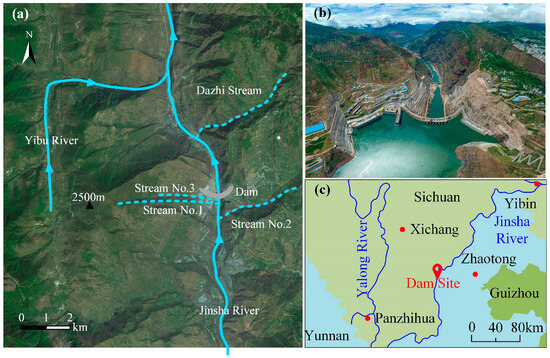
Figure 1.
Close views and location of the Baihetan project. (a) shows the topography of the dam site area, (b) shows a close-up view and (c) shows the geographical location.
2.2. Geological Settings
The left bank generally faces the Jinsha River with relatively gentle terrain, while the right bank is steeper. The predominant bedrock on both banks consists of Upper Permian Emeishan Formation basalt, with loose deposits from the Quaternary System distributed in the riverbed and gentle sloping terraces. The structural planes on the left bank are well-developed, primarily involving the large faults F14, F16, and F17, with thicknesses ranging from 50 to 200 cm. Additionally, there are interlayer shear zones C2, C3, and C3-1, as well as intra-layer shear zones LS331 and LS3319. The left bank exhibits a greater depth of weathering compared to the right bank, and unloading fractures are mainly distributed in the left bank, with relatively fewer on the right bank.
The predominant types of groundwater in the Baihetan dam site area are the pore water in the overburden layer and the bedrock fissure water. Atmospheric precipitation serves as the principal source of groundwater recharge in the dam site area. The groundwater systems of the left and right banks are independent. Due to the presence of the C2, C3-1, and C3 fault zones and the F14, F16, and F17 faults, the left bank groundwater is more active and stratified. Influenced by the relative diaphragm misalignment zone, groundwater on the left bank primarily undergoes horizontal recharge, with vertical recharge being insufficient. The right bank is characterized by limited infiltration and recharge due to the structural and stratigraphic inclinations within the slope, coupled with its steeper gradients. Consequently, most rainfall is funneled down the slope into the Jinsha River, resulting in weaker groundwater activity [24]. The hydrogeological conditions of the left bank of Baihetan are shown in Figure 2.
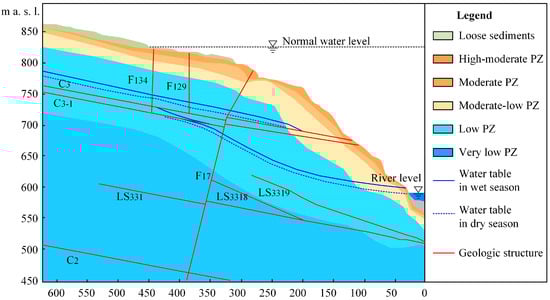
Figure 2.
Hydrogeological profile of the left bank area at the dam site.
2.3. Valley Width Monitoring System and Results
Ten observation sections were established upstream and downstream of the dam to monitor river valley contraction. Observation lines 1 to 5 are located upstream, and lines 6 to 10 downstream. The river valley width observation sections are shown in Figure 3. Each of the upstream sections has a single measurement line, all of which are situated at or near the 834 m elevation. The downstream valley width observation sections are arranged with multiple observation lines from low to high. This study only presents the monitoring data from measurement lines situated at or near an elevation of 834 m for each section.
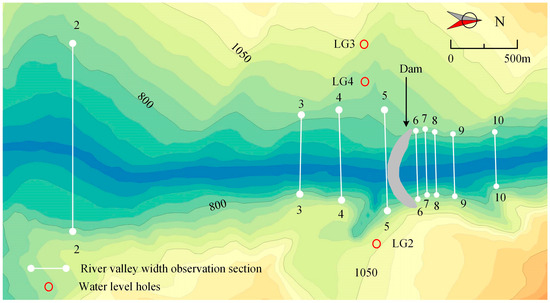
Figure 3.
Layout of valley width observation lines.
The deformation of the upstream river valley exhibits characteristics of both expansion and contraction in different zones. The length of observation lines away from the dam increased gradually following impoundment, while those closer to the dam decreased slowly. Similarly, the monitoring data from the valley width observation lines indicate a significant correlation between the lengths of observation lines 1 and 2 (further from the dam) and the reservoir water level. When the reservoir water level rose from an elevation of 640 m to 816 m during the initial impoundment period, the deformation rates at these two sections increased significantly. During the phase while the water level in the reservoir stabilized and then decreased gradually, the deformation characteristics of the river valley manifested as rebound towards the riverbed. Subsequently, as the reservoir water level fluctuated, the lengths of the river valley observation lines increased when the water level rose and decreased as it fell. Over the 31 months following impoundment, the length of river valley measurement line 1 increased by 35 mm. By contrast, measurement lines 3, 4 and 5, which were located closer to the dam, all recorded contraction of the river valley. The degree of contraction decreased gradually with proximity to the dam, with shortening values of 23 mm, 20 mm and 10 mm, respectively. Figure 4a shows the temporal evolution of the upstream valley observation line.
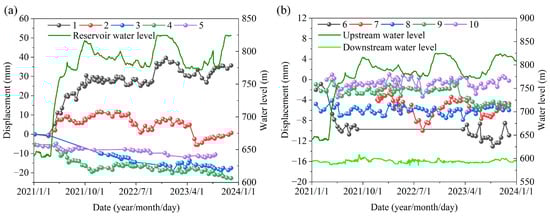
Figure 4.
Time series process for monitoring data at the Baihetan valley measurement line. where (a) is the upstream side valley width measurement lines and (b) is the downstream side. Positive displacements indicate valley widening, and negative displacements indicate valley contracting.
The downstream valley experienced contraction, with the effect being less noticeable than on the upstream side. Temporal data from the downstream area shows that deformation was primarily concentrated when the reservoir water level rose from 640 m to 816 m. During that initial period of impoundment, contraction at most measurement lines accounted for over 70% of total valley contraction within the first three years. Thereafter, valley deformation slowed considerably. The most noticeable contraction in the downstream valley was recorded along measurement line 6, reaching approximately 10 mm. The degree of contraction gradually diminished along the direction of the river’s flow. Figure 4b shows the temporal data from the measurement lines in the downstream valley.
Following the impoundment of the reservoir, most of the observation sections contracted, with higher deformation values in the upstream areas than those in the downstream. Deformation in the upstream valley, far from the dam, exhibited clear periodicity closely synchronized with reservoir water level fluctuations. Given this significant synchrony, it is evident that valley deformation in these investigated areas is closely related to reservoir water level changes. However, the relationship between valley deformation and reservoir water level is comparatively weaker in areas close to the dam. The deformation of the downstream valley was mostly within 1 cm after three years of reservoir impoundment, showing significantly weaker correlation with reservoir water level changes compared to the upstream valley. Once the reservoir had reached its normal impoundment level, deformation rates at most river valley width measurement lines showed a downward trend. The period of more rapid deformation primarily coincided with phases of a rapid rise in the reservoir water level.
3. Groundwater Response Following Impoundment
Extensive research indicates that river valley deformation is closely linked to groundwater movements [25,26]. Grasping the behavior of groundwater following impoundment is essential for studying valley deformation. Regarding statistical approaches for predicting valley deformation, existing studies primarily aim to establish correlations between deformation and reservoir water levels. However, high-arch dam impoundment frequently induces extensive fluctuations in groundwater levels, sometimes extending to the entire reservoir basin, and groundwater stabilization may even take decades [22].
Due to the complex spatial and temporal dynamics of groundwater behavior, the linear relationship between changes in the reservoir water level and regional groundwater variations tends to diminish progressively with increasing distance from the reservoir. Therefore, establishing the relationship between river valley deformation and the impoundment process solely through reservoir water level changes is insufficient. Instead, information on groundwater behavior should be extracted at a larger regional scale to supplement this connection. Consequently, investigating groundwater changes during the impoundment process is crucial for exploring the correlation between river valley deformation and groundwater movement, as well as for predicting river valley deformation.
3.1. Computational Models
The left and right banks of Baihetan hold independent groundwater systems. The recharge area of the left bank’s groundwater is larger than that of the right bank. To investigate groundwater movement patterns following impoundment, a representative profile from the left bank was selected. A model was developed that matches the profile, spans 5000 m across the river channel, with a base elevation of 400 m.
The left boundary corresponds to the watershed, and the right boundary lies at the riverbed. Extensive conventional and high-pressure packer tests were conducted at the Baihetan dam site [27,28]. These were combined with numerous pumping tests and in situ seepage tests to investigate the permeability of geological structures, such as basalt fracture zones, faults and loose sediments. The rock hydraulic conductivity values derived from the packer test suggested that the formations could be divided into six permeability zones along the direction of gravity [29].
The computational model incorporates the following permeability zones: High-Moderate PZ, Moderate PZ, Moderate-Low PZ, Low PZ and Very Low PZ. It also includes the fault zones C3, C3-1 and C2, as well as the faults F14 and F17, which exhibit significant permeability sensitivity. The computational model is shown in Figure 5.
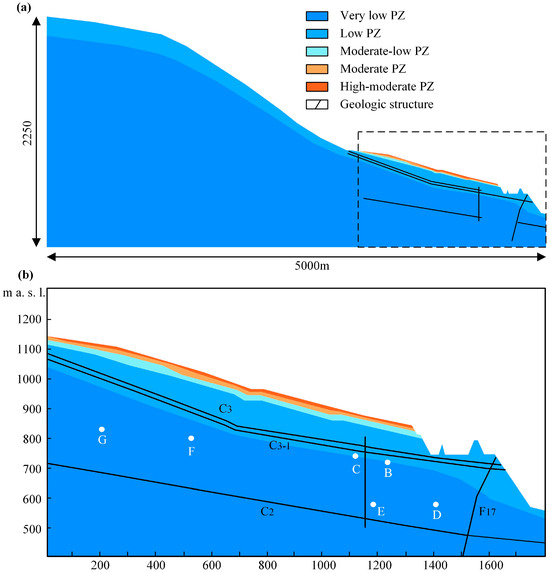
Figure 5.
The model for unsteady seepage computation. (a) shows the overall model. (b) shows a local model, where B-G represents typical monitoring points designated for numerical simulation.
3.2. Seepage Boundary Setting and Permeability Parameters
The permeability tensor was calculated by combining the dominant fracture development characteristics within each permeability zone with the results of the packer tests [30]. The permeability coefficients for each zone are detailed in Table 1.

Table 1.
Permeability coefficient of the rock mass in the dam site area. KH is the hydraulic conductivity parallel to the layer direction, and Kv is the hydraulic conductivity perpendicular to the layer direction. Ss is the specific storage, ϕ is the porosity [22].
Impoundment at the Baihetan Hydropower Station began in April 2021, with an initial water level of approximately 640 m elevation. Assuming the seepage field within the study area was in a steady state prior to impoundment, we modeled the initial seepage field using steady-state numerical simulation methods. The boundary water level was then determined through inverse analysis. The right boundary of the model lies at the riverbed and is designated as a constant-head boundary. Due to significant groundwater recharge and enrichment on the left bank, this boundary was also set as a constant-head boundary. Combining the results of the inversion analysis with a genetic algorithm, we estimated the left boundary water level to be at an elevation of 1500 m.
The study period for the unsteady seepage analysis of Baihetan spans from 1 April 2021, to 1 April 2032, totaling 11 years. During this period, the reservoir water levels, from 1 April 2021 to 1 August 2023, are based on measured values, while the levels thereafter are estimated by projecting typical interannual fluctuations. The numerical simulation steps are set at daily intervals.
3.3. Seepage Results
To validate the accuracy of the numerical simulation, the measured water level data from observation holes in the study area were compared with the calculated values at the exact locations. Figure 6 shows the measured and calculated time series of water levels at observation hole LG4, which is location as shown in Figure 3. The calculated pressure head values for this observation hole closely match the monitored data series, demonstrating consistency in both the synchrony and magnitude of water level changes, which confirms the validity of the seepage field simulation. Figure 7 shows the pressure head distribution in the study area during typical years. These figures show that the groundwater influence zone on the left bank of the Baihetan dam site extends approximately 1500 m after impoundment, with significant water level fluctuations occurring within 800 m of the riverbed.
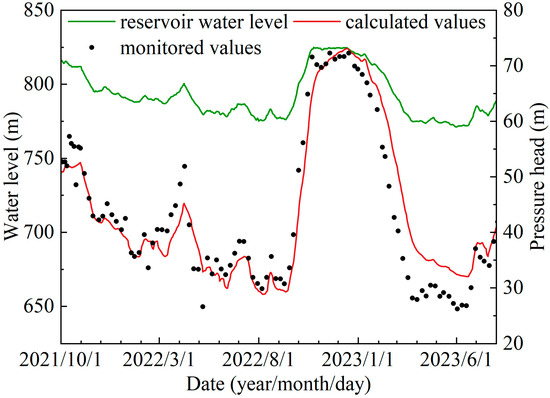
Figure 6.
Time series of measured water levels at LG4 water level observation hole versus corresponding calculated values.
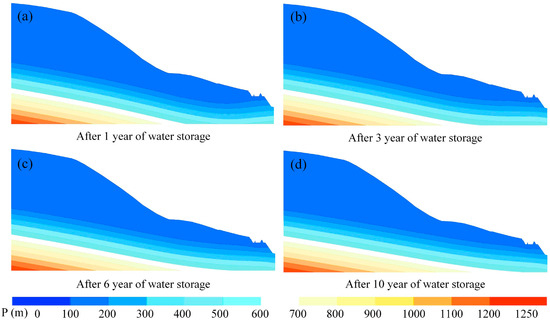
Figure 7.
Pressure head distribution for several typical years after impoundment. (a–d) are the pressure head distributions after 1, 3, 6 and 10 years of impoundment, respectively.
Seepage calculations indicate that the groundwater on the left bank, within 800 m of the riverbed, exhibits a more dynamic relationship with the reservoir water levels. This correlation gradually diminishes as the horizontal distance increases further into the mountain. The spatial distribution and temporal variation in the pressure head were analyzed in relation to monitoring points within the model. The locations of the monitoring points are illustrated in Figure 5b, and the corresponding time-series profile is presented in Figure 8. Within a radius of approximately 800 m from the riverbed, the pressure head within the mountain exhibits periodic fluctuations, with the cycle almost coinciding with the variations in the reservoir water levels. After multiple cycles of rise and fall in the reservoir water levels, these dynamic fluctuations exhibit nearly identical amplitude and phase. As the horizontal distance into the mountain increases, the dynamic relationship between groundwater and reservoir water levels progressively weakens. Notable characteristics include the reduced magnitude of pressure head increases and the gradual attenuation of periodic variations, which become imperceptible over time. Groundwater in these areas typically shows a gradual increase in pressure following the reservoir impoundment, with the rate of increase slowing progressively until the head value stabilizes.
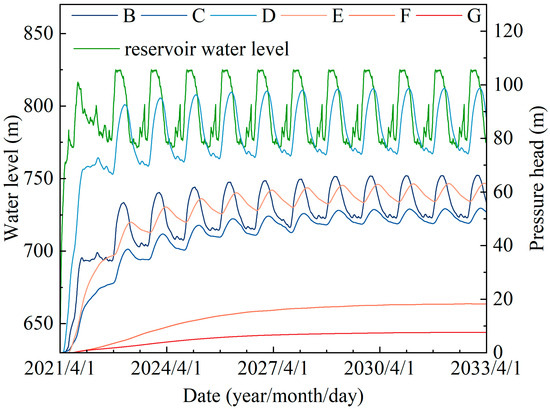
Figure 8.
Time-series process curve of pressure head increases at recording points after impoundment.
4. HPST Hybrid Model
4.1. The Characterization of the HPST Hybrid Model
The mechanisms underlying river valley contraction are complex and diverse, with numerous potential driving factors. Ensuring the validity of analytical results hinges on the careful selection and accurate characterization of the critical influencing factors.
The impact of reservoir water on river valley deformation has been demonstrated in various engineering projects [31,32,33]. However, the impact of groundwater has rarely been considered in previous statistical and machine learning approaches. Extensive research indicates that river valley deformation is closely linked to groundwater movements [25,26]. Grasping the movement behavior of groundwater following impoundment is essential for studying river valley deformation. Regarding statistical and machine learning approaches for predicting valley deformation, existing studies primarily aim to establish connections between deformation and reservoir water levels. However, high-arch dam impoundment frequently induces extensive fluctuations in groundwater levels, sometimes extending to the entire reservoir basin, and groundwater stabilization can take decades [22]. Due to the complex spatial and temporal dynamics of groundwater movement, the linear relationship between changes in the reservoir water level and regional groundwater variations tends to diminish progressively with increasing distance from the reservoir. Therefore, establishing the relationship between river valley deformation and the impoundment process solely through reservoir water level changes is insufficient. Instead, information on groundwater movement should be extracted at a larger regional scale to supplement this connection. Consequently, investigating groundwater changes during the impoundment process is crucial for exploring the correlation between river valley deformation and groundwater movement, as well as for predicting river valley deformation.
Temperature is another noteworthy factor that affects valley contraction. Previous studies have demonstrated that variations in surface temperature can have a significant impact on slope stability [34]. Gischig et al. [18] conducted numerical simulations on a rock slope near the village of Randa in southern Switzerland. These simulations revealed that thermoelastic stresses near the base of the slope propagate to depths of 100 m or more, inducing both elastic and plastic deformation within structural planes. While research into the impact of temperature on valley deformation remains limited, this phenomenon has received considerable attention in the analysis of the mechanisms of large-scale valley contraction, as demonstrated in the Xiluodu case [4]. In addition to the aforementioned factors, creep is also a key focus of studies on river valley deformation [35]. For example, research that integrates monitoring data with numerical modeling suggests that creep is primarily responsible for the contraction of the Xiluodu valley [10].
This paper proposes a hybrid model that combines numerical simulation and statistical methods to evaluate the driving factors of river valley contraction and facilitate predictive analysis. The system inputs comprise reservoir water, groundwater, seasonal temperature variations, and temporal variables. Within the model, the reservoir water level is derived from monitoring data, and the groundwater level is obtained via the typical time-series process at monitoring points within the unsteady-state seepage simulation. Widely used mathematical functions describe periodic temperature variations and time effects [21,36,37].
where is the observed deformation; , , , represent the effect of reservoir water, groundwater, seasonality and time, respectively; is the model error; is corresponding reservoir level on the day of onset of valley width monitoring; is the measured value of the reservoir level on day , based on the starting date of the valley width measurement; is the monitored or calculated value of the pressure head at the typical measurement point numbered on day of the count from the starting moment of the study; is the pressure head at the typical measurement point numbered corresponding to the starting monitoring day of the valley width.
The study period spanned from 6 January 2021 to 21 November 2023. Reservoir water levels were input using daily measured data, while groundwater levels were based on calculated values derived from numerical simulations of the seepage field at four representative monitoring points. The analytical system comprised one reservoir water level factor, four groundwater factors, two temperature factors and two time-varying factors.
The dependent variable in this analysis was derived from measured values obtained from single river valley profiles, with each independent variable included or excluded at a 0.05 confidence level.
However, multicollinearity among the independent variables significantly increases the uncertainty of the parameter estimates. To address this issue, we calculated the variance inflation factor (VIF) for each independent variable to assess the level of covariance. A VIF value exceeding 10 indicates severe multicollinearity, which undermines the robustness and interpretability of the model. Consequently, independent variables with VIF values above 10 were excluded to enhance the accuracy and reliability of parameter estimation. This approach strengthens the model’s statistical validity and improves the interpretability of the results.
4.2. Estimation Results of the HPST Model
The effectiveness of this hybrid model was validated by comparing the monitored values with the regression values from the five upstream observation lines at Baihetan. The model effectively captures various deformation patterns and shows strong adaptability to both contraction and expansion. Table 2 outlines the parameters used to evaluate the accuracy of the calculated values, while the accompanying chart indicates that the root mean square error (RMSE) for all five observation lines is below 1.85 mm. Table 3 gives the regression results for typical river valley width observation lines. A comparison of the calculated and measured values demonstrates the model’s high computational accuracy. Figure 9b–d illustrate the regression details for each component at observation lines 1, 3, and 5. At observation line 1, the reservoir water level has a significant influence on deformation, accounting for approximately 86.0% of the total deformation. For observation lines 2 to 4, both reservoir water and groundwater are the primary drivers of valley deformation. At observation line 5, the time-varying component represents the majority of the total deformation.
Table 2.
Accuracy assessment of computational values.
Table 3.
Regression results for typical river valley width observation lines.
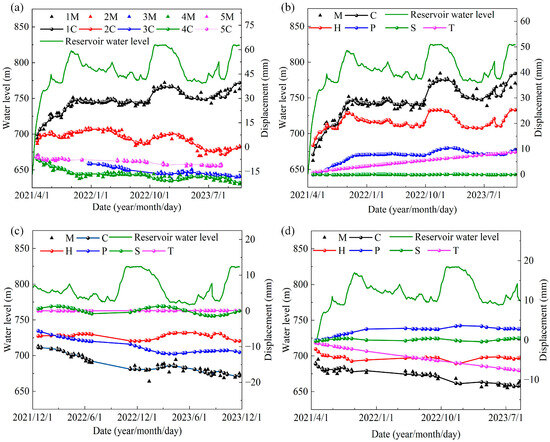
Figure 9.
Comparison of measured and calculated values. (a) A comparison of the observed and regression values for the 5 upstream river valley measurement lines. (b–d) present the detailed regression results for measurement lines 1, 3 and 5. M denotes observed data, and C denotes calculated values. H, P, S and T correspond to the contribution values of reservoir water, groundwater, temperature and the time-dependent component, respectively.
Calculations indicate that the deformation in the distant upstream valley is primarily influenced by the levels of reservoir water and groundwater. In contrast, valley deformation near the dam is primarily influenced by creep. Seasonal temperature variations exert negligible influence on valley deformation. The analysis of the factors driving valley deformation presented in this study aligns with findings from previous research that utilized numerical simulation methods [3].
Unlike the river valley deformation patterns observed in other projects, lines 1 and 2 at Bahetan showed river valley widening after impoundment. Analysis of the influencing factors using the HPST model suggests that the level of the reservoir water significantly affects river valley deformation in these areas, especially along line 1. This widening phenomenon may be linked to topographical variations. Line 1 is located 8786 m upstream of the dam and has a broader, more gently sloping valley. The wider expanse of this valley experienced hydrostatic pressure, which is likely the primary reason for its expansion. The near-synchronous deformation of the valley in relation to the reservoir water level lends weight to this interpretation.
Observation Line 2 is situated in an area with steeper slopes. In this location, hydrostatic pressure gradually reduces its horizontal impact on the reservoir valleys, and its effect on valley deformation is not entirely dominant. The dynamic adjustment of groundwater levels in the study area following impoundment occurs slowly; as a result, the influence of groundwater on valley deformation also responds to changes in reservoir water levels. During the initial stages of impoundment, hydrostatic pressure predominates, leading to valley widening. As the groundwater level in the area rises over time, the mechanical properties of the structural planes and soft rock layers weaken progressively, causing deformation toward the riverbed. This may explain why Observation Line 2 exhibits deformation patterns that closely follow the fluctuations in reservoir water levels, along with increasingly pronounced deformation directed toward the riverbed during periodic changes in reservoir levels.
Lines 3, 4, and 5 are located closer to the dam. Extensive excavation was carried out on the upstream slope of the dam to accommodate the construction of hydraulic structures, resulting in a steeper slope downstream. Due to their steep topography, these areas experience limited influence from reservoir water. Furthermore, the deployment of impermeable curtains reduces the effects of groundwater closer to the dam, resulting in less valley deformation in these zones. The HPST hybrid model’s explanation for valley contraction is consistent with the deformation mechanisms revealed by numerical simulation methods [6].
4.3. Prediction of the RVCs
Valley contraction poses a significant threat to the safety of arch dams, so being able to predict it is crucial for engineering safety assessments. This study utilized data from before June 2023 to train the HPST hybrid model, which was then employed to forecast river valley deformation over the subsequent six months. Comparing the monitoring data with the predicted outcomes for measurement line 3 revealed that the discrepancies consistently remained below 1.5 mm throughout the study period, with an RMSE of 0.78, confirming the model’s predictive accuracy. Figure 10 shows the time series of observed and calculated values for typical river valley width observation lines.
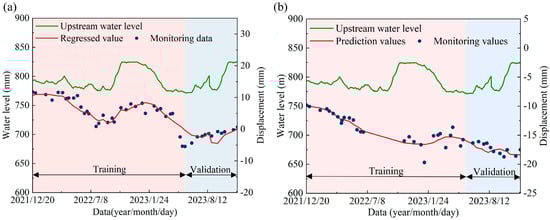
Figure 10.
Validation of model accuracy for the typical measurement lines. (a,b) are the river valley measurement lines for 2 and 3, respectively.
River valley widths are usually measured using high-precision total stations. The instruments and prisms are set up on observation piers on both the left and right banks. Valley width measurement lines generally cover considerable distances. For example, the shortest measurement line at Baihetan upstream valley measures 544.15 m, while the longest spans 1328.99 m. Such extended measurements require the use of a high-precision total station such as the Leica TM50, which has accuracy specifications of 0.6 mm + 1 ppm (where 1 ppm denotes an error of 1 mm per kilometer). Assuming a measurement line length of 400 m, the permissible measurement error using the TM50 would be 1 mm. Considering both the length of the Baihetan measurement line and the permissible error of the instrument, this paper discusses the time required for valley deformation to stabilize by analyzing the monthly variation in valley width.
The prediction results indicate that the river valley width in the observation line 1 will vary periodically on an annual scale in response to fluctuations in the reservoir water level, with the annual peak difference gradually diminishing. The areas along the upstream observation lines 2–5 will experience minor contraction. Notably, the river valley width around observation line 2 also exhibits distinct periodic variations on an annual scale, with an overall trend of contraction. By the end of 2025, observation line 2 will have recorded the maximum contraction value in the upstream river valley, amounting to 17.28 mm.
The area near the dam is a critical focus of engineering safety assessments. Observation Line 5 is expected to reach a relatively stable contraction value of approximately 10 mm by the end of 2025. After several years of reservoir water cycling, the river valleys within the areas of observation lines 3 and 4 will experience minor contractions. During the statistical period, the monthly deformation magnitude of the river valley in the observation line 3 area remained below 1 mm until June 2028. At that point, the total contraction of the river valley reached 19.63 mm. In the case of observation line 4, the river valley contracted by less than 1 mm per month in October 2027, leading to a total contraction of 23.66 mm. Figure 11 illustrates the predicted results for the typical measurement lines.
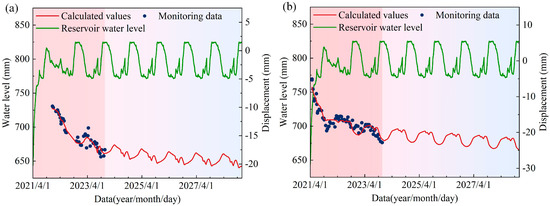
Figure 11.
The predicted results for the typical measurement lines. (a,b) are the river valley measurement lines for 3 and 4, respectively.
5. Discussion
To verify the accuracy of the model’s predictions, the computational precision of the HPST hybrid model was compared with that of several other widely used time series forecasting models, including LSTM, ARIMA, and Holt-Winters [38]. All models were trained using the same dataset, which encompassed observational data from Line 3 between 1 April 2021, and 30 May 2023. Figure 12 shows the prediction results and accuracy evaluation metrics for these models.
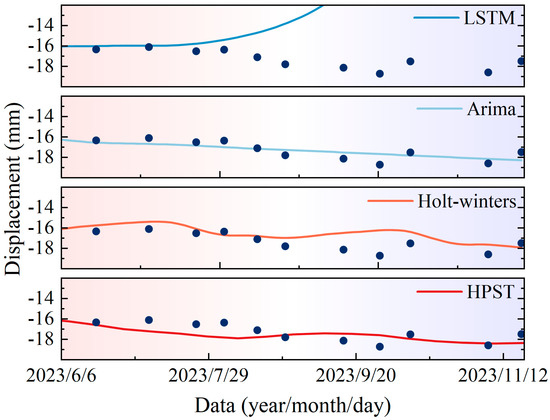
Figure 12.
Predicted time series for measurement line 3 obtained with different methods.
The forecast results generated by these four models were collated over a period of nearly six months. Figure 13 shows the evaluation metrics for the predicted versus actual values, including RMSE, MAE, R2 and MAPE. Due to the small sample size, training of the LSTM model was constrained, resulting in suboptimal generalization performance. The ARIMA model’s suboptimal performance with seasonal and non-stationary data may compromise the reliability of forecasts. For time series with pronounced seasonal fluctuations, incorporating seasonal factors into the model explicitly may yield more accurate results. For multifactorial phenomena such as valley deformation, the Holt-Winters model’s overreliance on historical seasonal patterns also restricts predictive accuracy. Furthermore, its forecasting precision can be unreliable when handling sparse or highly volatile datasets. By contrast, the HPST model can utilize sparse, discontinuous data samples for training while integrating the key factors that influence valley deformation, thereby ensuring the accuracy of its long-term forecasts. However, constrained by limited monitoring data, the predictive model widely employed in this study may not have demonstrated its inherent advantages. Therefore, comparing the accuracy of the aforementioned predictive models only illustrates HPST’s potential superiority over other methods, rather than providing definitive proof of its superiority.
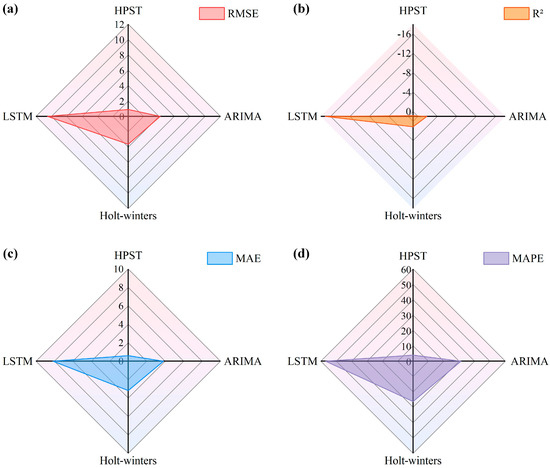
Figure 13.
Accuracy evaluation of the output values from four prediction models, where (a–d), respectively, report the RMSE, MAE, MAPE and R2.
The proposed predictive model’s accuracy warrants further investigation. Large study areas, such as the Baihetan river valley, typically have complex hydrogeological conditions. During the process of impounding a reservoir, changes to the permeable zone and the arrangement of impermeable curtains can frequently result in the formation of complex seepage fields within the study area. However, the predictive model proposed in this paper relies solely on transient seepage characteristics at representative cross-sections. Consequently, it fails to accurately depict the groundwater distribution pattern across the entire study area. Consequently, the predictions derived inevitably contain systematic errors. Therefore, future research is anticipated to develop a complex, three-dimensional seepage field model for this region, identifying characteristics that reasonably represent the evolution of groundwater patterns within the study area. This approach will enable a more precise investigation of the relationship between valley deformation and its critical influencing factors.
6. Conclusions
This study analyses the spatiotemporal patterns of valley deformation at the Baihetan Hydropower Station using monitoring data. A transient seepage numerical simulation method was used to characterize the complex seepage field along the reservoir valleys following impoundment, integrating hydrogeological conditions with reservoir operation processes. Based on this, an empirical–statistical model combining numerical simulation and statistical analysis was developed to predict valley deformation. This model, supported by physical insight, is driven by water levels in the reservoir and groundwater, as well as temperature and time-dependent effects, aiming to establish the potential relationship between valley deformation and these key factors. Furthermore, the model can be trained and used for prediction with limited, sparse time series samples, offering unique advantages in identifying the contribution of primary controlling factors to valley deformation, as well as in deformation prediction. The findings of this study provide crucial evidence for safety assessments during the long-term operation of the Baihetan dam and offer a valuable reference for predicting valley deformation in similar projects. The main findings of this work are as follows:
- (1)
- An empirical–statistical model supported by physical insight has been proposed. This model, which integrates numerical simulation and statistics, can be used for training with sparse samples and for time-series extrapolation. It has been used to predict valley deformation at Baihetan.
- (2)
- In areas far from the Baihetan dam, the reservoir water and groundwater primarily influence valley deformation. Nearer to the dam, time-varying effects explain minor valley deformations.
- (3)
- Measurement Line 1 at Baihetan will deform in synchrony with the reservoir water level. Measurement Line 2 will continue to contract, experiencing the most significant contraction of all the lines by the end of 2025, with a contraction of 17.28 mm. Significant contraction of the valley near the dam will occur along measurement lines 3 and 4, with monthly variation falling below 1 mm by June 2028 and October 2027, respectively. The corresponding contraction values are 19.63 mm and 23.66 mm, respectively.
Author Contributions
L.X.: Conceptualization, Formal analysis, Software, Writing—Original Draft, Writing—review & editing. S.Z.: Formal analysis, Software. X.H.: Formal analysis, Validation. G.R.: Supervision, Formal analysis. Y.T.: Validation, Data Curation. All authors have read and agreed to the published version of the manuscript.
Funding
This work was supported by the China Three Gorges Corporation Research Project (BHT/0811).
Data Availability Statement
The original contributions presented in this study are included in the article. Further inquiries can be directed to the corresponding author.
Conflicts of Interest
Authors Lida Xu, Shunwen Zhou, and Xingyong He were employed by the company POWERCHINA Chengdu Engineering Corporation Limited. Author Yaosheng Tan was employed by the company China Three Gorges Group Corporation. The remaining authors declare that the research was conducted in the absence of any commercial or financial relationships that could be construed as a potential conflict of interest. The funder was not involved in the study design, collection, analysis, interpretation of data, the writing of this article or the decision to submit it for publication.
References
- Wang, S.; Liu, Y.; Yang, Q.; Wang, X. Analysis of the abutment movements of high arch dams due to reservoir impoundment. Rock Mech. Rock Eng. 2020, 53, 2313–2326. [Google Scholar] [CrossRef]
- Zhou, Z.; Zhou, Z.; Li, Y.; Vanapalli, S.K.; Huang, H. Analysis of deformation and leakage performance of Xiluodu reservoir dam foundation using a coupled two-factor stress-deformation-seepage model. Eng. Geol. 2022, 310, 106871. [Google Scholar] [CrossRef]
- Xu, L.; Rong, G.; Qiu, Q.; Zhang, H.; Chen, W.; Chen, Z. Analysis of reservoir slope deformation during initial impoundment at the Baihetan Hydropower Station, China. Eng. Geol. 2023, 323, 107201. [Google Scholar] [CrossRef]
- Jiang, H.; Zhang, C.; Zhou, Y.; Pan, J.-W.; Wang, J.-T.; Wu, M.-X.; Fan, Q.-X. Mechanism for large-scale canyon deformations due to filling of large reservoir of hydropower project. Sci. Rep. 2020, 10, 12155. [Google Scholar] [CrossRef]
- Cheng, L.; Liu, Y.R.; Yang, Q.; Pan, Y.; Lv, Z. Mechanism and numerical simulation of reservoir slope deformation during impounding of high arch dams based on nonlinear FEM. Comput. Geotech. 2017, 81, 143–154. [Google Scholar] [CrossRef]
- Rong, G.; Xu, L.; Yu, S.; Chen, W. The mechanism of large-scale river valley deformation induced by impoundment at the Baihetan Hydropower Station. Comput. Geotech. 2024, 165, 105898. [Google Scholar] [CrossRef]
- Lombardi, G. Ground-water induced settlements in rock masses and consequences for dams. In Proceedings of the Integrity Assessment of Large Concrete Dams (IALAD), Zurich, Switzerland, 24–25 September 2004; pp. 1–17. [Google Scholar]
- Barla, G.; Antolini, F.; Barla, M.; Mensi, E.; Piovano, G. Monitoring of the Beauregard landslide (Aosta Valley, Italy) using advanced and conventional techniques. Eng. Geol. 2010, 116, 218–235. [Google Scholar] [CrossRef]
- Li, M.; Zhou, Z.; Zhuang, C.; Zhou, Z. Deformation mechanism and model of river valley contraction of the Xiluodu reservoir, China. Environ. Earth Sci. 2022, 81, 491. [Google Scholar] [CrossRef]
- Fan, Q.; Liu, Y.; Zhang, G.; Cheng, H.; Xiang, J.; Zhou, Q. Analysis on the cause of valley width shrinkage of an ultra-high arch dam and its influence on dam safety risk. In Proceedings of the 2018 7th International Conference on Energy, Environment and Sustainable Development (ICEESD 2018), Shenzhen, China, 30–31 March 2018; pp. 811–819. [Google Scholar]
- Li, M.; Selvadurai, A.; Zhou, Z. Observations and computational simulation of river valley contraction at the Xiluodu dam, Yunnan, China. Rock Mech. Rock Eng. 2023, 56, 4109–4131. [Google Scholar] [CrossRef]
- Yin, T.; Li, Q.; Hu, Y.; Yu, S.; Liang, G. Coupled thermo-hydro-mechanical analysis of valley narrowing deformation of high arch dam: A case study of the Xiluodu project in China. Appl. Sci. 2020, 10, 524. [Google Scholar] [CrossRef]
- Yang, X.; Gao, K.; Zhao, W.; Wang, R.-K.; Zhang, J.-H. Analysis of the influence of valley deformation on the safety of Xiluodu arch dam. In Proceedings of the 2017 International Conference on Electronic, Control, Automation and Mechanical Engineering, Sanya, China, 19–20 November 2017; pp. 580–588. [Google Scholar]
- Li, M.; Zhou, Z.; Zhuang, C.; Chen, M.; Wu, J. The Cause and Statistical Analysis of the River Valley Contractions at the Xiluodu Hydropower Station, China. Water 2020, 12, 791. [Google Scholar] [CrossRef]
- Sun, M.; Xu, W.; Wang, H.; Meng, Q.; Yan, L.; Xie, W.-C. A novel hybrid intelligent prediction model for valley deformation: A case study in Xiluodu Reservoir Region, China. Comput. Mater. Contin. 2020, 66, 1057–1074. [Google Scholar] [CrossRef]
- Zang, H.; Li, D.; Tang, X.; Rong, G. Machine learning for time series prediction of valley deformation induced by impoundment for high arch dams. Bull. Eng. Geol. Environ. 2025, 84, 194. [Google Scholar] [CrossRef]
- Zhou, Z.; Zhou, Z.; Xu, H.; Li, M. Surface water-groundwater interactions of Xiluodu Reservoir based on the dynamic evolution of seepage, temperature, and hydrochemistry due to impoundment. Hydrol. Process. 2021, 35, e14304. [Google Scholar] [CrossRef]
- Gischig, V.S.; Moore, J.R.; Evans, K.F.; Amann, F.; Loew, S. Thermomechanical forcing of deep rock slope deformation: 1. Conceptual study of a simplified slope. J. Geophys. Res. Earth Surf. 2011, 116, F04010. [Google Scholar] [CrossRef]
- Luo, D.; Lin, P.; Li, Q.; Zheng, D.; Liu, H. Effect of the impounding process on the overall stability of a high arch dam: A case study of the Xiluodu dam, China. Arab. J. Geosci. 2015, 8, 9023–9041. [Google Scholar] [CrossRef]
- Sedat, T. Treatment of the seepage problems at the Kalecik Dam (Turkey). Eng. Geol. 2003, 68, 159–169. [Google Scholar] [CrossRef]
- Liang, G.; Hu, Y.; Fan, Q.; Li, Q. Analysis on valley deformation of Xiluodu high arch dam during impoundment and its influencing factors. J. Hydroelectr. Eng. 2016, 35, 101–110. (In Chinese) [Google Scholar]
- Chen, Y.; Ren, W.; Yang, Z.; Hu, R.; Mao, Y.-P.; Zhou, C.-B. Evaluation of basin-scale hydrogeological changes induced by reservoir operation at the Xiluodu dam site. J. Hydrol. 2023, 620, 129548. [Google Scholar] [CrossRef]
- Jiang, Q.; Feng, X.; Hatzor, Y.H.; Hao, X.-J.; Li, S.-J. Mechanical anisotropy of columnar jointed basalts: An example from the Baihetan hydropower station, China. Eng. Geol. 2014, 175, 35–45. [Google Scholar] [CrossRef]
- Qiu, Q.; Rong, G.; Zhang, H.; Chen, W.; Tan, Y. Investigation on effect evaluation of seepage control system of large underground powerhouse of the Baihetan hydropower station. Tunn. Undergr. Space Technol. 2023, 142, 105429. [Google Scholar] [CrossRef]
- Wasantha, P.L.; Ranjith, P.G. Water-weakening behavior of Hawkesbury sandstone in brittle regime. Eng. Geol. 2014, 178, 91–101. [Google Scholar] [CrossRef]
- Kafle, L.; Xu, W.; Zeng, S.; Nagel, T. A numerical investigation of slope stability influenced by the combined effects of reservoir water level fluctuations and precipitation: A case study of the Bianjiazhai landslide in China. Eng. Geol. 2022, 297, 106508. [Google Scholar] [CrossRef]
- Chen, Y.; Hu, S.; Hu, R.; Zhou, C. Estimating hydraulic conductivity of fractured rocks from high-pressure packer tests with an Izbash’s law-based empirical model. Water Resour. Res. 2015, 51, 2096–2118. [Google Scholar] [CrossRef]
- Zhou, C.; Zhao, X.; Chen, Y.; Liao, Z.; Liu, M.-M. Interpretation of high pressure pack tests for design of impervious barriers under high-head conditions. Eng. Geol. 2018, 234, 112–121. [Google Scholar] [CrossRef]
- Chen, Y.; Yu, H.; Ma, H.; Li, X.; Hu, R.; Yang, Z. Inverse modeling of saturated-unsaturated flow in site-scale fractured rocks using the continuum approach: A case study at Baihetan dam site, Southwest China. J. Hydrol. 2020, 584, 124693. [Google Scholar] [CrossRef]
- Snow, D.T. Anisotropie permeability of fractured media. Water Resour. Res. 1969, 5, 1273–1289. [Google Scholar] [CrossRef]
- Huang, D.; Gu, D.M. Influence of filling-drawdown cycles of the Three Gorges reservoir on deformation and failure behaviors of an aclinal rock slopes in the Wu Gorge. Geomorphology 2017, 295, 489–506. [Google Scholar] [CrossRef]
- Paronuzzi, P.; Rigo, E.; Bolla, A. Influence of filling-drawdown cycles of the Vajont reservoir on Mt. Toc slope stability. Geomorphology 2013, 191, 75–93. [Google Scholar] [CrossRef]
- Yang, J.; Hu, D.X. Deformation and safety analyses on a high rock slope at the left bank of Lijiaxia arch dam. In Advances in Earth Structures: Research to Practice; American Society of Civil Engineers: Reston, VA, USA, 2006; pp. 180–187. [Google Scholar]
- Gunzburger, Y.; Merrien-Soukatchoff, V.E.R.; Guglielmi, Y. Influence of daily surface temperature fluctuations on rock slope stability: Case study of the Rochers de Valabres slope (France). Int. J. Rock Mech. Min. Sci. 2005, 42, 331–349. [Google Scholar] [CrossRef]
- Yan, X.; Huang, Z.; Yao, J.; Zhang, Z.; Liu, P.; Li, Y.; Fan, D. Numerical simulation of hydro-mechanical coupling in fractured vuggy porous media using the equivalent continuum model and embedded discrete fracture model. Adv. Water Resour. 2019, 126, 137–154. [Google Scholar] [CrossRef]
- Shao, C.; Gu, C.; Yang, M.; Xu, Y.; Su, H. A novel model of dam displacement based on panel data. Struct. Control Health Monit. 2018, 25, e2037. [Google Scholar] [CrossRef]
- Xu, R.; Wunsch, D. Survey of clustering algorithms. IEEE Trans. Neural Netw. 2005, 16, 645–678. [Google Scholar] [CrossRef] [PubMed]
- Xie, P.; Zhou, A.; Chai, B. The application of long short-term memory (LSTM) method on displacement prediction of multifactor-induced landslides. IEEE Access 2019, 7, 54305–54311. [Google Scholar] [CrossRef]
Disclaimer/Publisher’s Note: The statements, opinions and data contained in all publications are solely those of the individual author(s) and contributor(s) and not of MDPI and/or the editor(s). MDPI and/or the editor(s) disclaim responsibility for any injury to people or property resulting from any ideas, methods, instructions or products referred to in the content. |
© 2026 by the authors. Licensee MDPI, Basel, Switzerland. This article is an open access article distributed under the terms and conditions of the Creative Commons Attribution (CC BY) license.