Abstract
Glacial retreat is a widely recognised phenomenon, and yet the processes of glaciofluvial bedload in high-alpine river systems remain largely unobserved. This study investigates the impact of hydrological and climatic changes on bedload and water discharge dynamics in the Rofenache catchment in the Ötztal Alps over a 14-year period. Utilising high-resolution bedload data from plate geophones and direct calibration measurements, we analyse water discharge and bedload transport, focusing on hysteresis events influenced by temperature and precipitation. Our findings reveal that water discharge and bedload transport processes are non-linear, with counterclockwise hysteresis dominating; this is consistent with previous studies in glaciated catchment areas. The inclusion of temperature and precipitation data further highlights the significant influence of temperature on hysteresis events in the catchment area. This research provides insights into the bedload dynamics of a high-alpine river under the effects of climate change, emphasising the need for continued monitoring and analysis to understand the evolving interactions between hydrological and sedimentological processes and climatic factors in partially glaciated catchments.
1. Introduction
Glacier retreat caused by global warming has far-reaching effects on sediment transport and river dynamics. The melting of glaciers leads to an increase in sediment input into these systems, thereby altering the sedimentation equilibrium [1]. This altered sediment budget can significantly influence river morphology through increased erosion and sedimentation processes [2]. The interaction of erosion and sedimentation leads to profound changes in the affected ecosystems and landscapes, which urgently need to be investigated [3]. It is, therefore, important to monitor glacier retreat, sediment transport and their interactions, as well as their impacts on downstream reaches and ecosystems, to estimate the future impact of retreating glaciers.
The Randolph Glacier Inventory (RGI) was developed to meet the requirements of the ‘Fifth Assessment Report’ (AR5) of the Intergovernmental Panel on Climate Change (IPCC) and provides comprehensive global coverage of glaciers, making it a crucial resource for assessing worldwide glacier retreat [4]. Based on this inventory, the IPCC report, which divides glaciers into 19 regions (e.g., Alaska, Southern Andes, Central Europe, Greenland), demonstrates mass losses across all regions over the past five decades. This provides strong evidence, with a very high level of confidence, of the global retreat of glaciers. The rate of ice mass loss from glaciers (excluding Greenland and Antarctica) increased from 0.76 mm yr−1 SLE (sea level equivalent), during the 1993 and 2009 period, to 0.83 mm yr−1 SLE, between 2005 and 2009. An accelerated glacier loss (in absolute numbers) was also shown by Hugonnet et al. [5], who reported that glaciers lost 267 ± 16 Gt of their worldwide mass annually between 2000 and 2019. In Central Europe, the increase in loss rates was strongest, and equalled~−2 Gt yr−1 (IPCC).
In the Austrian Alps in 2012, 921 glaciers covered 415.47 km2, which corresponds to 0.5% of Austria’s total area [6]. Fischer et al. [6] updated the Austrian glacier inventory using high-resolution LiDAR digital elevation models (DEMs) and orthophotos. The study impressively demonstrates that the glaciated areas in Austria have decreased by 66% since the end of Little Ice Age (LIA, ~1850). The area lost was 0.6% yr−1 from 1969 to 1998, increasing to 1.2% yr−1 from 1998 to 2012. In the Ötztal Alps, where the present case study is located, the glacier area has decreased by 36% since the LIA, with an ablation rate of −0.5% yr−1. The unconsolidated glacial deposits left behind are highly prone to rapid degradation and mass-reducing processes. This leads to slope instability, triggering debris and mudflows that pose significant hazards in downstream areas [7]. Increased occurrences of slope instability in rock faces and unconsolidated sediments, such as moraines and scree slopes, due to glacier retreat are also highlighted in the study by Haeberli et al. [8].
The hydrological impacts of glacier retreat have been examined in various studies. Glacier-induced floods in high-alpine river systems occur due to the sudden release of water stored within the glacier, glacial lake outbursts, or extreme glacial melts and landslides [6,9,10]. As posited by Klimeš et al. [10], landslides have been shown to exert a lesser impact on glacial lake outburst floods (GLOFs) in comparison to ice or rockfall events. Nevertheless, the authors also underscore the necessity of a critical evaluation of the statement that is adapted to the catchment area, as other factors could also influence this assumption, such as climate change. The occurrence of GLOFs is also attributed to the failure of a moraine-dammed lake. The formation of such a lake is caused by the accumulation of glacial meltwater behind a natural dam constructed of debris (moraine) deposited by a retreating glacier [11]. These dams are often unstable due to their loose and unconsolidated structure, making them prone to failure and causing hazardous GLOFs [12]. A study of 56 large, glaciated basins showed that about half of them will experience increasing glacier discharge to peak water, followed by a decline. The remaining basins have already passed the moment of peak water. In one-third of them, the runoff could decrease by more than 10%, despite having less than 2% ice cover [13]. A regional study in Austria (Ötztal and Zillertal) examined the effects of negative glacier mass balances on runoff. These resulted in excess meltwater, contributing 5–8% of total annual runoff, with no significant effects in winter. Summer melt in regions with 40% glacier coverage recorded excess meltwater contributing more than 20% to monthly discharge. The ongoing trend of negative mass balances has increased summer runoff, affecting water management. However, as glacier reserves shrink, this excess meltwater will decline, reducing future summer runoff [14].
Savi et al. [15] highlighted the high variability of sediment transport in the pro-glacial area of the Sulden Glacier (Eastern Italian Alps). From 2005 to 2021, glacial bedload contributed 34–37% of the total sediment budget, while 45–59% came from lateral fluvial erosion. Most sediment is transferred downstream, and this contribution may increase with further glacier retreat and rising precipitation in the near future. Further studies have focused on the relationship between sediment transport and glacier retreat in the Sulden catchment [16,17,18,19]. The investigation of the temporal variability of bedload transport and water discharge during a melt period in 2011 emphasised the important role of runoff generation processes (snowmelt, glacier melt and rain events) in sediment supply and temporal availability [19]. A study undertaken in the Sulden catchment investigated the influence of glacier meltwater on bedload transport and showed that the bedload transport rate during glacier melt is up to six orders of magnitude higher than during snowmelt [17]. The study by Coviello et al. [18] concluded that bedload transport in glacier rivers is strongly influenced by climatic factors, such as temperature and precipitation. The study also agreed with Comiti et al. [17] that bedload transport will decline in the future due to decreasing glacier meltwater. Carrillo and Mao [20] concurred with the above statements that the transport status of rivers will change from sediment-limited to transport-limited.
Bedload constitutes a pivotal component of river systems, providing a foundational basis for sustainable river engineering [21] and the restoration of resilient aquatic environments. The acquisition of continuous, long-term data on bedload transport is imperative for the advancement of our comprehension of this process and the refinement of calculation methodologies. These data are indispensable for the identification and elucidation of processes, as well as the documentation of environmental changes and trends precipitated by climate change or other factors. Despite the evident importance of bedload transport, its monitoring remains a significant challenge, and the establishment of a universally reliable model for predicting transport rates and volumes remains ongoing [22,23]. Various methods are employed to record bedload transport, such as plate geophones, which are used in countries like Austria, Switzerland, Italy, Japan, Taiwan, China, Israel and the USA [17,18,24,25,26,27,28]. Japanese pipe hydrophones are another recording method and are utilised in Japan, Switzerland, Italy and Chile [19,29,30]. Additionally, hydrophones are employed in Austria, France, the USA and South Korea [31,32,33,34], while seismic sensors are used in Switzerland, France and Italy [35,36]. The aforementioned indirect measuring instruments record a parameter (e.g., pulse or signal) which, on its own, cannot determine bedload transport. Direct methods, such as net samplers, are used to calibrate the indirect measurement methods so that bedload transport can be determined. Current research is focused on understanding the mechanisms of sediment transport in various river types [31,37,38,39,40,41,42], to address existing knowledge gaps regarding their predictability. Highland rivers, characterised by steep gradients and coarse particles, are one such type. For these rivers, plate geophones and seismic sensors are particularly effective. Other river types in these regions include mountain streams and alpine rivers, which also exhibit similar sediment transport dynamics and can benefit from the use of plate geophones hydrophones and pipe hydrophones. Looking at the river morphologies of alpine rivers, three distinct channel substrates can be distinguished: (i) bedrock, (ii) alluvial and (iii) colluvial. Based on the channel morphology classification according to Montgomery and Buffington [43], bedrock channels are characterised by confined walls and steep slopes with high sediment transport capacity, while alluvial channels can be classified in five different morphologies, based on channel slope and characteristic grain size. Another important factor is that non-fluvial characteristics decrease as channel gradient and grain size decrease [44]. In particular, small catchments exhibit significant variability in measured bedload transport rates for the same discharge, underscoring their sensitivity to bedload input from upstream areas [45,46]. The non-linear relationship between the parameters ‘bedload transport’ and ‘water discharge’ is described by a hysteresis. Hysteresis manifests in a variety of forms, yielding different meanings depending on its characteristics. Williams [47] described the characteristics of hysteresis, which can be summarised as follows: linear hysteresis occurs when both the water discharge and bedload maxima coincide, thereby precluding any discernible hysteretic behaviour. The two predominant types of hysteresis are clockwise and counterclockwise. In the clockwise configuration, the sediment maximum is reached before the water discharge maximum, and vice versa in the counterclockwise configuration. A combined form of clockwise and counterclockwise hysteresis is referred to as ‘figure-eight’ hysteresis. Gunsolus and Binns [48] found that extreme rainfall and reservoir flushing in alluvial rivers can cause unsteady water discharge events, leading to hysteresis in sediment transport rates. They summarised several studies examining the response of sediment transport rates to such unsteady water discharge events and identified factors such as sediment composition, sediment supply, hydrograph characteristics, riverbed morphology and sediment transport mode as influential and highlighted the need for further research to understand the effects of other variables. The identification of these influencing factors in nature is challenging; consequently, laboratory experiments are conducted. Hassan et al. [49] investigated the influence of the timing of sediment supply on bedload transport and bed surface texture in a laboratory setting. They conclude, among other findings, that sediment transport is more pronounced during the rising limb of a water discharge hydrograph.
It is evident to all observers that glaciers are retreating. In contrast, the of glaciofluvial bedload processes in high-alpine river systems cannot be visually observed. Therefore, the following question arises: what happens to alpine rivers if glaciers disappear and the Alps, consequently, become (almost) ice-free in the future? The present study focuses on analysing the bedload and water discharge processes over 14 years in the study area, with the inclusion of hysteresis events and the parameters of temperature and precipitation. The overarching objectives of this research are to address two fundamental questions. Firstly, how do hydrological and climatic changes impact bedload and water discharge dynamics in a partially glaciated catchment over 14 years, such as the Rofenache in the Ötztal Alps? Secondly, if these influences can be identified, can we derive future perspectives on bedload dynamics in rivers under the effects of climate change? In consideration of the high-resolution bedload data obtained from the plate geophones and direct calibration measurements, it is evident that the water discharge and bedload transport do not behave linearly. A hysteresis analysis was conducted for the purpose of determining the influence that air temperature and precipitation have on hysteresis and, consequently, the bedload transport processes.
2. Materials and Methods
2.1. Study Site
The Vent/Rofenache monitoring station is located in the rear Ötztal, Tyrol at an altitude of 1891 m above sea level, making it the highest monitoring station of the Tyrolean Hydrographic Service. The location of the study site is shown in Figure 1a,b.
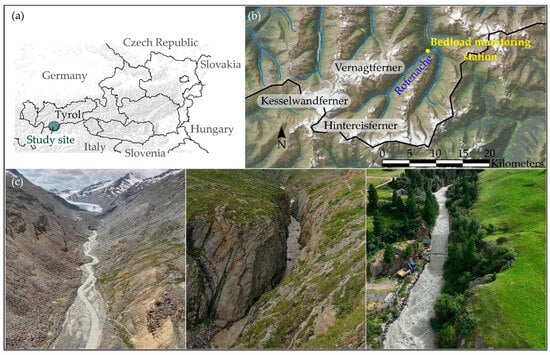
Figure 1.
(a) Location of the study site in Tyrol, Austria; (b) the Rofenache catchment with Vernagtferner, Kesselwandferner and Hintereisferner and the monitoring station; and (c) river sections of the Rofenache: braided (left), canyon (middle) and channelled (right).
The Rofenache is sourced by the Hintereisferner glacier, with a catchment area covering 98.1 km2. The distance from the source of the Rofenache to the monitoring station is 10.72 river-km (in 2025). A number of notable glacier groups are present within this catchment area, including the Hochjochferner, Hintereisferner, Kesselwandferner, Guslarferner and Vernagtferner. The three primary glaciers (Hintereisferner, Kesselwandferner and Vernagtferner) have glacier coverage of about 15% [50] of the catchment area. Starting as a braided river downstream from the Hintereisferner glacier, the Rofenache transitions to a single-thread, bedrock channel (canyon) near the Vent/Rofenache station (see Figure 1c).
The Rofenache exhibits a typical glacial discharge regime (according to Parde [51]) with strong daily and seasonal fluctuations and its highest runoff in July and August. The study area is geologically categorised as part of the crystalline rocks of the Central Alps and is predominantly composed of paragneiss and mica schist [52].
2.2. Sedimentological and Hydrological Data
In Vent, the measurements were carried out on behalf of (and in co-operation with) the Tyrolean Hydrographic Service. Bedload measurements were conducted at the Rofenache monitoring station using direct (mobile net sampler, named ‘Vent Sampler 0.5 (VS 0.5)’—a modified Bunte-type sampler [53], Figure 2a,b) and indirect (plate geophone system, [54,55]; Figure 2c) bedload measurement methods. By combining both approaches, an integrative approach was used to calculate bedload transport and bedload yield in a given time period. In addition to the bedload measurement devices, the following measuring instruments were installed and are in use: turbidity sensors, an ombrometer, flow velocity sensors, radar sensors for water levels and a gauge for water levels (see Figure 2c).
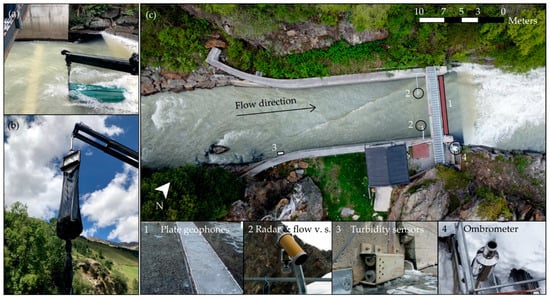
Figure 2.
Vent/Rofenache monitoring station, equipped with the direct bedload measurement system using the mobile net sampler VS 0.5 with the net mesh sizes: (a) 4 mm and (b) 8 mm; (c) the indirect bedload measurement system employing a (1) plate geophone system and the following devices: (2) radar and flow velocity sensors, (3) turbidity sensors and (4) an ombrometer.
Direct measurement methods were used to determine the mass and texture of the transported bedload material. In contrast, indirect bedload measurement did not directly measure the desired parameters of bedload transport. Instead, the geophone impulses were measured as a proxy variable. Geophones are devices which record vibrations, originating from the field of seismic subsurface exploration. These devices were affixed to the underside of steel plates for the purpose of indirectly measuring bedload transport. The steel plates were installed in a watertight manner across the entire river profile at the channel bed and the vibrations generated by the transport of bedload over the plates was registered by the geophone. This automated measuring method enabled the continuous recording of bedload transport across the entire width of the river [39,40,45,54,55,56]. Plate geophones were used to measure bedload particles greater than 8 mm [57], and due to this measurement accuracy, the bedload yields were also calculated. For the calculation of the bedload yields and calibration of the plate geophones, 221 direct measurements were undertaken with the VS 0.5. The VS 0.5 is characterised by its interchangeable frame, to which the net is attached [57]. This configuration enables the expeditious replacement of nets, in accordance with the prevailing bedload and water discharge conditions. The nets were constructed with varying mesh sizes. The direct measurement of bedload transport facilitates the identification of specific bedload operations (e.g., grading curves) and the determination of texture after a sieving process [45,54].
2.3. Hysteresis Analysis
A hysteresis analysis of the water discharge and bedload transport was applied for a comprehensive analysis of the bedload transport processes. This methodology can be found in the literature relating to sediments, mainly for suspended sediments [48,58,59]. However, there are studies with hysteretic bedload events [19,59,60,61]. In order to analyse hysteresis events between bedload transport and water discharge, the following data were utilised: water discharge, bedload transport greater than 8 mm, precipitation and air temperature. The identification of hysteresis events was achieved through the analysis of deviations from the mean daily discharge pattern, whereby the mean daily pattern was calculated by grouping the discharge data by the hour, with deviations being determined as the difference between the actual discharge and the mean daily pattern. A threshold for significant deviations was set at the 90th percentile of the deviations and events were identified as periods during which the deviations exceeded this threshold. For each identified event, the hysteresis direction was determined by calculating the area beneath the curve of bedload transport against water discharge. The direction was classified as ‘clockwise’, ‘counterclockwise’ or ‘linear’, based on the area. Events lasting less than four hours, or having fewer than 100 geophone impulses, were excluded from the analysis. The causes of hysteresis events were determined by analysing the meteorological conditions at the beginning and during the event. An event is classified as being caused by rain if precipitation occurred before the maximum discharge. An event is classified as being caused by a temperature increase if the temperature rose during the event and the maximum temperature exceeded 10 °C without any precipitation occurring.
2.4. Glacier Data
To assess glacier retreat, changes in length and discharge, as well as mass balance, are commonly used [62]. The length and mass balance of glaciers within the Rofenache catchment area have been the focus of numerous research initiatives over several seasons. The measurement of changes in glacier length is determined by the distance from fixed points to the glacier tongue at the termination of the melting period [63]. The mass balance of a glacier is measured by direct methods of glaciology [64], with additional applications of ablation stakes and snow pits being used to determine the accumulation of snow and water content [65]. In the Rofenache catchment, length changes for the Hintereisferner and Kesselwandferner glaciers have been recorded since 1891, with mass balances being recorded since 1952/53; this is the longest known mass balance monitoring period in glaciology [63].
3. Results
3.1. Sedimentological and Hydrological Analysis
The mean monthly values of precipitation and air temperature, and daily discharge and bedload transport, are shown in Figure 3 for the years 2010 to 2023.
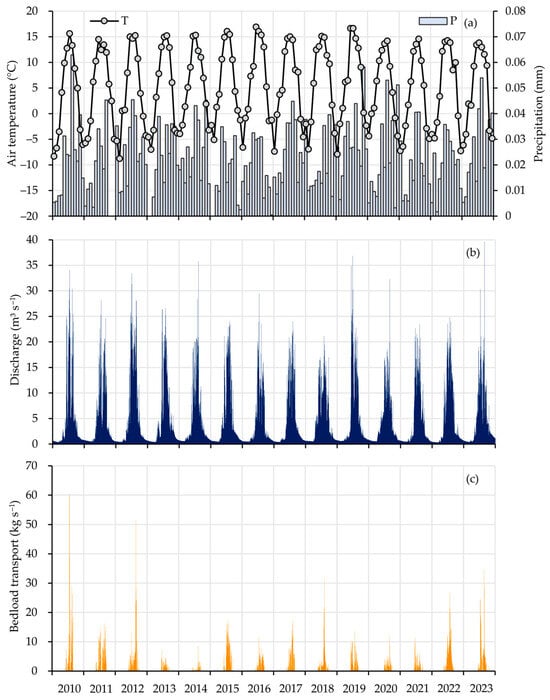
Figure 3.
Sedimentological and hydrological values at the Vent/Rofenache monitoring station, 2010–2023; monthly air temperature (T) in a black line with grey dots and monthly precipitation (P) in blue bars (a), daily discharge curve in blue (b) and daily bedload transport curve in orange (c).
In the period 2010–2023, the maximum monthly mean air temperature was 17 °C and the minimum was −8.8 °C. In addition, the cold seasons became milder. Compared to the long-term average of 1961–1990, from a weather station about 9 km away, temperatures have risen, especially in the summer months. The maximum deviation from the long-term average was more than 70% in June 2016. The hydrograph demonstrates that the flow rate is influenced by temperature and precipitation, indicating that bedload transport is not solely regulated by the flow dynamics, but also by the factors that induce the flow. Specifically, rising temperatures result in increased glacier and snow melt, leading to increased water discharge. This underscores the pivotal role of temperature in dictating the hydrological processes within this specific catchment area. This observation indicates that additional factors must be considered to achieve a comprehensive understanding of the underlying processes. The bedload yield is determined by means of a geophone pulse-bedload transport relationship with the combination of direct and indirect measurements from 2010 to 2023. For bedload, a linear relationship of y = 3.010x is obtained, with a correlation coefficient of 0.87. This results in a maximum bedload yield of 59,000 tons in 2010 and a mean annual bedload yield of 14,300 tons from 2010 to 2023. The mean grain size dm fluctuates significantly between 2010 and 2023, ranging from 14.0 to116.4 mm. This variability is attributed to the measurement process, which was conducted within a discharge spectrum ranging from 4.3 to 45.4 m3s−1.
3.2. Hysteresis Analysis of Bedload Transport and Water Discharge Relationship
The hysteresis analysis resulted in a total of 730 detected hysteresis events, which were divided into three categories: clockwise, counterclockwise and linear. The maximum duration of a hysteresis event was recorded as 14 days and 21 h, while the shortest recorded duration was 4 h, with 20 instances of hysteresis events. Figure 4 presents a hysteresis analysis from 2010 to 2023, categorising the total number of hysteresis and the classification of counterclockwise and clockwise hysteresis. For the Vent/Rofenache monitoring station, it was found that counterclockwise hystereses usually occur the most. The months in which hystereses generally occur are between May and October, with the highest number of events occurring in August. As demonstrated in Figure 4a,b, the period in which hysteresis events occur, i.e., bedload transport, is observed to increase over the years. From 2010 to 2014, the period was between three and four months, and from 2015 to 2018 it was between four and five months. In 2017, 2018 and 2022, bedload transport began as early as May, and in 2020, it was observed to extend into October. Subsequently, the impact of precipitation and temperature increase on the formation of the different hysteresis types was analysed. Therefore, in addition to categorising clockwise and counterclockwise hysteresis, the analysis was also extended to temperature and rainfall-induced hysteresis (Figure 4c). Of the total number of 130 clockwise events, 32 were attributed to rain (Hyst.R) and 96 to temperature increase (Hyst.T). A total of 600 counterclockwise hysteresis events were detected. Of these, 217 events were attributable to Hyst.R and 374 events to Hyst.T. No linear hysteresis events were detected. The number of hysteresis events that were neither Hyst.T nor Hyst.R (referred to as ‘Hyst.0’) was 11. In total, 249 events were recorded due to rain and 470 events due to temperature rise. The results obtained demonstrate a clear predominance of temperature-induced hysteresis (Figure 4c).
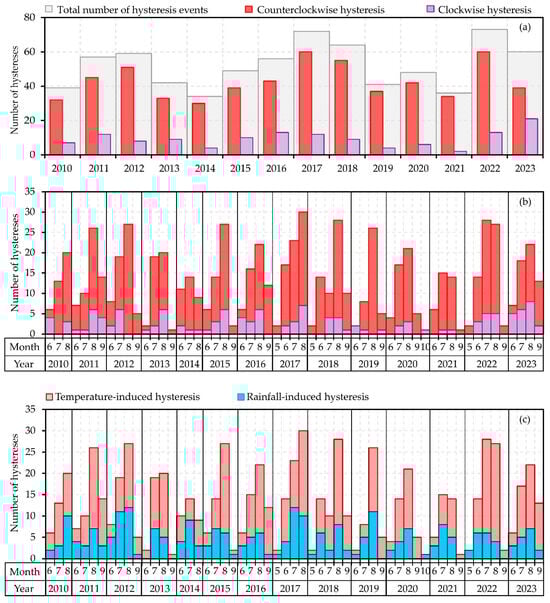
Figure 4.
The total number of hysteresis events (in grey bars), categorised as counterclockwise (in red bars) and clockwise (in purple bars) (a), per months and years (b) and the number of temperature-induced (in light red bars) as well as rainfall-induced (in light blue bars) hystereses per months and years (c) at the Vent/Rofenache monitoring station from 2010 to 2023.
3.3. Interaction of Annual Bedload Dynamics and Glacier Mass Balances
Figure 5 presents a comparison between the measured bedload and the glacier mass balance from 2010 to 2023. Additionally, the graph distinguishes between the total number of counterclockwise hysteresis events and those hysteresis events specifically induced by temperature. The bedload yields, represented by orange bars, show the annual bedload yield in tons per year, ranging from 6400 tons in 2014 to 59,000 tons in 2010. The total number of counterclockwise hysteresis events is depicted by a continuous red line. Additionally, the total number of temperature-induced hysteresis events is illustrated by the dotted red line. The average glacier mass balance of the three primary glaciers (Hintereisferner, Vernagtferner and Kesselwandferner) is shown in millimetres of water equivalent (w.e.) by a blue line, reflecting the annual fluctuations in glacier mass. In 2014, the mass balance was positive (+64 mm w.e.), and in 2022, the highest mass loss was recorded (−3123 mm w.e.) [50]. As demonstrated in Figure 4c, the temperature-induced hysteresis is the dominant process, and its course is analogous to that of the glacier mass balance and the bedload yield in Figure 5. This observation suggests a strong correlation between the parameters of glacier retreat, temperature-induced hysteresis and the bedload balance in the Rofenache catchment.
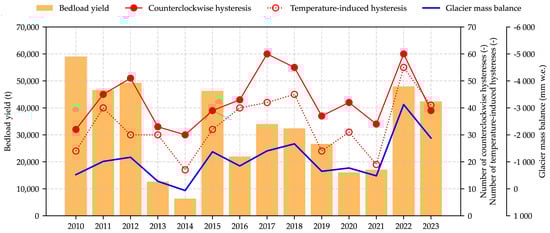
Figure 5.
Comparison of the bedload yields (tons per year in orange bars), the total number of counterclockwise hysteresis events (red line) and the total number of temperature-induced hysteresis (red dotted line) with the average glacier mass balance of the three main glaciers (Hintereisferner, Vernagtferner and Kesselwandferner [50] in millimetres of water equivalent in the blue line) from 2010 to 2023, in relation to the Vent/Rofenache monitoring station.
4. Discussion
This analysis examines the bedload transport and water discharge processes in a glaciated catchment over a period of 14 years, placing the results in the context of current research, particularly with regard to climate change, hydrological variability and long-term trends in bedload transport. The analysis evaluates the causes of hysteresis—rainfall or temperature increase—as well as the direction of hysteresis (clockwise or counterclockwise). The results from the Vent/Rofenache monitoring station show that the majority of hysteresis events occur in a counterclockwise direction, with a significant proportion of these events being caused by temperature increases during the hysteresis event. This finding indicates that variations in air temperature significantly influence the dynamics of bedload transport and discharge within this specific catchment area. In contrast, clockwise hysteresis events are less frequent and are also more often caused by temperature increase than by rainfall. In particular, the absence of linear hysteresis events (no hysteresis) indicates a continuous non-linearity of the hydrological processes studied and underlines the need for indirect measurement systems to capture bedload transport in such sensitive systems. In the literature, analyses have already been conducted that demonstrate the significance of these processes in other catchments. For instance, the study by Savi et al. [15] demonstrated that sediment dynamics in glaciated catchments are strongly influenced by glacier melt. It is anticipated that sediment transport will continue to increase until peak water and can be intensified by increased precipitation. Mao et al. [19] confirmed that the direction of hysteresis indicates the origin of the sediments. Clockwise hysteresis indicates that the sediments originate from nearby sources (e.g., bank erosion, channel connections). Conversely, counterclockwise hysteresis signifies a delayed release of sediments from more distant glacial or moraine areas. The study by Aigner et al. [56] also identified a distinct counterclockwise hysteresis. In this study, the phenomenon was attributed to the upstream influence of a power plant, with consequent sediment deposition in the residual flow section. The sediments were only transported after a significant delay following the discharge event. The study by Comiti et al. [17] emphasised the high variability of bedload transport during the melt period, a finding of central importance to the interpretation of the present results.
4.1. Bedload Transport and Water Discharge Dynamics
Analysing the data of the relationship between bedload transport and water discharge, by employing a hysteresis analysis, reveals several key trends. Firstly, counterclockwise hysteresis directions predominate in the analysed events. These tend to occur in connection with slower sediment supply from glacier areas, which is consistent with the results in Mao et al. [19].
Secondly, water discharge and sediment dynamics are mainly influenced by rain and temperature. Rain-induced hysteresis primarily occurs during the summer months, when substantial rainfall mobilises the available sediment. This finding aligns with the results reported in Zhang et al. [66], which demonstrated that heavy precipitation amplifies hydrological variability and leads to increased sediment transport. Temperature-induced hysteresis manifests more frequently during extended periods of melting, particularly in midsummer, when glacier melt constitutes the primary source of sediment transport.
4.2. Future Perspectives Related to the Interaction of Long-Term Bedload Dynamics and Glacier Mass Balances
As illustrated in Figure 5, the annual glacier mass balances, bedload yields and bedload–water discharge dynamics (the hysteresis events) are intertwined. The catchment area of the Rofenache is predominantly characterised by the runoff of glacier and snowmelt. Consequently, the glacier mass balances, and bedload yields exhibit a high degree of similarity over time, with a positive glacier mass balance also resulting in low bedload yields in the same year. The air temperature in the catchment area is another important variable that influences glaciers and, therefore, bedload transport processes. The findings indicate a high degree of similarity between the trend of the glacier balance, the bedload yield and the number of temperature-induced hystereses. This observation underscores the significant interaction between these parameters and emphasises the predominant process driver. However, it is important to note that other processes are also involved, as evidenced by the 2010 results. The bedload yield in 2010 was considerably higher than in 2022, and yet the data from the glacier mass balance and the hysteresis analysis indicate low values. This can be attributed to sediment availability and precipitation. Extreme precipitation events, such as those observed in 2010, result in elevated bedload transport rates due to the activation of additional bedload sources, including sediments from riverbanks, tributaries and the riverbed itself, caused by the breakage of an armoured surface layer. As glaciers progressively retreat and disappear in the near future, the proportion of runoff from melting processes will decrease [13] and precipitation will become increasingly decisive for bedload and runoff processes. Furthermore, the retreat of glaciers will increasingly release glaciofluvial bedload sources, and high precipitation intensities will be necessary for this bedload to be transported downstream. The influences of these factors and assumptions are twofold: first, they shape the catchment area of the Rofenache, and second, they determine the processes in the downstream reaches.
In the Rofenache catchment, temperature-induced hysteresis events are of particular significance, given that discharge is predominantly driven by glacier melt processes. However, this runoff will decrease over time, due to the anticipated ‘peak water moment’ being exceeded [13]. In this context, future outlooks for the Alpine region were evaluated by Compagno et al. [67]. Their evaluation was based on the GloGEMflow ice flow model with climate projections from CMIP6 and for future projections (2020–2100). They used 128 CMIP6 global circulation models (GCMs), which predict global warming of +1.0 °C, +1.5 °C and +2.0 °C in the 21st century compared to pre-industrial levels. The study indicates a progressively decreasing runoff from glacier melt in the coming decades. At the Vent/Rofenache monitoring station, this is evident in the data from 2022 to 2023. The majority of hysteresis events exhibit a counterclockwise orientation and are more temperature-induced, thereby raising concerns about the potential implications of a scenario when melt processes are no longer present during summer months. A decrease in glacier meltwater results in reduced bedload transport [15,17], and yet, during periods of rain and extreme events, a substantial amount of bedload becomes available, leading to significant transport rates that can persist even after the initial event. Haslinger et al. [68] pointed out that small catchments, such as the Rofenache, should be subject to climate adaptation measures for flood management because of the increase in heavy rainfall events. Furthermore, in the Rofenache catchment, the snowmelt period is becoming longer, extending from three months up to five months (Figure 4b). This alteration in the duration of the snowmelt period is anticipated to exert a profound influence on the hydrological and sediment transport dynamics within the catchment area.
5. Conclusions
The analysis conducted provides valuable insights into the interaction between long-term bedload dynamics and glacier mass balances. The analysis demonstrates that both rain and temperature increase are significant drivers of hysteresis events, with temperature increase being particularly important. The influence of temperature on sediment dynamics is increasing because of two main factors: the lengthening of the melt season and the increase in water discharge variability in the short-term. In the long-term perspective, rainfall events are becoming increasingly important for bedload transport as glaciers retreat, which is consistent with projections of future precipitation patterns [68]. The number of hysteresis events that are not caused by either rain or temperature increase is relatively small, highlighting the importance of rain and temperature as the main factors for the observed hysteresis events.
In summary, this study shows that the analysis of hysteresis patterns of bedload transport and water discharge is a valuable method for identifying hydrological changes in glaciated catchments. The findings of this study corroborate earlier research but also highlight substantial alterations in sediment availability due to ongoing glacier retreat and a potential increase in extreme hydrological events.
Author Contributions
Conceptualization, S.S. and R.R.; methodology, S.S., M.P., A.L., D.S.-P., M.T., H.H. and R.R.; validation, S.S., M.P., M.T. and R.R.; formal analysis, S.S. and R.R.; investigation, S.S., A.L., D.S.-P. and R.R.; resources, R.R.; data curation, S.S. and R.R.; writing—original draft preparation, S.S., writing—review and editing, S.S., M.P., A.L., D.S.-P., M.T., H.H. and R.R.; visualisation, S.S. and A.L.; supervision, M.T., H.H. and R.R.; project administration, H.H. and R.R.; funding acquisition, S.S., M.P., H.H. and R.R. All authors have read and agreed to the published version of the manuscript.
Funding
This research was funded by the research project FRAGILE of the 16th ACRP call (Austrian climate research programme) by the Austrian Research Promotion Agency (FFG), grant number FO999913171. The measurements were funded by the Tyrolian provincial government and the Austrian Federal Ministry of Agriculture and Forestry, Climate and Environmental Protection, Regions and Water Management.
Data Availability Statement
The raw data supporting the conclusions of this article will be made available by the authors on request.
Acknowledgments
The authors would also like to thank J. Aigner for his help in data acquisition and helpful discussions. Without his support, this research would not have been possible. Additionally, we express our gratitude to the Hydrographic Service of Tyrol for their excellent cooperation and support with the monitoring station. Their assistance was crucial to the success of this study. During the preparation of this manuscript/study, the author(s) used DeepL, ChatGPT and AcademicAI for the purposes of spelling and rephrasing. The authors have reviewed and edited the output and take full responsibility for the content of this publication.
Conflicts of Interest
The authors declare no conflicts of interest. The funders had no role in the design of the study in the collection, analysis or interpretation of data; in the writing of the manuscript; or in the decision to publish the results.
References
- Hallet, B.; Hunter, L.; Bogen, J. Rates of Erosion and Sediment Evacuation by Glaciers: A Review of Field Data and Their Implications. Glob. Planet. Change 1996, 12, 213–235. [Google Scholar] [CrossRef]
- Church, M.; Ryder, J.M. Paraglacial Sedimentation: A Consideration of Fluvial Processes Conditioned by Glaciation. Geol. Soc. Am. Bull. 1972, 83, 3059–3072. [Google Scholar] [CrossRef]
- Lane, S.N.; Bakker, M.; Gabbud, C.; Micheletti, N.; Saugy, J. Sediment Export, Transient Landscape Response and Catchment-Scale Connectivity Following Rapid Climate Warming and Alpine Glacier Recession. Geomorphology 2017, 277, 210–227. [Google Scholar] [CrossRef]
- Pfeffer, W.T.; Arendt, A.A.; Bliss, A.; Bolch, T.; Cogley, J.G.; Gardner, A.S.; Hagen, J.; Hock, R.; Kaser, G.; Kienholz, C.; et al. The Randolph Glacier Inventory: A Globally Complete Inventory of Glaciers. J. Glaciol. 2017, 60, 537–552. [Google Scholar] [CrossRef]
- Hugonnet, R.; McNabb, R.; Berthier, E.; Menounos, B.; Nuth, C.; Girod, L.; Farinotti, D.; Huss, M.; Dussaillant, I.; Brun, F.; et al. Accelerated Global Glacier Mass Loss in the Early Twenty-First Century. Nature 2021, 592, 726–731. [Google Scholar] [CrossRef]
- Fischer, A.; Seiser, B.; Stocker Waldhuber, M.; Mitterer, C.; Abermann, J. Tracing Glacier Changes in Austria from the Little Ice Age to the Present Using a Lidar-Based High-Resolution Glacier Inventory in Austria. Cryosphere 2015, 9, 753–766. [Google Scholar] [CrossRef]
- Zanoner, T.; Carton, A.; Seppi, R.; Carturan, L.; Baroni, C.; Salvatore, M.C.; Zumiani, M. Little Ice Age Mapping as a Tool for Identifying Hazard in the Paraglacial Environment: The Case Study of Trentino (Eastern Italian Alps). Geomorphology 2017, 295, 551–562. [Google Scholar] [CrossRef]
- Haeberli, W.; Wegmann, M.; Mühl, D.V. Slope Stability Problems Related to Glacier Shrinkage and Permafrost Degradation in the Alps. Schweizerische Geologische Gesellschaft: Basel, Switzerland, 1997. [Google Scholar]
- Haeberli, W. Frequency and Characteristics of Glacier Floods in the Swiss Alps. Ann. Glaciol. 1983, 4, 85–90. [Google Scholar] [CrossRef]
- Klimeš, J.; Novotný, J.; Novotná, I.; de Urries, B.J.; Vilímek, V.; Emmer, A.; Strozzi, T.; Kusák, M.; Cochachin Rapre, A.; Hartvich, F.; et al. Landslides in Moraines as Triggers of Glacial Lake Outburst Floods: Example from Palcacocha Lake (Cordillera Blanca, Peru). Landslides 2016, 13, 1461–1477. [Google Scholar] [CrossRef]
- Vilímek, V.; Emmer, A.; Huggel, C.; Schaub, Y.; Würmli, S. Database of Glacial Lake Outburst Floods (GLOFs)–Ipl Project No. 179. Landslides 2013, 11, 161–165. [Google Scholar] [CrossRef]
- Richardson, S.D.; Reynolds, J.M. An Overview of Glacial Hazards in the Himalayas. Quat. Int. 2000, 65–66, 31–47. [Google Scholar] [CrossRef]
- Huss, M.; Hock, R. Global-Scale Hydrological Response to Future Glacier Mass Loss. Nat. Clim. Change 2018, 8, 135–140. [Google Scholar] [CrossRef]
- Lambrecht, A.; Mayer, C. Temporal Variability of the Non-Steady Contribution from Glaciers to Water Discharge in Western Austria. J. Hydrol. 2009, 376, 353–361. [Google Scholar] [CrossRef]
- Savi, S.; Pitscheider, F.; Engel, M.; Coviello, V.; Strecker, M.R.; Comiti, F. Sediment Export from an Alpine Proglacial Area under a Changing Climate: Budgets, Rates, and Geomorphological Processes. Geomorphology 2024, 462, 109343. [Google Scholar] [CrossRef]
- Buter, A.; Heckmann, T.; Filisetti, L.; Savi, S.; Mao, L.; Gems, B.; .Comiti, F. Effects of Catchment Characteristics and Hydro-Meteorological Scenarios on Sediment Connectivity in Glacierised Catchments. Geomorphology 2022, 402, 108128. [Google Scholar] [CrossRef]
- Comiti, F.; Mao, L.; Penna, D.; Dell’Agnese, A.; Engel, M.; Rathburn, S.; Cavalli, M. Glacier Melt Runoff Controls Bedload Transport in Alpine Catchments. Earth Planet. Sci. Lett. 2019, 520, 77–86. [Google Scholar] [CrossRef]
- Coviello, V.; Vignoli, G.; Simoni, S.; Bertoldi, W.; Engel, M.; Buter, A.; Marchetti, G.; Andreoli, A.; Savi, S.; Comiti, F. Bedload Fluxes in a Glacier-Fed River at Multiple Temporal Scales. Water Resour. Res. 2022, 58, e2021WR031873. [Google Scholar] [CrossRef]
- Mao, L.; Dell’Agnese, A.; Huincache, C.; Penna, D.; Engel, M.; Niedrist, G.; Comiti, F. Bedload Hysteresis in a Glacier-Fed Mountain River. Earth Surf. Process. Landf. 2014, 39, 964–976. [Google Scholar] [CrossRef]
- Carrillo, R.; Mao, L. Coupling Sediment Transport Dynamics with Sediment and Discharge Sources in a Glacial Andean Basin. Water 2020, 12, 3452. [Google Scholar] [CrossRef]
- Gomez, B.; Soar, P.J. Bedload Transport: Beyond Intractability. R. Soc. Open Sci. 2022, 9, 211932. [Google Scholar] [CrossRef]
- Ancey, C. Bedload Transport: A Walk between Randomness and Determinism. Part 1. The State of the Art. J. Hydraul. Res. 2020, 58, 1–17. [Google Scholar] [CrossRef]
- Rickenmann, D.; Turowski, J.M.; Fritschi, B.; Klaiber, A.; Ludwig, A. Bedload Transport Measurements at the Erlenbach Stream with Geophones and Automated Basket Samplers. Earth Surf. Process. Landf. 2012, 37, 1000–1011. [Google Scholar] [CrossRef]
- Rainato, R.; Mao, L.; Picco, L. The Effects of Low-Magnitude Flow Conditions on Bedload Mobility in a Steep Mountain Stream. Geomorphology 2020, 367, 107345. [Google Scholar] [CrossRef]
- Antoniazza, G.; Nicollier, T.; Boss, S.; Mettra, F.; Badoux, A.; Schaefli, B.; Rickenmann, D.; Lane, S.N. Hydrological Drivers of Bedload Transport in an Alpine Watershed. Water Resour. Res. 2022, 58, 2021WR030663. [Google Scholar] [CrossRef]
- Nicollier, T.; Antoniazza, G.; Rickenmann, D.; Ammann, L.; Kirchner, J. Toward a General Calibration of the Swiss Plate Geophone System for Fractional Bedload Transport. Earth Surf. Dyn. 2022, 10, 929–951. [Google Scholar] [CrossRef]
- Rickenmann, D.; Fritschi, B. Bedload Transport Measurements with Impact Plate Geophones in Two Austrian Mountain Streams (Fischbach and Ruetz): System Calibration, Grain Size Estimation, and Environmental Signal Pick-Up. Earth Surf. Dyn. 2017, 5, 669–687. [Google Scholar] [CrossRef]
- Chen, Z.; He, S.; Nicollier, T.; Ammann, L.; Badoux, A.; Rickenmann, D. Finite Element Modelling of the Swiss Plate Geophone Bedload Monitoring System. J. Hydraul. Res. 2022, 60, 792–810. [Google Scholar] [CrossRef]
- Goto, K.; Itoh, T.; Nagayama, T.; Kasai, M.; Marutani, T. Experimental and Theoretical Tools for Estimating Bedload Transport Using a Japanese Pipe Hydrophone. Int. J. Eros. Control Eng. 2014, 7, 101–110. [Google Scholar] [CrossRef]
- Harsanto, P.; Ikhsan, J.; Legono, D.; Pamudji Rahardjo, A.; Tsutsumi, D. Sediment Transport Pre-Measurement as Revealed by the Hydrophone Monitoring Technique at a Volcanic River. IOP Conf. Ser. Earth Environ. Sci. 2020, 437, 012050. [Google Scholar] [CrossRef]
- Geay, T.; Belleudy, P.; Gervaise, C.; Habersack, H.; Aigner, J.; Kreisler, A.; Seitz, H.; Laronne, J.B. Passive Acoustic Monitoring of Bed Load Discharge in a Large Gravel Bed River. J. Geophys. Res. Earth Surf. 2017, 122, 528–545. [Google Scholar] [CrossRef]
- Seo, J.; Kim, K.; Woo, C.; Changwoo, L.; Lee, H. Evaluation of Field Application and Estimation of Bedload Discharge in the Forest Watershed Using the Hydrophone. J. Korea Acad. -Ind. Coop. Soc. 2020, 21, 807–818. [Google Scholar] [CrossRef]
- Marineau, M. Surrogate Bedload Monitoring Using Hydrophones in the Gravel-Bedded Cedar River, Washington. In Proceedings of the Hydraulic Measurements and Experimental Methods Conference, Snowbird, Utah, 12–15 August 2012. [Google Scholar]
- Marineau, M.; Wright, S.; Gaeuman, D.; Curran, C.; Stark, K.; Simeon, J.; Schenk, E. Overview of Five Recent Bedload Monitoring Field Experiments Using Hydrophones. In Proceedings of the SEDHYD, Reno, Nevada, 24–28 June 2019. [Google Scholar]
- Bakker, M.; Gimbert, F.; Geay, T.; Misset, C.; Zanker, S.; Recking, A. Field Application and Validation of a Seismic Bedload Transport Model. J. Geophys. Res. Earth Surf. 2020, 125, e2019JF005416. [Google Scholar] [CrossRef]
- Piantini, M.; Gimbert, F.; Bakker, M.; Recking, A.; Nanni, U. Using a Dense Seismic Array to Study Fluvial Processes in a Braided River Reach under Flood Conditions. LHB Hydrosci. J. 2022, 108, 2053314. [Google Scholar] [CrossRef]
- Antoniazza, G.; Nicollier, T.; Wyss, C.R.; Boss, S.; Rickenmann, D. Bedload Transport Monitoring in Alpine Rivers: Variability in Swiss Plate Geophone Response. Sensors 2020, 20, 4089. [Google Scholar] [CrossRef]
- Liébault, F.; Klotz, S.; Jantzi, H.; Ravanat, X. Monitoring Du Charriage Avec Une Trappe a Fente, Observatoire De Draix. Collect. Edytem 2017, 19, 221–226. [Google Scholar] [CrossRef]
- Rindler, R.; Schwarz, S.; Liedermann, M.; Shire-Peterlechner, D.; Kreisler, A.; Aigner, J.; Tritthart, M.; Habersack, H. Effective Transport Width—A Methodology to Describe the Spatial Variability of Bedload Transport. Int. J. Sediment. Res. 2023, 38, 294–301. [Google Scholar] [CrossRef]
- Schwarz, S.; Rindler, R.; Liedermann, M.; Shire-Peterlechner, D.; Lammer, A.; Tritthart, M.; Habersack, H. Challenges and Opportunities of Sediment Budgeting Using the River Sediment Budget Approach (Rsba): Three Cases in Austrian Gravel-Bed River Reaches. Geomorphology 2024, 455, 109182. [Google Scholar] [CrossRef]
- Wyss, C.R.; Rickenmann, D.; Fritschi, B.; Turowski, J.M.; Weitbrecht, V.; Boes, R.M. Measuring Bed Load Transport Rates by Grain-Size Fraction Using the Swiss Plate Geophone Signal at the Erlenbach. J. Hydraul. Eng. 2016, 142, 04016003. [Google Scholar] [CrossRef]
- Lammer, A.; Rindler, R.; Tritthart, M.; Liedermann, M.; Moser, M.; Shire-Peterlechner, D.; Schwarz, S.; Habersack, H. Evaluating the Performance of Transport Equations through Long-Term Records of Integrative Measured Bedload Data. Int. J. Sediment. Res. 2024, 40, 158–171. [Google Scholar] [CrossRef]
- Montgomery, D.R.; Buffington, J.M. Channel-reach morphology in mountain drainage basins. GSA Bull. 1997, 109, 596–611. [Google Scholar] [CrossRef]
- Hauer, C.; Pulg, U. The non-fluvial nature of Western Norwegian rivers and the implications for channel patterns and sediment composition. Catena 2018, 171, 83–98. [Google Scholar] [CrossRef]
- Kreisler, A.; Moser, M.; Aigner, J.; Rindler, R.; Tritthart, M.; Habersack, H. Analysis and Classification of Bedload Transport Events with Variable Process Characteristics. Geomorphology 2017, 291, 57–68. [Google Scholar] [CrossRef]
- Turowski, J.M.; Rickenmann, D.; Dadson, S.J. The Partitioning of the Total Sediment Load of a River into Suspended Load and Bedload: A Review of Empirical Data. Sedimentology 2010, 57, 1126–1146. [Google Scholar] [CrossRef]
- Williams, G.P. Sediment Concentration Versus Water Discharge during Single Hydrologic Events in Rivers. J. Hydrol. 1989, 111, 89–106. [Google Scholar] [CrossRef]
- Gunsolus, E.H.; Binns, A.D. Effect of Morphologic and Hydraulic Factors on Hysteresis of Sediment Transport Rates in Alluvial Streams. River Res. Appl. 2017, 34, 183–192. [Google Scholar] [CrossRef]
- Hassan, M.A.; Li, W.; Viparelli, E.; An, C.; Mitchell, A.J. Influence of Sediment Supply Timing on Bedload Transport and Bed Surface Texture during a Single Experimental Hydrograph in Gravel Bed Rivers. Water Resour. Res. 2023, 59, e2023WR035406. [Google Scholar] [CrossRef]
- WGMS. Fluctuations of Glaciers Database; World Glacier Monitoring Service (WGMS): Zurich, Switzerland, 2024. [Google Scholar] [CrossRef]
- Parde, M. Fleuves et Rivieres; Librairie Armand Colin: Paris, France, 1933. [Google Scholar]
- Schweigl, J. Neue geochronologische und isotopengeologische Daten zur voralpidischen Entwicklungsgeschichte im Ötztalkristallin (Ostaplen). In Jahrbuch der Geologischen Bundesanstalt; Geologische Bundesanstalt Wien: Vienna, Austria; Leipzig, Germany, 1995; Volume 138, pp. 131–149. [Google Scholar]
- Bunte, K.; Abt, S.R.; Potyondy, J.P.; Swingle, K.W. A Comparison of Coarse Bedload Transport Measured with Bedload Traps and Helley-Smith Samplers. Geodin. Acta 2012, 21, 53–66. [Google Scholar] [CrossRef]
- Habersack, H.; Kreisler, A.; Rindler, R.; Aigner, J.; Seitz, H.; Liedermann, M.; Laronne, J.B. Integrated Automatic and Continuous Bedload Monitoring in Gravel Bed Rivers. Geomorphology 2017, 291, 80–93. [Google Scholar] [CrossRef]
- Rickenmann, D.; Turowski, J.M.; Fritschi, B.; Wyss, C.R.; Laronne, J.B.; Barzilai, R.; Reid, I.; Kreisler, A.; Aigner, J.; Seitz, H.; et al. Bedload Transport Measurements with Impact Plate Geophones: Comparison of Sensor Calibration in Different Gravel-Bed Streams. Earth Surf. Process Landf. 2014, 39, 928–942. [Google Scholar] [CrossRef]
- Aigner, J.; Kreisler, A.; Rindler, R.; Hauer, C.; Habersack, H. Bedload Pulses in a Hydropower Affected Alpine Gravel Bed River. Geomorphology 2017, 291, 116–127. [Google Scholar] [CrossRef]
- Rindler, R.; Schwarz, S.; Lammer, A.; Shire-Peterlechner, D.; Gmeiner, P.; Liedermann, M.; Tritthart, M.; Habersack, H. From Glaciers to Large Rivers: Lessons and Insights from Long-Term Bedload Monitoring. Earth Surf. Process. Landf. 2025, 50, e70059. [Google Scholar] [CrossRef]
- Jing, T.; Zeng, Y.; Fang, N.; Dai, W.; Shi, Z. A Review of Suspended Sediment Hysteresis. Water Resour. Res. 2024, 61, e2024WR037216. [Google Scholar] [CrossRef]
- Bogen, J. The Hysteresis Effect of Sediment Transport Systems. Nor. Geogr. Tidsskr. Nor. J. Geogr. 1980, 34, 45–54. [Google Scholar] [CrossRef]
- Pretzlav, K.L.G.; Johnson, J.P.L.; Bradley, D.N. Smartrock Transport in a Mountain Stream: Bedload Hysteresis and Changing Thresholds of Motion. Water Resour. Res. 2020, 56, e2020WR028150. [Google Scholar] [CrossRef]
- Rickenmann, D. Bedload Transport Fluctuations, Flow Conditions, and Disequilibrium Ratio at the Swiss Erlenbach Stream: Results from 27 Years of High-Resolution Temporal Measurements. Earth Surf. Dyn. 2024, 12, 11–34. [Google Scholar] [CrossRef]
- Lemke, P.; Ren, J.; Alley, R.B.; Allison, I.; Carrasco, J.; Flato, G.; Fujii, Y.; Kaser, G.; Mote, P.; Thomas, R.H.; et al. Observations: Changes in Snow, Ice and Frozen Ground. In Climate Change 2007: The Physical Science Basis. Contribution of Working Group I to the Fourth Assessment Report of the Intergovernmental Panel on Climate Change; Solomon, S., Qin, D., Manning, M., Chen, Z., Marquis, M., Averyt, K.B., Tignor, M., Miller, H.L., Eds.; Cambridge Universitiy Press: Cambridge, UK; New York, NY, USA, 2007; pp. 339–383. [Google Scholar]
- Fischer, A. Long-Term Glacier Monitoring at the Lter Test Sites Hintereisferner, Kesselwandferner and Jamtalferner and Other Glaciers in Tyrol: A Source of Ancillary Information for Biological Succession Studies. Plant Ecol. Divers. 2013, 6, 537–547. [Google Scholar] [CrossRef]
- Hoinkes, H. Methoden und Möglichkeiten von Massenhaushaltsstudien auf Gletschern. Zeitrschrift Für. Gletscherkunde Und Glazialgeol. 1970, 6, 37–90. [Google Scholar]
- Pelto, M.S. The Impact of Sampling Density on Glacier Mass Balance Determination. Hydrol. Process. 2000, 14, 3215–3225. [Google Scholar] [CrossRef]
- Zhang, T.; Li, D.; East, A.E.; Kettner, A.J.; Best, J.; Ni, J.; Lu, X. Shifted Sediment-Transport Regimes by Climate Change and Amplified Hydrological Variability in Cryospherefed Rivers. Sci. Aadvances 2023, 9, eadi5019. [Google Scholar] [CrossRef]
- Compagno, L.; Eggs, S.; Huss, M.; Zekollari, H.; Farinotti, D. Brief Communication: Do 1.0, 1.5, or 2.0 °C Matter for the Future Evolution of Alpine Glaciers? Cryosphere 2021, 15, 2593–2599. [Google Scholar] [CrossRef]
- Haslinger, K.; Breinl, K.; Pavlin, L.; Pistotnik, G.; Bertola, M.; Olefs, M.; Greilinger, M.; Schoner, W.; Bloschl, G. Increasing Hourly Heavy Rainfall in Austria Reflected in Flood Changes. Nature 2025, 639, 667–672. [Google Scholar] [CrossRef] [PubMed]
Disclaimer/Publisher’s Note: The statements, opinions and data contained in all publications are solely those of the individual author(s) and contributor(s) and not of MDPI and/or the editor(s). MDPI and/or the editor(s) disclaim responsibility for any injury to people or property resulting from any ideas, methods, instructions or products referred to in the content. |
© 2025 by the authors. Licensee MDPI, Basel, Switzerland. This article is an open access article distributed under the terms and conditions of the Creative Commons Attribution (CC BY) license (https://creativecommons.org/licenses/by/4.0/).