Abstract
Currently, one of the major threats to cities is the escalating risk of flooding, which is attributed to the alteration of climate and hastened urbanization. The purpose of this study was to introduce the Strahler ordering method for simplifying drainage networks and to avoid randomness in developing flooding models. A coupled hydrodynamic model that combines SWMM and LISFLOOD-FP was developed to simulate urban inundation. Results showed that the coupled model had satisfactory applicability for waterlogging simulation. The Strahler ordering method could construct clear topological relations of the drainage network and showed good performance in drainage network simplification. Higher-density drainage networks could increase peak discharge and total volume of discharge, while decreasing the maximum water depth and the total inundation area. Taking “5.29” rainstorm events as an example, compared to Level 3, the relative rates of change in the total flow and peak flow of Level 2 and Level 1 networks are −33.18% and −23.29%. The total inundation area was decreased from 14.14 ha to 1.43 ha when the level of drainage network hierarchy was increased from Level 1 to Level 3. This study highlights the importance of re-assessment of current and future urban drainage networks for coping with the changes in urban floods induced by local and large-scale changes.
1. Introduction
Urban floods caused by rainstorms are one of the most common, dangerous, and destructive natural disasters [1,2]. Flood disasters exert significant adverse socioeconomic impacts, not only giving rise to substantial social and economic problems but also causing environmental and ecological damage [3,4,5]. Climate change and urbanization represent two of the most significant factors that present challenges to both present and future strategies for managing urban floods [3,6]. Urbanization leads to an increased vulnerability of urban areas to flooding [7,8]. Furthermore, urbanization not only results in modifications to surface flooding patterns but also exerts an influence on the planning and design of drainage systems [9]. Urbanization, along with intricate and mixed drainage systems, poses significant challenges in preventing flood damage.
To address these challenges, numerical simulations of flooding can offer valuable analysis. Hydrodynamic models can not only effectively detect the location of waterlogging, estimate the inundation area and depth, but also reflect the hydrological process in urban areas [4,10]. Numerous earlier research efforts have sought to tackle the short-term or even real-time spatiotemporal variability of urban flooding by focusing on just one key factor [11,12]. Wilson [13] utilized the LISFLOOD-FP model, which incorporates a 1D–2D approach, along with topographic data sourced from the Shuttle Radar Topography Mission, to simulate the inundation of seasonally flooded wetlands in the Amazonian region. Price and Vojinovic [14] proposed the adoption of the digital city concept for managing urban flood disasters, drawing inspiration from the tropical island of St. Maarten, one of the five landmasses comprising the Dutch Antilles. The flood hazard maps were simulated using the MIKE 11 flooding model package, developed by DHI Water and Environment.
The models SWMM and LISFLOOD-FP are both widely acknowledged as open-source and reliable tools for 1D sewer and 2D overland modeling, respectively, featuring straightforward model architectures. These two models do not rely on any business module and can provide a convenient way for researchers to simulate urban inundation. Another advantage over other models is that the LISFLOOD model can use the raster-based digital elevation model (DEM). It will prove particularly useful and convenient against the backdrop of the growing accessibility of high-resolution DEM in urban areas and the prevalent use of Geographic Information Systems (GIS). Nevertheless, aspects like severe weather and climate conditions, rising sea levels (particularly in coastal areas), and land subsidence have been taken into account, while the influence of drainage systems on hydrological responses has largely been overlooked. Underground drainage systems are crucial for managing waterlogging, and neglecting to take these systems into account can lead to unrealistic simulation outcomes [2]. Urban drainage constitutes a crucial component of city infrastructure, meticulously designed to efficiently convey excess water away from urban areas, thereby mitigating floods and maintaining an acceptable level of service [15]. The elaboration and alteration of the drainage network frequently constitutes an equally significant outcome of urbanization. The evaluation and assessment of the hydraulic capacity of urban drainage systems have gained increasing significance in the context of new urban development, given the potential intensification of flooding caused by heightened rainfall intensity due to climate change. It has been shown that drainage networks, including natural river systems, display distinctive structural characteristics, and these features play pivotal roles in shaping the urban hydrologic response. After conducting diagnostic tests on multiple large-scale flood events, Smith [16] concluded that the upward trend in flood peaks was due to the expansion of the drainage network and the subsequent amplification of the width function. Meanwhile, enhancing flood management in tandem with urban development, often achieved by upgrading drainage systems [17], can exert direct influences on flood hazards and vulnerability by modulating the surface and subsurface routing and conveyance mechanisms. Miller [18] emphasized that the region serviced by a drainage system serves as a more significant determinant of the hydrological runoff response than either the extent of impervious surface coverage or the type of development. Generally, drainage systems within urban watersheds are engineered for the efficient gathering and swift removal of water. Taking into account the impact of network topology on the resultant hydrographs of a catchment area, the layout of a drainage network emerges as a pivotal factor in mitigating the risk of flooding within urban areas.
More importantly, there is often little or no guidance for constructing drainage networks. Some flooding models do not take the drainage networks system into account. Here, we focus our attention on identifying patterns within the drainage network structures of urban watersheds that can be utilized to streamline [19], without compromising the performance of, rainfall-runoff models. Introducing new methods to eliminate the randomness of drainage network simplification is an urgent need. The distribution characteristics of urban drainage networks are similar to natural river systems. Both urban drainage networks and natural river systems follow the same convergence rules, where branch pipes merge into secondary pipelines, which in turn merge into the main pipeline. The Strahler ordering method is usually used for ranking natural river channels. The motivation of our paper is to explore whether it is possible to simplify the drainage network based on the Strahler ordering method. This gap in the current research is the focus of the present study, as we present a systematic approach to budget allocation for urban drainage systems in large developing cities that have grown with complex infrastructure.
The purpose of this study is to identify the impact of urban drainage network structures on hydrologic dynamics and urban inundation. Therefore, the main goals of the present research are (1) to propose a scientific method to simplify the complex high-density urban drainage networks in highly urbanized areas, (2) to develop a coupled hydrodynamic model that integrates the SWMM and LISFLOOD-FP models, enabling precise simulation of urban inundation scenarios, (3) to analyze characteristic drainage network properties in different structures, and (4) to analyze the impact of the drainage network structure on hydrologic and urban inundation responses. The methods and models are implemented in a typical urban area, the Chebei Watershed in Guangzhou, China.
2. Study Area and Data
2.1. Study Area
The Chebei Watershed, situated in Guangzhou City, China, covers an approximate area of 73.6 km2 (Figure 1). This area was selected to study the impact of the drainage network on urban flooding in the present work. The watershed has a subtropical maritime monsoon climate, with an average yearly temperature ranging from 20 to 22 °C and an average annual rainfall of 1720 mm. The watershed is generally low-lying, with highly urbanized areas and dense buildings. The watershed is usually vulnerable to waterlogging due to impervious surfaces that constitute 70% of the area, the low-lying terrain, and the low standards of the drainage system. The drainage systems in the Chebei Watershed are highly developed, and many of the primary junctions are located in low-lying regions, which makes them particularly susceptible to waterlogging. This often leads to disruptions in the road network. The regular instances of urban flooding in this region present a serious challenge for city management, making it crucial to evaluate the effectiveness of the drainage systems in this area.
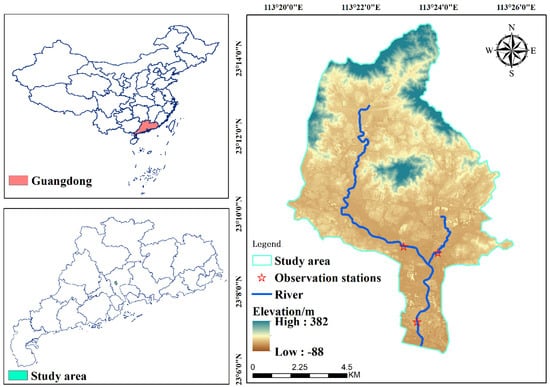
Figure 1.
Overview of the study region, including the locations of the observation stations available for monitoring within the Chebei Watershed catchment area.
2.2. Monitoring Data
A coupled hydrodynamic model was constructed using a digital elevation model (DEM) derived from the Guangzhou Land Resources and Planning Commission, featuring a spatial resolution of 2 m. Additional data sources comprised land-use information obtained from the National Geographic Center of China, as well as drainage network data sourced from the Guangzhou Water Affairs Bureau. In contrast to extensive watersheds or river basins that typically have monitoring stations to track yearly rainfall and runoff, the flow and rainfall data for the City’s sewer basin were gathered using automatic observation stations to define its flow patterns and hydrological characteristics. Rainfall data acted as the hydrological input for the SWMM model, and flow measurements were utilized to calibrate and assess the model’s performance. Rainfall data from May to August 2021 are shown in Figure 2.
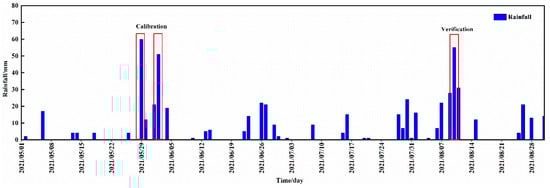
Figure 2.
Observation of rainfall in the study area.
3. Methodology
3.1. An Approach to Drainage Network Simplification by the Strahler Ordering Method
Our analysis is based on infrastructure drainage networks, where the pipe diameter determines the flow capacity (designed maximum flow) of the pipes. The simplifying of underground drainage networks is an important step in developing the model. There is no consensus method for simplifying drainage networks in the long term. Furthermore, some models do not take the drainage networks system into account. In order to eliminate the random factors in simplifying drainage networks, this study used the Strahler numbering method, normally used for river networks, and then incrementally removed higher-order sewer pipes from the numbered network to create functional sewer subnets.
Strahler numbers were developed in hydrology by Horton and Strahler, and they are used to assign hierarchies to branches of a mathematical tree [20]. the smallest tributaries (specifically, headwater streams in hydrology) are assigned a Strahler Order of “first-order”. When two first-order streams converge, they form a second-order stream, and this pattern continues sequentially. The confluence of two streams of the same order results in a stream of the next higher order. However, if a lower-order stream merges with a higher-order stream, the order of the resulting stream remains the same as the higher-order stream (Figure 3a).
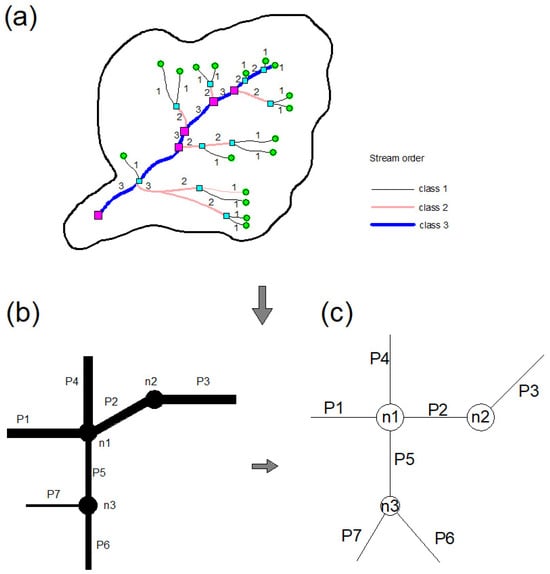
Figure 3.
Schematics of the Strahler ordering method applied in this study. (a) Schematic diagram of river network topology; (b) drainage networks in this schematic example; (c) the drainage network structure was simplified according to the Strahler ordering method.
The convergence in underground drainage networks is similar to that in surface river networks. Generally speaking, the water flow in the confluence of underground drainage networks first flows through branch pipelines to the secondary main pipe, where it is collected by the secondary main pipe and finally discharged into the river channel through the main pipe. Therefore, we propose a new method for underground drainage networks based on the Strahler ordering method:
Step 1, classify pipes by diameter to determine if all pipelines have “high-order pipe flow” and delete all branch pipelines that do not have “high-order pipe flow”.
Step 2, analyze the topology of all pipelines and classify pipes with “high-order pipe flow” according to their diameter (dividing the pipe network diameter from small to large into 300, 500 and 800 mm). Assign the Strahler value of the pipelines with “300 < pipe diameter < 500” to “class 1”; Assign a Strahler value of “class 2” to pipelines with “500 < pipe diameter < 800”, and assign a Strahler value of “class 3” to all pipelines with pipe diameter > 800. Thus, all drainage pipelines have a Strahler value, and each pipeline has a “high-order pipe flow”.
Step 3, the topological relationship of drainage networks should be analyzed according to the Strahler ordering numbers. The stream possessing the highest Strahler number within the network is the largest. Within the study area, networks of varying hierarchies were analyzed for diverse pipe diameters, commencing with the largest diameter and progressively adjusting the diameter threshold to “expand” the network from its skeletal framework to its entirety (Figure 3b,c).
Through the above three steps, it is possible to reasonably simplify the complex high-density urban drainage network in highly urbanized areas.
The original underground drainage network in the Chebei Watershed is complex and dense (Figure 4a). If it is directly applied to the flood model, it will seriously complicate and reduce the computational speed of the model. Based on the Strahler ordering method, the original 95,219 pipes and 95,318 nodes were simplified to 604 and 606 (Figure 4b).
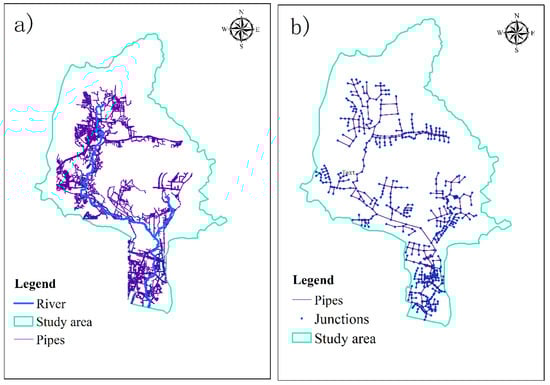
Figure 4.
The schematic diagram of pipe network structure before (a) and after (b) optimization.
After assigning the hierarchy for pipes, we used three structures to represent the degree of drainage network simplification. A Level 1 drainage structure (Level 1) represents the drainage networks including class 3 pipes, a Level 2 drainage structure (Level 2) represents the drainage include class 3 and class 2 pipes, and a Level 3 drainage structure (Level 3) represents the drainage includes class 3, 2 and 1 pipes. Next, we considered impact of drainage networks on urban flooding under these three structures. Figure 5 illustrates the entire watershed with different drainage network structures.
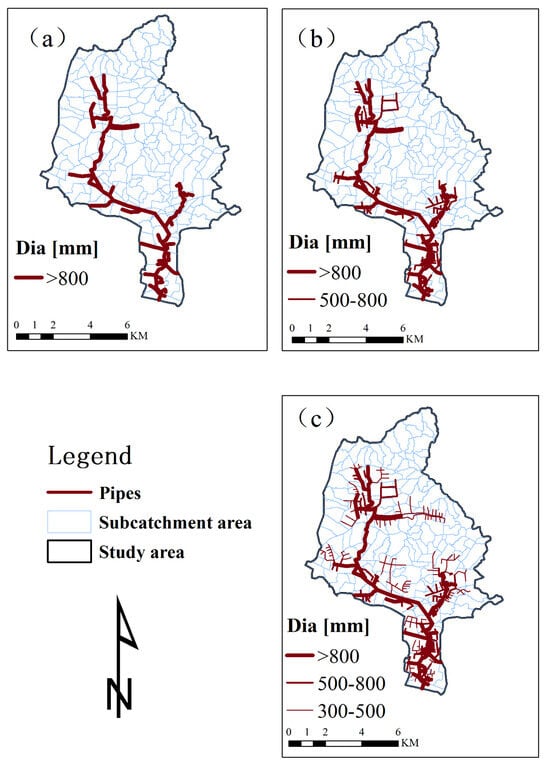
Figure 5.
Different drainage network structures in the Chebei Watershed. (a) Level 1 drainage network structure, (b) Level 2 drainage network structure, (c) Level 3 drainage network structure.
3.2. SWMM and LISFLOOD-FP Models
The Storm Water Management Model (SWMM) is a free and open-source program created by the United States Environmental Protection Agency (USEPA) designed to model surface water flows in urban drainage systems. SWMM is a model for rainfall-runoff and hydraulic routing that takes rainfall as its input and directs runoff (the amount of rainfall that does not infiltrate) across the land, through stormwater pipes, wetlands, detention ponds, and surface channels. In SWMM, unsteady flow propagation is represented using the De Saint-Venant (DSV) partial differential equations, which account for the conservation of mass and momentum in flow:
Simultaneous solution of DSV equations for each conduit, coupled with the continuity equation, gives the following:
At every network node, it offers insights into the changes in water levels and flow discharges over both space and time across the network. In Equations (2) and (3), H is the nodal piezometric head (sum of geodetic elevation and water level), is the net inflow to the node (inflow–outflow). is defined as the ‘node assembly’ surface area and is calculated based on the horizontal surface area of both the node (when available) and half the length of each conduit linked to the node itself [21,22]. The SWMM model is designed to simulate the hydrodynamics of one-dimensional rainwater drainage systems. Being an open-source management model, it allows for secondary development. This capability was utilized to integrate the SWMM with the LISFLOOD-FP model.
LISFLOOD-FP is a raster-based hydraulic model first developed by Bates and De Roo [23]. The model is capable of concurrently simulating one-dimensional river dynamics and two-dimensional overland water flow by utilizing the 1D Saint-Venant equations for the river and the 2D shallow water equations for the overland flow. It is divided into two components: channel flow and floodplain flow. Channel flow is managed through a 1D method that effectively represents the downstream movement of a flood wave and the flow’s reaction to the slope of the free surface. This can be articulated using continuity and momentum equations, as follows:
where is the flow rate per unit volume within the channel, refers to the cross-sectional area of the flow, q is the influx into the channel from various other sources (i.e., from the floodplain or possibly tributary channels), is the descending slope of the bed, n is Manning’s value of friction, P is the wetted perimeter of the flow, and h is the flow depth. For issues arising when no channels are available, this function can be conveniently deactivated.
The expression in parentheses in Equation (4) represents the diffusion wave term, which compels the channel flow to react to both the slope of the bed and the slope of the free surface. This feature can be activated or deactivated in the model, allowing for the evaluation of both kinematic and diffusion wave approximations. Equations (4) and (5) are discretized using finite differences and a fully implicit method for handling time dependence. In the floodplain flow area, when the bankfull depth is surpassed, water moves from the channel to the floodplain grid above. Floodplain flows are also characterized using continuity and momentum equations, which are broken down over a grid of square cells. This approach enables the model to depict two-dimensional dynamic flow patterns on the floodplain. We consider that the flow between two cells is solely determined by the difference in free surface height between them, as described in Equations (6) and (7):
where is the height of the free water surface at the node (i,j), and are the cell dimensions, n is the effective grid scale Manning’s friction coefficient for the floodplain, and and describe the volumetric flow rates between floodplain cells. is defined analogously to . The flow depth, , represents the depth through which water can flow between two cells, and is defined as the difference between the highest water-free surface in the two cells and the highest bed elevation (this definition has been found to give sensible results for both wetting cells and for flows linking floodplain and channel cells).
The LISFLOOD-FP model can provide accurate forecasts of the maximum flood inundation area for flood-related issues [24,25,26]. The primary benefit of LISFLOOD-FP is its ability to work with high-resolution Digital Elevation Models (DEM), which are becoming more accessible for floodplain regions. Additionally, it is acknowledged as a more straightforward 2D model compared to many other 2D models [23].
3.3. Coupled SWMM/LISFLOOD-FP
To address the limitations of the 2D model in simulating the dynamic processes of rainwater piping systems, a combination of 1D and 2D models was implemented to model the rainfall–runoff–flood process in the urban study area. The coupled model was created using a C# platform, with the models interconnected through the exchange of data at the junction points (manholes). A timing synchronization method was implemented to allow the models to share discharge simultaneously. The flow at each manhole was calculated using either weir or orifice equations, based on the hydraulic heads present at the manhole and the water level above ground. The coupling steps were shown in Figure 6. More details of the model coupling can be found in previous publications [4,27].
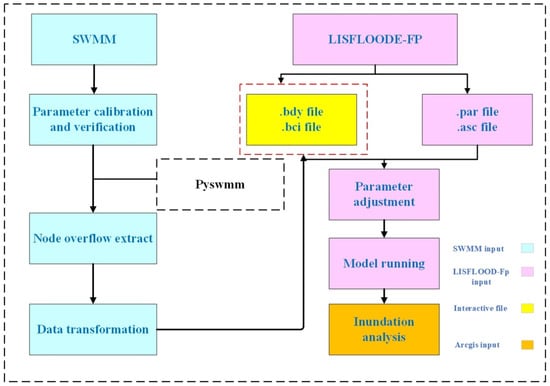
Figure 6.
Steps of model coupling in this study.
3.4. The Error Metrics of the Coupled Model
To evaluate the accuracy of the developed model, the Nash Sutcliffe coefficient (NSE) and peak flow error (PRE) were computed. Formulas (8) and (9) were used to evaluate Nash–Sutcliffe coefficient and peak flow error, respectively.
4. Results
4.1. Model Calibration and Validation
Parameters of the SWMM model can be divided into two categories: one is available parameters, and the other comprises parameters that should be calibrated. Hydrologic processes simulated in SWMM and 10 important parameters identified from the previous literature were, “Rough-R”, “Rough-P”, “N-imperv”, “N-perv”, “S-Imperv”, “S-perv”, “MaxRate”, “MinRate”, “Decay”, “Kwidth” [28].
We used the 29 May 2021 and 2 June 2021 rainstorm events to calibrate the developed model and the 10 August 2021 rainstorm event to verify the result (Figure 2). The optimized relative parameter values for each of these calibration exercises are presented in Table 1.

Table 1.
Results of parameter calibration.
Through parameter calibration, the results of simulations at observation points are shown in Figure 7. It can be seen that the simulation of hydrograph characteristics was relatively consistent with the observations of the flow process as the model could, basically, capture the beginning and regression of the hydrograph.
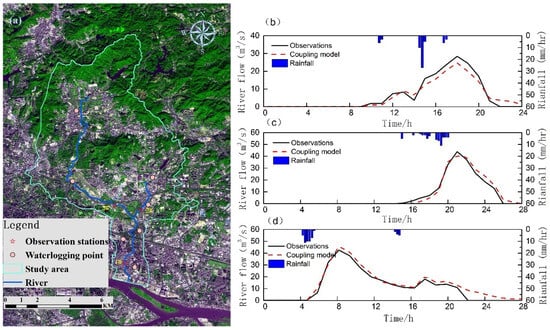
Figure 7.
Location of the actual waterlogging points (a), rainfall hydrographs, observed and simulated hydrographs for (b,c) calibration and (d) verification events in the Chebei Watershed.
On the whole, the coupled model constructed for the study area produced relatively accurate values. The Nash–Sutcliffe coefficients were 0.73 and 0.78 in the calibration period. Further, the peak flow error was less than 20% (Table 2). The Nash–Sutcliffe coefficients and peak flow error were 0.706 and 15.8%. During the model calibration period, the simulated peak flow value was lower than the observed value, possibly due to the blockage of the drainage networks in the actual operation process, resulting in a certain systematic deviation from the simulation results.
Table 2.
Error statistics for simulation results.
Due to the absence of accurate flood measurements and the quality of the gathered flood data, we were limited to utilizing the historical waterlogging point data provided by the city’s water department [29,30]. It is evident that the coupled model accurately simulated the waterlogging caused by the rainstorm. Figure 8 illustrates that the majority of the historical waterlogging points released by the Guangzhou Water Affairs Bureau, as depicted in Figure 7a, were accurately situated within the inundated areas. Consequently, the coupled model devised for the study area can be deemed both reliable and rational, prompting its application in the subsequent phase.
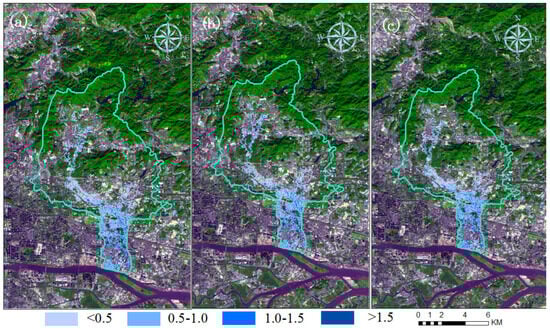
Figure 8.
Inundated area simulated for (a,b) calibration and (c) verification events by the coupled model.
4.2. Impact of Drainage Networks Structure on Hydrologic Response
A summary of the simulation performance is given in Figure 7 and Figure 8 and Table 2. The model was tested to obtain predictions of flow processes and flood depths. In order to quantitatively evaluate the effects of drainage networks on the hydrologic response, the characteristic drainage network properties of different structures should be firstly analyzed. Drainage network properties (Table 3) were derived from digital representations of the storm drain network and surface channel network. Drainage networks were quantified using geospatial information about storm pipes, water junctions, and surface channels. Obviously, drainage density increased with the increase of the drainage networks’ structural level. In particular, total drainage density for Level 3 was almost three times that of Level 1. Higher drainage density would presumably increase total flow and peak flow.
Table 3.
Summary of drainage network characteristics for different structures.
All of the flow processes were consistent in the three typical rainstorms (Figure 9). As for the 29 May 2021 rainstorm event (Figure 9a), with the continuous simplifying of the drainage networks, the flow hydrograph tended to decrease due to the rapid and directional drainage function of the drainage networks gradually becoming weakened. The processes of the beginning and regression of the flow under a drainage network hierarchy of Level 3 were basically consistent with the observations from the 29 May 2021, and 2 June 2021 rainstorm events.
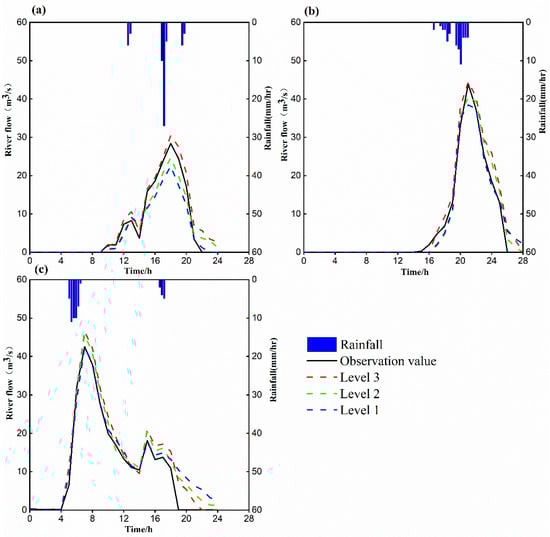
Figure 9.
Measured rainfall and the simulated flows at different complexity levels under the 29 May 2021 (a), 2 June 2021 (b), 10 August 2021 (c) rainstorm events.
According to the relative changes in the rates of total flow and peak flow, a drainage network hierarchy of Level 3 was used as the basis to quantitatively evaluate the impact of the drainage network structure’s impact on the hydrologic response. With continuous simplification, the density of drainage networks will become lower. Meanwhile, the ability for rapid drainage will be weakened. The total flow and peak flow for the 29 May 2021 rainstorm event under drainage network hierarchies of Level 1 and Level 2 were 124.41 m3/s, 22.45 m3/s and 142.84 m3/s, 24.66 m3/s, respectively. The corresponding relative change rates of total flow and peak flow were −33.18% and −23.29% (Figure 10).
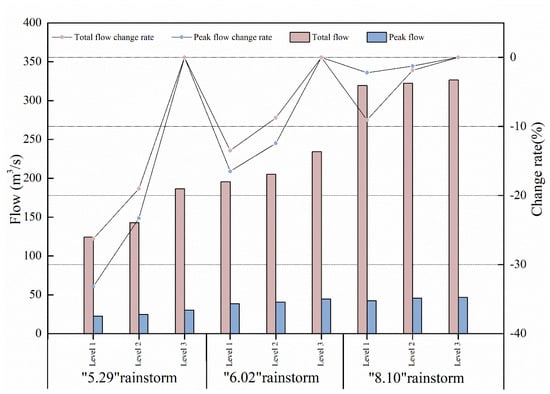
Figure 10.
Drainage network structure with respect to peak flow and total flow volume under a typical rainstorm event.
4.3. Impact of Drainage Network Structure on Urban Inundation
The analysis results are shown in Figure 11 and Figure 12. A drainage network hierarchy that reached Level 1 had a larger flooding area than systems reaching Level 2, or Level 3. However, different rainstorm events had significantly different flooded locations, and this difference increased with an increase in rainfall. The total inundation areas for the 29 May 2021 rainstorm event under the drainage network hierarchies of Levels 1, 2 and 3 were 14.14 ha, 12.04 ha, and 1.43 ha, respectively. The total inundation areas for the 2 June 2021 rainstorm event under the drainage network hierarchies of Levels 1, 2 and 3 were 18.48 ha, 11.06 ha, and 6 ha, respectively. The total inundation areas for the 10 August 2021 rainstorm event under the drainage network hierarchies of Levels 1, 2 and 3 were 15.17 ha, 12.89 ha, and 6.4 ha, respectively.
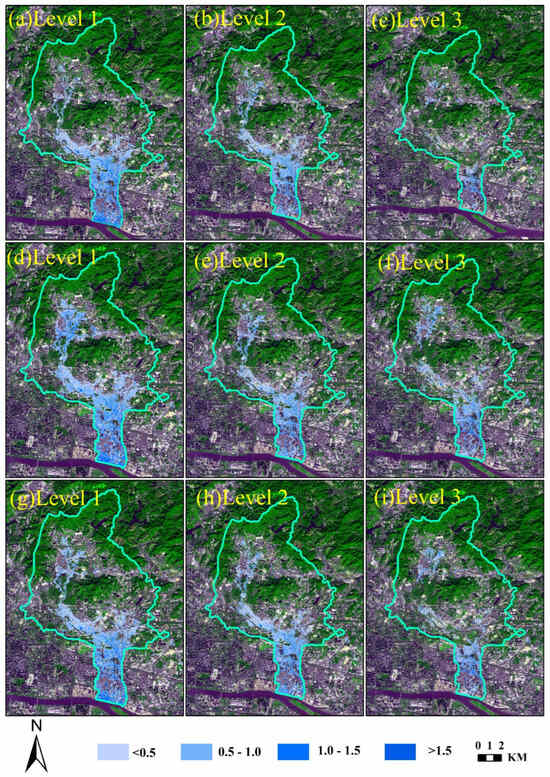
Figure 11.
Depth and inundated area at different complexity structures in the 29 May 2021 (a–c), 2 June 2021 (d–f), and 10 August 2021 (g–i) rainstorm events.
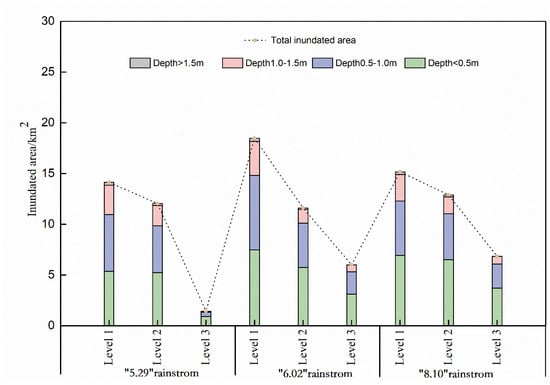
Figure 12.
Drainage network structure with respect to inundated area under typical rainstorm events.
The greater the number of pipes selected, the closer to the actual state. More pipes mean assigning more hierarchies for networks and higher drainage density. The total inundated area decreased with the increase of drainage network density (Figure 12). Especially for waterlogging points with a depth above 1.5 m that have the greatest impact on road traffic and pedestrians, these decrease to shallower depths when the drainage network hierarchy reaches Level 3. Taking “5.29” rainstorm events as an example, the total inundation area was decreased from 14.14 ha to 1.43 ha, when the level of drainage network hierarchy was increased from Level 1 to 3. Also, all of the waterlogging points where the depth ranged from 0.5 m to 1.5 m were reduced.
5. Discussion
The simulation results closely matched the data obtained from on-site observations. Other elements of the simulations warrant further exploration and a thorough examination of the results obtained. In contrast to extensive watersheds or river basins that typically have monitoring stations to track yearly rainfall and runoff, the collection of data for urban drainage systems in China has been quite limited in recent years [8]. Due to the absence of accurate measurements and the quality of the gathered flood data, performing a statistical assessment of the developed coupled model is not feasible. A comparative analysis of the predicted versus the recorded flooding in the Chebei Watershed revealed that this model could capture the locations of waterlogging points in the same locations as historical inundation points. In addition, the water depth and inundation area were slightly overestimated. This can be attributed to the uncertainties arising from diverse assumptions concerning modeling conditions, parameter specifications, and the quality of data [4,31,32]. Despite the model’s limitations in accurately capturing real inundation data and the inevitable uncertainties inherent in the current study, the deviations in its outputs were deemed to be within an acceptable range, rendering it satisfactory for projections of urban flooding.
When we consider urban flooding, some of the influencing factors—climate change, land use, and sea level rise—are more considered. However, studies that examine the impact of drainage networks on urban flooding indicate that other components of the urban infrastructure, such as underground drainage systems, could likewise play a significant role [33]. Nevertheless, most prior studies have utilized a solitary hydrodynamic model to simulate surface waterlogging or flooding, largely neglecting the flow dynamics within underground networks [34,35,36]. Earlier studies have observed that a higher density of drainage networks results in an overall increase in flow [37,38], which in turn causes the peak flow rate to elevate as drainage density increases [39]. Our research also found similar results. In contrast, the increased drainage density resulted in a significant level of increase in total runoff, the low level of risk being attributed to the overall upgrading of the drainage system for flood control. More importantly, drainage is essential in cities to mitigate negative flood impacts due to its unique ability to reduce peak flow.
The analytical results revealed that a model possessing a higher drainage density exhibited greater similarity to the actual terrain, thereby yielding more precise simulation outcomes. Accurate flood hazard mapping serves as a crucial foundation for subsequent decisions pertaining to disaster prevention measures. However, acquiring comprehensive topographical information about tributary drainages is challenging, costly, and requires a significant amount of time [39]. Sometimes, to our understanding, there have been limited studies on large networks, as the data for these networks is not as readily accessible as that for above-ground infrastructure [40]. Aside from that, the appropriate drainage networks should be selected and simplified for the accuracy of flooding simulations. Without a fine-level drainage network in place, the rainfall will not be discharged into the pipe system, and waterlogging will occur in the area. In practice, of course, if measures for flow storage and promoting surface infiltration are adopted to collect rainwater that cannot be discharged into the pipe networks, the problem of waterlogging can be alleviated. At the same time, drainage networks with a fine level can reduce the peak flow and inundation area.
6. Conclusions
The main contribution of this study is a better understanding of the impact of drainage network structure on urban flooding. This has not been incorporated in the previous literature and the results indeed highlight the importance of urban drainage systems in coping with the changing flood risks in cities. The conclusions of this research can be summarized as follows.
(1) The original 95,219 pipes and 95,318 nodes were simplified to 604 and 606, improving the speed of simulation by the Strahler ordering method.
(2) The model presented here was able to simulate bidirectional interaction of the surface/sewer discharge exchange; this better reflects the actual conditions. The information of maximum water depth and exact location of waterlogging points can be obtained by this coupled model.
(3) Higher-density drainage networks could increase peak discharge and total volume of discharge, while decreasing the maximum water depth and the total inundation area. Taking “5.29” rainstorm events as an example, compared to the Level 1 drainage network, the relative rates of change in the total flow and peak flow of the Level 3 and Level 2 drainage networks are −33.18% and −23.29%. The total inundation area was decreased from 14.14 ha to 1.43 ha when the level of drainage network hierarchy was increased from Level-1 to Level-3.
(4) When using numerical models to identify urban flooding, we need to pay more attention to the underground drainage networks. The drainage networks that exert a substantial influence on the precision of the coupled model simulation ought to be selected as appropriate. Our findings indicate the necessity of evaluating both current and future urban drainage systems to address urban floods triggered by local and regional changes.
Besides drainage network information, the data collection for rainfall and flow in urban rivers has been limited during recent years. Future research should focus more on gathering data concerning flood situations and their impacts to improve the model quality. An artificial intelligence model based on machine learning is also a potential direction of subsequent investigation.
Author Contributions
Software, Z.W.; Investigation, C.S.; Resources, T.W.; Writing—original draft, P.W.; Project administration, X.C. All authors have read and agreed to the published version of the manuscript.
Funding
National Natural Science Foundation of China: U1911204; National Natural Science Foundation of China: 51861125203; National Key R&D Program of China: 2021YFC3001000.
Data Availability Statement
The original contributions presented in this study are included in the article. Further inquiries can be directed to the corresponding author.
Conflicts of Interest
There are no conflicts of interest to declare.
References
- Jian, W.; Li, S.; Lai, C.; Wang, Z.; Cheng, X.; Yat-Man Lo, E.; Pan, T.-C. Evaluating pluvial flood hazard for highly urbanised cities: A case study of the Pearl River Delta Region in China. Nat. Hazards 2021, 105, 1691–1719. [Google Scholar] [CrossRef]
- Zhang, M.; Xu, M.; Wang, Z.; Lai, C. Assessment of the vulnerability of road networks to urban waterlogging based on a coupled hydrodynamic model. J. Hydrol. 2021, 603, 127105. [Google Scholar] [CrossRef]
- Rasool, U.; Yin, X.; Xu, Z.; Rasool, M.A.; Hussain, M.; Siddique, J.; Hai, N.T. Quantifying pluvial flood simulation in ungauged urban area; A case study of 2022 unprecedented pluvial flood in Karachi, Pakistan. J. Hydrol. 2025, 655, 132905. [Google Scholar] [CrossRef]
- Wu, X.S.; Wang, Z.L.; Guo, S.L.; Liao, W.L.; Zeng, Z.Y.; Chen, X.H. Scenario-based projections of future urban inundation within a coupled hydrodynamic model framework: A case study in Dongguan City, China. J. Hydrol. 2017, 547, 428–442. [Google Scholar] [CrossRef]
- Agonafir, C.; Lakhankar, T.; Khanbilvardi, R.; Krakauer, N.; Radell, D.; Devineni, N. A review of recent advances in urban flood research. Water Secur. 2023, 19, 100141. [Google Scholar] [CrossRef]
- Mignot, E.; Dewals, B. Hydraulic modelling of inland urban flooding: Recent advances. J. Hydrol. 2022, 609, 127763. [Google Scholar] [CrossRef]
- Mahmoud, S.H.; Gan, T.Y. Urbanization and climate change implications in flood risk management: Developing an efficient decision support system for flood susceptibility mapping. Sci. Total Environ. 2018, 636, 152–167. [Google Scholar] [CrossRef]
- Zhou, Q.; Leng, G.; Su, J.; Ren, Y. Comparison of urbanization and climate change impacts on urban flood volumes: Importance of urban planning and drainage adaptation. Sci. Total Environ. 2019, 658, 24–33. [Google Scholar] [CrossRef]
- Arnone, E.; Pumo, D.; Francipane, A.; La Loggia, G.; Noto, L.V. The role of urban growth, climate change, and their interplay in altering runoff extremes. Hydrol. Process. 2018, 32, 1755–1770. [Google Scholar] [CrossRef]
- Mishra, A.; Mukherjee, S.; Merz, B.; Singh, V.; Wrights, D.; Villarini, G.; Paul, S.; Kumar, N.; Khedun, P.; Niyogi, D.; et al. An Overview of Flood Concepts, Challenges, and Future Directions. J. Hydrol. Eng. 2022, 27, 03122001. [Google Scholar] [CrossRef]
- Yin, J.; Yin, Z.; Hu, X.; Xu, S.; Wang, J.; Li, Z.; Zhong, H.; Gan, F. Multiple scenario analyses forecasting the confounding impacts of sea level rise and tides from storm induced coastal flooding in the city of Shanghai, China. Environ. Earth Sci. 2011, 63, 407–414. [Google Scholar]
- Russo, B.; Valentín, M.G.; Tellez-Álvarez, J. The relevance of grated inlets within surface drainage systems in the field of urban flood resilience. A review of several experimental and numerical simulation approaches. Sustainability 2021, 13, 7189. [Google Scholar] [CrossRef]
- Matthew, W.; Bates, P.; Alsdorf, D.; Forsberg, B.; Horritt, M.; Melack, J.; Frappart, F.; Famiglietti, J. Modeling large-scale inundation of Amazonian seasonally flooded wetlands. Geophys. Res. Lett. 2007, 34, L1540. [Google Scholar]
- Price, R.; Vojinovic, Z. Urban food disaster management. Urban Water J. 2008, 5, 259–276. [Google Scholar] [CrossRef]
- Berggrena, K.; Packmanb, J.; Ashleya, R.; Viklandera, M. Climate changed rainfalls for urban drainage capacity assessment. Urban Water J. 2014, 11, 543–556. [Google Scholar] [CrossRef]
- Smith, J.A.; Baeck, M.L.; Morrison, J.E.; Sturdevant-Rees, P.; Turner-Gillespie, D.F.; Bates, P.D. The Regional Hydrology of Extreme Floods in an Urbanizing Drainage Basin. J. Hydrometeorol. 2002, 3, 267–282. [Google Scholar]
- Mahmood, M.I.; Elagib, N.A.; Horn, F.; Saad, S.A.G. Lessons learned from Khartoum flash flood impacts: An integrated assessment. Sci. Total Environ. 2017, 601–602, 1031–1045. [Google Scholar]
- Miller, J.D.; Kim, H.; Kjeldsen, T.R.; Packman, J.; Grebby, S.; Dearden, R. Assessing the impact of urbanization on storm runoff in a pen-urban catchment using historical change in impervious cover. J. Hydrol. 2014, 515, 59–70. [Google Scholar]
- Rodríguez-Iturbe, I.; Valdés, J.B. The Geomorphologic Structure of Hydrologic Response. Water Resour. Res. 1979, 15, 1409–1420. [Google Scholar]
- Kruszewski, P. A note on the Horton-Strahler number for random binary search trees. Inf. Process. Lett. 1999, 69, 47–51. [Google Scholar] [CrossRef]
- Rossman, L.A. Storm Water Management Model Reference Manual Volume II—Hydraulics; U.S. Environmental Protection Agency, II(Mayo): Washington, DC, USA, 2017; p. 190. [Google Scholar]
- Campisano, A.; Gullotta, A.; Modica, C. Using EPA-SWMM to simulate intermittent water distribution systems. Urban Water J. 2018, 15, 925–933. [Google Scholar] [CrossRef]
- Bates, P.D.; De Roo, A.P.J. A simple raster-based model for flood inundation simulation. J. Hydrol. 2000, 236, 54–77. [Google Scholar] [CrossRef]
- Horritt, M.; Bates, P.D. Evaluation of 1D and 2D numerical models for predicting river flood inundation. J. Hydrol. 2002, 268, 87–99. [Google Scholar] [CrossRef]
- Bates, P.D.; Horritt, M.S.; Aronica, G.; Beven, K. Bayesian updating of flood inundation likelihoods conditioned on inundation extent data. Hydrol. Process. 2004, 18, 3347–3370. [Google Scholar] [CrossRef]
- Bates, P.D.; Dawson, R.J.; Hall, J.W.; Horritt, M.S.; Nicholls, R.J.; Wicks, J.; Hassan, M.A.A.M. Simplified two-dimensional numerical modelling of coastal flooding and example applications. Coast. Eng. 2005, 52, 793–810. [Google Scholar] [CrossRef]
- Wu, X.; Wang, Z.; Guo, S.; Lai, C.; Chen, X. A simplified approach for flood modeling in urban environments. Hydrol. Res. 2018, 49, 1804–1816. [Google Scholar] [CrossRef]
- Moghadas, S.; Leonhardt, G.; Marsalek, J.; Viklander, M. Modeling Urban Runoff from Rain-on-Snow Events with the U.S. EPA SWMM Model for Current and Future Climate Scenarios. J. Cold Reg. Eng. 2018, 32, 59–72. [Google Scholar] [CrossRef]
- Hunter, N.M.; Villanueva, I.; Pender, G.; Lin, B.; Mason, D.C.; Falconer, R.A.; Neelz, S.; Crossley, A.J.; Bates, P.D.; Liang, D.; et al. Benchmarking 2D hydraulic models for urban flooding. Proc. Inst. Civ. Eng.—Water Manag. 2008, 161, 13–30. [Google Scholar] [CrossRef]
- Russo, B.; Sunyer, D.; Velasco, M.; Djordjevic, S. Analysis of extreme flooding events through a calibrated 1D/2D coupled model: The case of Barcelona (Spain). J. Hydroinform. 2015, 17, 473. [Google Scholar] [CrossRef]
- Yu, D.; Coulthard, T.J. Evaluating the importance of catchment hydrological parameters for urban surface water flood modelling using a simple hydro-inundation model. J. Hydrol. 2015, 524, 385–400. [Google Scholar] [CrossRef]
- Aich, V.; Liersch, S.; Vetter, T.; Fournet, S.; Andersson, J.C.M.; Calmanti, S.; van Weert, F.H.A.; Hattermann, F.F.; Paton, E.N. Flood projections within the Niger River Basin under future land use and climate change. Sci. Total Environ. 2016, 562, 666–677. [Google Scholar] [CrossRef] [PubMed]
- Elisabeth, K.; Christopher, K.; Urich, C.; Xianyuan, Z.; Rao, P.; Suresh, C. Generic patterns in the evolution of urban water networks: Evidence from a large Asian city. Phys. Rev. E 2017, 95, 032312. [Google Scholar]
- Coles, D.; Yu, D.; Wilby, R.L.; Green, D.; Herring, Z. Beyond ‘flood hotspots’: Modelling emergency service accessibility during flooding in York, UK. J. Hydrol. 2017, 546, 419–436. [Google Scholar] [CrossRef]
- Pregnolato, M.; Ford, A.; Glenis, V.; Wilkinson, S.M.; Dawson, R. Impact of climate change on disruption to urban transport networks from pluvial flooding. J. Infrastruct. Syst. 2017, 23, 04017015. [Google Scholar] [CrossRef]
- Pyatkova, K.; Chen, A.S.; Butler, D.; Vojinovi’c, Z.; Djordjevi’c, S. Assessing the knock-on effects of flooding on road transportation. J. Environ. Manag. 2019, 244, 48–60. [Google Scholar] [CrossRef] [PubMed]
- Ogden, F.L.; Raj Pradhan, N.; Downer, C.W.; Zahner, J.A. Relative importance of impervious area, drainage density, width function, and subsurface storm drainage on food runoff from an urbanized catchment. Water Resour. Res. 2011, 47, W12503. [Google Scholar] [CrossRef]
- Pallard, B.; Castellarin, A.; Montanari, A. A look at the links between drainage density and flood statistics. Hydrol. Earth Syst. Sci. 2009, 13, 1019–1029. [Google Scholar] [CrossRef]
- Song, Y.; Che, C.; Chih, H.; Shiang, W. Variation of uncertainty of drainage density in food hazard mapping assessment with coupled 1D–2D hydrodynamics model. Nat. Hazards 2022, 111, 2297–2315. [Google Scholar]
- Blumensaat, F.; Wolfram, M.; Krebs, P. Sewer model development under minimum data requirements. Environ. Earth Sci. 2012, 65, 1427–1437. [Google Scholar] [CrossRef]
Disclaimer/Publisher’s Note: The statements, opinions and data contained in all publications are solely those of the individual author(s) and contributor(s) and not of MDPI and/or the editor(s). MDPI and/or the editor(s) disclaim responsibility for any injury to people or property resulting from any ideas, methods, instructions or products referred to in the content. |
© 2025 by the authors. Licensee MDPI, Basel, Switzerland. This article is an open access article distributed under the terms and conditions of the Creative Commons Attribution (CC BY) license (https://creativecommons.org/licenses/by/4.0/).