Abstract
The construction of artificial islands not only alleviates the shortage of coastal land resources but also brings new environmental problems. This study focuses on the fundamental changes in the hydrodynamic environment and sediment transport caused by the construction of artificial islands, leading to imbalances in sediment distribution and beach erosion. This article takes the coast of Riyue Bay in Hainan Province, China, as an example and uses various methods such as field surveys and model experiments to explore the evolutionary mechanism of beach landforms under the influence of artificial islands. Based on this, an adaptive “cyclic maintenance” beach restoration plan is proposed. Reasonable distribution of beach sediment is achieved through experimental verification, effectively mitigating the coastal erosion caused by the construction of artificial islands. The expected goals were achieved after 2 years of implementation of the on-site restoration project. The results of this research not only solve practical engineering problems but also provide a good reference for the restoration of similar types of coastal beaches.
1. Introduction
The evolution of the geophysical environment is largely attributed to erosion, and coastal erosion also shapes coastal landforms [1], especially in sensitive areas where sea–land–air interactions occur. The profile changes influenced by dynamic factors such as waves, tides, and winds, as well as terrain, reflect the complex process response mechanisms of beaches [2,3], and the role of human activities in this process is becoming increasingly significant [4,5,6,7,8], including the construction of coastal hardening projects, direct intervention in sand mining, ecosystem destruction such as vegetation clearance, etc.
The construction of artificial islands not only alleviates the shortage of coastal land resources but also brings new environmental problems. It not only significantly changes the regional marine dynamics [9,10] and water and sand environment [11,12,13] but also has a significant impact on the distribution pattern of landforms near the coast, especially adjacent beaches [14,15,16,17,18]. The impact of artificial islands on beaches is essentially similar to the effect of offshore levees. The wave shadow area behind the levee causes sediment deposition due to weakened dynamics, while the two sides of the levee cause beach erosion due to strong dynamics. Until now, most research has focused on the scale of sediment deposition behind the embankment (island) to determine whether it has formed a sand mouth or connected island sandbar [19,20,21,22]. In fact, the largest threat of artificial islands to adjacent coastal beaches is the continuous erosion of both sides of the shoreline [23], which must be controlled or repaired by corresponding engineering measures.
Traditional coastal erosion protection often uses “hard engineering” such as sand barriers and breakwaters [24,25], which can directly prevent erosion, promote sedimentation, and protect the coast. However, if used to protect against coastal erosion disasters caused by artificial islands, it may cause “secondary damage” to the originally damaged coastal dynamic environment. In recent years, the concept of coastal protection has gradually shifted from “hard” to “soft”, and beach maintenance and restoration technologies have gradually been applied and promoted in China [26]. However, simple beach restoration measures cannot restore the dynamic environment damaged by artificial islands and, therefore, cannot change the continuous erosion trend on both sides of the artificial islands.
This study takes the impact of the newly built double artificial island off the coast of Riyue Bay in Hainan Province, China, as an example and applies methods such as field investigation, remote sensing image analysis, and model experiments to demonstrate the changes in the coastline before and after the implementation of the artificial island. At the same time, a “cyclic maintenance” beach restoration plan is proposed, and the protective effect of the new plan is verified. The experimental results meet the goal of coastline restoration.
2. Engineering Background
The artificial island is located on the southeast side of Riyue Bay in the southern part of Wanning City, with coordinates ranging from 18°36′14.33″ to 18° 36′27.75″ north latitude and 110°11′27.63″ to 110°11′39.46″ east longitude, as shown in Figure 1. The construction and development of this coastline began in 2012, with the construction of two artificial islands, Sun Island and Moon Island, located approximately 350 m outside the coastline. The total reclaimed land area is about 971,000 square meters, with Sun Island covering about 480,000 square meters and Moon Island covering about 491,000 square meters. The artificial island covers the nearshore waters with a water depth range of −5.0 m~−10.0 m, and the bay is mainly composed of fine sand with D50 = 0.14~0.18 mm.
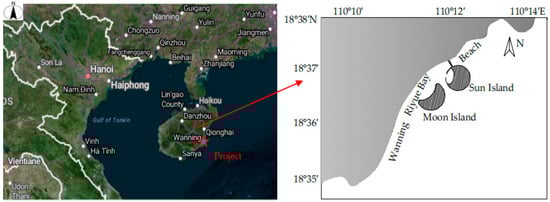
Figure 1.
Project location map.
During and after the construction of the artificial islands, through on-site surveys, measurements, and analysis of remote sensing satellite imagery, shoreline erosion was observed as shown in Figure 2. As illustrated in the figure, the construction of Sun Island and Moon Island resulted in significant changes to the shoreline behind them. For clarity, the affected shoreline areas are defined as Zones I to VII. The shoreline in Zone I, located at the northeastern edge of the beach, remained relatively stable. In Zone II, near the Sun Island, under the direct impact of incoming waves, the shoreline continuously eroded towards the land, with a maximum erosion distance of 50 m. In the shadow zones of the Sun Island, Zones III and IV, the shoreline significantly accreted towards the sea compared to before the construction of the Sun Island, with a maximum accretion distance of 200 m. In Zones V and IV, located between the two islands, the shoreline also retreated towards the land but to a lesser extent. In Zone V, within the shadow of the Moon Island, significant accretion occurred on the beach, with the shoreline advancing towards the sea by approximately 120 m. In Zone VI, on the southern side of the Moon Island, the shoreline change was relatively small, with a maximum of 85 m. In Zone VII, near the southern headland of the beach, accretion occurred, but the overall shoreline experienced slight erosion towards the land. The erosion of each shoreline segment is shown in Figure 3.
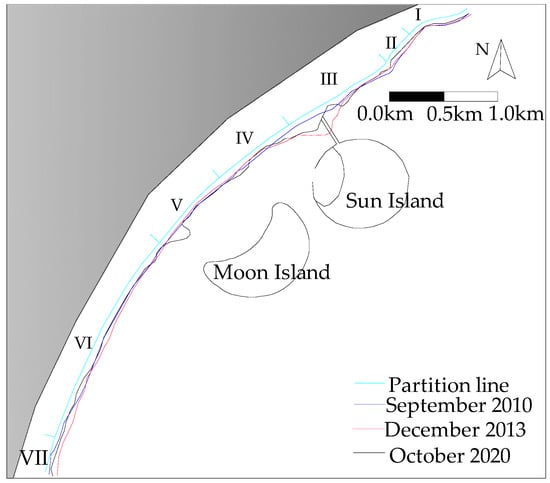
Figure 2.
Evolution of the shoreline after the construction of the artificial island.
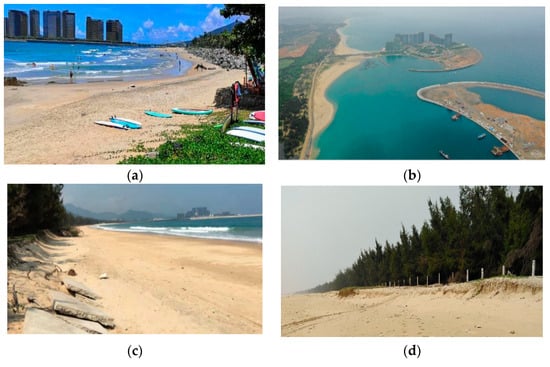
Figure 3.
Erosion situation of each section of the shoreline: (a) regions I and II; (b) regions III, IV, and V; (c) region VI; (d) region VII.
RTK GPS was used to conduct on-site measurements of the terrain of 29 profiles in October 2020 and March 2023, with the profiles arranged from north to south as R1~R29 (shown in Figure 4). By drawing profile maps of different periods, the topographic changes in the Riyue Bay beach profile were compared and analyzed, as shown in Figure 5.
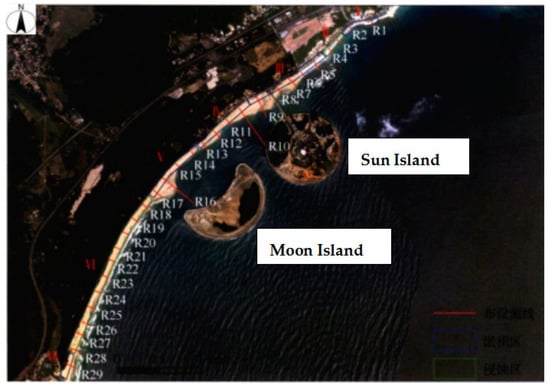
Figure 4.
Analysis and division of the beach erosion shoreline profile.
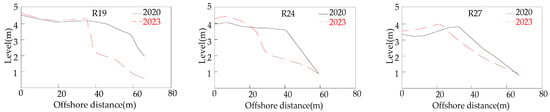
Figure 5.
Results of the changes in the erosion shoreline profiles in regions VI and VII.
According to the satellite image, the impact of the artificial islands on the adjacent beaches is characterized by “sedimentation behind the island and erosion on both sides”, and there are significant differences in the response amplitude of erosion hotspots on both sides. Overall, the beach exhibits characteristics of stable, eroded, silted, relatively stable, slightly eroded or silted, eroded, and silted erosion and sedimentation from north to south.
In order to reveal the mechanism of beach erosion after the construction of the artificial islands, on-site surveys and previous research results on hydrodynamics before and after the project were analyzed. Based on the results of each, we concluded that the beach erosion was mainly caused by three influencing factors, according to the angle of passive force. After the construction of the artificial islands, the direction of the waves deviated, and the distribution of the wave energy was uneven, and after the interaction between the Sun and Moon Islands, the northeast side of the shield area of Moon Island was smaller than the southwest side; that is, the dynamic field on both sides of the artificial island changed, which directly affected the sediment transport. The dynamic changes before and after the project are shown in Figure 6a. From the perspective of material sources, due to the obstruction of artificial island bridges and the influence of the natural reef terrain on the northeast side of the Japanese island, the sediment on the northeast side cannot replenish the erosion hotspot area on the southwest side, resulting in a large annual net sediment transport and sediment transport gradient. The sediment transport in the artificial island area is shown in Figure 6b. In terms of the shoreline morphology, the shorelines of regions VI and VII protrude slightly towards the open sea, making them susceptible to wave energy accumulation, resulting in erosion and retreat of the central shoreline in the region.
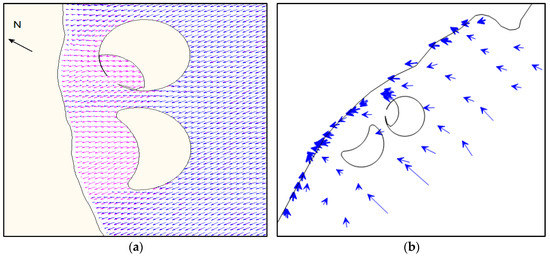
Figure 6.
Dynamics and sediment transport around the newly constructed artificial island. (a) Changes in wave field near the island, where the red arrow represents the time before the project, and the blue arrow represents the time after the project; (b) trend of sediment transport near the island, where the arrows represent the direction of nearby sediment transport.
3. Proposal of Repair Case and Experimental Research
3.1. Proposal and Analysis of Repair Case
In order to prevent further erosion and retreat of the shorelines on both sides of the artificial island, especially in the 2.5 km long areas VI and VII, a cyclic restoration case combining artificial sand replenishment, new dikes, and offshore submerged dikes was proposed. Specifically, 10 submerged dikes with a length of 120 m and a spacing of 100~220 m were arranged from north to south in the VI and VII areas, with the axis located near the −2.0 m isobath and about 140 m offshore. A 150 m long dike was built between R16 and R17, and the sediment accumulated behind the artificial island was returned to the VI and VII areas through artificial transportation. The sand replenishment profile was designed as follows: the sand filling slope above the low water level was parallel to the natural bank slope; the slope below the low water level was slightly steep, causing the sand filling slope to intersect with the natural bank slope, ultimately forming a cycle of erosion and sedimentation. The layout of the case is shown in Figure 7.
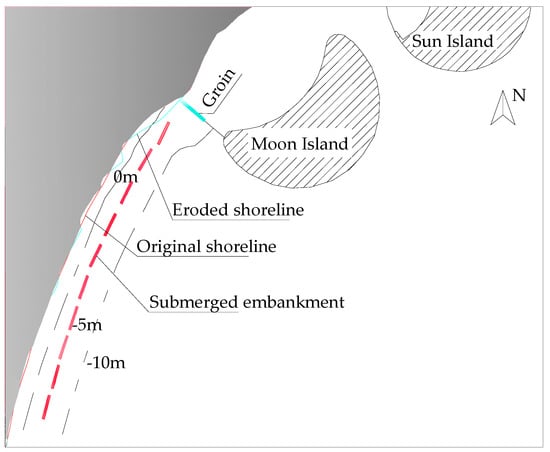
Figure 7.
Restoration design scheme and shoreline erosion situation after balancing.
For the newly proposed restoration project case, the LITLINE [27] model was first used to verify the protective effect and obtain the optimal case. The shoreline evolution control equation is as follows:
where is the distance from the shoreline to the baseline; is the effective elevation of the beach profile; is the coastal sediment transport rate; is the position of the coastline relative to the baseline; is the shoreline discretization step size; is the source/sink item.
Calculation parameter settings and model validation: ① the water depth terrain adopts the measured water depth data in 2023. ② Shoreline: the initial calculation of the shoreline adopts the 0 m isobath. ③ Particle size: D50 = 0.285 mm based on sediment analysis results measured in the engineering area. ④ Wave: this calculation uses wave statistics data from the on-site ocean station at the engineering location. ⑤ Model grid: the spacing between coastal shoreline grids is 5 m, and the spacing between vertical profile terrain grids is 5 m; ⑥ model calibration verification was conducted using on-site measurements of the beach terrain on both sides in 2021 and 2023.
The calculation results (shown in Figure 7) indicate that there was erosion between the first three offshore levees closer to Moon Island, with a maximum erosion retreat distance of about 21 m, which was one-fourth of the initial distance. There was slight erosion between the two offshore levees in the southern section, with a maximum erosion retreat of about 10 m. The erosion rate was significantly lower than that without protective measures. The newly built submerged levees and supplementary artificial beaches cause waves to break prematurely, resulting in wave energy attenuation and reducing the initiation of sediment on the beach, ensuring beach stability.
To further validate the repair case, physical model experiments were conducted to study the sand replenishment and loss situation, profile changes, and shoreline deformation of the beach at different elevations of the submerged embankment.
3.2. Case Testing and Research
3.2.1. Test Conditions
(1) Analysis of sediment movement characteristics on the beach: the initiation of sediment in the sea area is mainly driven by waves and tidal currents, so the sediment movement characteristics were analyzed.
① For the sediment initiation equation under the action of water flow dynamics, when the natural sand D is greater than 0.076 mm, it belongs to the hysteresis and transition state and is calculated using Zhang Ruijin’s Equation (2) [28]. The calculation parameters are as follows: (1) water depth: 0–2.0 m, −5.0 m, −10.0 m; (2) particle size of sediment: D = 0.285 mm. The minimum flow velocity under different water depth conditions needs to be greater than 0.50 m/s. Compared with the tidal dynamics in the engineering sea area, the maximum tidal flow velocity is 0.30 m/s, indicating that the tidal dynamics are not sufficient to cause sediment to start on the bed surface. ② For the sediment initiation equation under wave dynamic conditions, when the beach is a sandy coast, Equation (3) of the “Hydrological Code for Ports and Navigational Channels” (TJS145-2018) [29] is used for calculation. The calculation parameters are as follows: (1) water depth of 0 m, −2.0 m, −5.0 m, and −10.0 m; (2) particle size of sediment: D = 0.285 mm; (3) wave period: using rgw results from different recurrence periods on site, it is found that when the wave height is 0.9 m, the surface sediment in shallow waters below 1.5 m can be fully mobilized, and the surface sediment in waters between 1.0 m and 3.0 m can be mobilized. That is to say, under the action of waves with this wave height, the sediment mainly moves in the range below 3.0 m, and within this range, the sediment moves longitudinally or laterally. When the wave height is 5.2 m, it can fully activate fine and coarse sand in deeper waters beyond 10.0 m. From this, it can be seen that large waves have a strong impact on the movement of sediment in the sea area, and it is believed that waves are the main driving force for the initiation of sediment in the sea area.
where is the starting velocity of sediment; is the water depth; is the median particle size of the sediment; is the sediment density; is the severity of water; is the starting wave height of sediment; is the wavelength.
(2) Experimental simulation scope: Based on the experimental purpose and the size limitations of the experimental harbor, a normal scale model was adopted, and the scale relationships of various physical quantities are summarized in Table 1. The experiment was conducted in a harbor basin measuring 45 m in length, 40 m in width, and 1.0 m in depth. The sediment dynamic bed range was horizontal from the shoreline to the water depth of −20.0 m, surrounded by two artificial islands in the south and north, and vertical within a range of 1.5 km outside the submerged breakwater in the south and north (shown in Figure 7).

Table 1.
Summary of physical quantity ratios.
(3) Model sand selection: based on the characteristics of the prototype sand and the similarity of the scale, the laboratory selected plastic sand with a specific gravity of 1300 kg/m3 and a median particle size of 0.42 mm as the model sand.
(4) Experimental equipment and measurement point layout: A rocking plate wave making machine was used for wave making, with a maximum wave making depth of 0.8 m, wave height of 0~0.3 m, and a period of 0.5~4.0 s. To reduce the wave boundary reflection, wave absorbers were installed around the harbor basin. The wave type adopted irregular waves, and the spectrum was the JONSWAP spectrum. At the same time, in order to prevent secondary reflection caused by long-term wave generation, the experiment adopted segmented wave generation. For wave calibration and monitoring, three wave height sensors H1~H5 were arranged at the model boundary, as shown in Figure 8. The two end tidal system of the model adopted reversible variable frequency speed regulation closed-loop water level control to simulate the process of rising and falling tides. W1 was set for tidal-level monitoring, as shown in Figure 8. The measurement of the beach profile erosion and deposition deformation was carried out using a 3D laser scanner for scanning and processing. During the experiment, waves, tidal systems, wave heights, and water levels were collected using self-developed software for control and data collection.
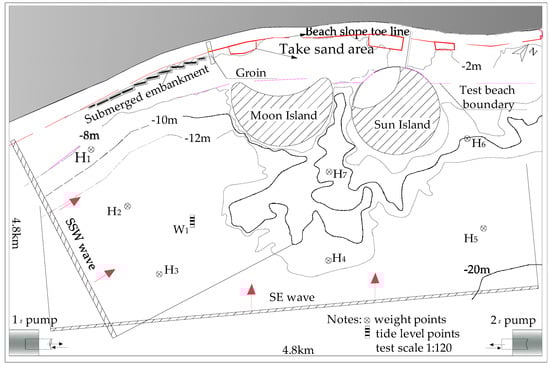
Figure 8.
Model layout and measurement point layout.
3.2.2. Environmental Simulation and Methods
(1) Method for determining the dynamic conditions for model validation: Perennial waves were used, and according to the calculation Equations (4) and (5) for the representative wave height and direction specified in the Technical Specification for Water Transport Engineering Simulation Test (JTS/T231-2021) [30], the constant wave direction in Riyue Bay is SE, accounting for 47.3% of the frequency, and the secondary constant wave direction is SSE, accounting for 20.70% of the frequency. In the S direction, the frequency accounts for 6.6%; in the SSW direction, the frequency accounts for 9.7%. The total proportion is 84.3%. Therefore, two representative wave directions were selected for the experiment. The wave heights were calculated as H = 1.0 m, T = 5.2 s, and H = 0.8 m, T = 3.9 s, respectively. The frequency ratios of the two wave energies were 68.0% and 16.3%, respectively. Referring to Xia Yi-min [31] and other sediment model experiences [32,33,34], the model test wave height is generally required to be no less than 1.5 cm, and the period is no less than 0.6 s. Based on the experimental scale relationship calculation, the initial wave height was slightly lower than the wave height requirement. Therefore, in the verification test process, the requirements of increasing the wave height and period to general were adopted; that is, the wave elements were used with an abnormal scale, but the ultimate goal was to verify that the model met the specifications based on the results of the terrain erosion and deposition changes, to ensure that the model design parameters were reasonable, and the conclusions were credible.
where is represents the wave height; is represents the wave direction; is the effective wave height greater than the starting wave height i of the sediment; is the frequency of occurrence of wave height and direction on the order of i; is the wave direction angle of the i magnitude wave.
(2) Determination of terrain verification data: During September 2022 and July 2023, underwater terrain measurements were conducted at the project location. Therefore, these two actual underwater terrain measurements were used as verification data for the experiment. According to statistics, the terrain changes in the project location over the past three years resulted in a shoreline erosion within 0.2 m~0.6 m per year, a shoreline retreat within 5~10 m, and an annual net sediment loss of 0.5~1.0 × 10⁴ m3/yrs. The most severe location was on the southwest side of Moon Island. These were used as model validation data.
(3) Reasonability determination of model design parameters: Using the above dynamic conditions and terrain data, model calibration was carried out, and the results of the erosion and deposition changes in the validation area on the model were obtained, as shown in Table 2 and Figure 9. By comparing the results of the model and on-site erosion and deposition changes, it can be concluded that the sediment model was basically the same as the original body, indicating that the design of the sediment model and the selection of the model sediment were reasonable. The maximum error in calculating the erosion and deposition changes over the past three years was 28.57%, with an average of less than 10%, which basically meets the regulatory requirements.
Table 2.
Terrain verification results.
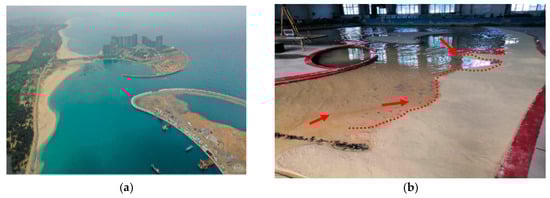
Figure 9.
Comparison results of the sediment erosion and deposition deformation at the roots of the breakwaters on both sides of the waterway: (a) on site; (b) model test.
(4) Determination of the sedimentation time scale: Firstly, the on-site beach sediment transport results [35] were used. Then, in the model, multiple sediment collection channels were arranged vertically along the shoreline to obtain the beach sediment transport volume. Finally, the sediment transport scale was obtained by using the similarity relationship Equation (6) for the sediment transport volume.
Based on the similarity relationship of the erosion and deposition time, the model erosion and deposition time scale can be obtained. Using this scale, it can be inferred that for one year on site, 13.6 h are required for the model.
3.2.3. Test Results and Analysis
- Design Case Test
Under normal sea conditions and wave action, the wave energy is blocked to some extent by the wave blocking effect of the outer offshore submerged breakwater, especially at low water levels. The wave blocking effect is significant, and the wave height behind the breakwater weakens, causing the sediment transport along the coast to accumulate in the area of weakened wave dynamics. However, the transmitted waves in the gap between the two breakwaters further enhance the effect on the downstream sandy beach surface, resulting in sediment erosion on the beach surface and presenting small sawtooth shaped shorelines of different widths. During 5 years of continuous wave action, the sediment loss in the repaired area was recorded every two years, as shown in Table 3. The effect of the waves crossing the submerged breakwater on the beach is shown in Figure 10.
Table 3.
Results of the beach erosion and beach shoulder width in the design case.
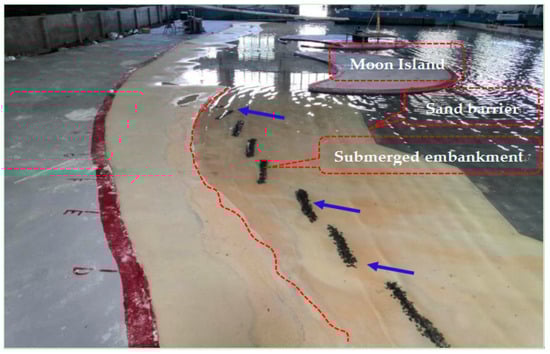
Figure 10.
The movement of sediment under wave action in the design case.
- 2
- Optimization Case Test
Based on the design scheme results, while ensuring the stability of the beach, it is necessary to meet the requirements of the coastal landscape effect and economic rationality. Therefore, multiple comparative optimization schemes were carried out, and the experimental results are shown in Table 4. Therefore, after comprehensive comparison, the design scheme is feasible.
Table 4.
Comparison scheme test results.
- 3
- Calculation of Beach Maintenance Cycle
For the maintenance of shoreline erosion, the experiment took the width of the dry beach as the standard for the implementation of maintenance and used the regression width of the shoreline erosion under the continuous action of waves at different times for fitting. The relationship between the two is shown in Figure 11, and an empirical equation for beach maintenance cycle was fitted, as follows:
where y is the width of the erosion retreat, and x is the year of continuous wave action.
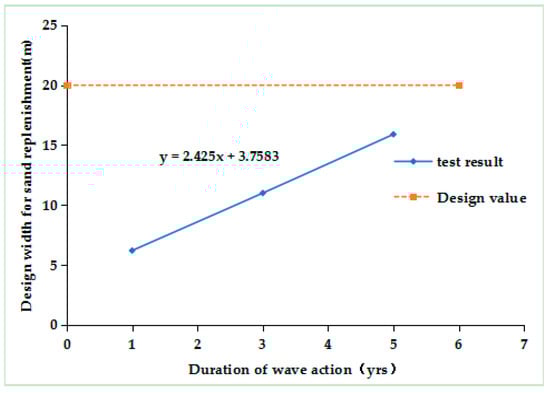
Figure 11.
Fitting curve of the beach shoreline maintenance cycle under constant sea conditions.
To maintain the above standards, under constant sea conditions, the maintenance cycle for shoreline remediation would be approximately once every 6.0~6.5 years. However, it should be noted that due to frequent typhoon landings at the project location, the frequency of the dynamic effects under constant sea conditions was relatively low for a long time. Therefore, the maintenance of the beach needs to be determined based on the actual situation. That is, if there are significant changes in dynamic conditions during maintenance, such as extreme adverse conditions such as typhoon passage, timely repair is required.
3.2.4. Verification After Implementation of the Case
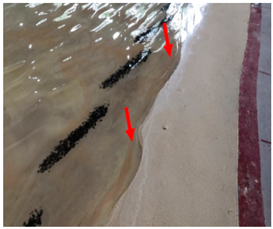
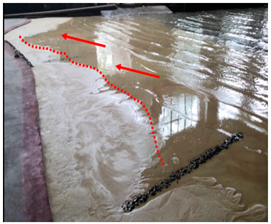
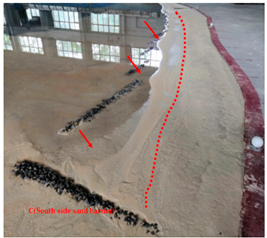
After the implementation of the restoration case, the following was found through on-site investigation and monitoring statistics. (1) There was erosion in the middle section of the coastline, especially in the range of tidal-level changes. At the junction of the two submerged embankments, the coastline eroded and retreated, and the annual net sediment transport of the coastline was estimated to be about 0.39 × 10⁴ m3. (2) The statistical results of the sediment loss in different periods are shown in Table 5. After continuous monitoring for 2 years, the sediment loss was about 13.03% of the designed replenishment amount. Overall, the protective case had a good covering effect. In addition, the comparison of the shoreline erosion before and after the implementation of the protection case is shown in Figure 12, which also indicates that the implementation of the protection case delayed the retreat of shoreline erosion.
Table 5.
Remaining sediment volume at different times after the construction of artificial beaches (104 m3).
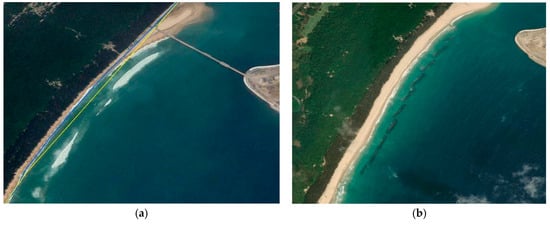
Figure 12.
Changes in the beach before and after the implementation of the protection case: (a) before the implementation of the case; (b) two years after the implementation of the case.
4. Discussion
(1) Unlike previous studies, this article analyzed the characteristics of newly built artificial islands that have a significant impact on beaches from three aspects: external forces, material supply, and shoreline morphology, namely, “sedimentation behind the island and erosion on both sides”. Based on this, a restoration plan was proposed to meet the project objectives.
(2) We proposed a different cyclic maintenance method from the past, which built hard structures such as submerged embankments and breakwaters on the basis of beach maintenance and, at the same time, combined fixed-point sand replenishment strategies. Compared with previous research results, which have shortcomings, the new cyclic maintenance plan was to transport sediment from the sedimentation area (upstream) to the erosion area (downstream) through the manual construction of sediment transport pipelines or truck turnover [36,37,38,39]. After a certain period of implementation of the beach protection plan, the sediment accumulated behind the island was transported to the erosion hotspots on both sides through manual intervention, forming a new dynamic balance. This study determined a maintenance strategy that requires maintenance after 6.5 years, which is more reasonable from an economic perspective and is consistent with the 5–7-year beach maintenance cycle proposed by the KUMAR team [40].
(3) The experiment proposed a beach maintenance cycle of 6.5 years under normal sea conditions. However, when the combination of typhoon waves and astronomical tides causes significant sediment loss on the beach, the experiment suggests that the maintenance cycle needs to be adjusted in a timely manner. In addition, the experiment did not consider the impact of wind and human activities on sediment loss on the beach. Therefore, the beach needs to be regularly maintained and repaired in a timely manner according to the actual situation to ensure its stability.
(4) Due to the significant impact of the construction of Sun and Moon Islands on the surrounding environment, the government has recently proposed the strategy of demolishing Moon Island. After the demolition of Moon Island, the hydrodynamic conditions will change again. Currently, the research team has also proposed a cyclic maintenance and restoration plan in the new environment to ensure the stability of the newly restored beach.
5. Conclusions
Based on the problem of beach erosion and sediment distribution imbalance after the implementation of artificial islands, a new restoration scheme of “cyclic maintenance” was proposed using the LITLINE shoreline evolution model calculation, on-site investigation, and a 1:120 scale model test. The effectiveness of the new scheme was verified through experiments, meeting the engineering objectives. The main conclusions obtained are as follows: (1) after the construction of artificial islands, the hydrodynamic forces around the island were redistributed, and the impact on the beach was characterized by “sedimentation behind the island and erosion on both sides”; (2) through multiple model experiments for optimization and comparison of the design repair plans, considering the protection effectiveness and the economy, optimization plan 3 was recommended; (3) the optimal solution was adopted, and the conclusion was drawn from model experiments that the beach maintenance cycle under normal sea conditions is 6.5 years, and timely repair is required during typhoons; (4) after the implementation of the restoration project, after 2 years of on-site verification, it was found that the sediment loss was about 13.03% of the designed replenishment amount, achieving the expected target.
Author Contributions
L.G.: model design and testing, paper preparation, data processing and analysis of beach evolution experiment; Y.X.: data collection, model design and testing, and data analysis, and funding support; G.K.: testing, statistics of sediment loss in beach profiles, wave height data processing and analysis; S.C.: series group model testing, test instrument debugging, test terrain processing, and data verification. All authors have read and agreed to the published version of the manuscript.
Funding
This study was financially supported by the National Key R&D Program of China (2022RDC2012300) and the National Natural Science Foundation of China (42307597); special fund for central scientific research institutes (TKS20240502, TKS20230205, TKS20230505, and TKS20230515).
Data Availability Statement
Data are contained within the article.
Acknowledgments
This physical model test was conducted in the experimental harbor basin of the Tianjin Research Institute for Water Transport Engineering.
Conflicts of Interest
The authors declare no conflicts of interest. The corresponding author is responsible for submitting a competing interest statement on behalf of all authors of the paper.
References
- Silva, R.; Martínez, M.L.; Hesp, P.A.; Catalan, P.; Osorio, A.F.; Martell, R.; Fossati, M.; Miot da Silva, G.; Mariño-Tapia, I.; Pereira, P.; et al. Present and future challenges of coastal erosion in Latin America. J. Coast. Res. 2014, 71, 1–16. [Google Scholar] [CrossRef]
- Chen, X. Evolution of Coastal Landform Maintenance and Its Impact on Wind and Sand Action; Third Institute of Oceanography, Ministry of Natural Resources: Xiamen, China, 2023. [Google Scholar]
- Ji, C.; Jiang, Q.; Ma, D.G.; Lu, B.; Zhou, J.W. Responses of Tidal Currents to Artificial Island and Multiple Projects. Sci. Technol. Eng. 2024, 24, 1837–1847. [Google Scholar] [CrossRef]
- Qi, H.S.; Feng, W.; Liu, G. Study on the Evolution Characteristics of Conserved Beaches under the Influence of Artificial Islands. Acta Oceanol. Sin. Chin. Ed. 2024, 46, 79–92. [Google Scholar] [CrossRef]
- Liu, G. Research on Beach Maintenance Evolution Process and Stability Assessment Method; Ocean University of China: Shandong, China, 2019. [Google Scholar]
- Xiao, Z.Y. Study on Coastal Evolution and Circular Maintenance Technology Under the Influence of Artificial Islands; Third Institute of Oceanography, Ministry of Natural Resources: Xiamen, China, 2021. [Google Scholar]
- Zhang, X.L. Research on the Impact of Rehabilitation Projects on the Evolution of Lagoons and Sandy Landforms in Fudu River, Yingkou City; Dalian University of Technology: Liaoning, China, 2023. [Google Scholar]
- He, Y.Y.; Zhu, J.; Qi, H.S. Study on beach restoration strategies under the influence of artificial islands-A case study of the west coast of Haikou City. J. Appl. Oceanogr. 2021, 40, 2–11. [Google Scholar] [CrossRef]
- Xia, D.X.; Bian, S.H.; Feng, A.P. Geomorphology of Coastal Zone, 3rd ed.; China Ocean Press: Beijing, China, 2014; pp. 154–196. [Google Scholar]
- Li, K.X. Monitoring and Driving Factor Research of Coastline at National, Regional, and Provincial Scales; Jiangsu Ocean University: Jiangsu, China, 2023. [Google Scholar]
- Fu, B.; Qin, H.; Zeng, W.T. Characteristics and Evolution Prediction Analysis of Coastal Erosion and Accumulation in Yazhou Bay, Sanya. Mar. Geol. Front. 2024, 40, 76–88. [Google Scholar] [CrossRef]
- Wang, Z.C. Research on the Impact of Artificial Island (Group) Construction on Changes in Surrounding Water and Sand Environment; Dalian University of Technology: Dalian, China, 2018. [Google Scholar]
- Li, W.D.; Li, M.G.; Xu, T. Research on Water and Sand Environmental Impact of Yantai Taoziwan Artificial Island Project. Mar. Lake Marsh Bull. 2022, 44, 73–82. [Google Scholar] [CrossRef]
- Liang, W.Q.; Wang, Y.H. Empirical Orthogonal Function Analysis of the Long-term Spatiotemporal Evolution Process of Semi-sheltered Beach Profile. Mar. Freshw. Res. 2021, 52, 834–845. [Google Scholar] [CrossRef]
- Zhang, X.D.; Yao, Y.H.; Zhu, H. Research on the topography and geomorphology evolution of Qingdao Huanghai Beach based on a large number of satellite images in the past 40 years. Mar. Freshw. Res. 2022, 53, 578–589. [Google Scholar] [CrossRef]
- Hu, T.H. Research on the Morphodynamic Characteristics of Sandy Coasts in the Qiongzhou Strait at Multiple Scales; Guangdong Ocean University: Guangdong, China, 2022. [Google Scholar]
- Alexandrakis, G.; Manasakis, C.; Kampanis, N.A. Valuating the effects of beach erosion to tourism revenue.A management perspective. Ocean. Coast. Manag. 2015, 111, 1–11. [Google Scholar] [CrossRef]
- Zhao, G.X.; Zhang, C.; Zhang, H. Research on the Impact of Artificial Island Layout on Hydrodynamics and Water Exchange in Surrounding Waters. J. Hydroelectr. Power Gener. 2017, 36, 18–28. [Google Scholar] [CrossRef]
- Zhu, J.; Cai, F.; Shi, F. Beach response to breakwater layouts of drainage pipe outlets during beach nourishment. Estuar. Coast. Shelf Sci. 2019, 228, 1–13. [Google Scholar] [CrossRef]
- Dally, W.R.; Pope, J. Detached breakwaters for shore protection. Vicksbg. Coast. Eng. Res. Cent. 1986, 2, 12–25. [Google Scholar]
- Pope, J.; Dean, J.L. Development of design criteria for segmented breakwaters. In Coastal Engineering, Proceedings of the 20th Conference on Coastal Engineering, Taipei, Taiwan, 29 January 1986; ASCE: Reston, VA, USA, 1986; pp. 2144–2158. [Google Scholar]
- Ab Razak, M.S.; Nor, N.A.Z.M. XBeach process-based modelling of coastal morphological features near breakwater. ICCOEE MATEC Web Conf. 2018, 203, 01007. [Google Scholar]
- Li, Y.H.; Lei, G.; Cai, F. Research on the Impact of Three Typical Coastal Projects in China, including Hard Shore Protection, Fishing Port Engineering, and Artificial Islands, on Adjacent Beaches. J. Appl. Oceanogr. 2019, 38, 118–125. [Google Scholar] [CrossRef]
- Guo, Y.J.; Ma, J.R.; Guan, Y.D. Study on the Impact of Offshore Wharf Approach Methods on Beach Evolution in Yinggehai. Sci. Technol. Eng. 2016, 16, 255–260, 283. [Google Scholar] [CrossRef]
- Liu, D.D.; Lü, S.J.; Li, C.G. The impact of spur dike on the ecological riverbed of a 180° bend. China Rur. Water Conserv. Hydropower 2024, 90–100. [Google Scholar] [CrossRef]
- Cai, F.; Liu, G. The Development and Technological Innovation of Beach Maintenance and Restoration in China. J. Appl. Oceanogr. 2019, 38, 452–463. [Google Scholar] [CrossRef]
- Da Fontoura Klein, A.H.; Vargas, A.; Raabe, A.L.A.; Hsu, J.R. Visual assessment of bayed beach stability with computer software. Comput. Geosci. 2003, 29, 1249–1257. [Google Scholar] [CrossRef]
- Yang, J.Q.; Tang, L.M.; Huang, P.; Sun, J. Study on incipient velocity of fine sediment in Yongjiang River Estuary. Water Resour. Hydropower Eng. 2018, 49, 149–154. [Google Scholar] [CrossRef]
- Ministry of Transport. Code of Hydrology for Harbor and Waterway; People’s Communications Publishing House Co., Ltd.: Beijing, China, 2015. [Google Scholar]
- Ministry of Transport. Technical Code for Simulation Test of Water Transportation Engineering; People’s Communications Publishing House Co., Ltd.: Beijing, China, 2021. [Google Scholar]
- Xia, Y.M. Design for Coast Movable Bed Model Down-coast Erosion Model of Friendship Harbor in Mauritania. Ocean. Eng. 1994, 12, 12. [Google Scholar] [CrossRef]
- Liu, J.J.; Sun, L.Y. Model Test on Coastal Erosion and Protection Measures in the Downstream of Friendship Port-Concurrently Discussing the Design of Wave Moving Bed Sediment Model. In Proceedings of the 7th National Symposium on Coastal Engineering, Zhuhai, China, 13–16 November 1993; pp. 467–473. [Google Scholar]
- Yi, S.; Pan, Y.; Chen, Y.P. Scale design based on local curve fitting method for low-energy sandy beach. Hydro-Sci. Eng. 2017, 4, 43–51. [Google Scholar] [CrossRef]
- Sun, J.W.; Dong, X.K.; Yu, Y.H.; Wang, P.; Fang, H.C.; Zhang, Z.P. Study on profile design and stability physical model experimental of gravel beach. Mar. Sci. Bull. 2019, 38, 422–428, 454. [Google Scholar] [CrossRef]
- Ge, L.Z.; Chen, H.B. Report on the Research of the Artificial Beach Stability and Regulation Effects in Rizhao; Tianjin Research Institute for Water Transport Engineering, M.O.T.: Tianjin, China, 2017. [Google Scholar]
- Feng, Z.; Shao, T.Z.; Li, Y.Q. Application Innovation of Nature-Based Solutions (NBS) in the Rehabilitation Project of the Western Coastline of Haikou. Waterw. Eng. 2022, 13–20, 30. [Google Scholar] [CrossRef]
- Zhao, Y. Research on the process of profile changes after shoreline remediation and restoration of Hedong Bathing Beach in Qinhuangdao City. Offrode World 2023, 18, 118–120. [Google Scholar] [CrossRef]
- Liang, B.C.; Zhu, M.X.; Qu, Z.P. Numerical simulation comparative analysis of the impact of different sand replenishment schemes on beach profiles. Chin. J. Ocean 2021, 43, 136–145. [Google Scholar] [CrossRef]
- Feng, M.; Ji, K.F.; Bai, Y.C. In situ monitoring of wave dynamics and artificial maintenance of beach erosion in Beidaihe West Beach. Chin. Harb. Constr. 2024, 44, 12. [Google Scholar] [CrossRef]
- Kumar, M.P.; Malleswararao, P.; Girish, B.K. Littoral drift management: A success story of Visakhapatnam port. ISH J. Hydraul. Eng. 2011, 17, 87–98. [Google Scholar] [CrossRef]
Disclaimer/Publisher’s Note: The statements, opinions and data contained in all publications are solely those of the individual author(s) and contributor(s) and not of MDPI and/or the editor(s). MDPI and/or the editor(s) disclaim responsibility for any injury to people or property resulting from any ideas, methods, instructions or products referred to in the content. |
© 2025 by the authors. Licensee MDPI, Basel, Switzerland. This article is an open access article distributed under the terms and conditions of the Creative Commons Attribution (CC BY) license (https://creativecommons.org/licenses/by/4.0/).