
Optimization of Threshold Velocity Values for Sediment Transport at the Outer Bank of a 180-Degree Bend with Emergent Vegetation

 ,
,  and
and 
Abstract
1. Introduction
1.1. Flow Dynamics in Curved Channels
1.2. Incipient Motion of Sediment
1.3. Impact of Vegetation on Sediment Dynamics
2. Materials and Methods
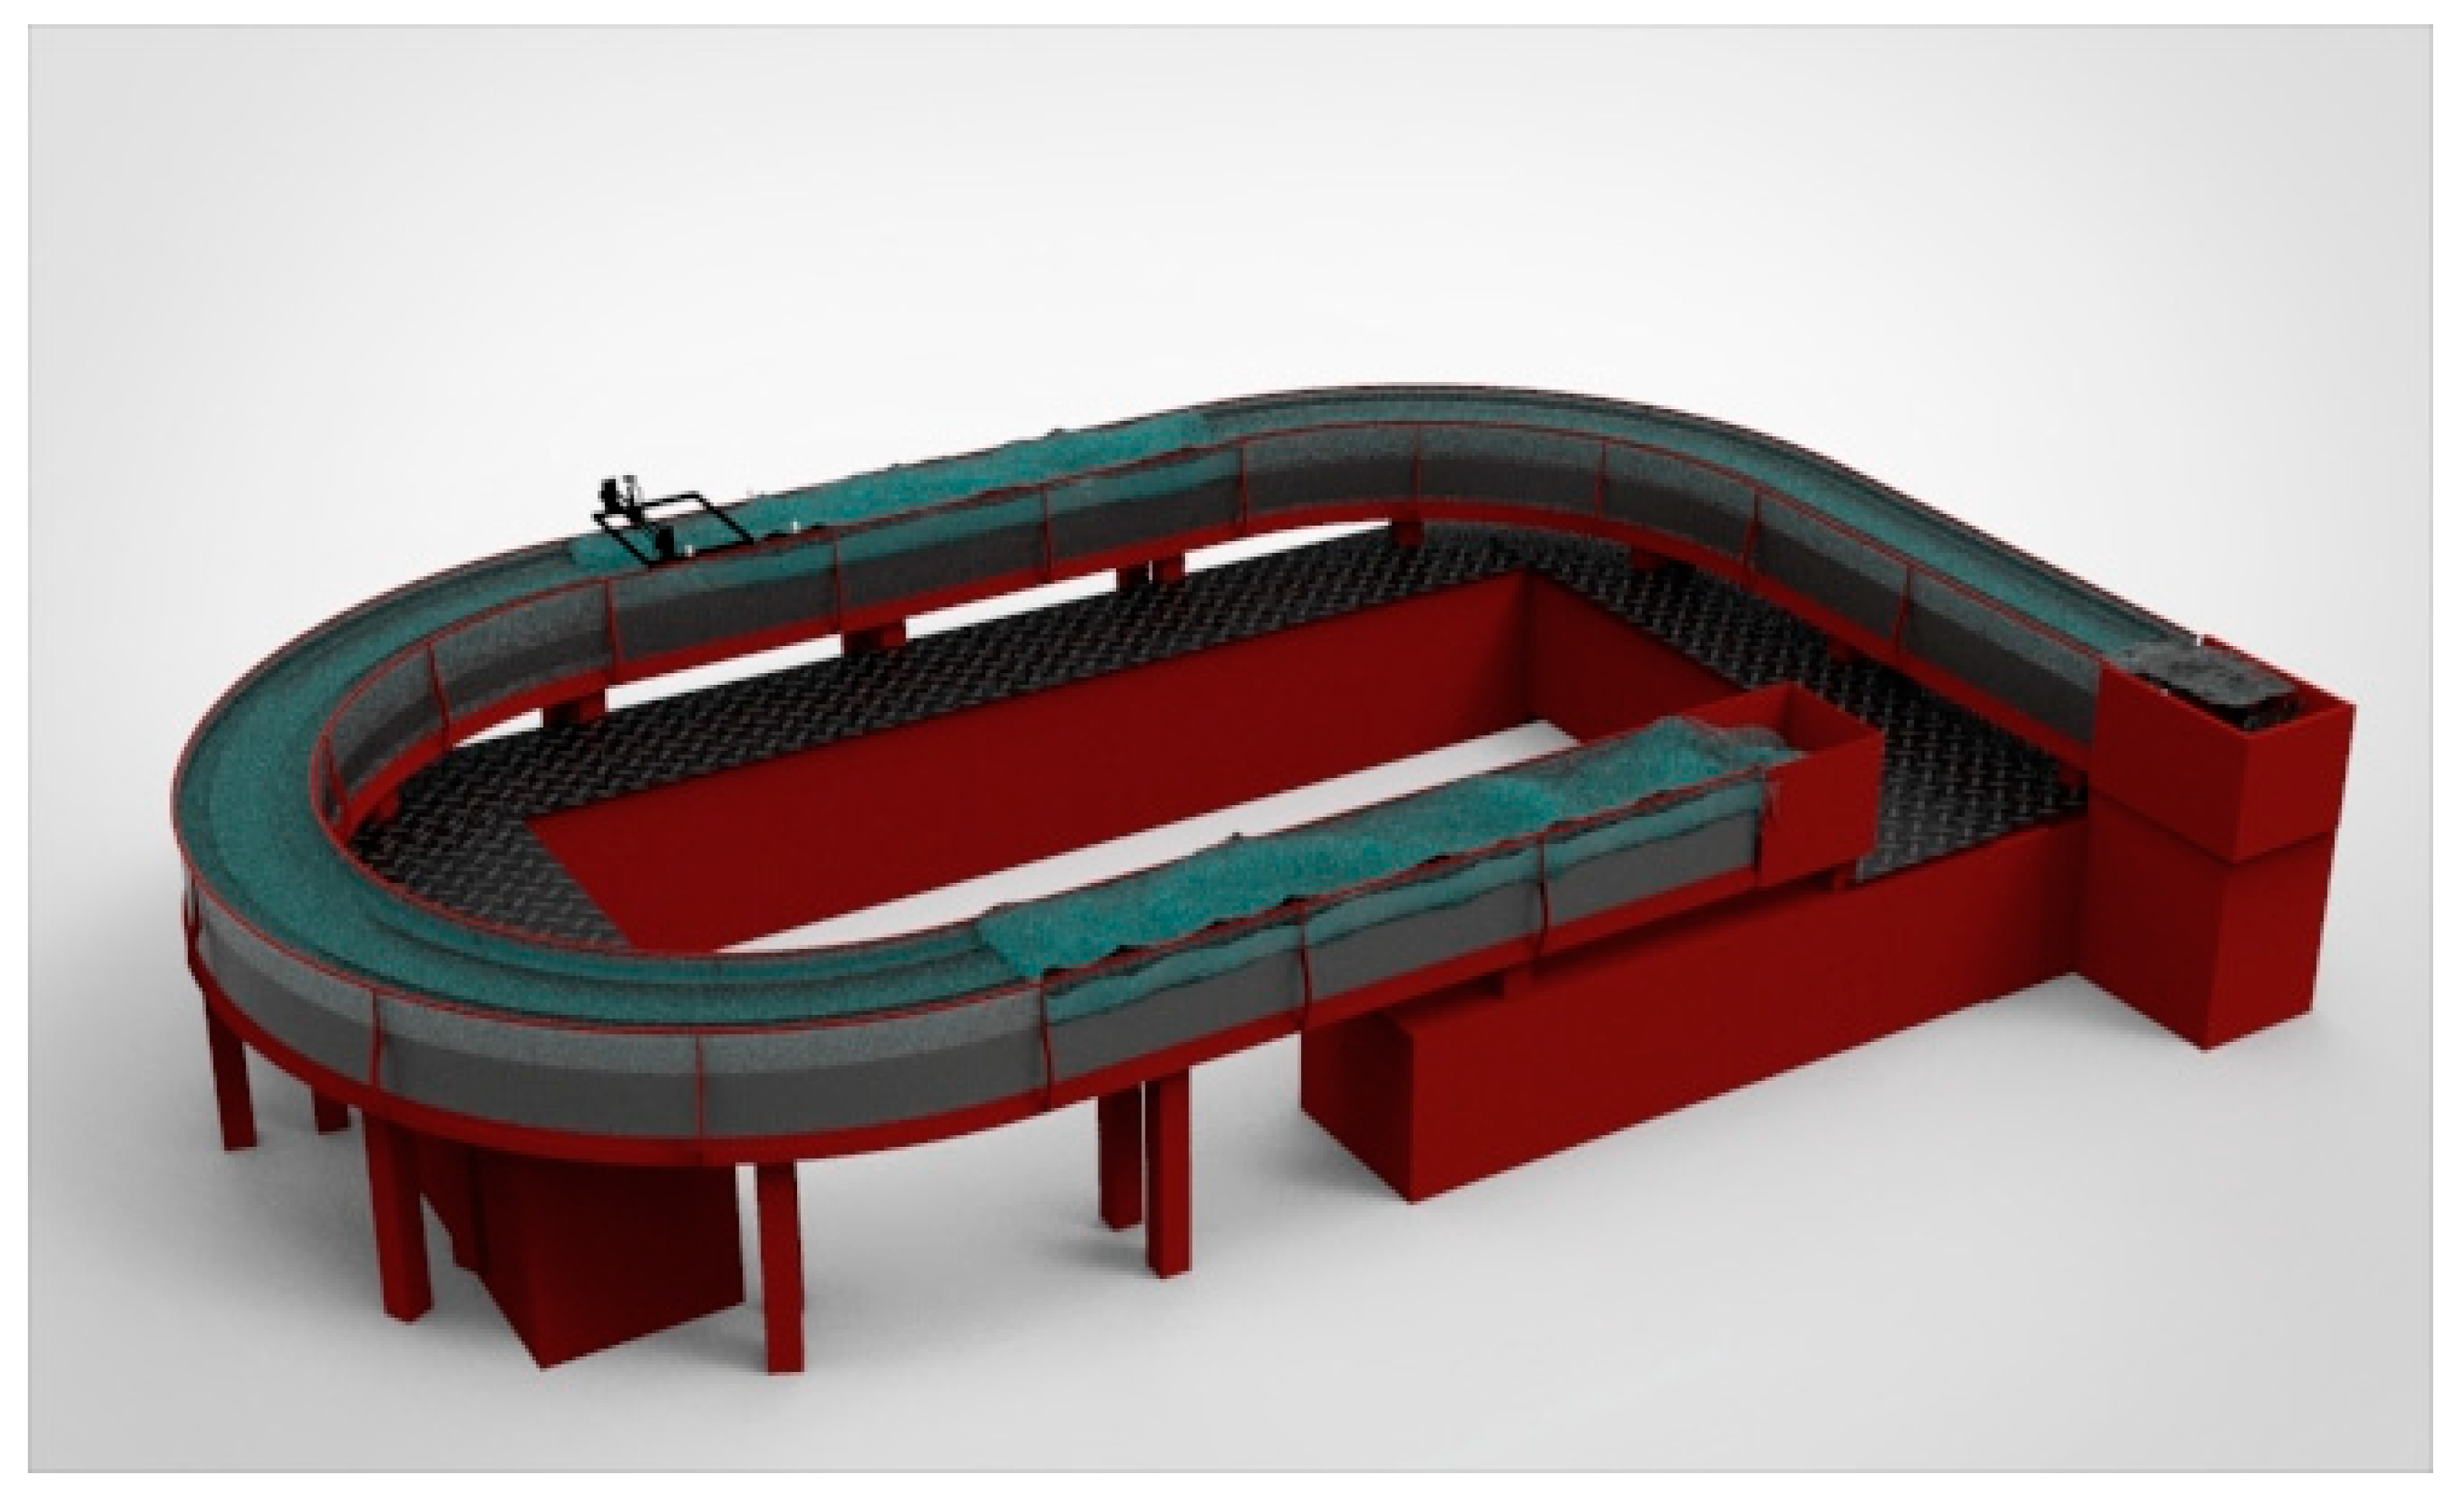
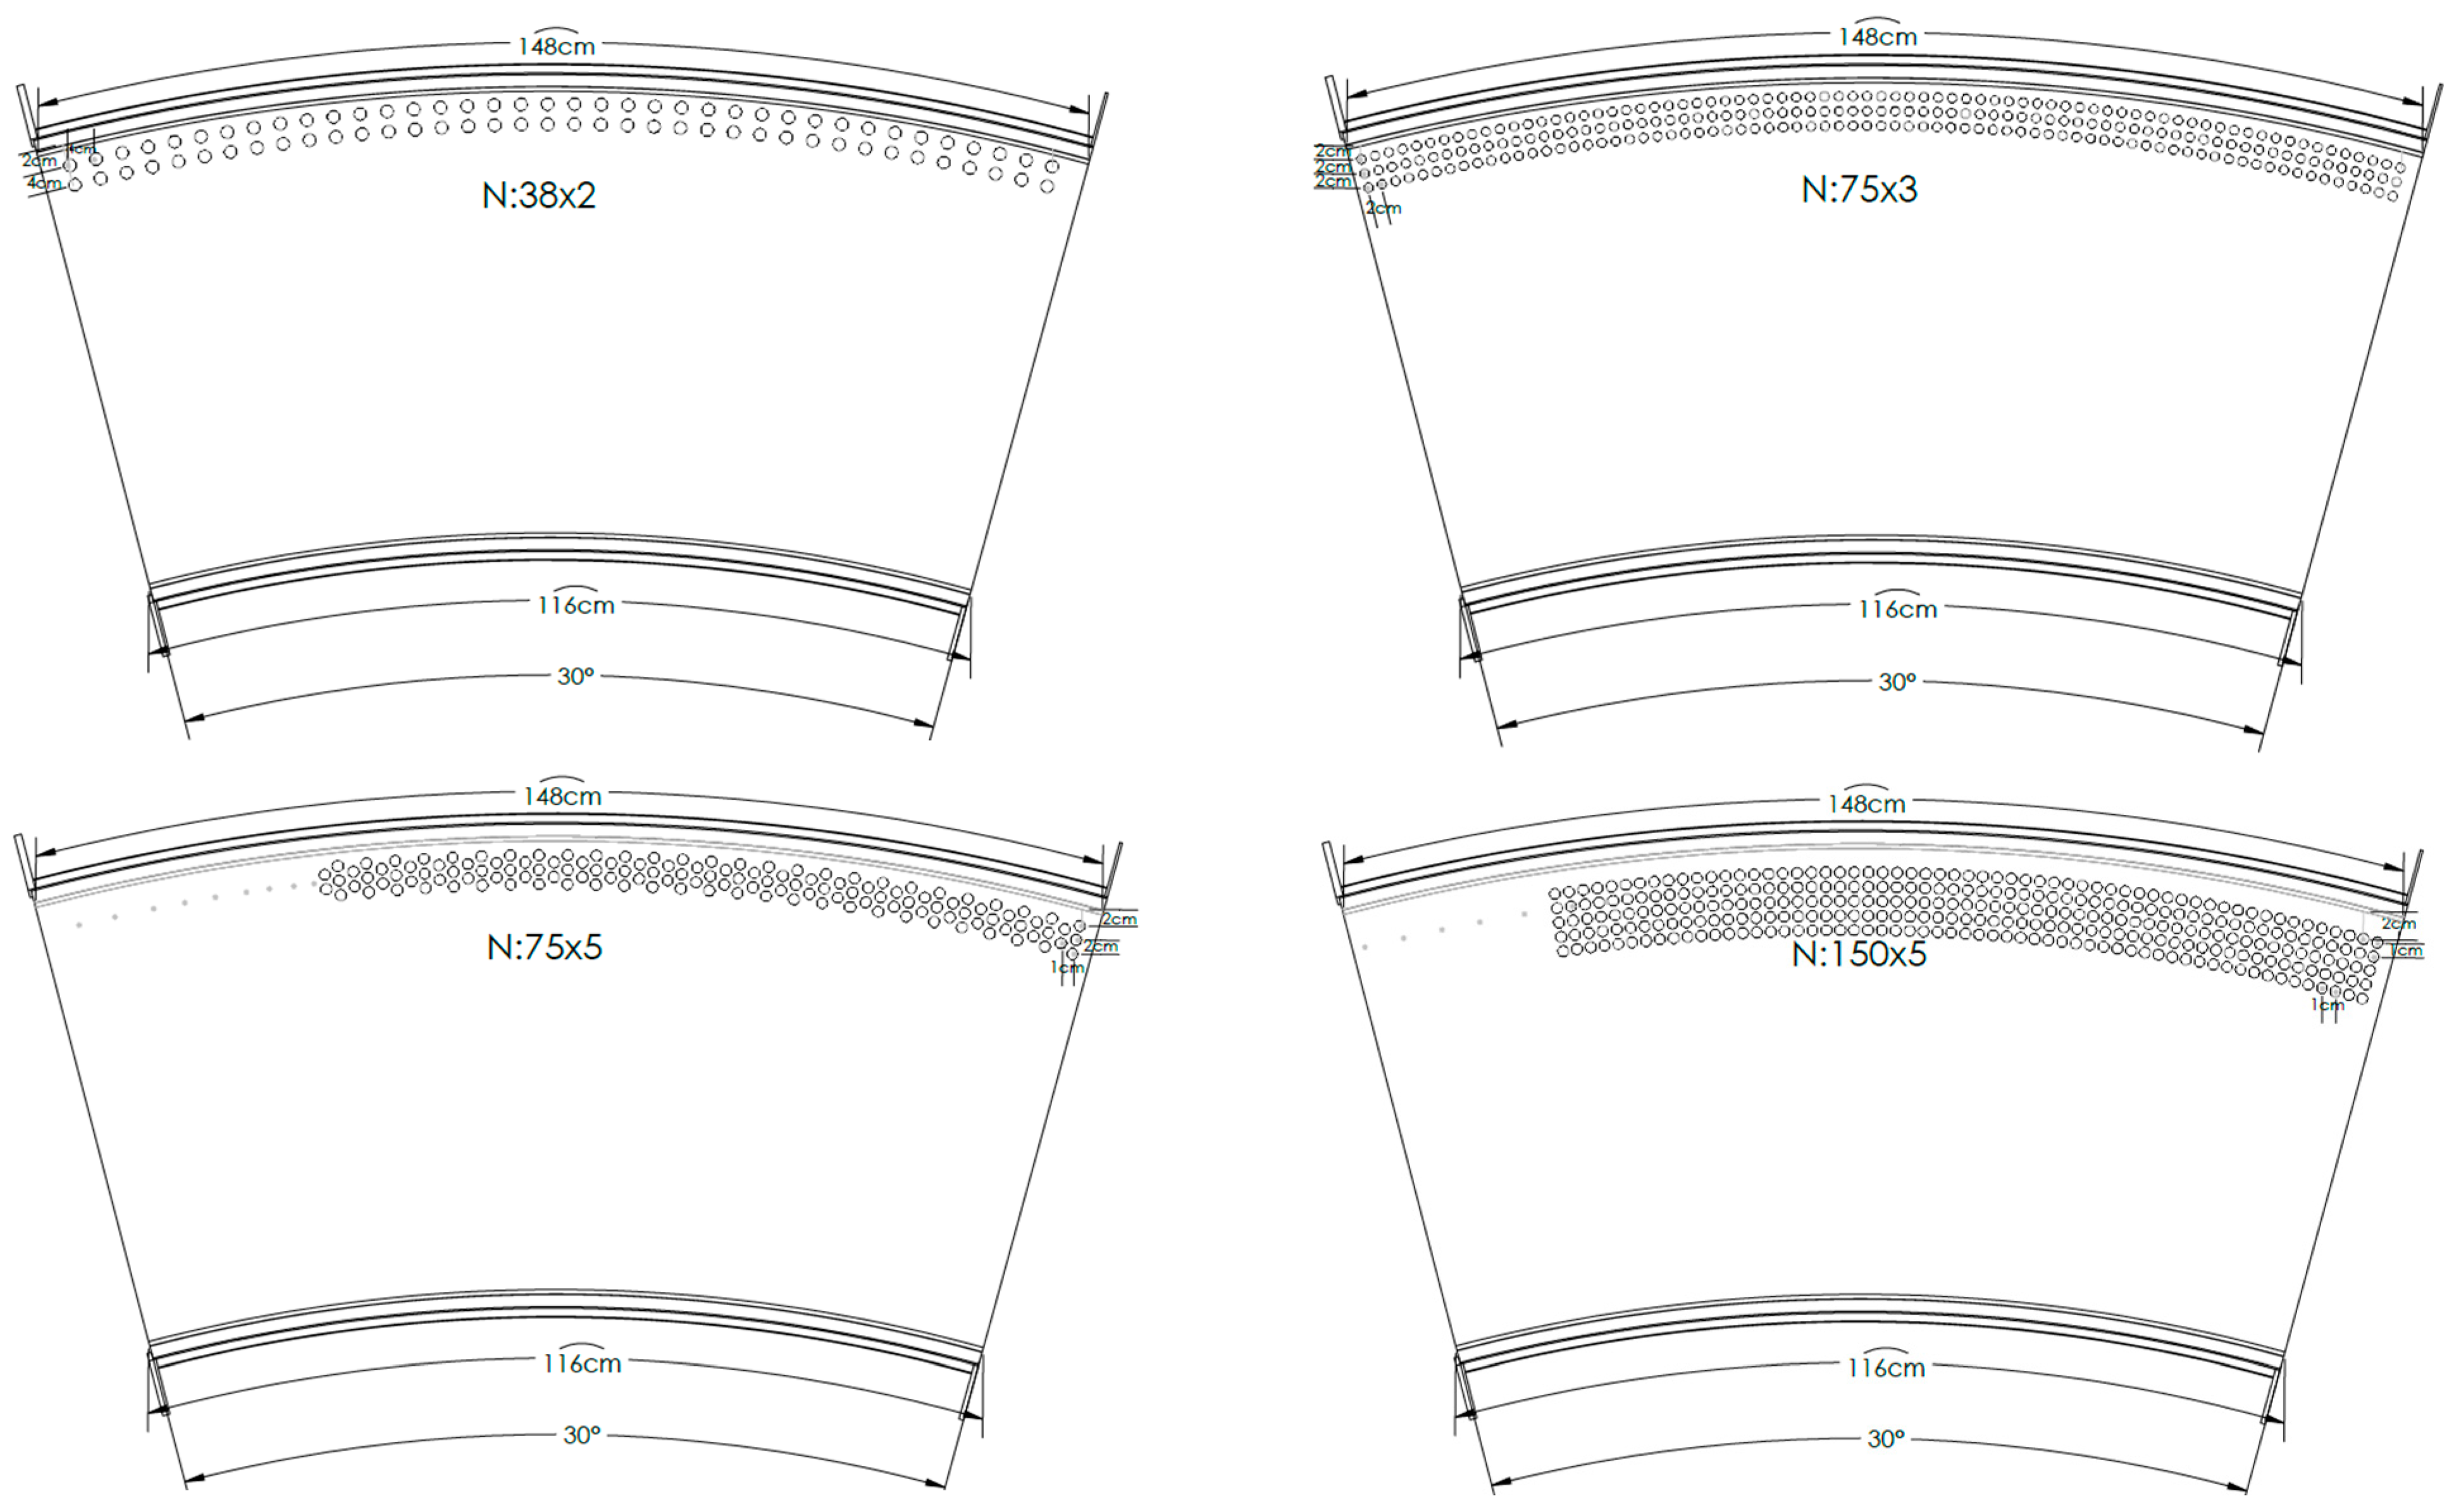
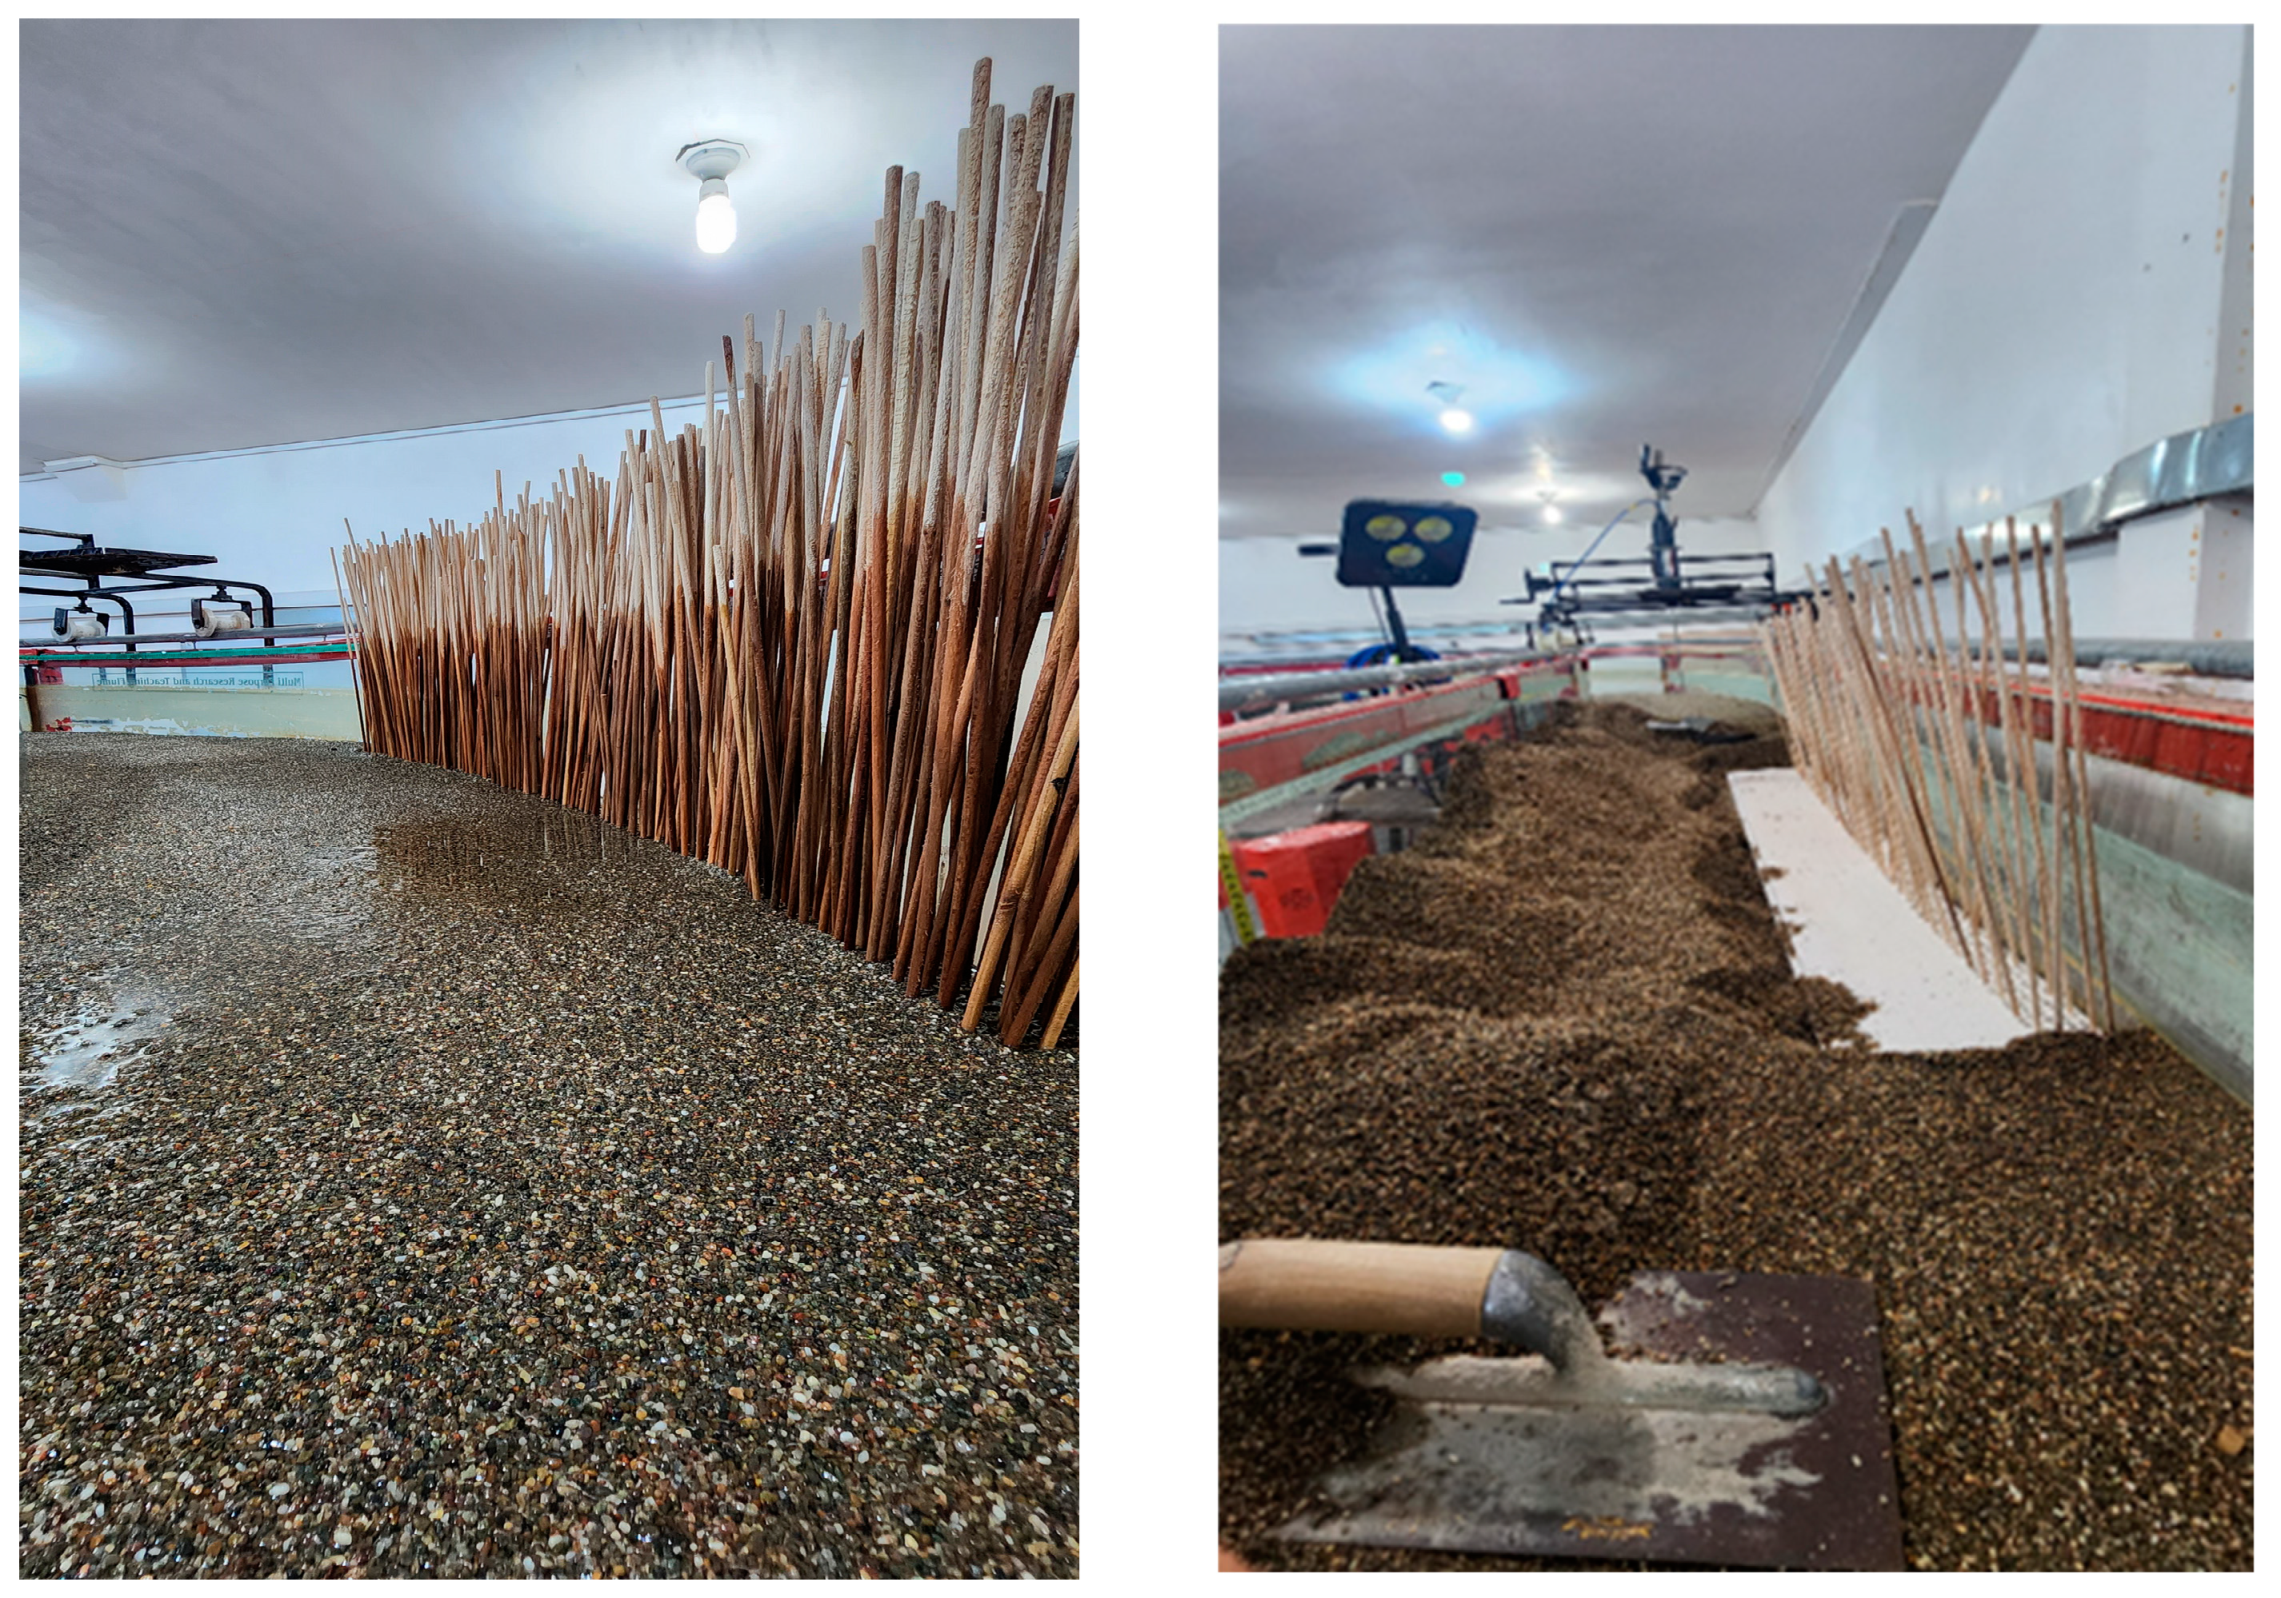
2.1. Physical Model Setup
2.2. Experiments Framework
2.3. Theory
3. Results and Discussion
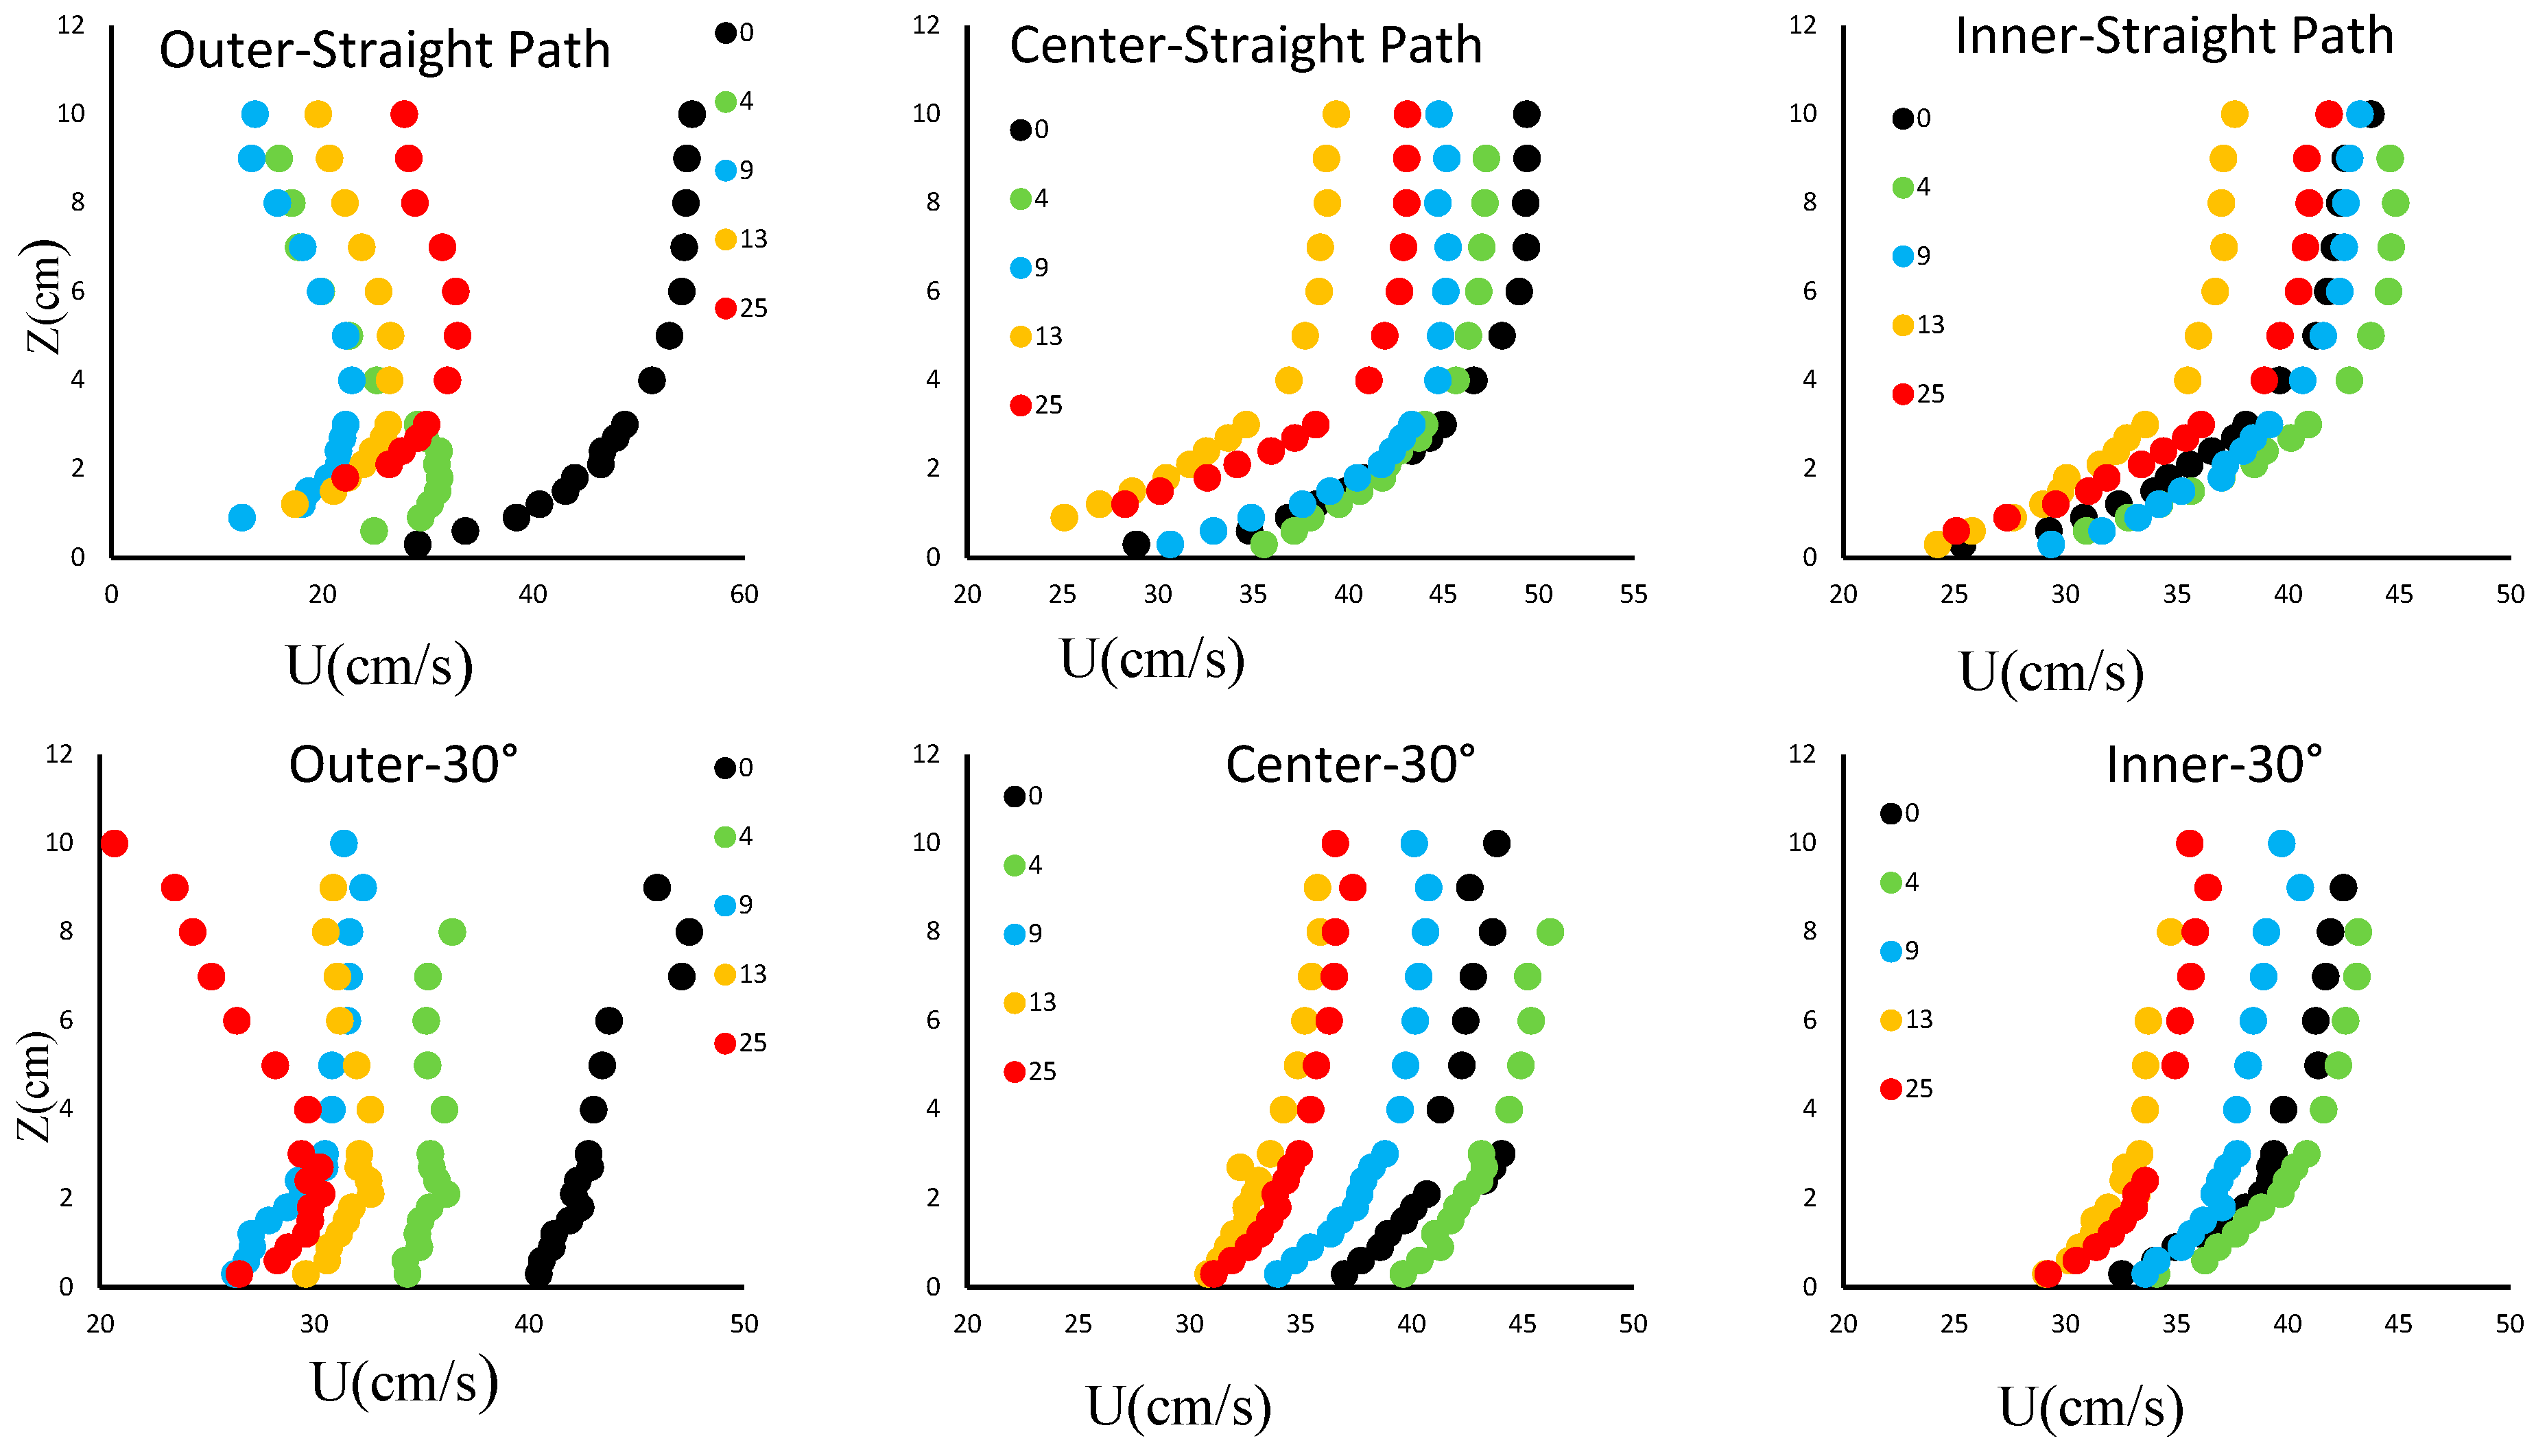
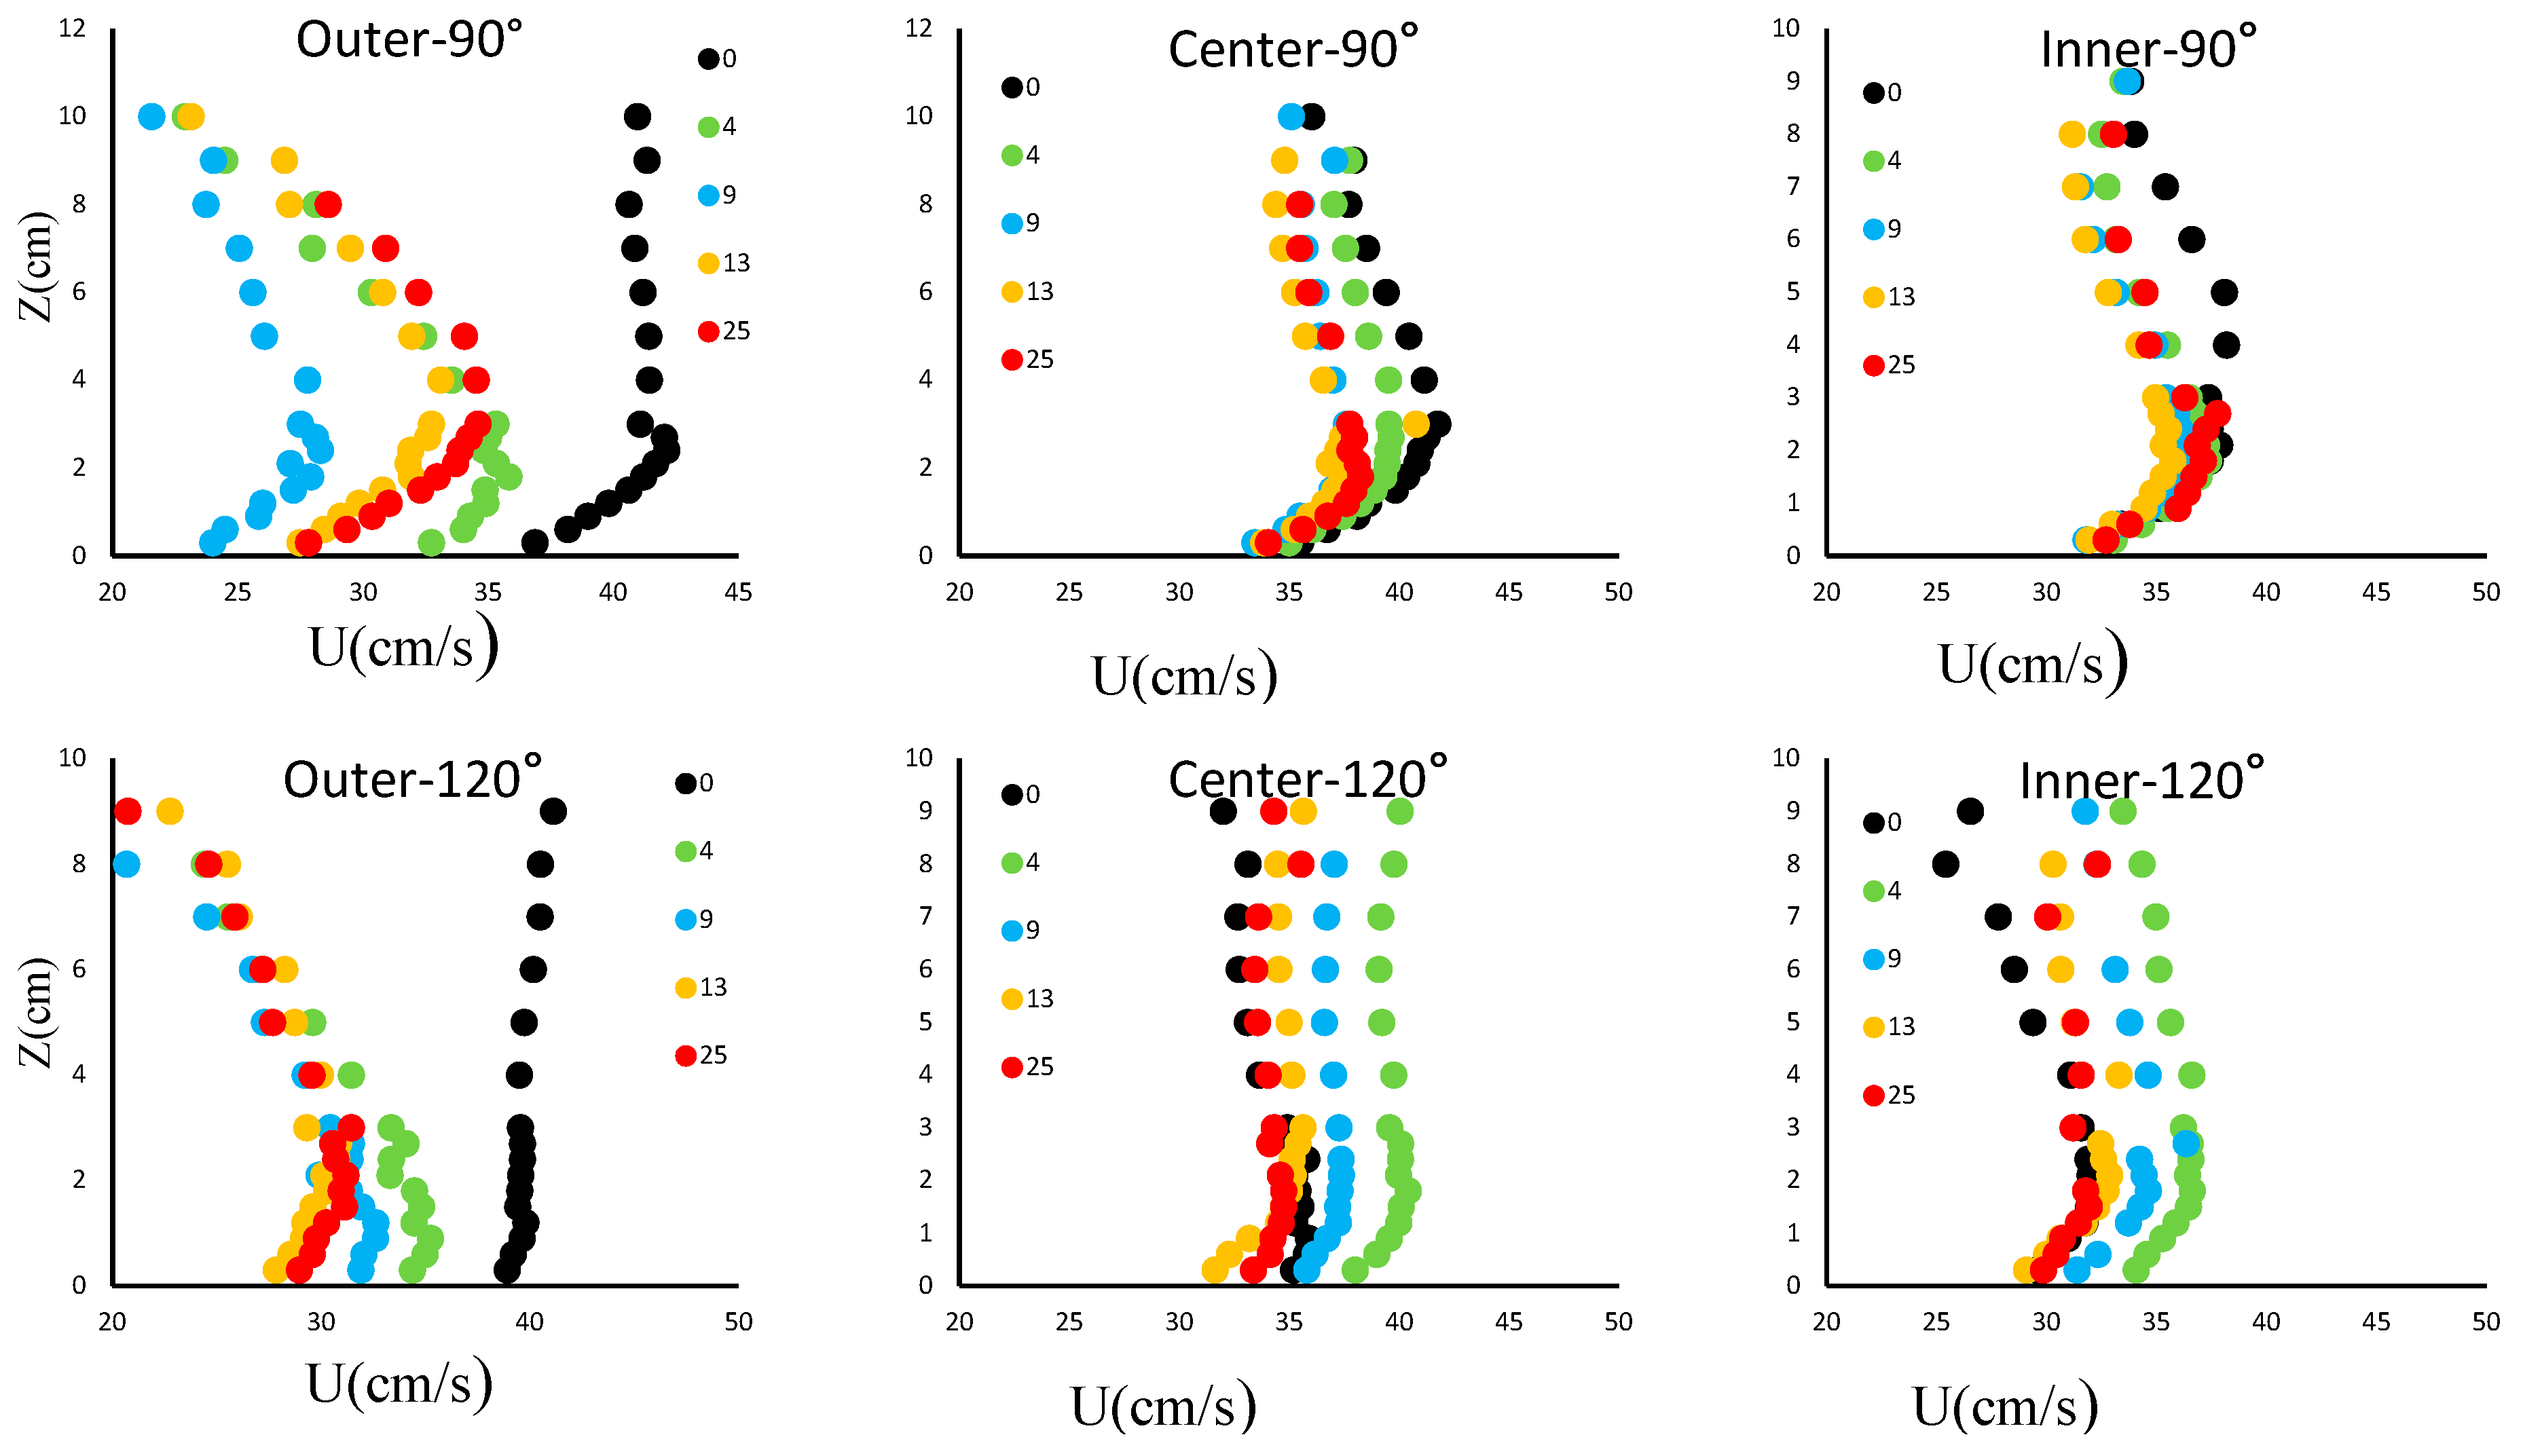
3.1. Distribution of the Downstream Velocity
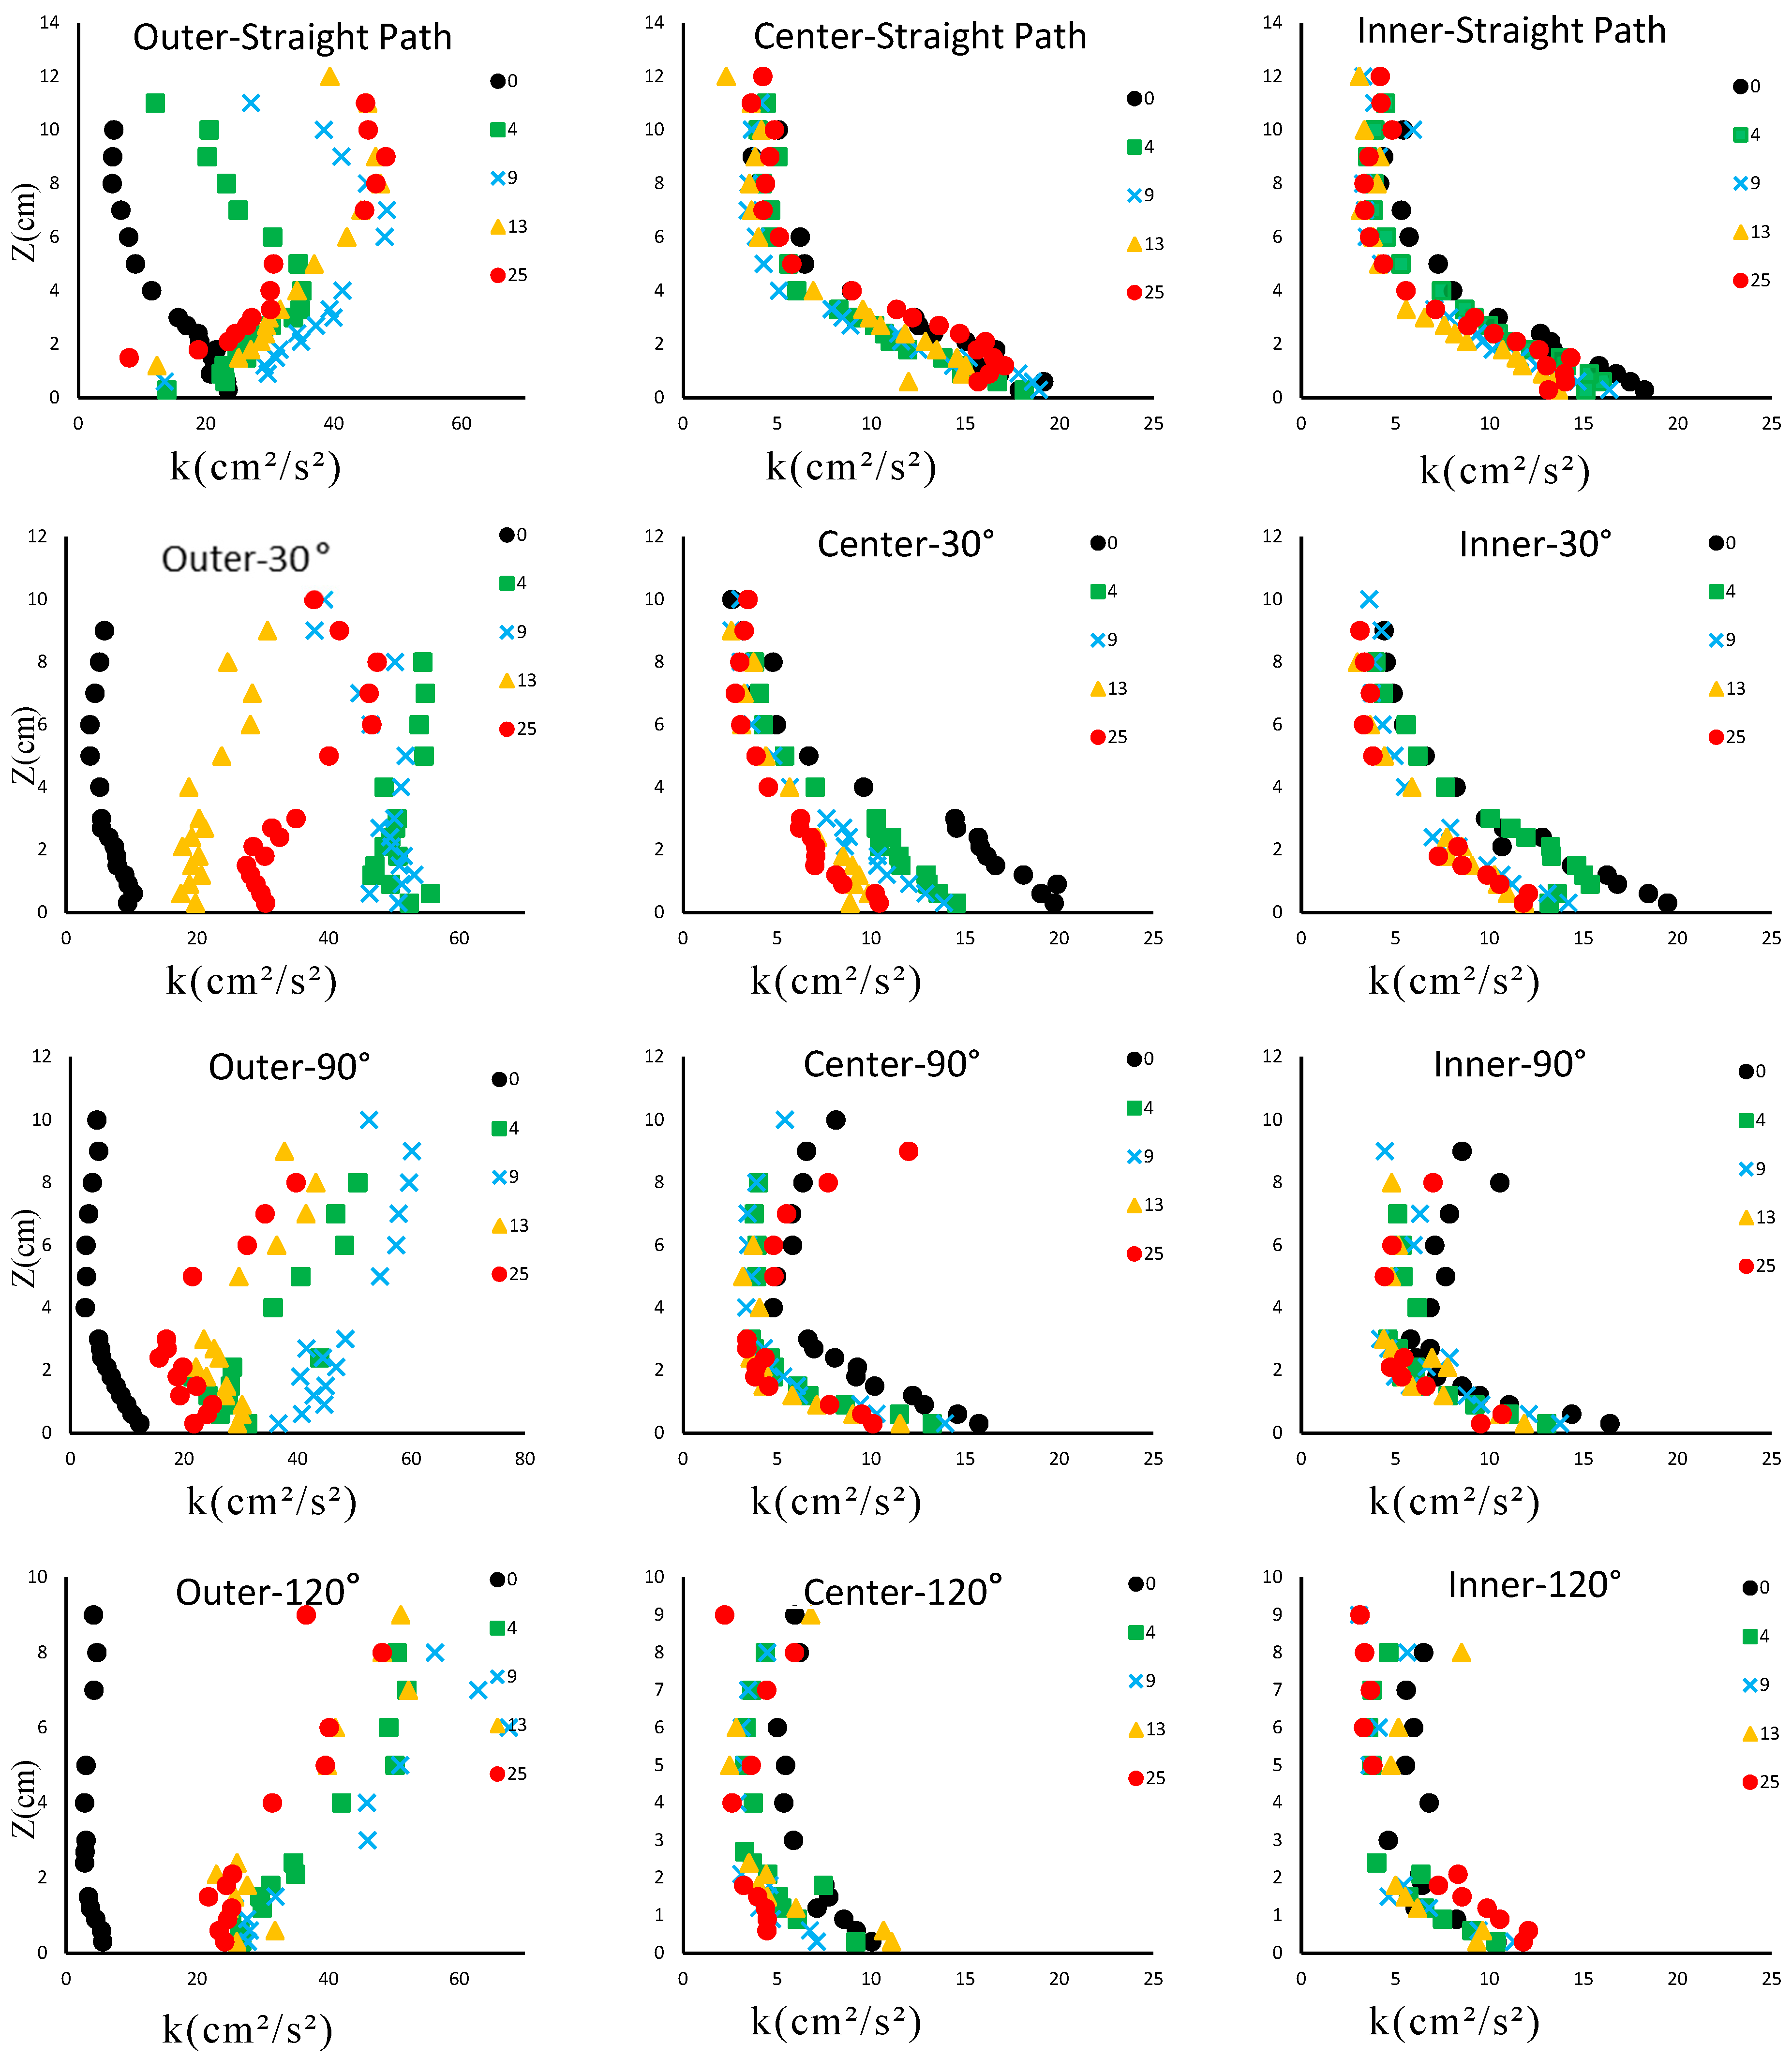
3.2. Distribution of the Turbulent Kinetic Energy (kt)
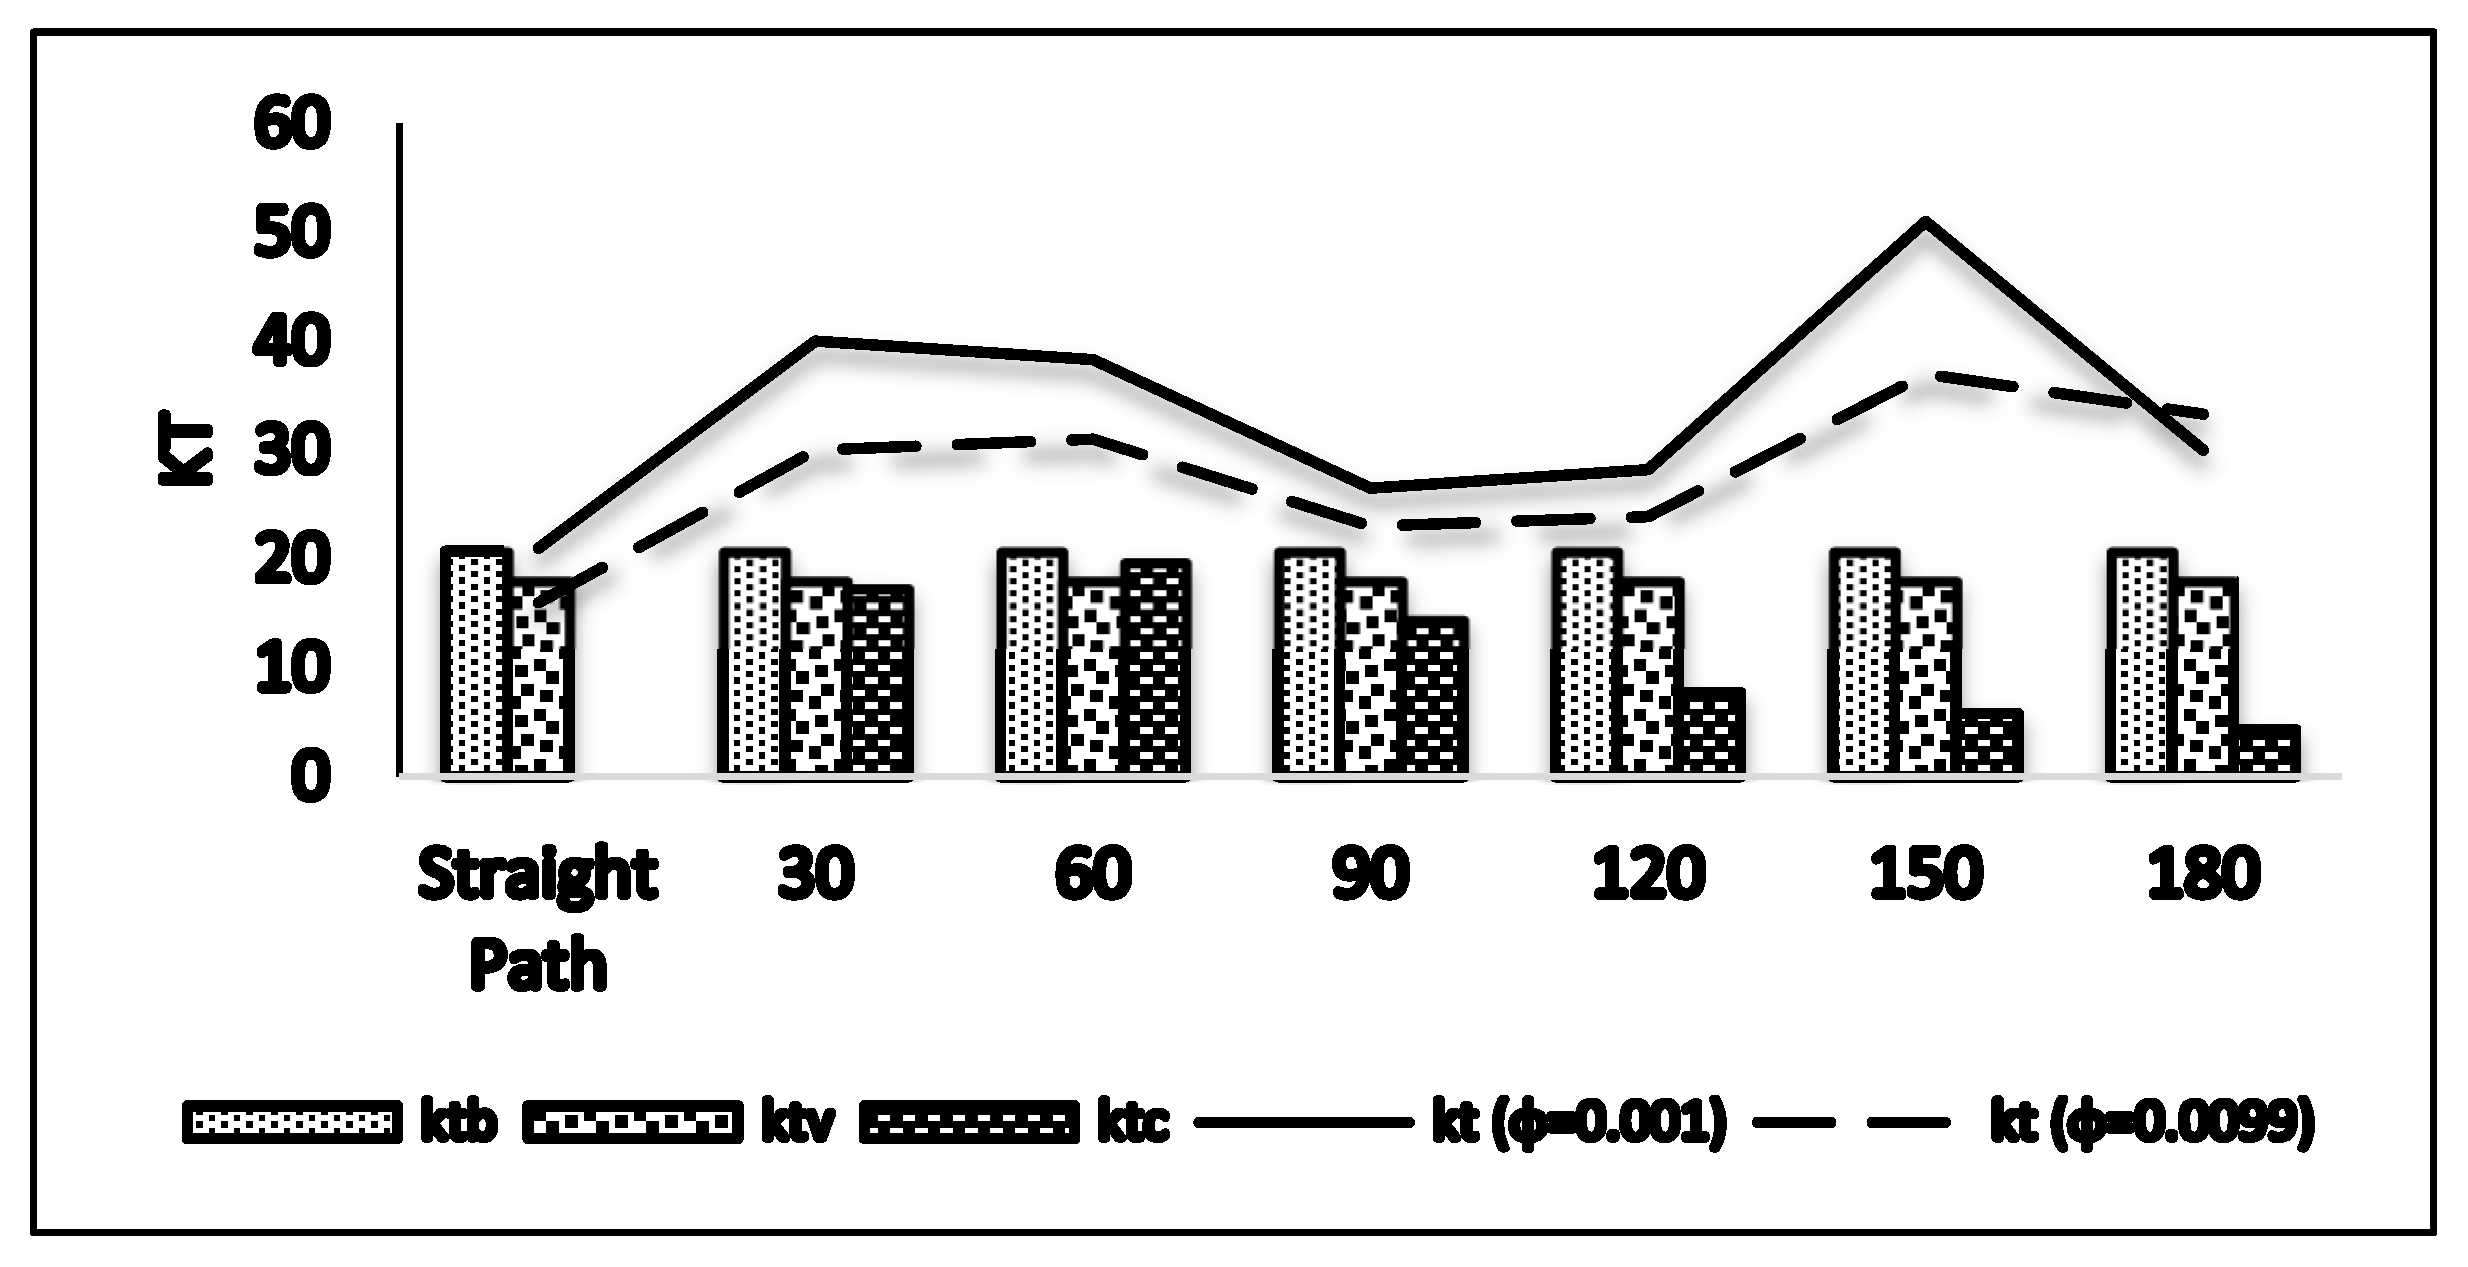
3.3. Assessing the Effects of Various Parameters on Turbulent Kinetic Energy (kt)
3.4. Prediction of Turbulent Kinetic Energy (kt) in Vegetation Regions of Channel Curvature
4. Conclusions
Author Contributions
Funding
Data Availability Statement
Acknowledgments
Conflicts of Interest
References
- Micheli, E.; Kirchner, J. Effects of wet meadow riparian vegetation on streambank erosion: 2. Measurements of vegetated bank strength and consequences for failure mechanics. Earth Surf. Process. Landf. 2002, 27, 687–697. [Google Scholar] [CrossRef]
- Kremen, C. Managing ecosystem services: What do we need to know about their ecology? Ecol. Lett. 2005, 8, 468–479. [Google Scholar] [CrossRef]
- Costanza, R.; d’Arge, R.; de Groot, R.; Farber, S.; Grasso, M.; Hannon, B.; Limburg, K.; Naeem, S.; O’Neill, R.V.; Paruelo, J.; et al. The value of the world’s ecosystem services and natural capital. Nature 1997, 387, 253–260. [Google Scholar] [CrossRef]
- Marani, M.; d’Alpaos, A.; Lanzoni, S.; Santalucia, M. Understanding and predicting wave erosion of marsh edges. Geophys. Res. Lett. 2011, 38, 21401. [Google Scholar] [CrossRef]
- Liu, M.; Huai, W.; Ji, B. Characteristics of the flow structures through and around a submerged canopy patch. Phys. Fluids 2021, 33, 035144. [Google Scholar] [CrossRef]
- Lelpi, A.; Lapôtre, M.G.; Gibling, M.R.; Boyce, C.K. The impact of vegetation on meandering rivers. Nat. Rev. Earth Environ. 2022, 3, 165–178. [Google Scholar] [CrossRef]
- Xu, Y.; Esposito, C.R.; Beltrán-Burgos, M.; Nepf, H.M. Competing effects of vegetation density on sedimentation in deltaic marshes. Nat. Commun. 2022, 13, 4641. [Google Scholar] [CrossRef] [PubMed]
- Zhu, L.; Chen, D.; Hassan, M.A.; Venditti, J.G. The influence of riparian vegetation on the sinuosity and lateral stability of meandering channels. Geophys. Res. Lett. 2022, 49, e2021GL096346. [Google Scholar] [CrossRef]
- Deitrick, A.R.; Hovendon, E.H.; Ralston, D.K.; Nepf, H. The influence of vegetation-generated turbulence on deposition in emergent canopies. Front. Mar. Sci. 2023, 10, 1266241. [Google Scholar] [CrossRef]
- Wang, M.; Mi, S.; Avital, E.; Li, N.; Chen, Y.; Williams, J. A Study on the Influence of Submergence Ratio on the Transport of Suspended Sediment in a Partially Vegetated Channel Flow. Water Resour. Res. 2023, 59, e2022WR032876. [Google Scholar] [CrossRef]
- Wang, M.; Avital, E.; Korakianitis, T.; Williams, J.; Ai, K. A numerical study on the influence of curvature ratio and vegetation density on a partially vegetated U-bend channel flow. Adv. Water Resour. 2021, 148, 103843. [Google Scholar] [CrossRef]
- Khosravi, K.; Chegini, A.H.N.; Mao, L.; Rodriguez, J.F.; Saco, P.M.; Binns, A.D. Experimental Analysis of Incipient Motion for Uniform and Graded Sediments. Water 2021, 13, 1874. [Google Scholar] [CrossRef]
- Yang, J.; Chung, H.; Nepf, H. The onset of sediment transport in vegetated channels predicted by turbulent kinetic energy. Geophys. Res. Lett. 2016, 43, 261–268. [Google Scholar] [CrossRef]
- Randle, T.J. Use of Multidimensional Models to Investigate Boundary Shear Stress through Meandering River Channels. Water 2020, 12, 3506. [Google Scholar] [CrossRef]
- Bertalan, L.; Novák, T.J.; Németh, Z.; Rodrigo-Comino, J.; Kertész, Á.; Szabó, S. Issues of meander development: Land degradation or ecological value? The example of the Sajó River, Hungary. Water 2018, 10, 1613. [Google Scholar] [CrossRef]
- Garcia, J.T.; Castillo, L.G.; Haro, P.L.; Carrillo, J.M. Occlusion in Bottom Intakes with Circular Bars by Flow with Gravel-Sized Sediment. An Experimental Study. Water 2018, 10, 1699. [Google Scholar] [CrossRef]
- Das, V.K.; Barman, K.; Roy, S.; Chaudhuri, S.; Debnath, K. Near bank turbulence of a river bend with self similar morphological structures. Catena 2020, 191, 104582. [Google Scholar] [CrossRef]
- Moghaddassi, N.; Musavi-Jahromi, S.H.; Vaghefi, M.; Khosrojerdi, A. Effect of Mean Velocity-to-Critical Velocity Ratios on Bed Topography and Incipient Motion in a Meandering Channel: Experimental Investigation. Water 2021, 13, 883. [Google Scholar] [CrossRef]
- Parker, G.; Andrews, E.D. Sorting of Bed Load Sediment by Flow in Meander Bends. Water Resour. Res. 1985, 21, 1361–1373. [Google Scholar] [CrossRef]
- Yen, C.L.; Lee, K.T. Bed topography and sediment sorting in channel bend with unsteady flow. J. Hydraul. Eng. 1995, 121, 591–599. [Google Scholar] [CrossRef]
- Blanckaert, K.; Graf, W.H. Mean flow and turbulence in open channel bends. Hydraul. Eng. 2001, 127, 835–847. [Google Scholar] [CrossRef]
- Xu, D.; Bai, Y. Experimental study on the bed topography evolution in alluvial meandering rivers with various sinuousnesses. J. Hydro-Environ. Res. 2013, 7, 92–102. [Google Scholar] [CrossRef]
- Vaghefi, M.; Akbari, M.; Fiouz, A. An Experimental Study of Mean and Turbulent Flow in a 180-Degree Sharp Open Channel Bend: Secondary Flow and Bed Shear Stress. KSCE J. Civ. Eng. 2016, 20, 1582–1593. [Google Scholar] [CrossRef]
- Núñez-González, F.; Rovira, A.; Ibàñez, C. Bed load transport and incipient motion below a large gravel bed river bend. Adv. Water Resour. 2018, 120, 83–97. [Google Scholar] [CrossRef]
- Rismani, N.; Afzalimehr, H.; Asghari-Pari, S.-A.; Nazari-Sharabian, M.; Karakouzian, M. Influence of a Meandering Channel on the Threshold of Sediment. Water 2024, 16, 2162. [Google Scholar] [CrossRef]
- Shafaei, H.; Esmaili, K.; Beheshti, A. Experimental Study of Hydrodynamics of Inbank and Overbank Flows in Meandering Compound Channel. Water Resour. Manag. 2025, 39, 1121–1138. [Google Scholar] [CrossRef]
- Shields, A.F. Application of Similarity Principles and Turbulence Research to Bed-Load Movement; California Institute of Technology: Pasadena, CA, USA, 1936. (In Germany) [Google Scholar]
- Kramer, H. Sand Mixtures and Sand Movement in Fluvial Model. Trans. Am. Soc. Civ. Eng. 1935, 100, 798–838. [Google Scholar] [CrossRef]
- Neill, C.R. Note on initial movement of coarse uniform bed-material. J. Hydraul. Res. 1968, 6, 173–176. [Google Scholar] [CrossRef]
- Bagnold, R.A. The nature of saltation and of ‘bed-load’transport in water. Proc. R. Soc. Lond. A Math. Phys. Sci. 1973, 332, 473–504. [Google Scholar] [CrossRef]
- Lavelle, J.W.; Mofjeld, H.O. Do critical stresses for incipient motion and erosion really exist? J. Hydraul. Eng. 1987, 113, 370–385. [Google Scholar] [CrossRef]
- Dey, S.; Debnath, K. Influence of streamwise bed slope on sediment threshold under stream flow. J. Irrig. Drain. Eng. 2000, 126, 255–263. [Google Scholar] [CrossRef]
- Afzalimehr, H.; Dey, S.; Rasoulianfar, P. Influence of decelerating flow on incipient motion of a gravel-bed stream. J. Sadhana 2007, 32, 545–559. [Google Scholar] [CrossRef]
- Motamedi, A.; Afzalimehr, H.; Singh, V.P. Evaluation of a Novel Approach to Determine the Critical Shields Stress. J. Hydrol. Eng. 2010, 15, 892–900. [Google Scholar] [CrossRef]
- Bolhassani, R.; Afzalimehr, H.; Dey, S. Effects of Relative Submergence and Bed Slope on Sediment Incipient Motion under Decelerating Flows. J. Hydrol. Hydromech. 2015, 63, 295–302. [Google Scholar] [CrossRef]
- Dodangeh, E.; Afzalimehr, H. Incipient motion of sediment particles in the presence of bed forms under decelerating and accelerating flows. Hydrol. Hydromech. 2022, 70, 89–102. [Google Scholar] [CrossRef]
- Nepf, H. Drag, turbulence, and diffusion in flow through emergent vegetation. J. Water Resour. Res. 1999, 35, 479–489. [Google Scholar] [CrossRef]
- Nepf, H. Flow and transport in regions with aquatic vegetation. Annu. Rev. Fluid Mech. 2012, 44, 123–142. [Google Scholar] [CrossRef]
- Hamidifar, H.; Keshavarzi, A.; Truong, P. Enhancement of river bank shear strength parameters using Vetiver grass root system. Arab. J. Geosci. 2018, 11, 611. [Google Scholar] [CrossRef]
- Bonilla-Porras, J.A.; Armanini, A.; Crosato, A. Extended Einstein’s parameters to include vegetation in existing bedload predictors. Adv. Water Resour. 2021, 152, 103928. [Google Scholar] [CrossRef]
- Tinoco, R.O.; Coco, G. Observations of the effect of emergent vegetation on sediment resuspension under unidirectional currents and waves. Earth Surf. Dyn. 2014, 2, 83–96. [Google Scholar] [CrossRef]
- Tinoco, R.O.; Coco, G. Turbulence as the main driver of resuspension in oscillatory flow through vegetation. J. Geophys. Res. Earth Surf. 2018, 123, 891–904. [Google Scholar] [CrossRef]
- Shahmohammadi, R.; Afzalimehr, H.; Sui, J. Impacts of turbulent flow over a channel bed with a vegetation patch on the incipient motion of sediment. Can. J. Civ. Eng. 2018, 9, 803–816. [Google Scholar] [CrossRef]
- Jordanova, A.A.; James, C.S. Experimental study of bed load transport through emergent vegetation. ASCE J. Hydraul. Eng. 2003, 129, 474–478. [Google Scholar] [CrossRef]
- Kothyari, U.C.; Hashimoto, H.; Hayashi, K. Effect of tall vegetation on sediment transport by channel flows. J. Hydraul. Res. 2009, 47, 700–710. [Google Scholar] [CrossRef]
- Yager, E.; Schmeeckle, M. The influence of vegetation on turbulence and bed load transport. J. Geophys. Res. Earth Surf. 2013, 118, 1585–1601. [Google Scholar] [CrossRef]
- Hongwu, T.; Wang, H.; Liang, D.F.; Lv, S.Q.; Yan, L. Incipient motion of sediment in the presence of emergent rigid vegetation. J. Hydro-Environ. Res. 2013, 7, 202–208. [Google Scholar] [CrossRef]
- Wang, H.; Tang, H.W.; Zhao, H.Q.; Zhao, X.Y.; Lu, S.Q. Incipient motion of sediment in presence of submerged flexible vegetation. Water Sci. Eng. 2015, 8, 63–67. [Google Scholar] [CrossRef]
- Hadian, S.; Afzalimehr, H.; Sui, J. Incipient Motion of Bed Material in a Channel with Varying Width and Vegetated Channel Walls. Water 2023, 15, 3691. [Google Scholar] [CrossRef]
- Gurnell, A. Plants as River System Engineers. Earth Surf. Process. Landf. 2014, 39, 4–25. [Google Scholar] [CrossRef]
- Kim, H.S.; Kimura, I.; Shimizu, Y. Bed Morphological Changes around a Finite Patch of Vegetation. Earth Surf. Process. Landf. 2015, 40, 375–388. [Google Scholar] [CrossRef]
- Hamidifar, H.; Omid, M.H.; Keshavarzi, A. Longitudinal Dispersion in Waterways with Vegetated Floodplain. Ecol. Eng. 2015, 84, 398–407. [Google Scholar] [CrossRef]
- Langendoen, E.J.; Richard Lowrance, R.; Simon, A. Assessing the Impact of Riparian Processes on Streambank Stability. Ecohydrology 2009, 2, 360–369. [Google Scholar] [CrossRef]
- Liu, C.; Nepf, H. Sediment Deposition within and around a Finite Patch of Model Vegetation over a Range of Channel Velocity. Water Resour. Res. 2016, 52, 600–612. [Google Scholar] [CrossRef]
- Vargas-Luna, A.; Crosato, A.; Anders, N.; Hoitink, A.J.F.; Keesstra, S.D.; Uijttewaal, W.S.J. Morphodynamic Eects of Riparian Vegetation Growth after Stream Restoration. Earth Surf. Process. Landf. 2018, 43, 1591–1607. [Google Scholar] [CrossRef]
- Keshavarzi, A.; Hamidifar, H.; Ball, J. Bed morphology in vegetated estuarine river with mild curved meander bend. Hydrol. Sci. J. 2016, 11, 2033–2049. [Google Scholar] [CrossRef]
- Hamidifar, H.; Keshavarzi, A.; Rowiński, P.M. Influence of Rigid Emerged Vegetation in a Channel Bend on Bed Topography and Flow Velocity Field: Laboratory Experiments. Water 2020, 12, 118. [Google Scholar] [CrossRef]
- Wang, M.; Yu, Q.; Xu, Y.; Li, N.; Wang, J.; Cao, B.; Wang, L.; Avital, E.J. A Numerical Study on the Influence of Riparian Vegetation Patch on the Transportation of Suspended Sediment in a U-Bend Channel Flow. Fluids 2024, 9, 109. [Google Scholar] [CrossRef]
- Rismani, N.; Afzalimehr, H.; Asghari-Pari, S.A.; Nazari-Sharabian, M.; Karakouzian, M. Incipient motion of sediment by turbulent kinetic energy in the presence of emergent vegetation in the outer sidewall of a bend. ISH J. Hydraul. Eng. 2024, 1–9. [Google Scholar] [CrossRef]
- Raeisifar, H.; Rahimpour, A.R.; Afzalimehr, H.; Yagci, O.; Valyrakis, M. Experimental Assessment of the Turbulent Flow Field Due to Emergent Vegetation at a Sharply Curved Open Channel. Water 2025, 17, 205. [Google Scholar] [CrossRef]
- Galia, T.; Poledniková, Z. Two decades of meander belt morphodynamics: How important is woody vegetation and in-channel large wood? Catena 2025, 249, 108673. [Google Scholar] [CrossRef]
- Rozovskii, I.L. Flow of Water in Bends of Open Channels; English Translation, Isr. Program for Sci. Transl., Jerusalem, 1961; Academy of Sciences of the Ukrainian SSR: Kiev, Ukraine, 1957. (In Russian) [Google Scholar]
- Zhang, Y.; Lai, X.; Zhang, L.; Song, K.; Yao, X.; Gu, L.; Pang, C. The influence of aquatic vegetation on flow structure and sediment deposition: A field study in Dongting Lake, China. J. Hydrol. 2020, 584, 124644. [Google Scholar] [CrossRef]
- Asaeda, T.; Gomes, P.I.A.; Sakamoto, K.; Rashid, M.H. Tree colonization trends on a sediment bar after a major flood. River Res. Appl. 2011, 27, 976–984. [Google Scholar] [CrossRef]
- Xu, Y.; Nepf, H. Measured and predicted turbulent kinetic energy in flow through emergent vegetation with real plant morphology. Water Resour. Res. 2020, 56, e2020WR027892. [Google Scholar] [CrossRef]
- Wang, X.; Yang, Y.; Liu, J.; Pu, X.; Qian, D.; Li, J. Incipient Motion of Gravel Bedload Considering the Secondary Flow in Bend. Converter 2021, 432–448. [Google Scholar] [CrossRef]
- Yang, J.; Nepf, H. A turbulence-based bed-load transport model for bare and vegetated channels. Geophys. Res. Lett. 2018, 45, 10428–10436. [Google Scholar] [CrossRef]
- Stapleton, K.; Huntley, D. Seabed stress determinations using the inertial dissipation method and the turbulent kinetic energy method. Earth Surf. Process. Landf. 1995, 20, 807–815. [Google Scholar] [CrossRef]
- Tanino, Y.; Nepf, H.M. Lateral dispersion in random cylinder arrays at high Reynolds number. J. Fluid Mech. 2008, 600, 339–371. [Google Scholar] [CrossRef]
- Batchelor, G. Pressure fluctuations in isotropic turbulence. Math. Proc. Camb. Philos. Soc. 1951, 47, 359–374. [Google Scholar] [CrossRef]
- Dittrich, A.N.; Nestmann, F.; Ergenzinger, P. Ratio of lift and shear forces over rough surfaces. In Coherent Flow Structures in Open Channels; Ashworth, P., Bennett, S., Best, J., McLelland, S., Eds.; Wiley: Chichester, UK, 1996; Volume 1, pp. 125–146. [Google Scholar]
- Zanke, U.C.E. On the influence of turbulence on the initiation of sediment motion. J. Sediment. Res. 2003, 18, 18–32. [Google Scholar]
- Wilcock, P.R. Estimating local bed shear stress from velocity observations. Water Resour. Res. 1996, 32, 3361–3366. [Google Scholar] [CrossRef]
- Julien, P.Y. Erosion and Sedimentation; Cambridge University Press: Cambridge, UK, 2010. [Google Scholar] [CrossRef]
- Cheng, K.C.; Lin, R.C.; Ou, J.W. Fully developed laminar flow in curved rectangular channels. J. Fluids Eng. 1976, 98, 41–48. [Google Scholar]
- Vriend, H.J. Velocity redistribution in curved rectangular channels. J. Fluid Mech. 1981, 107, 423–439. [Google Scholar]
- Winters, K.H. A bifurcation study of laminar flow in a curved tube of rectangular cross section. J. Fluid Mech. 1987, 180, 343–369. [Google Scholar] [CrossRef]
- Hille, P.; Vehrenkamp, R.; Schulz-Dubois, E.O. The development and structure of primary and secondary flow in a curved square duct. J. Fluid Mech. 1985, 151, 219–241. [Google Scholar] [CrossRef]
- Blanckaert, K.; Graf, W.H. Momentum transport in sharp open-channel bends. J. Hydraul. Eng. 2004, 130, 186–198. [Google Scholar] [CrossRef]
- Zong, L.; Nepf, H. Spatial distribution of deposition within a patch of vegetation. Water Resour. Res. 2011, 47, W03516. [Google Scholar] [CrossRef]
- Taye, J.; Kumar, B. Hydrodynamics and turbulence anisotropy for complex flow in a sinuous channel. Acta Geophys. 2022, 70, 2269–2282. [Google Scholar] [CrossRef]
- Nepf, H.M. Hydrodynamics of vegetated channels. J. Hydraul. Res. 2012, 50, 262–279. [Google Scholar] [CrossRef]
- Buffington, J.M.; Montgomery, D.R. A systematic analysis of eight decades of incipient motion studies, with special reference to gravel-bedded rivers. Water Resour. Res. 1997, 33, 1993–2029. [Google Scholar] [CrossRef]


| Test No. | Channel Curvature (Degree) | Water Depth (m) | Solid Volume Fraction (ϕ) |
|---|---|---|---|
| Mobile bed (d50 = 1.3 mm)—without emergent vegetation | |||
| 1–3 | 0 | 0.13, 0.15, 0.17 | 0 |
| 4–6 | 30 | 0.13, 0.15, 0.17 | 0 |
| 7–9 | 60 | 0.13, 0.15, 0.17 | 0 |
| 10–12 | 90 | 0.13, 0.15, 0.17 | 0 |
| 13–15 | 120 | 0.13, 0.15, 0.17 | 0 |
| 16–18 | 150 | 0.13, 0.15, 0.17 | 0 |
| 19–21 | 180 | 0.13, 0.15, 0.17 | 0 |
| Mobile bed (d50 = 1.3 mm)—with emergent vegetation | |||
| 22–33 | 0 | 0.13, 0.15, 0.17 | 0.001, 0.003, 0.005, 0.0099 |
| 34–45 | 30 | 0.13, 0.15, 0.17 | 0.001, 0.003, 0.005, 0.0099 |
| 46–57 | 60 | 0.13, 0.15, 0.17 | 0.001, 0.003, 0.005, 0.0099 |
| 58–69 | 90 | 0.13, 0.15, 0.17 | 0.001, 0.003, 0.005, 0.0099 |
| 70–81 | 120 | 0.13, 0.15, 0.17 | 0.001, 0.003, 0.005, 0.0099 |
| 82–93 | 150 | 0.13, 0.15, 0.17 | 0.001, 0.003, 0.005, 0.0099 |
| 94–105 | 180 | 0.13, 0.15, 0.17 | 0.001, 0.003, 0.005, 0.0099 |
| Fixed bed—without emergent vegetation | |||
| 106–108 | 0 | 0.13, 0.15, 0.17 | 0 |
| 109–111 | 30 | 0.13, 0.15, 0.17 | 0 |
| 112–114 | 60 | 0.13, 0.15, 0.17 | 0 |
| 115–117 | 90 | 0.13, 0.15, 0.17 | 0 |
| 118–120 | 120 | 0.13, 0.15, 0.17 | 0 |
| 121–123 | 150 | 0.13, 0.15, 0.17 | 0 |
| 124–126 | 180 | 0.13, 0.15, 0.17 | 0 |
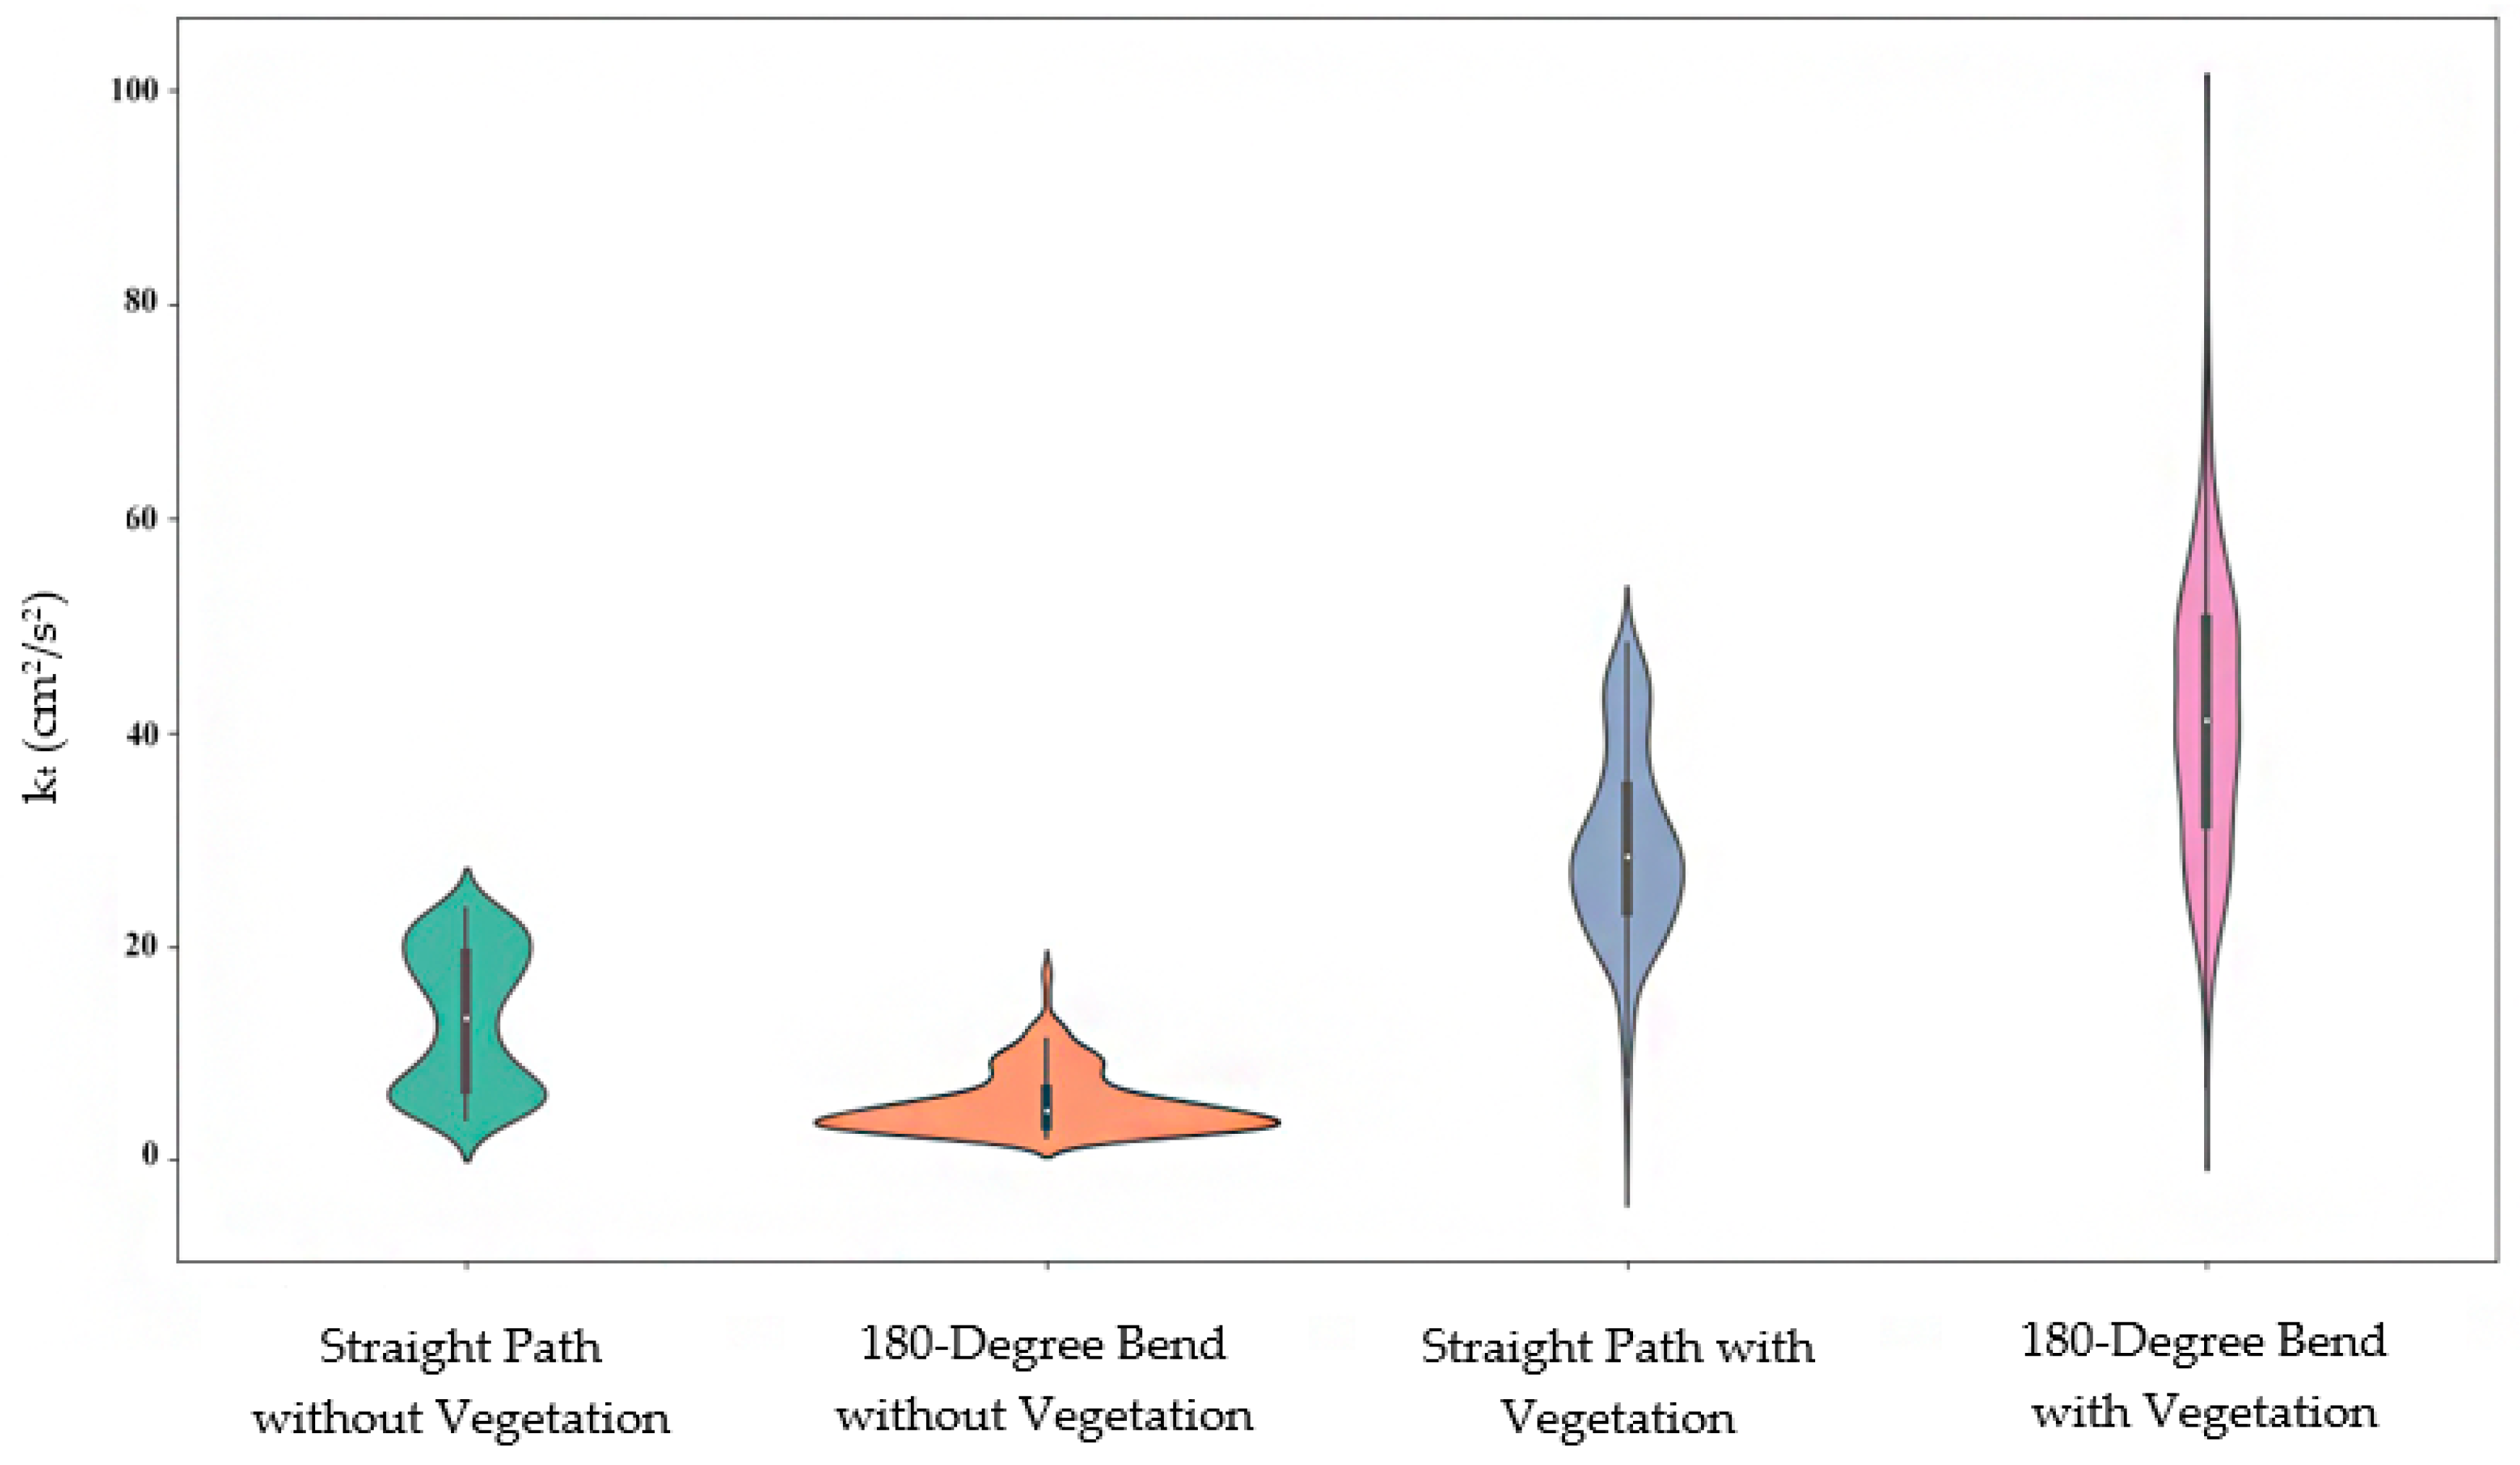
| Category | max-Outer Bend | max-Inner Bend |
|---|---|---|
| Straight path without vegetation | 10 | 10 |
| 180-degree bend without vegetation | 4.1 | 10 |
| Straight Path with vegetation | 7.1 | 6.5 |
| 180-degree bend with vegetation | 3.8 | 6.3 |
Disclaimer/Publisher’s Note: The statements, opinions and data contained in all publications are solely those of the individual author(s) and contributor(s) and not of MDPI and/or the editor(s). MDPI and/or the editor(s) disclaim responsibility for any injury to people or property resulting from any ideas, methods, instructions or products referred to in the content. |
© 2025 by the authors. Licensee MDPI, Basel, Switzerland. This article is an open access article distributed under the terms and conditions of the Creative Commons Attribution (CC BY) license (https://creativecommons.org/licenses/by/4.0/).
Share and Cite
Rismani, N.; Afzalimehr, H.; Asghari-Pari, S.-A.; Nazari-Sharabian, M.; Karakouzian, M. Optimization of Threshold Velocity Values for Sediment Transport at the Outer Bank of a 180-Degree Bend with Emergent Vegetation. Water 2025, 17, 971. https://doi.org/10.3390/w17070971
Rismani N, Afzalimehr H, Asghari-Pari S-A, Nazari-Sharabian M, Karakouzian M. Optimization of Threshold Velocity Values for Sediment Transport at the Outer Bank of a 180-Degree Bend with Emergent Vegetation. Water. 2025; 17(7):971. https://doi.org/10.3390/w17070971
Chicago/Turabian StyleRismani, Nasim, Hossein Afzalimehr, Seyed-Amin Asghari-Pari, Mohammad Nazari-Sharabian, and Moses Karakouzian. 2025. "Optimization of Threshold Velocity Values for Sediment Transport at the Outer Bank of a 180-Degree Bend with Emergent Vegetation" Water 17, no. 7: 971. https://doi.org/10.3390/w17070971
APA StyleRismani, N., Afzalimehr, H., Asghari-Pari, S.-A., Nazari-Sharabian, M., & Karakouzian, M. (2025). Optimization of Threshold Velocity Values for Sediment Transport at the Outer Bank of a 180-Degree Bend with Emergent Vegetation. Water, 17(7), 971. https://doi.org/10.3390/w17070971