Abstract
This study presents numerical results on 2D local scour around subsea pipelines positioned on sand wave seabeds under steady flow conditions, utilizing Flow-3D (v11.2) software. In the computational model, the flow dynamics surrounding the pipeline are resolved using the time-averaged 2D Navier–Stokes equations in conjunction with the Renormalization Group (RNG) k-ε turbulence model. The bed morphology is governed by the bedload transport rate, suspended load transport rate, and sediment mass balance equation. The research explores the influence of pipeline diameter and water depth on scour patterns over flat beds and investigates how the pipeline’s relative position to symmetrical sand waves affects the severity and morphology of scour. It is demonstrated that the non-dimensional scour depth decreases with an increase in pipeline diameter, whereas in shallower waters, the intensity of scour is greater for a given diameter. In the study of sand wave bed conditions, it was determined that the scour strength exhibits a hierarchical order from strongest to weakest as follows: pipeline located at the crest, downstream slope of the sand waves, pipeline situated on the upstream slope, and at the trough. It is noteworthy that the scour effect is marginally more pronounced at the crest compared to a flat seabed. Conversely, scour intensity diminishes at the other positions, particularly at the trough, where it often results in backfilling and the self-burial of the pipeline. Finally, the distributions of velocity and bed shear stress around the pipeline and seabed are presented to elucidate the flow mechanisms underlying the scour process.
1. Introduction
In subsea engineering practice, pipeline suspension caused by scour is a common issue, often leading to accidents. The hazards associated with pipeline scour mainly manifest in two ways: firstly, suspended pipelines exposed to complex flow conditions are susceptible to vortex-induced vibrations, which can result in fatigue failure; secondly, deformation and sagging of pipelines can cause direct bending failures [,]. The seabed’s topography is diverse and abundant, with seabed sand waves being the most prominent feature, widely distributed around the globe []. These sand waves are typically highly mobile, undergoing continuous migration and reshaping under hydrodynamic forces. This mobility poses significant engineering risks for pipelines laid across such seabeds. Firstly, the migration of sand waves can alter the local scour patterns and the free-span length of the pipeline, leading to dynamic and unpredictable loading conditions. Secondly, the complex topography of sand waves (e.g., crests, troughs, and slopes) creates spatially varying flow accelerations and decelerations, which in turn lead to non-uniform scour development along the pipeline. This complexity challenges the conventional scour prediction models established for flat seabeds and necessitates a detailed investigation of the pipeline–scour interaction over sand wave fields. Due to resource distribution, topographical variations, and construction demands, many engineering structures must cross or be constructed within areas characterized by extensive sand wave formations. However, since seabed sand waves are typically highly mobile and influenced by intricate hydrodynamic conditions, these factors can change the development pattern of pipeline scour []. Therefore, investigating the evolution of pipeline scour in sand wave environments is essential.
Early studies on scour problems, constrained by limited computational resources, mainly relied on theoretical analyses and physical model experiments. Due to the complexity of the pipeline scour process, most theoretical work has been simplified to be on two-dimensional local studies. For example, Sumer et al. [] examined the initiation of pipeline scour, identifying piping as the primary cause and detailing the two stages of scour development, along with an empirical formula to determine the initiation of scour. Based on Sumer’s research, Myrhaug et al. [] derived a formula for the depth of scour pits under random wave conditions. Zang et al. [] focused on sediment forces under pipelines and developed an empirical criterion for scour initiation under steady flow. Han [] established empirical formulas for critical pressure differences and flow velocities at scour equilibrium, while Yang [] extended this to include wave-driven sediment initiation criteria. These theoretical analyses have provided valuable insights and a solid foundation for physical and numerical investigations.
Cheng et al. [] studied the development of scour, considering the settlement of flexible pipelines through physical experiments, and found that after the pipeline settles 50–60% of its diameter, the scour shape stabilizes, and its form is linked to the pipeline’s settlement rate. Draper [] investigated the impact of pipeline settlement rate on scour geometry, noting that faster settling pipelines produce shallower and narrower scour pits. Zhao et al. [] studied scour shapes for parallel pipelines. Gao et al. [] performed physical tests on vortex-induced vibrations of pipelines. Although physical modeling offers many advantages, limitations such as scale effects and high costs have prompted a rapid increase in numerical simulation research.
With advances in computational technology, numerical simulation methods have become increasingly prevalent in recent years. Numerical simulations of pipeline scour primarily involve potential flow models and turbulent flow models. Turbulence-based models better capture the development of scour shapes but are often more complex. Instead, Brørs [] proposed a steady-flow scour model, with simulation results aligning well with experimental data. Van Beek [] developed a model based on the k-ε turbulence approach to study the protective effects of baffle plates, attaining generally good results though with some limitations. Liang and Cheng [] compared k-ε turbulence and Smagorinsky subgrid scale (SGS) models for scour shape prediction and found the former is more suitable. Cheng and Zhao [] used the k-ε turbulence model, validated against scour physical experiments, and found that the transverse scour development rate was slower in simulations than in experimental tests. Scandura et al. [] employed direct numerical simulation of the Navier–Stokes equations to analyze vorticity effects caused by the pipeline wall. Xu [] utilized Flow-3D with the RNG k-ε turbulence model and steady inflow conditions to establish a three-dimensional scour model.
Research by various scholars on numerical simulations has continuously enhanced the theoretical understanding and demonstrated the feasibility and reliability of modeling pipeline scour. However, most existing studies have focused on scour simulation over flat beds, with limited research on scour shapes under sand wave seabeds. This paper aims to investigate the evolution of scour morphology resulting from interactions between pipelines and seabed sand waves. It systematically compares the variations in scour intensity and shape when pipelines are positioned at different locations relative to sand waves. Additionally, it presents the distribution of bed shear stress across various conditions and time points. By developing design-oriented maps of scour and deposition intensity under different scenarios, the study ultimately provides scientifically grounded recommendations for optimal seabed pipeline layout in engineering applications.
2. Model Description and Validation
2.1. Flow Model
The fluid motion control equations adopted in this paper are based on the continuity and momentum equations (i.e., the Navier–Stokes (N-S) equations) for viscous incompressible fluids. Flow-3D (v11.2) (Flow Science, Santa Fe, NM, USA) introduces the Volume of Fluid (VOF) technique, which defines the area fraction Ai and volume fraction Vi. These parameters are used to quantify the extent to which the liquid fills the grid cells. The flow field model optimized by the Flow-3D algorithm is expressed in Cartesian coordinates as follows:
Continuity equation:
where u, v, and w represent the velocity components in the x, y, and z directions, respectively; Ax, Ay, and Az represent the area fractions in the x, y, and z directions, respectively; RSOR stands for the mass source, which is the mass forcibly introduced or removed; ρ represents the fluid density.
Momentum equation:
where Gx, Gy, and Gz represent the gravitational accelerations in the x, y, and z directions, respectively; fx, fy, and fz represent the acceleration components caused by viscous forces; bx, by, and bz represent the acceleration components of flow loss through porous media; p represents the average dynamic pressure; ρ represents the fluid density; VF represents the fluid volume fraction; uw, vw, and ww are the velocity components of the mass source relative to the reference frame; us, vs, and ws are the velocity components of the fluid on the surface of the mass source relative to the source itself. In this paper, key parameters such as fluid density and dynamic viscosity coefficient adopt the standard parameters of water at 20 °C.
This study employs the RNG k-ε model as the turbulence model, which has demonstrated high accuracy in simulating vortex flows and complex flow fields, especially under strong shear conditions. The turbulent kinetic energy equation and the turbulent energy dissipation rate equation are as follows:
where kT represents the turbulent kinetic energy; εT represents the turbulent energy dissipation rate; VF represents the fluid volume fraction; PT denotes the turbulent kinetic energy generation term, indicating the average kinetic energy per unit mass; GT represents the buoyancy generation term; Diff refers to the differential term of the corresponding quantity; CDIS1, CDIS2, and CDIS3 are dimensionless constants.
2.2. Sediment Transport Model
The seabed pipeline scour problem is a typical water-sediment two-phase flow solid coupling issue. This section will introduce the sediment transport control equations and related parameters.
This paper adopts the sediment scour model provided by Flow-3D. The sediment is non-cohesive sand, with a median particle diameter D50 of 0.36 mm, sediment density ρs of 2650 kg/m3, and critical Shields parameter θcr of 0.04. The value of θcr = 0.04 is selected based on the work of Sumer et al. (2001) [], which provides a widely accepted criterion for the initiation of scour for non-cohesive sediments under steady currents. This value falls within the typical range for well-sorted, fine sands similar to the one used in this study.
The calculation of the Shields parameter is determined by the bed shear stress, and the formula is as follows:
where θ represents the calculated Shields parameter; τ represents the bed shear stress; d50 represents the median particle diameter of the sediment; ρs represents the sediment density; ρf represents the fluid density; g represents the gravitational acceleration.
The bed load sediment transport rate calculation model adopts the empirical formula proposed by Van Rijn:
where ubedload represents the bed load transport velocity; fb represents the bed load volume fraction; qb represents the unit width bed load transport quantity; δb represents the bed load thickness, calculated as follows:
where β represents the bed load coefficient; represents the dimensionless sediment particle diameter; μ represents the fluid dynamic viscosity coefficient.
where udrift represents the suspended sediment transport velocity; represents the mean velocity of the suspended sediment–fluid mixture; represents the mean density of the suspended sediment–fluid mixture; K represents the drag force term; fs represents the volume fraction of the suspended sediment; us represents the velocity of the suspended sediment; uf represents the velocity of the fluid; ds represents the diameter of the suspended sediment particles; μf represents the fluid dynamic viscosity coefficient; CD represents the drag coefficient.
The above equations determine the rates of various sediment movements. The final changes in bed morphology are controlled by the sediment mass balance equation, which is formulated as follows:
where y represents the vertical elevation change; p0 represents the sediment porosity; qr represents the total sediment transport rate, including bed load and suspended load; f represents the sediment volume fraction.
2.3. Model Setup and Mesh Sensitivity Analysis
It is important to note that the present study employs a two-dimensional (2D) vertical plane model. While it is acknowledged that scour around a circular cylinder involves inherently three-dimensional (3D) flow structures, such as horseshoe vortices and lee-wake vortices, the primary objective of this work is to investigate and compare the relative scour intensity and equilibrium scour morphology around a pipeline at different positions on a sand wave. For this specific purpose, a 2D modeling approach has been demonstrated in the literature to be a viable and computationally efficient tool, capable of providing reasonably accurate predictions of the equilibrium scour depth, which is a key design parameter.
The conditions of the flat bed are categorized into two main groups, with a total of five scenarios, based on variations in pipeline diameter and water depth. The flow field parameters for each scenario are shown in Table 1. To ensure the full development of the flow field in front of the pipeline, a sand bed length of 20 times the diameter is set in front of it. To prevent the interference from the outflow boundary on the flow field near the pipeline, a sand bed length of 10 times the diameter is set behind it. The sand bed has a uniform thickness of 0.2 m, and an air height of 0.15 m is established to facilitate normal simulation of the free liquid surface. To prevent the inflow and outflow boundaries from affecting the ends of the sand bed, solid baffles of the same height as the sand bed are placed at both sides of the bed. The pipeline is perpendicular to the flow direction, with a burial depth of 0.0 m, meaning the lowest end is in contact with the bed surface. An initial scour pit, with a depth of 0.1 times the diameter, is set below the pipeline to simulate the start of scouring. Some researchers have shown that the presence of an initial scour pit slightly accelerates the early development of scour but has minimal impact on later stages or scour equilibrium []. Taking Case 1 as an example, the overall model and the local geometric scale around the pipeline are illustrated in Figure 1.

Table 1.
Flow field parameters under flat bed conditions.
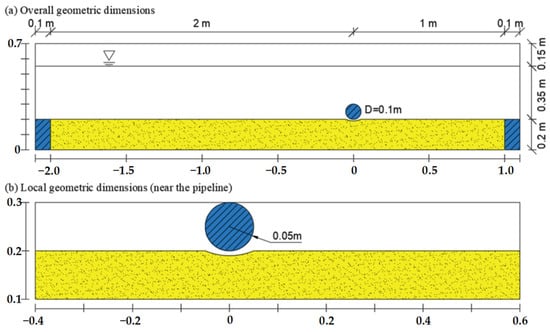
Figure 1.
Geometric dimensions of the Case 1 model under flat bed conditions (pipe diameter 0.1 m).
The sand wave conditions in this paper are divided into three groups, based on flat bed conditions 3, 4, and 5, with the pipeline oriented parallel to the sand wave and perpendicular to the flow direction. Within each group, four scenarios are further considered based on the pipeline’s relative position to the sand wave: (1) at the crest, (2) at the trough, (3) on the upstream side of the sand wave centerline, and (4) on the downstream side of the sand wave centerline. Based on the flume experimental results by Wang et al. [] and the statistical data on actual seabed sand wave shapes by Flemming [], the selected sand wave topography here has a wavelength of 0.9 m and a wave height of 0.06 m.
Based on the flume experiment data from Wang et al. [], under conditions with similar sediment parameters, a water depth of 0.35 m, and a steady flow velocity of 0.35 m/s, the stable sand wave morphology exhibited an average wavelength of 0.9 m and an average wave height of 0.06 m. In addition, Flemming conducted a statistical analysis of 1491 sand wave cases worldwide and identified a consistent relationship between average wave height and wavelength, proposing an empirical formula (R2 = 0.98) []. The sand wave parameters selected in this experiment closely align with that formula.
The two-dimensional numerical model here adopts a regularly symmetrical sand wave model to match the sand wave shape in physical experiments. Unlike the flat bed conditions, to ensure the full development of the flow field upstream of the pipeline, the computational domain should exceed twice the wavelength. Therefore, the length of the sand bed upstream of the pipeline should not be less than 40 times the diameter. Moreover, since the inflow boundary uses velocity control, the flow rate under identical conditions is maintained by slightly adjusting the length of the sand bed model, ensuring that the sand bed height at the inflow remains at 0.2 m. Taking the condition with a water depth of 0.35 m as an example, the model dimensions are shown in Figure 2.
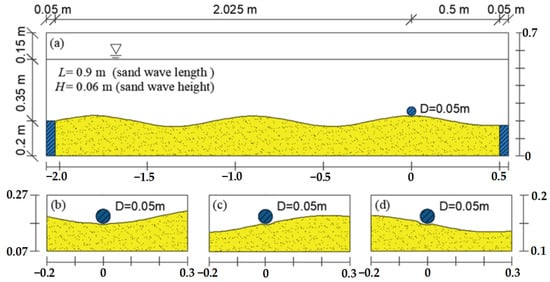
Figure 2.
Geometric dimensions of the sand wave seabed model (water depth 0.35 m): (a) Sand wave crest condition, (b) sand wave trough condition, (c) sand wave midline upstream side condition, (d) sand wave midline downstream side condition.
The inflow boundary of the computational domain is established as a specified velocity boundary, allowing the pressure at the boundary to follow the hydrostatic pressure distribution corresponding to the depth, while assigning an initial inflow velocity of 0.35 m/s along the positive x-axis at the boundary. The outflow boundary is set as a specified pressure boundary, ensuring that the pressure at the boundary follows the hydrostatic pressure distribution corresponding to the depth. The top of the computational domain is a specified pressure boundary, the bottom is a static wall boundary, and the remaining two sides are symmetry boundaries.
To determine the grid size, trial calculations were conducted using square grids with side lengths of 0.1 m, 0.05 m, 0.02 m, 0.01 m, and 0.005 m. Once the flow field stabilized, the horizontal velocity distributions at the cross-sections of x = −1 m and x = 0 were compared, as shown in Figure 3.
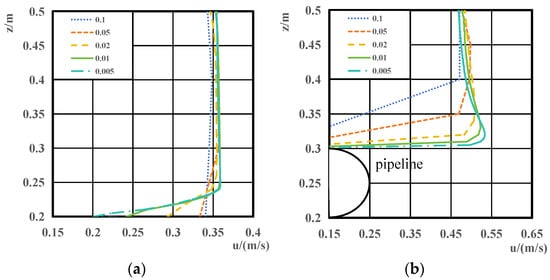
Figure 3.
Horizontal flow velocity distribution under meshes of different edge lengths, (a) x = −1 m, (b) x = 0.
By observing the horizontal velocity distribution at x = −1 m upstream of the pipeline, it is found that it basically conforms to the logarithmic velocity distribution, indicating that the flow field is fully developed and the flow pattern is stable. The spatial range of the computational domain is appropriate. Comparing the results obtained with 0.01 m and 0.005 m square grids, the velocity distributions at each section are basically consistent, with only slight differences at locations with significant velocity changes, such as the walls. The maximum relative error is less than 6.5%. Therefore, the 0.01 m grid size is considered sufficient to meet the required accuracy for flow field calculations.
Additionally, the grid density needs to ensure the accuracy of the model’s geometric scale in the simulations. Given that the minimum pipeline diameter involved in this paper is 0.05 m, it is more appropriate to use a 0.005 m square grid near the pipeline and the bed surface. Considering that the 0.01 m grid size already meets the accuracy required for most regions of the flow field, a two-layer nested grid approach with coarse and fine grids will be adopted to reduce computation time. This approach ensures the accuracy of the simulations near the bed surface and the pipeline while reducing the computation time.
Simulation results with different time steps indicate that the model is insensitive to the currently adopted time step, confirming the temporal stability of the numerical solution. Additionally, monitoring of sediment mass conservation shows that the error in bed sediment mass remains within 0.5%, further validating the reliability of the present model.
2.4. Model Validation
The scouring pit topography profiles around the pipeline at various time intervals for Condition 1 were exported and compared with the laboratory scour experiments conducted by Mao [], the numerical simulations by Cheng et al. [], and the numerical simulations by Xu [], as shown in Figure 4.
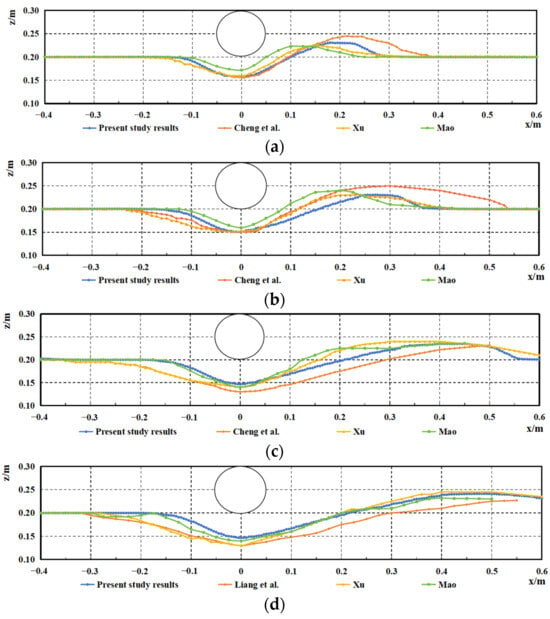
Figure 4.
Comparison of scour profile shapes around the pipeline at different moments [,,], (a) t = 10 min, (b) t = 30 min, (c) t = 200 min, (d) t = 370 min.
It can be observed that the maximum depth of the pipeline scour pit in this study during the scour development phase (10 min, 30 min) is consistent with the other numerical simulation results but develops faster compared to the physical experiment results. However, during the scour equilibrium phase (200 min, 370 min), the maximum scour depth is closer to the physical experiment results. Due to the scour pit depth, the upstream side of the pipeline, i.e., the backflow side of the scour pit, also develops faster in the early stages, but its morphology is closer to the physical experiment results compared to other numerical simulation results. In the later stages of simulation, it also maintains better consistency with the physical experiment results. The downstream side of the pipeline, i.e., the sediment accumulation on the downstream side of the scour pit, develops faster during the scour development phase but is more consistent with the physical experiment results at the final equilibrium. Therefore, although the model in this study may have faster local scour development in the early stages compared to actual conditions, it shows advantages in simulating the bed morphology upstream of the pipeline and after the scour equilibrium phase.
To quantitatively evaluate the agreement of the entire scour profile, the Root Mean Square Error (RMSE) between the present numerical results and Mao’s experimental data was calculated at four characteristic time points (t = 10, 30, 200, and 370 min). The resulting RMSE values were 0.011 m, 0.014 m, 0.010 m, and 0.007 m, respectively, indicating better overall agreement compared to other simulation results, particularly at the equilibrium stage. Regarding the time to equilibrium, the numerical model shows similar behavior to the physical experiment, although the scour develops more rapidly during the initial phase in the simulation. This discrepancy in early-stage scour evolution is consistent with observations reported in other two-dimensional numerical studies.
Numerical calculations yield a far-field Shields parameter of approximately 0.0515, which exceeds the critical Shields parameter (θ > θcr), indicating a mobile bed scour condition. Kjeldsen et al. [] conducted flume experiments and concluded that under mobile bed conditions, the ultimate scour depth satisfies the following empirical relationship, with water depth and sediment grain size effects neglected:
Building upon the study by Kjeldsen et al. [], Bijker and Leeuwestein [] incorporated the influence of median grain size (d50) on scour depth, resulting in the following modified relationship:
Substituting the parameters for the present case, the theoretical scour depth is calculated to be 56.6 mm, whereas the numerical simulation yields approximately 58 mm. This demonstrates a strong agreement between the simulation results and both theoretical calculations and physical experiments under equilibrium scour conditions.
3. Numerical Results and Discussions
This section analyzes the impact of different pipeline diameters and water depth conditions on the scour intensity and morphology under flat bed conditions with non-cohesive sand. Further, it explores the pipeline scour issue on sand wave seabeds composed of non-cohesive sand. The study examines conditions where the pipeline extends parallel to the sand waves, and both are perpendicular to the flow direction. By changing the relative positions of the pipeline and the sand waves, the study investigates the effect on pipeline scour.
3.1. Scour Below a Pipeline on Plane Seabed
The scour profiles around the pipeline at different times for Conditions 1, 2, and 3 are shown in Figure 5, Figure 6 and Figure 7, respectively. The variation of maximum scour depth over time under different pipeline diameters is shown in Figure 8. By observing the changes in the shape of the scour pit below the pipeline over time, it can be seen that the deepest part of the scour pit is roughly located directly below the pipeline, which is due to the relatively low flow velocity. In the initial stage of simulation, the scour pit depth increases rapidly, then the growth rate slows down until it reaches equilibrium and no longer changes. For different pipeline diameters, the dimensionless maximum scour depth increases as the pipeline diameter decreases, consistent with the numerical simulation results of pipeline scour under constant flow conditions using the two-dimensional finite element method (FEM) by Zhao et al. [].
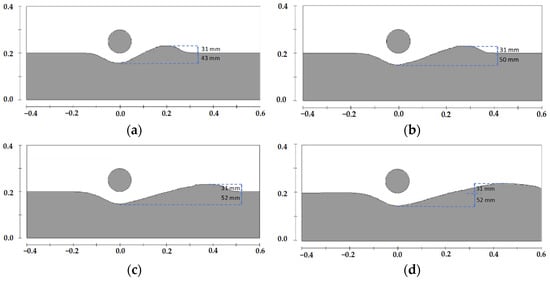
Figure 5.
Scour profiles around the pipeline at different moments under Case 1, (a) t = 10 min, (b) t = 30 min, (c) t = 100 min, (d) t = 300 min.
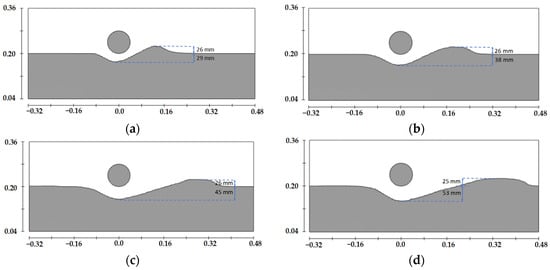
Figure 6.
Scour profiles around the pipeline at different moments under Case 2, (a) t = 4 min, (b) t = 12 min, (c) t = 40 min, (d) t = 120 min.
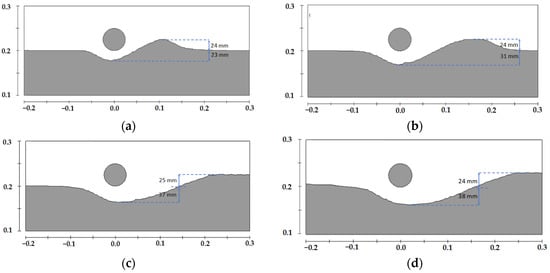
Figure 7.
Scour profiles around the pipeline at different moments under Case 3, (a) t = 4 min, (b) t = 12 min, (c) t = 40 min, (d) t = 120 min.
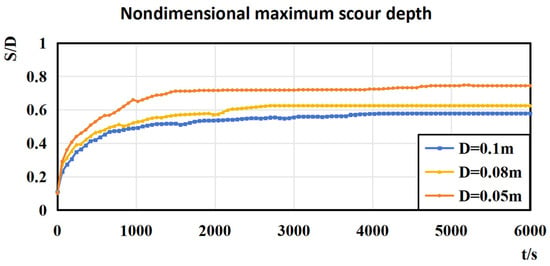
Figure 8.
Graph of nondimensional maximum scour depth variation over time under different pipe diameter conditions, u0 = 0.35 m/s, d = 0.35 m.
For the model parameters used in this study, the dimensionless maximum scour depth shows little difference when the pipeline diameter is 0.1 m and 0.08 m, but it increases significantly when the pipeline diameter is reduced to 0.05 m.
Observing the scour and migration process of the sand dune behind the pipeline, it can be found that in the early stage of scour, a sand dune rapidly forms behind the pipeline. The rear slope (i.e., the backflow side) of the dune is relatively steep but consistent with the natural angle of repose of the sediment. In contrast, the front slope (i.e., the upstream side) of the dune is significantly gentler. As time progresses, the dune gradually moves downstream, and its height increases until it reaches equilibrium and no longer changes. After reaching the scour equilibrium phase, the position of the front edge of the dune no longer changes significantly, while the rear edge continues to move downstream, causing the dune to gradually form a flat-top structure with an expanding top width. This process is consistent with the scour process proposed by Mao [].
The variation of the maximum scour depth over time under different water depths for a pipeline diameter of 0.05 m is shown in Figure 9. Meanwhile, at 720 s, the velocity distribution at x = 0 is compared in Figure 10. It can be observed that, with other conditions remaining unchanged, a reduction in water depth leads to a faster development rate of the scour pit shape. Additionally, the maximum scour depth when reaching equilibrium is also greater. This is because the ratio of pipeline diameter to water depth increases, resulting in an increased average flow velocity within the flow cross-section. Consequently, both the local scour development rate and the maximum scour depth increase.
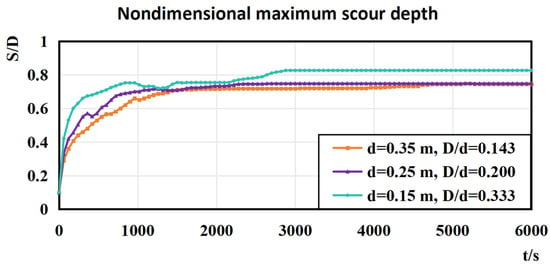
Figure 9.
Graph of nondimensional maximum scour depth variation over time under different water depths, u0 = 0.35 m/s, D = 0.05 m.
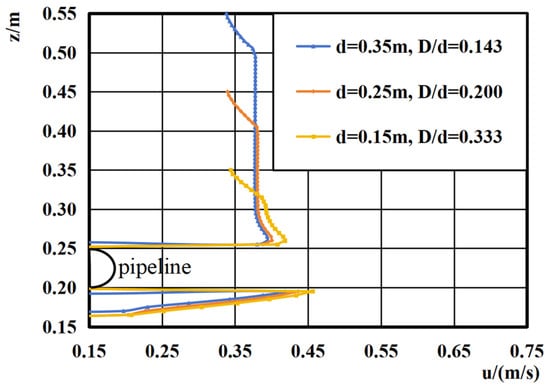
Figure 10.
Comparison graph of velocity distribution under different water depths, u0 = 0.35 m/s, D = 0.05 m, t = 720 s, x = 0.
3.2. Local Scour Patterns of Pipelines on Sand Wave Seabed
For a water depth of 0.35 m and a pipeline diameter of 0.05 m, the scour profiles at different times for the pipeline located at different positions on the sand wave seabed are shown in Figure 11, Figure 12, Figure 13 and Figure 14. The comparative scour profiles at different positions over time are shown in Figure 15.
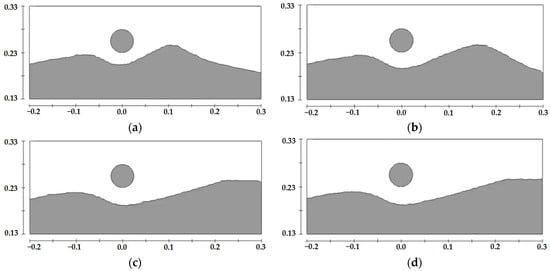
Figure 11.
Schematic diagram of scour profiles at different moments for a pipeline with a diameter of 0.05 m located at the crest of sand waves under a water depth of 0.35 m, (a) t = 4 min, (b) t = 12 min, (c) t = 40 min, (d) t = 120 min.
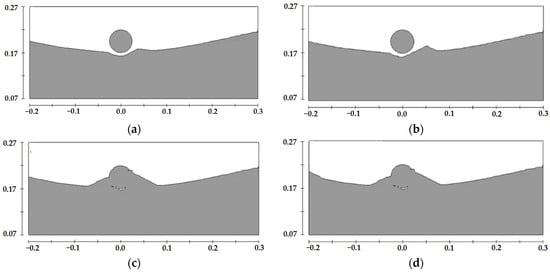
Figure 12.
Schematic diagram of scour profiles at different moments for a pipeline with a diameter of 0.05 m located at the trough of sand waves under a water depth of 0.35 m, (a) t = 4 min, (b) t = 12 min, (c) t = 40 min, (d) t = 120 min.
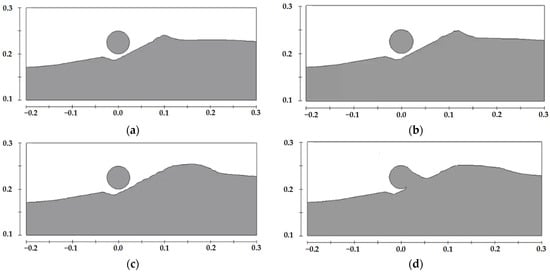
Figure 13.
Schematic diagram of scour profiles at different moments for a pipeline with a diameter of 0.05 m located on the upstream side of the sand wave midline under a water depth of 0.35 m, (a) t = 4 min, (b) t = 12 min, (c) t = 40 min, (d) t = 120 min.
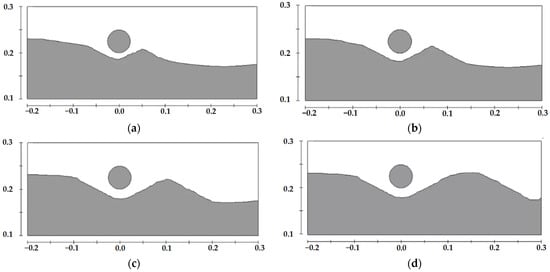
Figure 14.
Schematic diagram of scour profiles at different moments for a pipeline with a diameter of 0.05 m located on the downstream side of the sand wave midline under a water depth of 0.35 m, (a) t = 4 min, (b) t = 12 min, (c) t = 40 min, (d) t = 120 min.
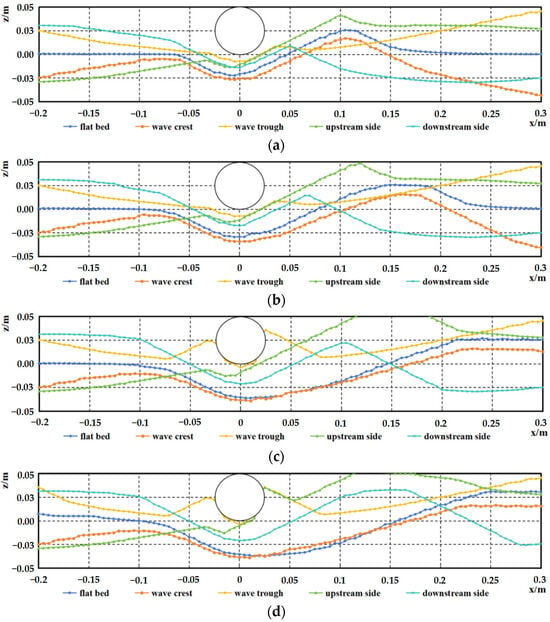
Figure 15.
Comparison of scour profiles at different positions of the pipeline on a sand wave seabed at various moments, d = 0.35 m, D = 0.05 m, (a) t = 4 min, (b) t = 12 min, (c) t = 40 min, (d) t = 120 min.
As shown in Figure 15, the scour intensity from weak to strong is as follows: pipeline at the trough, pipeline at the upstream side of the sand wave centerline, pipeline at the downstream side of the sand wave centerline, and pipeline at the crest. The scour effect when the pipeline is at the crest is slightly stronger than in the flat bed condition, while the deposition effect is stronger than the scour when the pipeline is at the trough and the upstream side of the sand wave centerline. After a certain period, the backfilling of the scour pit under the pipeline and the self-burial of the pipeline can be observed.
According to Best []’s summary of previous studies, the sand wave bed under steady flow exhibits a complex flow field structure. The upstream flow remains relatively stable, but the velocity gradually increases, resulting in higher bed shear stress. The horizontal velocity reaches its maximum at the crest, where the sand wave topography induces flow separation, causing the flow to detach from the bed and form a shear layer. On the downstream side, the velocity decreases, creating a wake zone. As the flow passes through the trough, it begins to recover, reestablishing an internal boundary layer with a logarithmic velocity profile. Due to flow separation and shear layer effects, turbulence intensity is highest at the crest, while turbulence dissipation is more pronounced in the wake zone.
The relative position between the pipeline and the sand wave significantly affects the scour pit and the morphology of dunes downstream of the pipeline []. When the pipeline is located in the trough of the sand wave, the water depth increases, and the ratio of pipeline diameter to water depth decreases from 0.143 to 0.132. As a result, the flow velocity around the pipeline slows down, and the bed shear stress is relatively low. Under these conditions, sediment deposition becomes more pronounced than scour, leading to a continuous reduction in the scour pit depth beneath the pipeline. During the period from 0 to 720 s, due to the presence of a gap below the pipeline, dunes can still form behind it. However, after 1200 s, the gap beneath the pipeline is nearly filled with sediment, altering the flow conditions around the pipeline. Consequently, dunes begin to form in front of the pipeline and develop rapidly. By 2400 s, sediment has fully accumulated on both sides of the pipeline, stabilizing the bed morphology and flow field, with minimal changes thereafter.
When the pipeline is located at the crest of the sand wave, the decrease in water depth leads to an increase in the ratio of pipeline diameter to water depth from 0.143 to 0.156. This geometric effect is coupled with a more direct hydrodynamic driver: the flow acceleration over the crest. The flow is constricted and accelerated over the sand wave crest, leading to a significant local increase in the bed shear stress directly upstream and beneath the pipeline, compared to the flat bed case. More relevant content will be presented in detail in Section 3.4.
A quantitative analysis of the bed shear stress fields reveals the mechanism behind the initially faster scour rate at the crest. The spatial extent and magnitude of the high-shear-stress region beneath the pipeline are larger and more intense in the crest case during the initial and development stages (e.g., t = 4 min and 12 min). This results in a more vigorous and extensive sediment entrainment, explaining the ‘slightly greater scouring intensity’ observed in the early phases.
However, as the scour pit develops and deepens, it modifies the local flow field by providing a larger flow area, effectively reducing the flow acceleration and the associated bed shear stress. At equilibrium, the self-limiting nature of the scour process leads to a similar maximum scour depth as in the flat bed case, as the final scour geometry is primarily controlled by the balance between the sediment’s critical shear stress and the now-reduced local flow strength. Thus, the key distinction at the crest is not a deeper final scour, but a significantly accelerated scour rate driven by the initially enhanced bed shear stress.
When the pipeline is located on the upstream or downstream side of the sand wave, with the same water depth as the flat bed condition, the resulting scour patterns differ significantly. This highlights the direct influence of sand wave topography and flow field structure on pipeline scour morphology. On the upstream side, the flow velocity is relatively high, but the overall flow remains stable, with a simple flow structure and a smaller scour pit. However, since the elevation downstream of the pipeline gradually increases when it is positioned on the upstream side, even a small amount of sediment deposition can form a large-scale dune, which reaches the greatest height among all conditions. As the dune develops, its height continues to increase, and its leading edge gradually shifts upstream, leading to partial backfilling of the scour pit. By 7200 s, the dune reaches the pipeline, causing scour to stagnate.
When the pipeline is located on the lee side, the flow field structure becomes complex. At this position, the flow has already separated, vortex development occurs, and turbulence intensity is high, although the mean flow velocity is relatively low. The bed shear stress drops sharply. Sediment at the crest is entrained by the flow and transported downstream, continuously refilling the scour pit. As a result, the observed scour depth is significantly smaller than that in the flat bed case. Additionally, since the downstream area is a trough with gradually decreasing elevation, dune development is the slowest among all conditions.
From the above analysis, it can be found that the difference in scour morphology of the pipeline between the sand wave seabed and flat bed conditions is mainly influenced by two factors: one is the direct impact of the bed morphology on its development, especially the shape of the sand dune downstream of the pipeline; the other is the change in hydrodynamic conditions due to the variation in water depth caused by the topographic undulations, indirectly affecting the scour development process.
3.3. Effects of the Water Depth Under Sand Wave Seabed Case
This study experimentally observed the temporal evolution of scour profiles at different sand wave positions under varying water depth conditions for a pipeline with a diameter of 0.05 m (as shown in Figure 16, Figure 17, Figure 18 and Figure 19). The experimental results indicate that, similar to the flat bed condition, an increase in the ratio of pipeline diameter to water depth (D/d) significantly accelerates the scour rate, particularly in the initial stage. This phenomenon is primarily due to the enhanced obstruction effect of a larger D/d ratio, which increases the local velocity gradient and bed shear stress, thereby accelerating the initial scour process. However, the scour process varies considerably depending on the pipeline’s position within the sand wave.
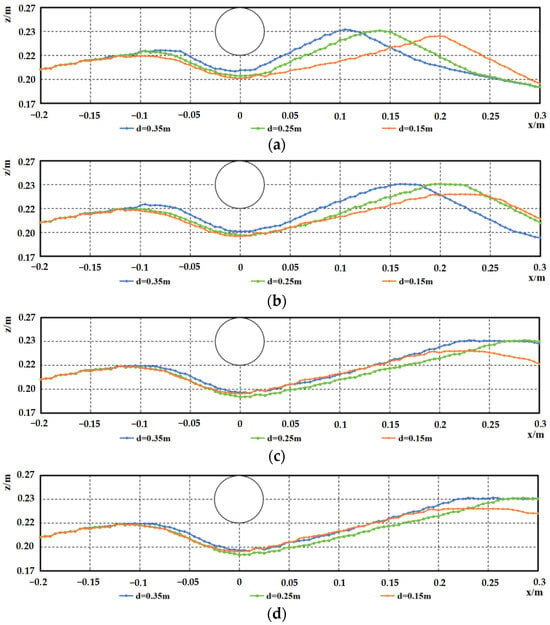
Figure 16.
Comparison of scour profiles under varying water depths for the crest condition of the sand wave seabed, at various moments, D = 0.05 m, (a) t = 4 min, (b) t = 12 min, (c) t = 40 min, (d) t = 120 min.
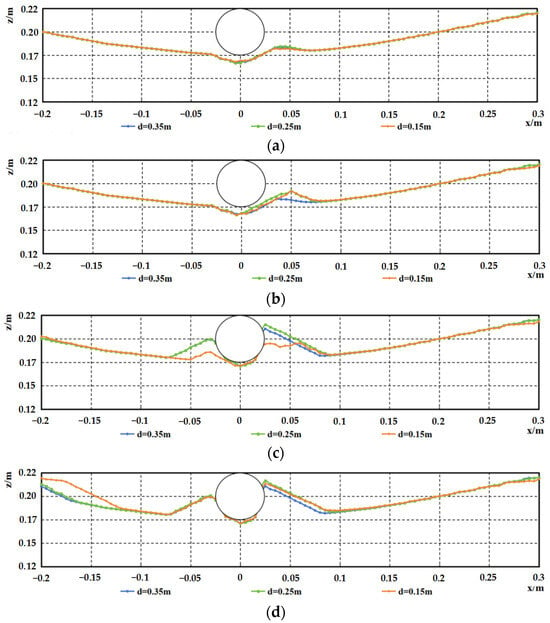
Figure 17.
Comparison of scour profiles under varying water depths for the trough condition of the sand wave seabed, at various moments, D = 0.05 m, (a) t = 4 min, (b) t = 12 min, (c) t = 40 min, (d) t = 120 min.
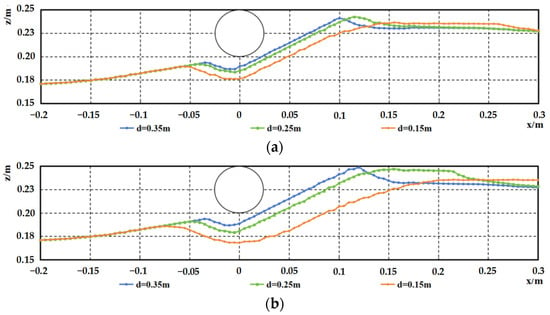
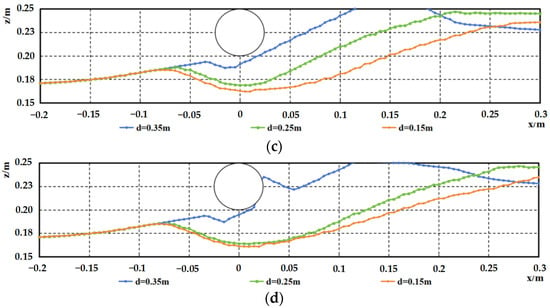
Figure 18.
Comparison of scour profiles under varying water depths for the upstream side of the sand wave’s midline, at various moments, D = 0.05 m, (a) t = 4 min, (b) t = 12 min, (c) t = 40 min, (d) t = 120 min.
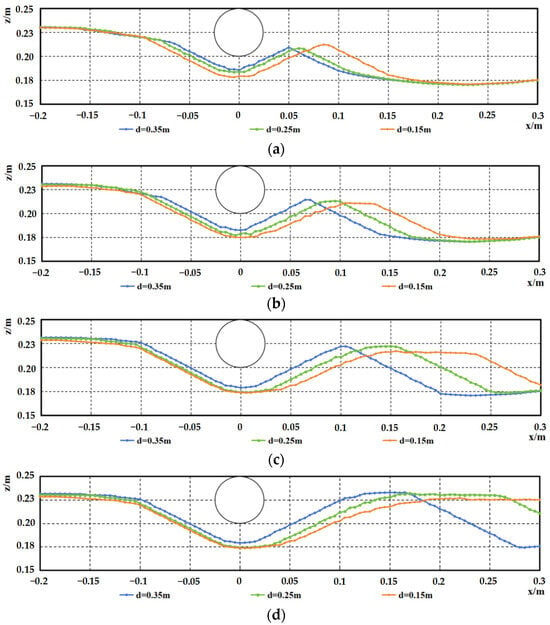
Figure 19.
Comparison of scour profiles under varying water depths for the downstream side of the sand wave’s midline, at various moments, D = 0.05 m, (a) t = 4 min, (b) t = 12 min, (c) t = 40 min, (d) t = 120 min.
When the pipeline is located at the crest, the scour intensity is the highest, but the effect of water depth variation on the maximum scour depth is limited. In shallower water, the development rate of dunes behind the pipeline is faster, yet the scour morphology at equilibrium remains similar across different water depths. When the pipeline is positioned in the trough, sedimentation remains dominant; however, a decreasing water depth shows a trend of slowing deposition rates, with the equilibrium profile morphology remaining largely consistent.
When the pipeline is on the upstream or downstream side, the influence of water depth on scour morphology becomes most pronounced. Notably, as the water depth decreases, the sediment scour characteristics around the pipeline located on the upstream side along the sand wave centerline undergo significant changes, with the dominant process shifting from deposition to scour, leading to distinct alterations in the profile shape. When the pipeline is on the downstream side, the scour morphology at equilibrium also exhibits significant differences. The dune height behind the pipeline remains constant, but shallower water conditions accelerate dune development, push the dune’s trailing edge further downstream, and result in a greater maximum scour depth.
Based on the varying relative positions between the pipeline and sand waves, as well as different water depths, a design-oriented distribution map of scour intensity and pipeline self-burial can be developed, as shown in Figure 20.
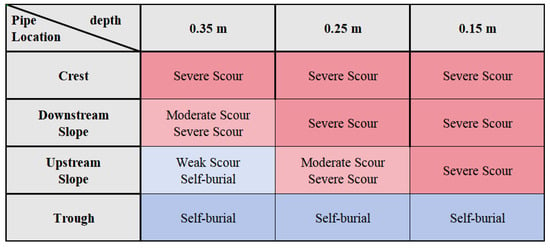
Figure 20.
Design-oriented distribution map of scour intensity and pipeline self-burial, red indicates that erosion ultimately dominates, while blue signifies that deposition is the prevailing process. The color intensity represents the strength of erosion or deposition—the deeper the color, the more pronounced the effect.
3.4. Flow Field and Bed Shear Stress
For a pipeline diameter of 0.05 m and a water depth of 0.35 m, the horizontal velocity distribution and bed shear stress distribution near the pipeline under flat bed conditions are shown in Figure 21. Figure 22, Figure 23, Figure 24 and Figure 25 illustrate the velocity distribution and bed shear stress distribution near the pipeline under sand wave seabed conditions.


Figure 21.
Velocity and shear stress distribution near the pipeline under flat bed conditions, D = 0.05 m, d = 0.35 m, the arrows represent velocity vectors (a) t = 4 min, (b) t = 12 min, (c) t = 40 min, (d) t = 120 min.
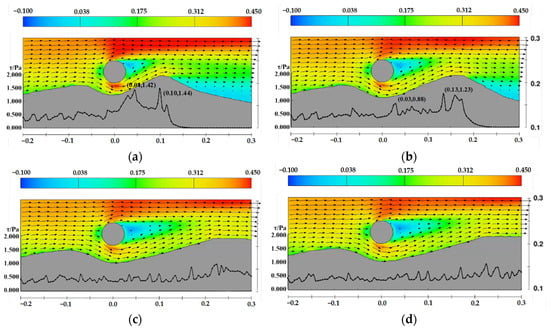
Figure 22.
Velocity and shear stress distribution near the pipeline under the sand wave crest case, D = 0.05 m, d = 0.35 m, the arrows represent velocity vectors (a) t = 4 min, (b) t = 12 min, (c) t = 40 min, (d) t = 120 min.


Figure 23.
Velocity and shear stress distribution near the pipeline under the sand wave trough case, D = 0.05 m, d = 0.35 m, the arrows represent velocity vectors (a) t = 4 min, (b) t = 12 min, (c) t = 40 min, (d) t = 120 min.
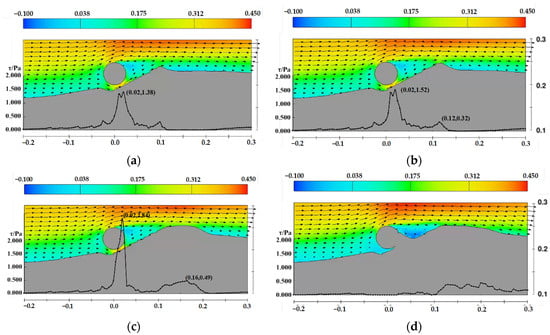
Figure 24.
Velocity and shear stress distribution near the pipeline under the sand wave midline upstream side case, D = 0.05 m, d = 0.35 m, the arrows represent velocity vectors (a) t = 4 min, (b) t = 12 min, (c) t = 40 min, (d) t = 120 min.


Figure 25.
Velocity and shear stress distribution near the pipeline under the sand wave midline downstream side case, D = 0.05 m, d = 0.35 m, the arrows represent velocity vectors (a) t = 4 min, (b) t = 12 min, (c) t = 40 min, (d) t = 120 min.
The figures demonstrate the relationship between the development of scour profiles, velocity distribution, and bed shear stress distribution. Bed shear stress governs the calculation of the Shields parameter, which reflects the intensity and rate of sediment scouring and significantly influences the evolution of scour profile morphology. Observing the shear stress distribution for flat bed, crest conditions, and conditions where the pipeline is positioned on the downstream side of the sand wave, it can be noted that, during the initial scouring stages, the maximum shear stress peaks occur beneath the pipeline, while another peak corresponds to the crest of the downstream sand dune. As scouring progresses, both peaks decrease, indicating the scour profile is approaching equilibrium.
Under trough conditions, the bed shear stress is significantly lower, slightly elevated around the pipeline but insufficient to drive scouring development. For conditions where the pipeline is positioned on the upstream side of the sand wave, the initial scour pit gradually fills with sediment, the channel beneath the pipeline narrows, and significant changes in velocity lead to an increase in bed shear stress. Eventually, the initial scour pit is filled with sediment, and the shear stress peak disappears.
In addition, the velocity distribution and shear stress distribution on the upstream side along the sand wave centerline for pipelines at water depths of 0.25 m and 0.15 m are shown in Figure 26 and Figure 27. Unlike the case with a water depth of 0.35 m, the decrease in water depth leads to an increase in (D/d), resulting in higher cross-sectional flow velocity and increased shear stress. Under these two conditions, the scour pit beneath the pipeline continues to develop.
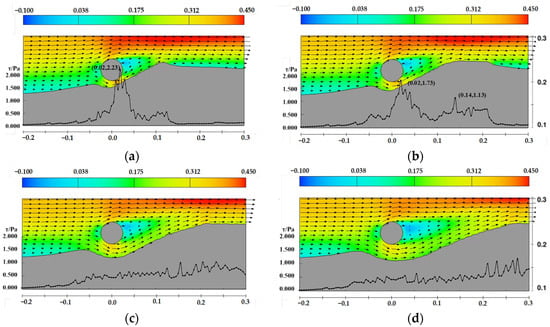
Figure 26.
Velocity and shear stress distribution near the pipeline under the sand wave midline upstream side case, D = 0.05 m, d = 0.25 m, the arrows represent velocity vectors (a) t = 4 min, (b) t = 12 min, (c) t = 40 min, (d) t = 120 min.
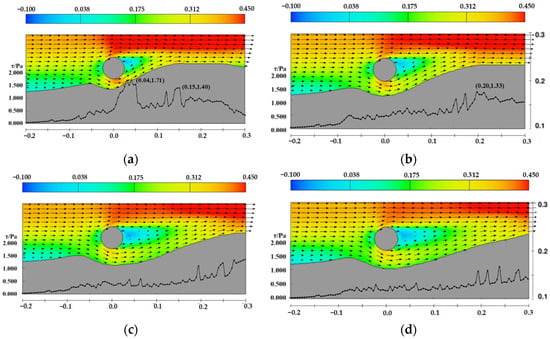
Figure 27.
Velocity and shear stress distribution near the pipeline under the sand wave midline upstream side case, D = 0.05 m, d = 0.15 m, the arrows represent velocity vectors (a) t = 4 min, (b) t = 12 min, (c) t = 40 min, (d) t = 120 min.
4. Conclusions
This study numerically investigates the 2D local scour around a submarine pipeline on a sand wave seabed, focusing on the impact of the relative position of the pipeline and seabed sand waves on the flow field and scour morphology. The accuracy of the numerical model is assessed by comparing it with a series of published results of physical experiments.
In the numerical simulations of this study, the results for pipelines with diameters of 0.1 m and 0.08 m are similar, but significant differences appear when the diameter is reduced to 0.05 m. For pipelines of the same diameter, the scour rate is faster when the water depth decreases, and the maximum scour depth at equilibrium is greater. This difference mainly manifests in the scour rate when the ratio of pipeline diameter to water depth is less than 0.2, while the maximum scour depth is not significant. However, when the ratio increases to 0.33, the maximum scour depth increases significantly.
For the numerical simulations of local scour on sand wave seabeds, it was found that the scour intensity from strong to weak is as follows: pipeline at the crest, pipeline at the downstream slope of the sand wave, pipeline at the upstream slope of the sand wave, and pipeline at the trough. This study concludes that the direct impact of the bed morphology and its indirect impact on hydrodynamic conditions are the reasons for the differences in pipeline scour intensity and scour profiles at different positions on the sand waves. The study also finds that under certain conditions, sediment deposition and self-burial of the pipeline may occur when the pipeline is at the trough or the upstream slope of the sand wave. The protective effect of the crest on the downstream side can also reduce the scour intensity of the pipeline, contributing to pipeline safety. Then, the velocity distribution and the bed shear stress distribution around the pipeline and seabed are presented. The magnitude of the bed shear stress reflects the intensity and rate of sediment scouring and significantly influences the evolution of scour profile morphology.
It should be noted that this study is limited to non-cohesive sand beds under constant flow conditions, with all conditions having the pipeline parallel to the sand waves and perpendicular to the flow direction. The parameters of sand wave wavelength and wave height used in this study are selected based on actual physical experiments and observational data, with a wavelength 18 times the diameter of the pipeline. In actual engineering, the sand wave size relative to the pipeline is often larger. Additionally, this study uses a regular symmetrical sand wave model for numerical simulations, which has significant differences from actual conditions, necessitating further research.
Author Contributions
Conceptualization, Z.Z. and C.H.; methodology, Z.Z. and W.F.; validation, Z.Z. and W.F.; investigation, Z.Z. and W.F.; resources, W.F. and C.H.; data curation, C.H.; writing—original draft preparation, Z.Z. and W.F.; writing—review and editing, C.H.; visualization, Z.Z. and C.H.; supervision, C.H.; project administration, Z.Z. and C.H.; funding acquisition, Z.Z. and C.H. All authors have read and agreed to the published version of the manuscript.
Funding
This research was funded by Discretionary Fund of National Science Center for Earthquake Engineering (NO. 2025ZZB4006), National Natural Science Foundation of China (51979192, 52371289), the Shenzhen Science and Technology Program (No. GJHZ20220913142612023), the Guangdong Science and Technology Program (No. 2021ZT09H390), and the Shenzhen Science Technology Program (No. KQTD20200820113011026).
Data Availability Statement
The original contributions presented in this study are included in the article. Further inquiries can be directed to the corresponding author.
Acknowledgments
The authors also thank the anonymous reviewers for their helpful comments and suggestions.
Conflicts of Interest
The authors declare that they have no known competing financial interests or personal relationships that could have appeared to have influenced the work reported in this paper.
References
- Song, Q.; Liu, J.; Gao, F. Very high cycle fatigue life of free-spanning subsea pipeline subjected to vortex-induced vibrations. J. Mar. Sci. Eng. 2024, 12, 1556. [Google Scholar] [CrossRef]
- Fu, C.; Wang, P.; Zhao, T.; Li, G. Allowable span length of submarine pipeline in shallow water. Mar. Georesour. Geotechnol. 2018, 36, 532–539. [Google Scholar] [CrossRef]
- Lin, A.; Hu, Y.; Lin, G. Progress and perspective of submarine sand waves researches. Adv. Geophys. 2017, 32, 1366–1377. [Google Scholar]
- Wang, C.; Sun, Y.F.; Liu, Z.W. Experiment on formation and migration of submarine sand waves under current conditions. Adv. Mar. Sci. 2020, 38, 688–696. [Google Scholar]
- Sumer, B.M.; Truelsen, C.; Sichmann, T.; Fredsøe, J. Onset of scour below pipelines and self-burial. Coast. Eng. 2001, 42, 313–335. [Google Scholar] [CrossRef]
- Myrhaug, D.; Rue, H. Scour below pipelines and around vertical piles in random waves. Coast. Eng. 2003, 48, 227–242. [Google Scholar] [CrossRef]
- Zang, Z.P.; Cheng, L.; Zhao, M.; Liang, D.F.; Teng, B. A numerical model for onset of scour below offshore pipelines. Coast. Eng. 2009, 56, 458–466. [Google Scholar] [CrossRef]
- Han, Y. Study on the Erosion and Protecting Technique for Submarine Pipeline. Master’s Thesis, Ocean University of China, Qingdao, China, 2010. [Google Scholar]
- Yang, L. Study on the Scour and Protection Technology for Submarine Pipeline Under Wave Condition. Master’s Thesis, Ocean University of China, Qingdao, China, 2012. [Google Scholar]
- Cheng, L.; Li, F. Modelling of local scour below a sagging pipeline. Coast. Eng. J. 2011, 45, 189–210. [Google Scholar] [CrossRef]
- Draper, S.; An, H.; Cheng, L.; White, D.J.; Griffiths, T. Stability of subsea pipelines during large storms. Philos. Trans. R. Soc. A 2015, 373, 20140106. [Google Scholar] [CrossRef] [PubMed]
- Zhao, M.; Vaidya, S.; Zhang, Q.; Cheng, L. Local scour around two pipelines in tandem in steady current. Coast. Eng. 2015, 98, 1–15. [Google Scholar] [CrossRef]
- Gao, F.P.; Yang, B.; Wu, Y.X.; Yan, S.M. Steady current induced seabed scour around a vibrating pipeline. Appl. Ocean Res. 2006, 28, 291–298. [Google Scholar] [CrossRef]
- Brørs, B. Numerical modeling of flow and scour at pipelines. J. Hydraul. Eng. 1999, 125, 511–523. [Google Scholar] [CrossRef]
- Van Beek, F.A.; Wind, H.G. Numerical modelling of erosion and sedimentation around offshore pipelines. Coast. Eng. 1990, 14, 107–128. [Google Scholar] [CrossRef]
- Liang, D.; Cheng, L.; Li, F. Numerical modeling of flow and scour below a pipeline in currents: Part II. Scour simulation. Coast. Eng. 2005, 52, 43–62. [Google Scholar] [CrossRef]
- Cheng, L.; Zhao, M. Numerical model for three-dimensional scour below a pipeline in steady currents. In Proceedings of the International Conference on Scour and Erosion (ICSE-5), San Francisco, CA, USA, 7–10 November 2010; pp. 33–42. [Google Scholar]
- Scandura, P.; Armenio, V.; Foti, E. Numerical investigation of the oscillatory flow around a circular cylinder close to a wall at moderate Keulegan–Carpenter and low Reynolds numbers. J. Fluid Mech. 2009, 627, 259–290. [Google Scholar] [CrossRef]
- Xu, F. Numerical Modeling of Local Scour Beneath Offshore Pipeline (Pile) in Steady Currents. Master’s Thesis, Shanghai Jiao Tong University, Shanghai, China, 2017. [Google Scholar]
- Wang, Z.; Liang, B.; Wu, G. Experimental investigation on characteristics of sand waves with fine sand under waves and currents. Water 2019, 11, 612. [Google Scholar] [CrossRef]
- Flemming, B.W. Zur Klassifikation subaquatischer, strömungstransversaler Transportkörper. Boch. Geol. Geotech. Arb. 1988, 29, 44–47. [Google Scholar]
- Mao, Y. The Interaction Between a Pipeline and an Erodible Bed. Ph.D. Thesis, Technical University of Denmark, Lyngby, Denmark, 1986. [Google Scholar]
- Kjeldsen, S.P.; Gjorsvik, O.; Bringaker, K.G.; Jacobsen, J. Local scour near offshore pipelines. In Proceedings of the Port and Ocean Engineering Under Arctic Conditions (POAC), Reykjavík, Iceland, 27–30 August 1973; pp. 308–331. [Google Scholar]
- Bijker, E.W.; Leeuwestein, W. Interaction between pipelines and the seabed under the influence of waves and currents. In Seabed Mech; Springer: Dordrecht, The Netherlands, 1984; pp. 235–242. [Google Scholar]
- Zhao, M.; Xu, Z.; Cheng, L. Numerical investigation of scale effects in modelling scour below offshore pipelines under steady currents. In Proceedings of the ASME 2011 30th International Conference on Ocean, Offshore and Arctic Engineering, Rotterdam, The Netherlands, 19–24 June 2011. [Google Scholar]
- Mao, Y. Seabed scour under pipelines. In Proceedings of the Seventh International Conference on Offshore Mechanics and Arctic Engineering, Houston, TX, USA, 7–12 February 1988; Volume 5, pp. 33–38. [Google Scholar]
- Best, J. The fluid dynamics of river dunes: A review and some future research directions. J. Geophys. Res. Earth Surf. 2005, 110, F04S02. [Google Scholar] [CrossRef]
- Mueller, A.; Sumer, B.M. Mechanics of Sediment Transport; Taylor and Francis: Abingdon, UK, 1983. [Google Scholar]
Disclaimer/Publisher’s Note: The statements, opinions and data contained in all publications are solely those of the individual author(s) and contributor(s) and not of MDPI and/or the editor(s). MDPI and/or the editor(s) disclaim responsibility for any injury to people or property resulting from any ideas, methods, instructions or products referred to in the content. |
© 2025 by the authors. Licensee MDPI, Basel, Switzerland. This article is an open access article distributed under the terms and conditions of the Creative Commons Attribution (CC BY) license (https://creativecommons.org/licenses/by/4.0/).