Abstract
The general unit hydrograph (GUH), recently established by Guo, represents the most advanced hydrograph model today, but how to implement it with hydrologic data is another story. In this work, an effective initial value-based method for estimating the parameters in the GUH model is proposed and applied to the analysis of flood processes. In contrast to the flood-rainfall united fitting method, which heavily depends on the flood records and has a broad range of parameter variations, which makes it practically intractable, the initial value-based method enables the calculation of model parameters directly from the measured rainstorm data and greatly enriches the discharge dataset so that more accurate prediction of flood processes becomes achievable. From the data collected from several watersheds, we find that smaller-shape parameters usually indicate a multi-peak flood process, and the rainfall patterns have a significant impact on flood peaks. These results provide a reliable approach for the prediction of floods in streams with scarce discharge data. Additionally, it is observed that the peak time lags have a notable increase from the southwest to the northeast of Zhejiang.
1. Introduction
According to the sixth assessment report of the Intergovernmental Panel on Climate Change (IPCC), human activities lead to significant changes in global and regional climate [1]. Most of these changes are in the direction expected with warming temperature [2]. However, an intensified hydrological cycle with global warming is expected to increase the intensity and frequency of extreme precipitation events [3]. Natural disasters, such as rainstorms and floods, landfall typhoons, and super-alert storm surges, show an upward or increasing trend [4,5], which result in loss of life, building destruction, beach and dune erosion, and road and bridge destruction [6], causing huge impacts and losses to human economic life. Rainstorm and flooding are among the most frequently occurring disasters caused by extreme precipitation events, having caused great harm worldwide. Therefore, the study of rainstorms and floods is of great significance. However, as the number of hydrological stations is quite limited in practice, the lack of corresponding flood data is a serious issue that impedes the understanding of flood processes.
On the other hand, while the rainfall data from rainfall stations are sufficient, the impact of rainfall patterns on flood process is difficult to quantify. Furthermore, the contribution of rainfall at each station to the flood event is often unclear, as one hydrological station often corresponds to multiple rainfall stations. The purpose of this study is to propose a new GUH-based method to address the aforementioned issues, namely to effectively predict flood processes based on rainfall data and to evaluate the contribution from different rainfall stations.
1.1. Why GUH for Flood Process
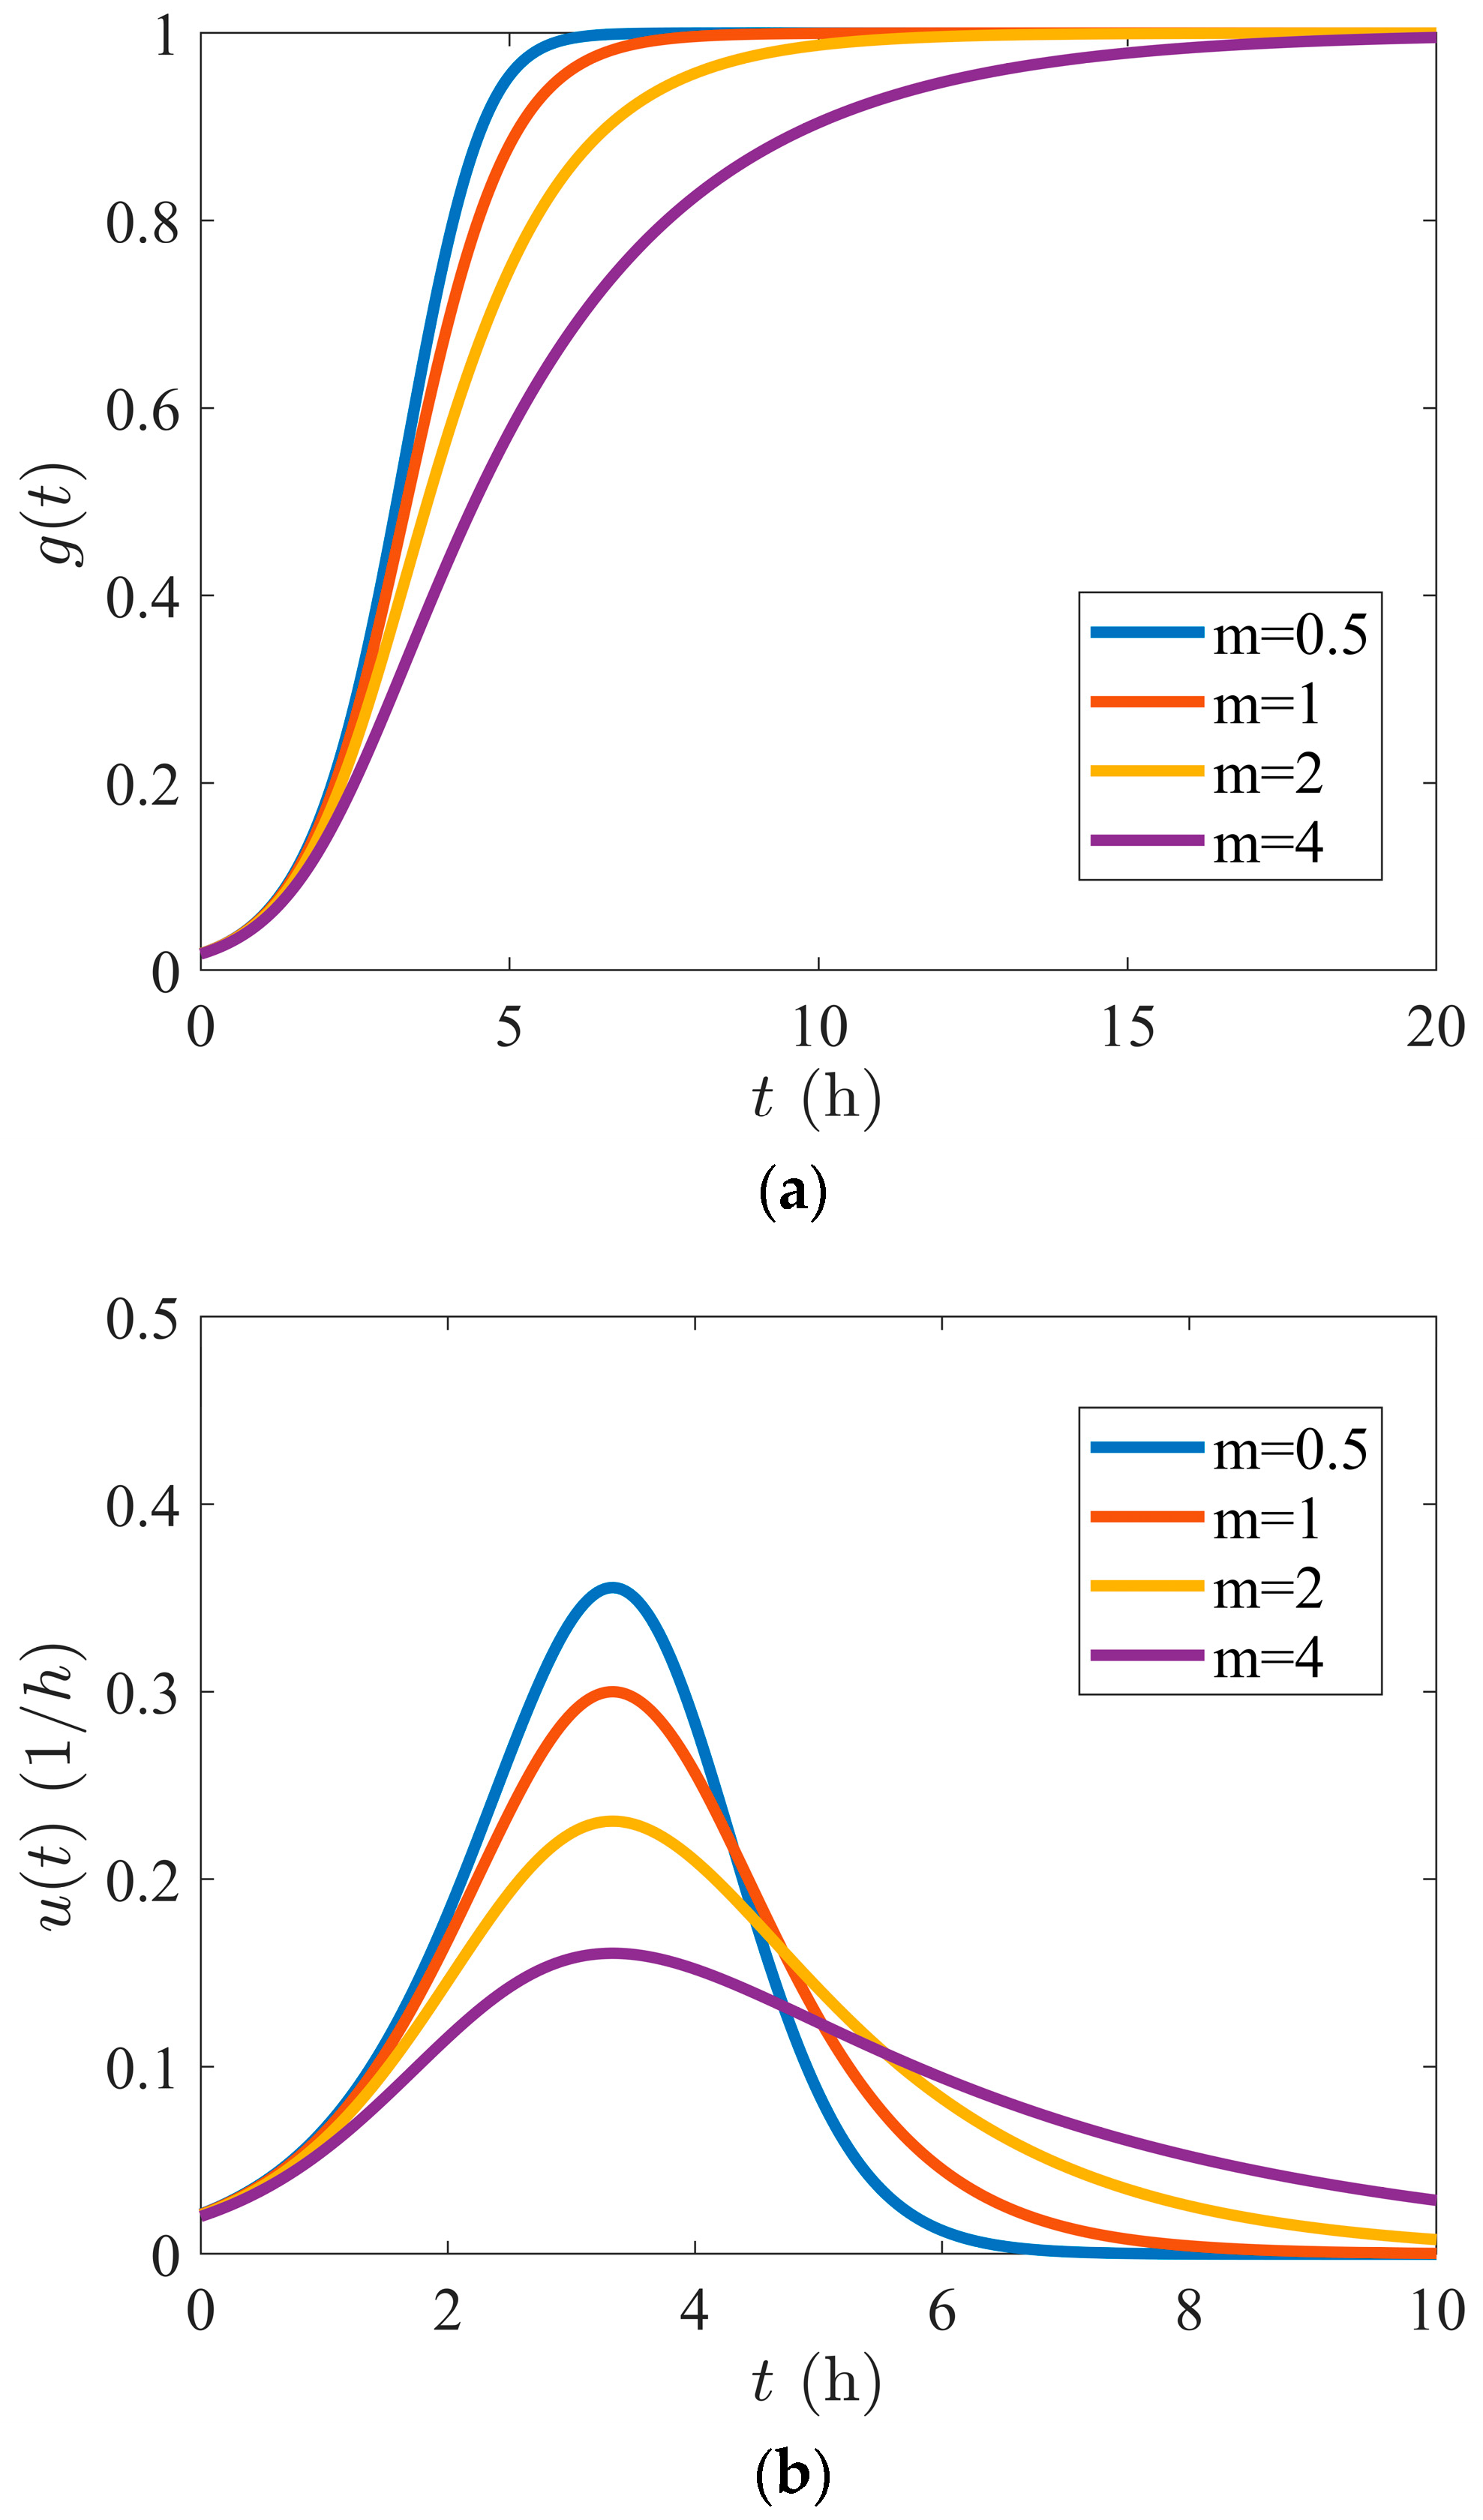
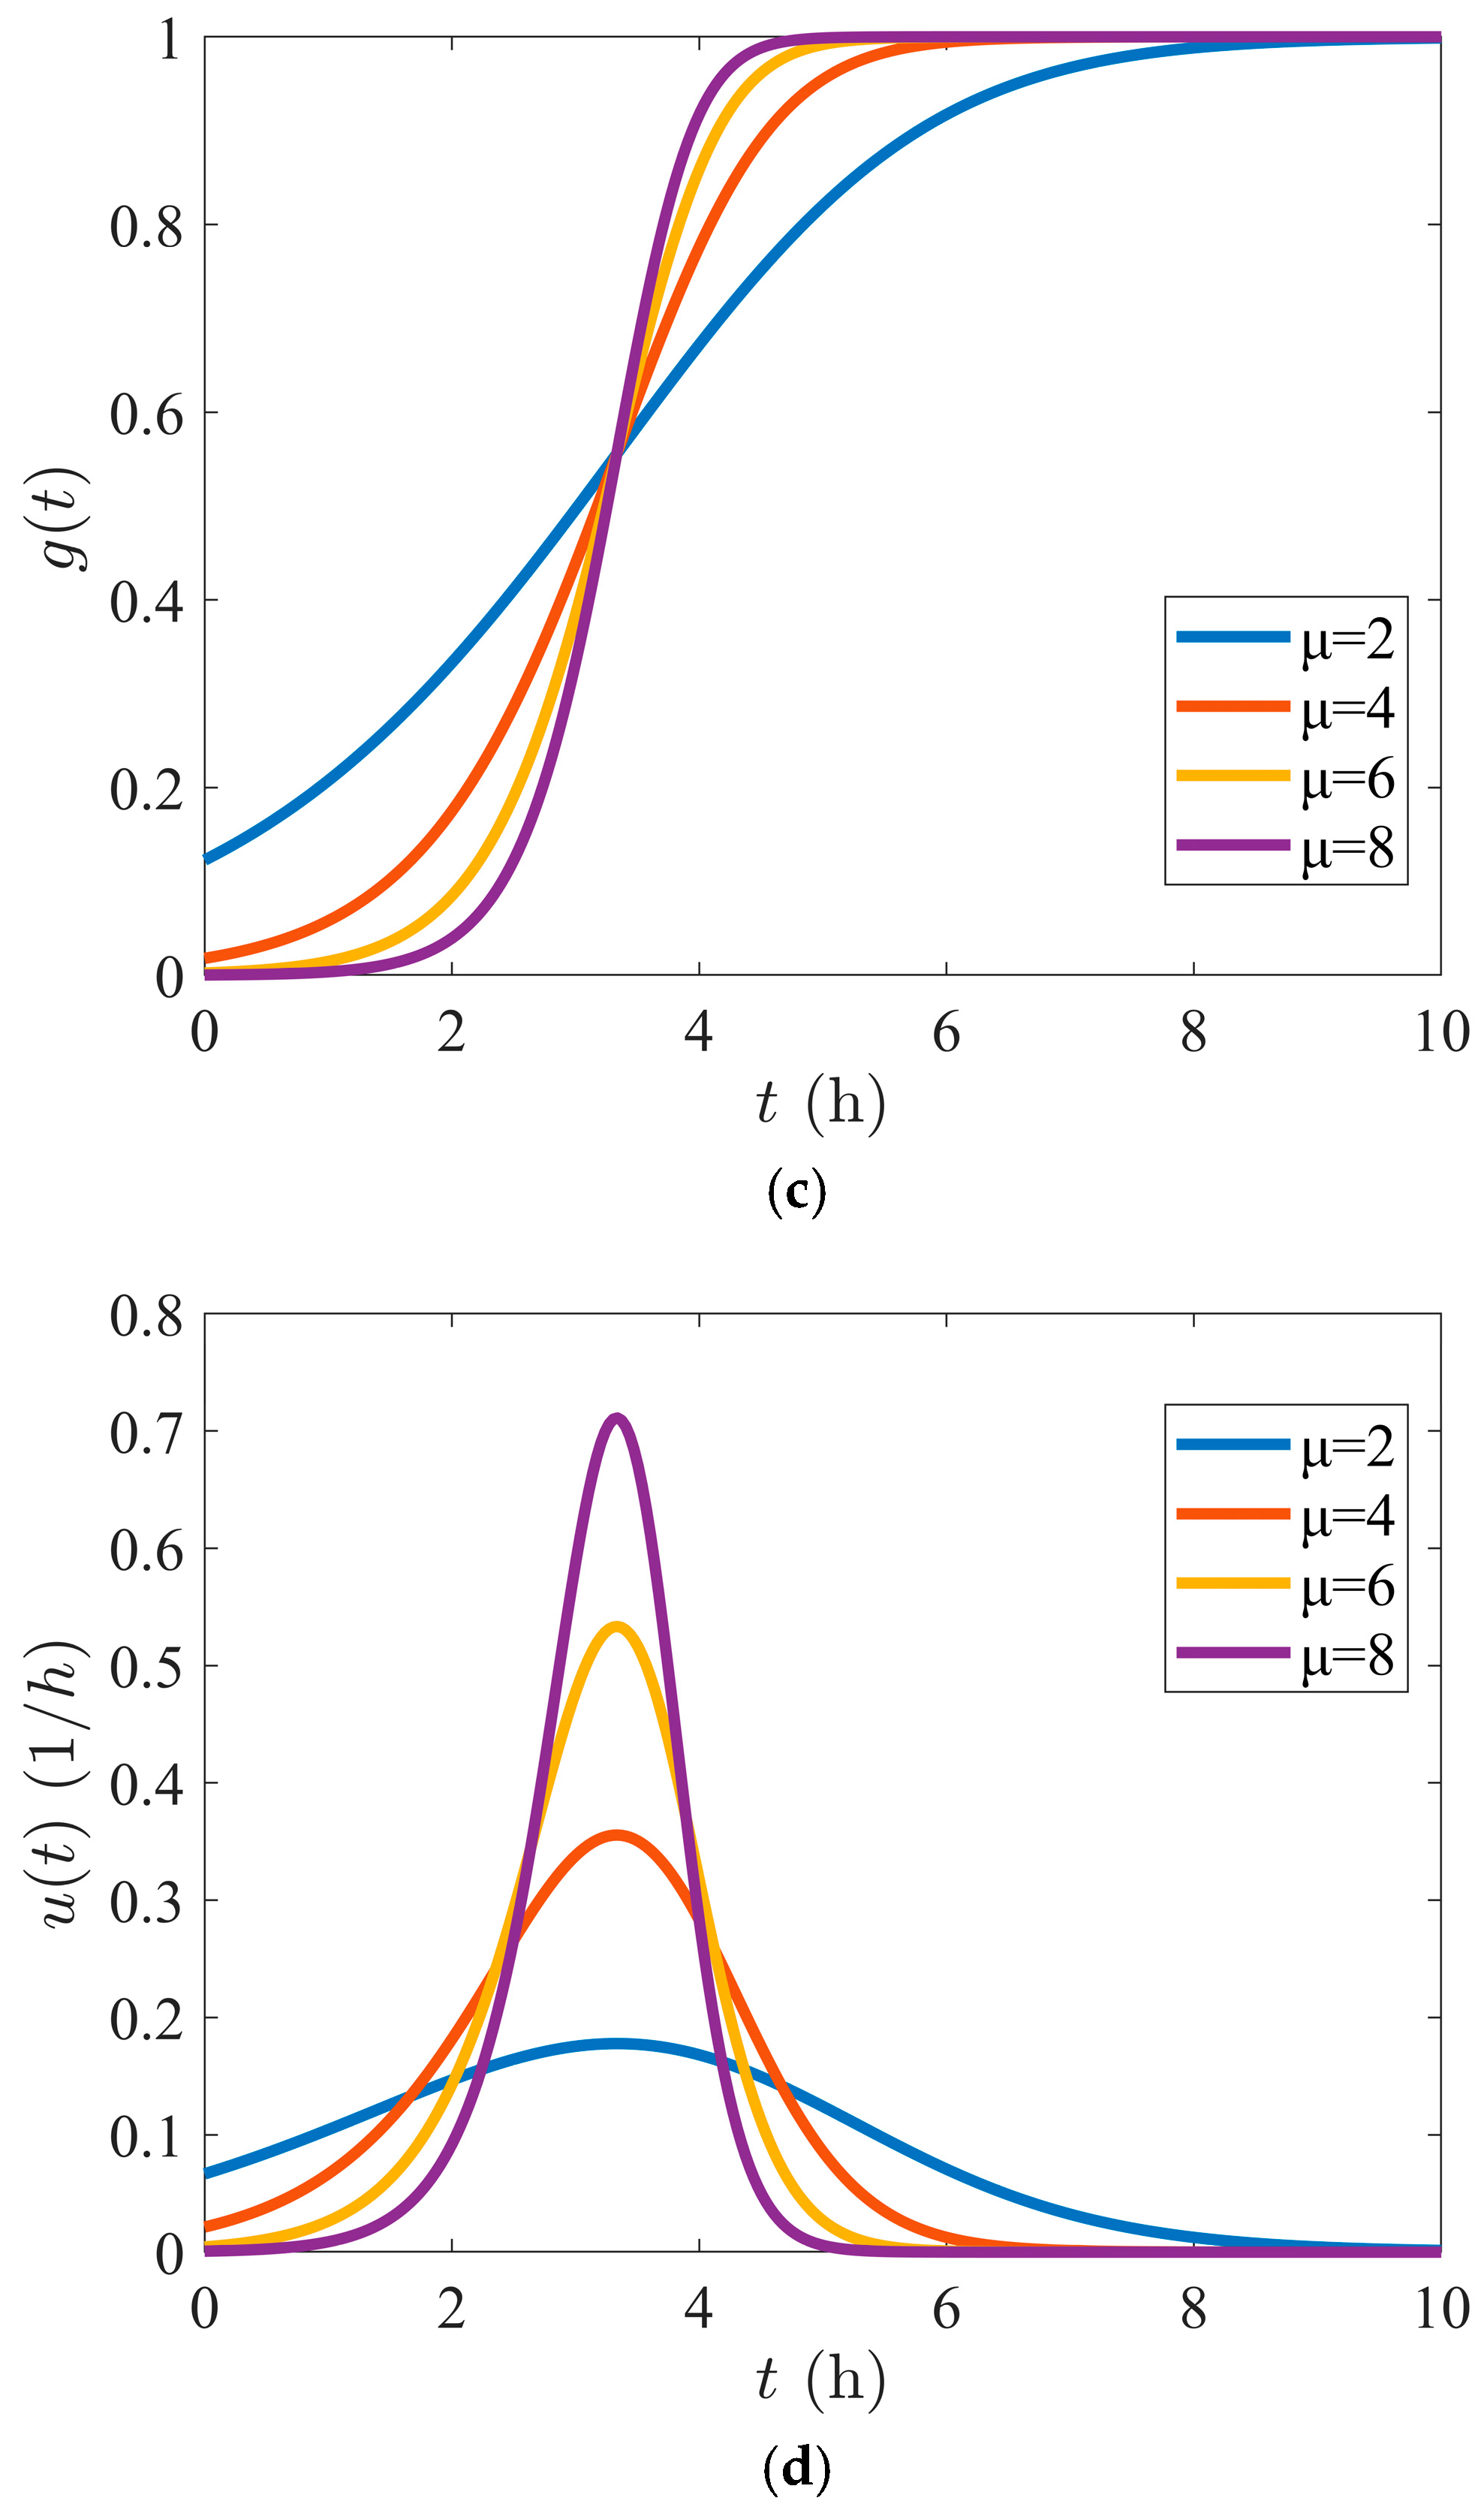
To prevent flood disasters, the American Boston Civil Engineering Association [7] suggested that “the process of instantaneous rainstorm generation can represent the characteristics of the watershed”, which is named “instantaneous unit hydrograph (IUH)” later. The IUH of natural watersheds was derived by Nash [8], based on equal cascades of linear reservoirs (LR) with equal storage coefficients, K. This method has been widely used in flood routing. Chow [9] believed that watershed confluence can be described as a dynamic system, using the following linear differential equation:
where represents the flow process at the outlet section; is the net rain process corresponding to the flow process at the outlet section; and the coefficient terms are either constants or functions of time t.
In this context, many scholars have attempted to optimize UH or IUH. Such studies [10,11] comprise estimation of beta-distribution parameters, leading to a considerable simplification of the trial-and-error solution for UH. A new simple method [12] for identifying IUH with two parameters outperforms the least squares and linear programming approaches. A model [13] coupling the XAJ model with geomorphologic instantaneous UH(GIUH) can further reduce the uncertainty in runoff simulation. Sulistyowati et al. [14] applied GIS to determine watershed’s physical parameter characteristic, which is able to derive the unit hydrograph of the GIUH method with limited hydrologic data or unavailability of rainfall-runoff data. An evaluation [15] of the influence of lumped and semi-distributed models on the applicability of Soil Conservation Service UH (SCSUH) and Clark’s IUH (CIUH) for estimation of flood hydrographs. Ther eis also an analysis [16] of the relative effects of time–area curve and storage coefficient on CIUH.
However, the above-mentioned UH methods have three shortcomings [17]. (1) For different durations , the interval UH cannot predict direct runoff hydrograph (DRH). (2) Zero initial conditions are not the true form of IUH . (3) There is no bridge that links the existing methods analytically. Guo [17,18] proposed the general unit hydrograph, as a generalization of the IUH and interval UH, to overcome the above shortcomings, accurately predicting flood hydrographs.
1.2. What Is GUH
The underlying assumption for the establishment of GUH is that water enters the same watershed simultaneously but leaves at different times. The cumulative volume of water at the outlet or S-hydrograph increases monotonically over time, and is expressed as follows:
where is the shape parameter, is the peak time lag, and is the growth constant at the rising segment. Forming an S-shaped curve called the GUH, the cumulative volume is shown on the time interval in Figure 1a, where curves in different colors, from blue to purple, correspond to different shape parameters: = 1/2, 1, 2, and 4, the growth constant is fixed to be 4 and .

Figure 1.
(a) GUH with different shape parameters; (b) IUH with different shape parameters; (c) GUH with different growth constants; (d) IUH with different growth constants.
The instantaneous UH is the derivative of , namely if we denote by the interim variable expressing the exponential growth in the rising segment, then
which is the impulse response of a watershed or the flow rate at the outlet. From its derivative,
it can be seen that achieves its maximum exactly at the peak time.
From a viewpoint of probability, if we consider the time as a random variable, Equation (2) is a probability distribution function on the real line and the instantaneous UH corresponds to the density function. IUH is plotted in Figure 1b with the same set of parameters, where it is clear that has a rising stage before the peak time and enters the recessing stage afterwards. The shape parameter reflects the symmetry property of the density. If , is symmetric with respect to ; if , it is positively skewed; and if , it is negatively skewed.
In the rising stage, has exponentially fast growth, and the parameter tells us how fast the impulse grows. From Figure 1c,d, it can be seen that as the growth constant becomes larger, the density becomes more concentrated around the peak time and the S-hydrograph has a steeper slope. The larger the growth constant, the less cumulative volume loss at the initial time .
In application, the interval UH (or UH of duration ) is more often used, which is defined as the average slope of between and , namely
If one considers different time periods, the following expression for the runoff hydrograph can be obtained:
where is the volume of excess rainfall in duration , and is the interval UH in duration , starting at and ending at . Once the three model parameters are obtained, Equation (6) is then used to predict future flood discharges analytically.
1.3. Why Flood Processes in Zhejiang
Flood is the main natural disaster with the highest probability of occurrence, largest impact range, and greatest losses. With the increase in population and socio-economic development, the impact range and economic losses of floods are showing an upward trend in China [19]. For example, the problems caused by urban flood disasters have become increasingly serious since China entered a stage of rapid urbanization [20]. About 62% of China’s 500 cities have experienced urban rainstorm and waterlogging disasters [21]. During the period from 2011 to 2018, 154 cities experienced floods with direct economic losses of CNY 222.1 billion per year. Floods in 2021 affected a total of 590.1 million people, causing a direct economic loss of CNY 245.892 billion.
Having a land area that is almost one-third of Germany’s, Zhejiang’s hydrological environment is representative in southeast China. With its GDP no less than that of the Netherlands and its population close to Italy’s, the study of Zhejiang’s flood processes for reducing disaster caused losses is especially meaningful. Success in applying our method to Zhejiang is a strong indication that it works in other lands as well.
2. Validation of GUH to Small Watersheds
2.1. Pre-Order Preparation
2.1.1. Data Sources
The data used in this study are collected from multiple basins in Zhejiang, including the Fu Stream Basin, Dai Stream Basin, Beigang Basin, Huangze Basin, Shouchang Basin, Mawang Stream Basin, and Ruo Stream Basin. The data are the actual rainfall and flood measurement data from hydrological stations, such as Hongjiata from 1957 to 2021, Daitou from 1956 to 2021, Daixi from 1964 to 2008, Huangze from 1979 to 2021, Yuankou from 1959 to 2021, Jiangjia from 1963 to 1990, Zhudaogang from 1983 to 2007, and surrounding rainfall stations.
2.1.2. Performance Index
Performance index is an important basis for quantitative evaluation of model predictions. The model performance index used and evaluated for each rainstorm event in this article is the (Nash–Sutcliffe efficiency coefficient), which is generally used to verify the quality of hydrological model simulation results. is defined as
where refers to the actual measured flow data and represents the corresponding data predicted or simulated by hydrological models. is the average of all , and is the number of samples. and the closer to 1 is the better the model that fits the data.
2.1.3. Identifying GUH Parameters
The observed data on discharge and rainfall shown in Table 1 were taken at Hongjiata station in the Fu Stream Basin with an area of 151 km2, from 10 to 11 July 1966. It is estimated that the baseflow 25.10 m3/s and volume .
Table 1.
Rainfall and discharge in the Fu Stream Basin from 10 to 11 July 1966.
- Approach 1: Flood—rainfall united fitting
The model parameters in GUH can be identified by fitting Equation (6) in the previous text. The specific calculation steps are as follows.
Step 1: The ERH (excess rainfall hyetograph) is calculated according to the law of conservation of mass. The total volume of flood produced by rainfall during this period is and the volume of water produced by rainfall is . Then, the total loss of rainfall is , which can be distributed to the four intervals as 6, 12.1264 − 6 − 1.6 − 0.4, 1.6, and 0.4. Thus, ERHs are 0 mm, 25.9736 mm, 0 mm, and 0 mm.
Step 2: Rainstorm has four ERH coordinates in unit depth, which are converted into volume by . For example, , and can be obtained.
Step 3: The observed interval time is set to be . DRH (direct runoff hydrograph) is calculated by Equation (6) as
where is defined using Equation (5).
Step 4: Calculate using Equation (6) and the GUH parameters based on the data from columns 4 to 6 in Table 1. These parameters are . The fitting curve with = 0.9984 is shown in Figure 2.
Figure 2.
Application of GUH to storm at Hongjiata station (HJT) in July 1966.
- Approach 2: Initial loss-based calculation
According to Section 1.2, is the unit hydrograph at the initial time, is the initial loss as a percentage of total rainfall to be calculated, is an intermediate variable, and is directly related to the parameter by .
In the rising phase of flood, . In the receding phase of the flood, , the following equations can be connected to solve and :
When the flood process is unknown, only empirical values can be used to calculate losses. The empirical loss [22] of the rainstorm is 1.5 mm/h when the runoff is calculated in Zhejiang. So, it can be calculated that , and the flood event parameters in July 1966 can be obtained accordingly. ERHs are 4.5 mm, 28.6 mm, 0.1 mm, and 0 mm. ERH peak occurs when and flood peak occurs when , so the peak time lag . The flood process is shown in Figure 3.
Figure 3.
The theoretical flood process at Hongjiata station (HJT) in July 1966.
The initial value-based method can directly obtain the model parameters through calculation and does not need to fit the measured flood data. That is, even if the flood is unknown, the flood process can still be found. In practical engineering applications, the initial value-based method can directly calculate the flood process through rainfall, which has high engineering application value.
Although the theoretical flood process is closer to the real curve, there are still some errors between the theoretical results and the measured ones for the following reasons: Firstly, the loss value is a statistical value obtained according to history, which deviates from the actual value. Secondly, the peak time lag is not accurate since there are discrepancies between the time from the measured ERH peak to the flood peak and the real value. The flood peak theoretical value, is slightly higher than the measured value , and the flood peak occurs earlier than the measured one, which is safer in practical application.
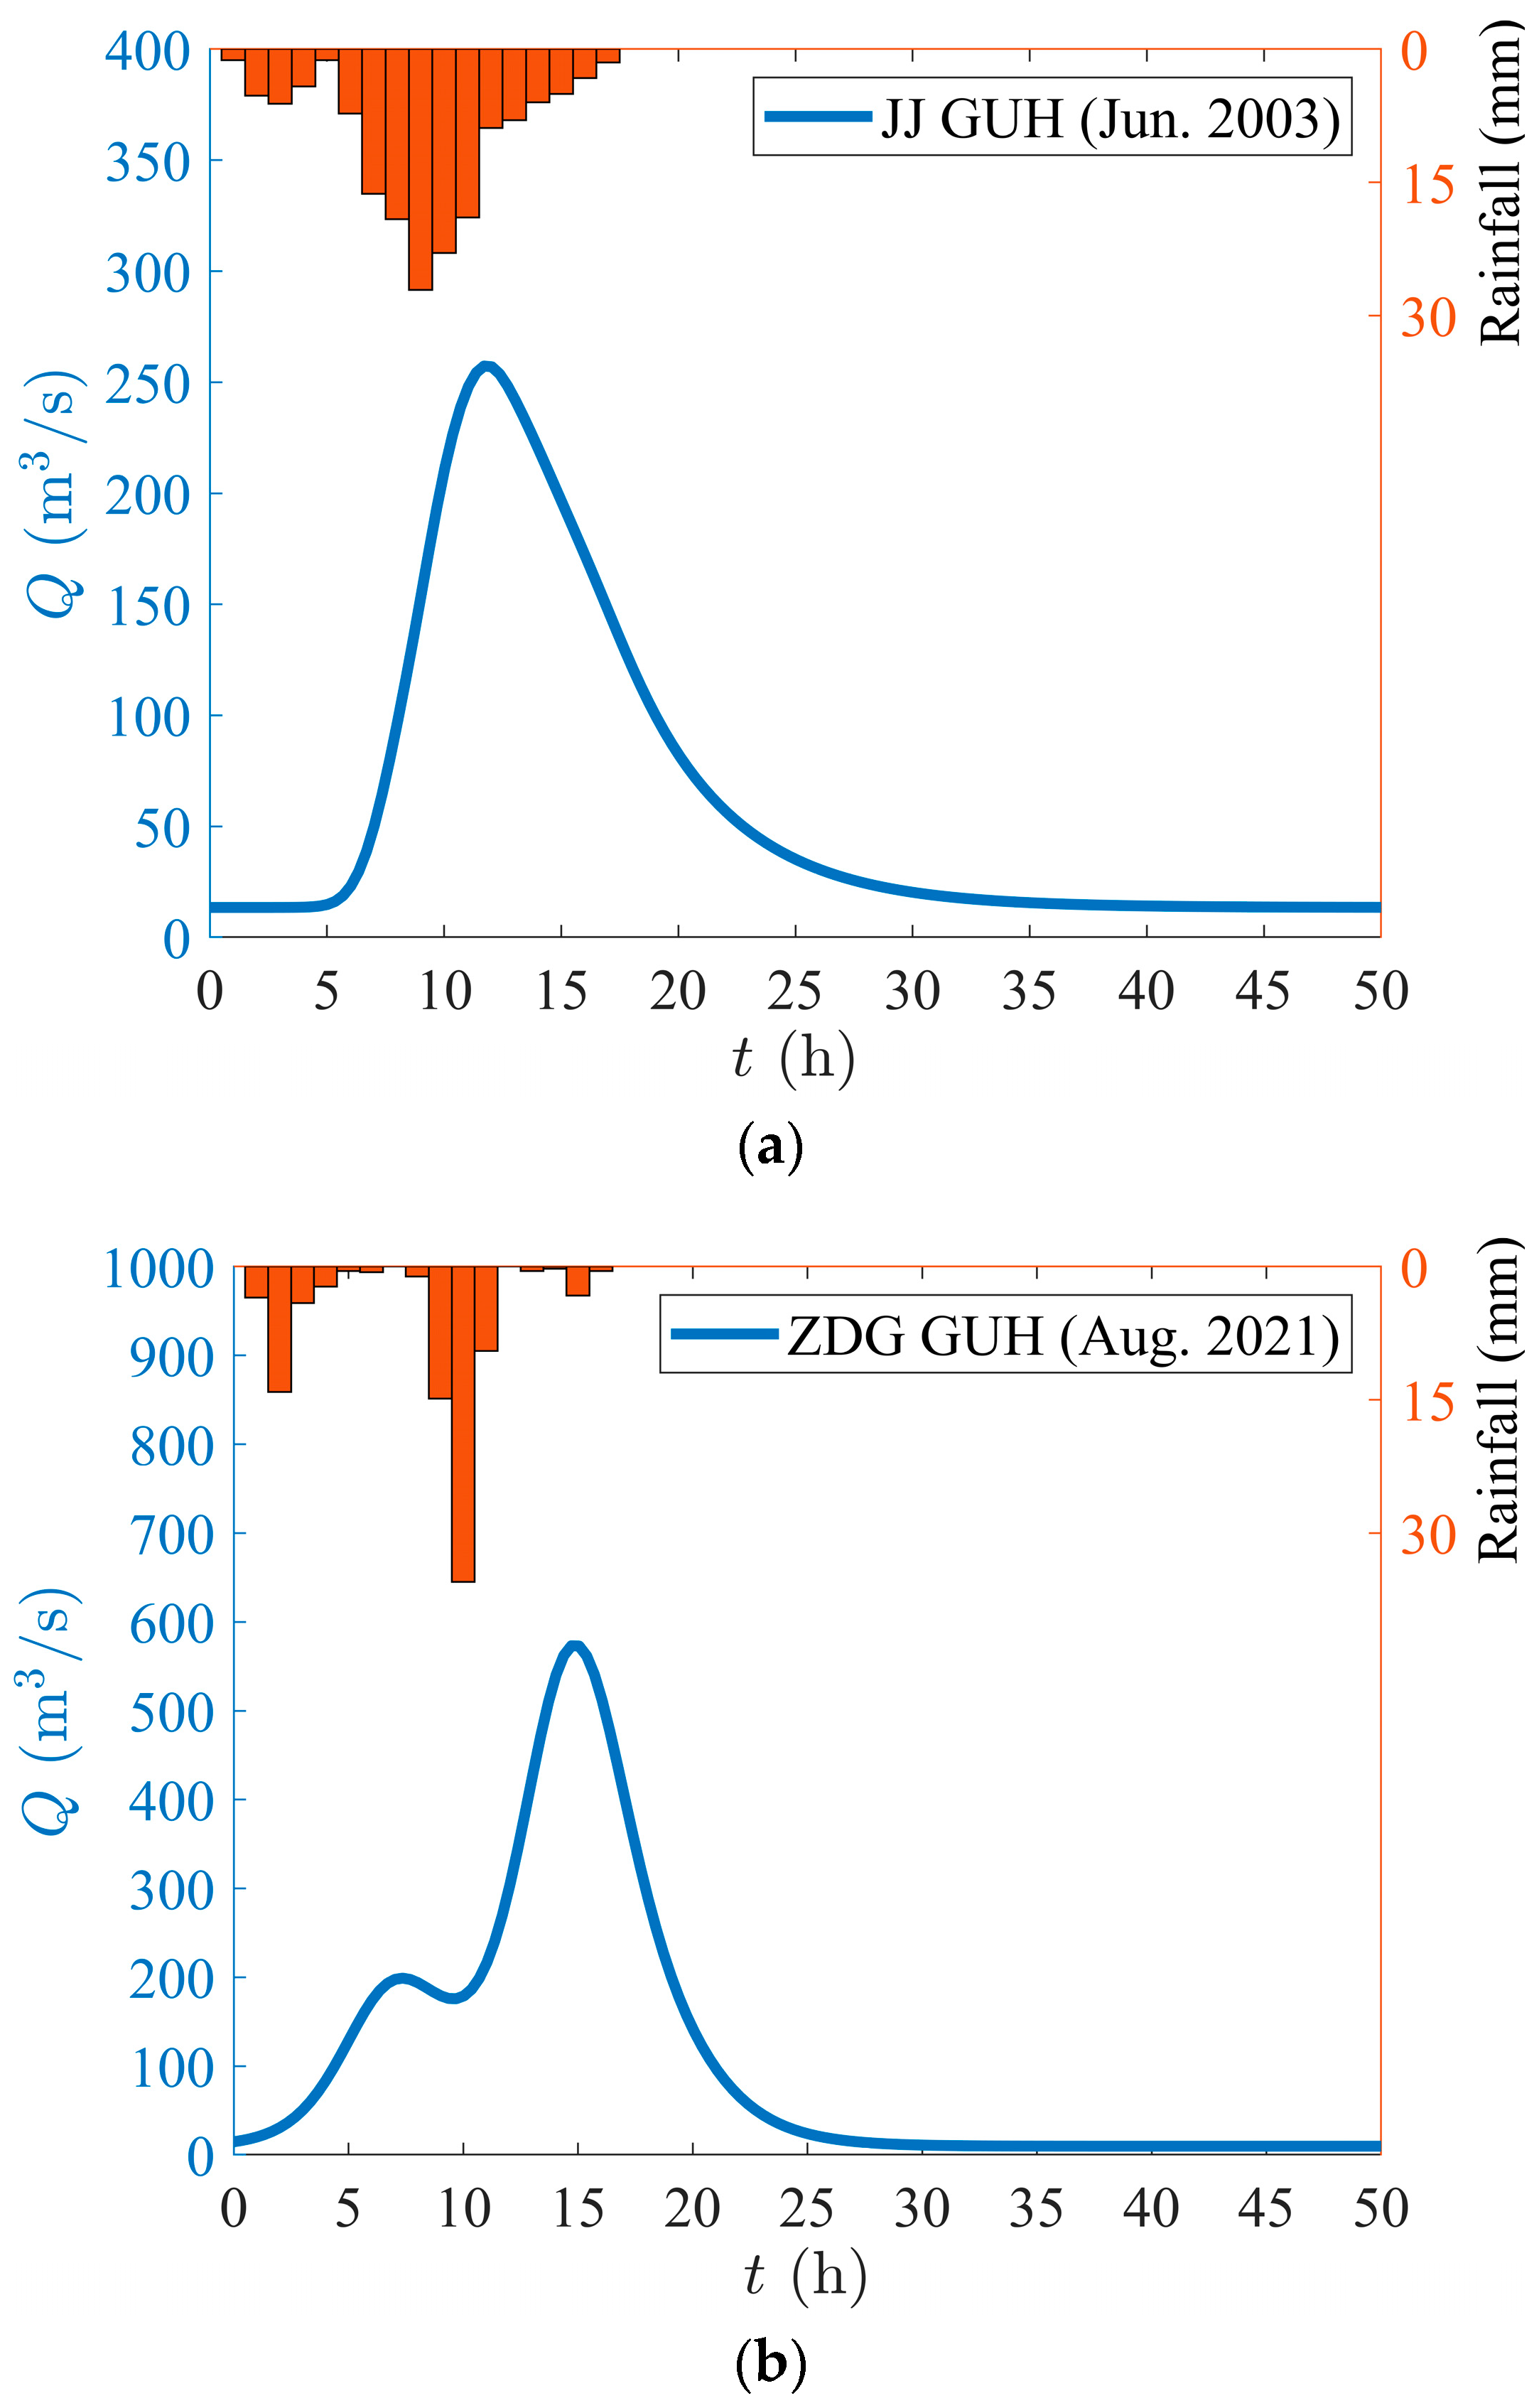
2.1.4. Predicting Flood Discharge with GUH
For the design rainstorm of four continuous ERHs, 10 mm, 40 mm, 20 mm, and 5 mm, respectively, the discharge process can be directly predicted from Equation (6) with the above parameters as follows:
The flood process calculated from Equation (9) is represented by solid lines in Figure 4. The peak discharge is 464.67 under the total rainfall 65 mm in 4 h, which can be used as the design flow for river improvement in the Fu Stream Basin. The curve depicting the entire process of flood, from rise to peak to fall, is called the flood hydrograph, and the total amount of flowing-out water is called the total flood volume. According to Figure 4, the duration of the flood is about 61 h, and integrating the curve yields a total flood volume of approximately 4671.12 . The flood peak occurs at 4.01 , which means that the rising section of the flood accounts for 6.57% of the total duration, while the integration shows that the total flood volume during the 0–4.01 period is 946.66 , accounting for 20.27% of the total flood volume. The average discharge in the rising section of the flood process is 236.07 , while in the falling section of the flood process, the value is 65.35 , which is about 361.24% lower than the rising section. From this, it can be seen that disaster prevention and early warning in the rising stage of floods are particularly important. If real-time rainfall data are applied in Equation (9), we can obtain a real-time flood warning system for the Fu Stream Basin, which can significantly reduce the destruction of flood disasters.
Figure 4.
Design storm hyetograph and flood process for Hongjiata station.
2.2. Verification of GUH
In addition to the above case, in this section, we also apply the GUH to 24 rainstorm events from Hongjiata station in the Fu Stream basin with an area of 151 km2.
The relevant parameters, defined in Section 2.1.3, are listed in Table 2. Flood process is calculated from Equation (6) by inputting 24 rainfall processes at Hongjiata station during 1969–2021. The actual value results are drawn as the blue solid line in Figure 5, while the theoretical ones are represented as the purple solid line. The observed data on rainfall process and flood discharge are also drawn in Figure 5 in the form of bar chart and scatter points, respectively.
Table 2.
Selected flood events and related parameters.


Figure 5.
(a) Application of GUH at Hongjiata station (HJT) during 1969–1971, (b) Application of GUH at Hongjiata station (HJT) during 1972–1973, (c) Application of GUH at Hongjiata station (HJT) during 1973–1975, (d) Application of GUH at Hongjiata station (HJT) during 1977, (e) Application of GUH at Hongjiata station (HJT) during 1981–1982, (f) Application of GUH at Hongjiata station (HJT) during 1984–1987, (g) Application of GUH at Hongjiata station (HJT) during 1989–1990, (h) Application of GUH at Hongjiata station (HJT) during 1992–1994, (i) Application of GUH at Hongjiata station (HJT) during 1997–1999, (j) Application of GUH at Hongjiata station (HJT) during 2004–2009, (k) Application of GUH at Hongjiata station (HJT) during 2012–2015, (l) Application of GUH at Hongjiata station (HJT) during 2019–2021.
It can be seen in Figure 5 that the prediction of the flood discharge process by using the GUH model agrees well with the observed data from each storm, with an generally higher than 95%. In addition, the following characteristics are present.
(a) As depicted in Figure 5, the prediction of peak occurrence time from the GUH is well consistent with the actual situation, regardless of whether the rain pattern is single or multi-peak. Additionally, most flood events can also be well-fitted by Approach 2 when it comes to calculating flood peak size and flood peak occurrence time.
(b) The prediction of peak flood discharge from the GUH is accurate. The peak time lag reflects the response speed of flood to rainfall. The smaller peak time lag, the faster the flood responds and the more difficult it is to take prevention measures in advance. Mountainous and hilly areas account for approximately 70.4% of the total area of Zhejiang. The slopes within the river basins are large, leading to a fast confluence speed and a rapid flood response speed with a small peak time lag.
(c) The is changeable for the same watershed at different rainfall process, due to natural geographical conditions, meteorological conditions, human activities, and other factors. For instance, changes in temperature, massive extraction of agricultural irrigation, and domestic water will cause changes in . The June 1973 flood event had and peak . In contrast, the flood event in Sept. 1977 had and peak . Combined with other values and peak values in Table 2, it can be observed that the change in has a minimal impact on the flood peak value.
(d) The time it takes for a flood to rise from the baseflow to its maximum flow and then fall back to the base flow is called the duration of the flood. The longest duration of the flood process mentioned above was the event in June 1969, which lasted for 196.89 h, while the shortest one happened in September 1989, which lasted for 40 h. More than 90% of flood durations are between 40 and 90 h.
(e) The duration of the flood process is closely related to the rainstorm process, which is reflected in that the events with long rainstorm durations also have long flood durations. Subtracting the duration of rainstorm from the duration of floods yields a time difference, with over 80% of the time difference being between 27 and 60 h. The peak time lag is the response time of the flood to the rainstorm. The peak time lag takes value between 0.5 and 4.5 h in the above rainstorm events, which means that there will be flood feedback 0.5–4.5 h after the rainstorm in the Fu Stream Basin.
(f) The of all events is greater than 1, which leads to a positive skewness of the flood process curve, having fast rise and slow discharge. It reflects the characteristics of fast flood rise and slow flood discharge in the area. The larger the value, the more time the flood discharge process takes compared to the rise process. For single-peak flood processes, the flood process in September 2004 had the highest value of 110.59, with a rise time of 3.53 h and a discharge time of 37.94 h, which is 10.85 times the rise time. The minimum of the flood process in June September 1989 was 2.25, with a rise time of 12.02 h and a discharge time of 27.01 h, which is 2.25 times the rise time. It can be seen that the flood discharge time in the area is 2.25–10.85 times the rise time.
(g) The terrain of Zhejiang Province is on a slope, where mountainous areas cover the west, hilly areas are in the middle, and alluvial plains are distributed along the coast in the east. The floods within the province are mainly caused by plum rains and typhoon rainstorms, often having multiple peaks. For multi-peak flood processes, the set of parameters is the same for the computation of each peak. The time when the flood rises from the baseflow to its maximum peak is considered the rising time, while the duration of the flood minus the rising time is considered the discharge time. The discharge time is 1.1–7.3 times the rise time, which is generally smaller than that of single-peak floods. This is mainly because the multi-peak rainstorm is less concentrated compared to the single-peak one, resulting in a longer rising process, so the ratio of the discharge time to the rising time is smaller.
3. Prediction of Flood Peaks from GUH
Data on river discharges that are hard to acquire are often less abundant than those on watershed rainfall. However, flood discharge data are fundamentally important to disaster prevention. Therefore, applying GUH to calculate flood discharge according to rainfall process is of great significance. We have collected data on watershed rainfall from 1962 to 2021, while the duration of discharge at Jiangjia hydrological station in the Mawang Stream watershed (65.3 km2) is from 1963 to 1989. Likewise, the duration of rainfall data are from 1957 to 2021, while the discharge at Zhudaogang hydrological station in the Ruo Stream watershed (235 km2) is from 1983 to 2007. Jiangjia Station and Daitou Station are located in the southwest of Zhejiang. Huangze Station and Yuankou Station are situated in the central part, while Zhudaogang Station and Daixi Station are positioned in the northeast of Zhejiang.
The actual values of () can be calculated for multiple different river basins in Zhejiang province over the years using the measured flood data. Table 3 presents the actual values of the three parameters () obtained from the measured data of 60 flood events.
Table 3.
The selected rainstorm events and related parameters.
The peak time lag is the time interval from the ERH (excess rainfall hyetograph) peak to the peak discharge, reflecting the runoff concentration speed. From Table 3, it can be seen that the peak time lag has a steady increase from the southwest to the northeast of Zhejiang. This is partly because the terrain of Zhejiang is on a slope, where the southwestern area is mountainous with mountain peaks mostly over 1000 m above sea level and the northeastern area is a low alluvial plain. The central part is hilly, with basins of various sizes scattered all over this area. The steeper the slope is, the faster the runoff concentration speed is likely to be, leading to smaller peak time lag.
In Table 3, greater flood peaks mostly come from larger watershed areas. The maximum peak flood in the Mawang Stream is only 219 m3/s, with a watershed area of 65.3 km2. The flood peak in Dai Stream is a result of 538 m3/s watershed area. The peak flood of the Ruo Stream and Huangze River exceed 1000 m3/s, with a catchment area of more than 200 km2. The maximum peak flood in the Shouchang River reaches a staggering 3160 m3/s, with a watershed area of 687 km2. Although the area of the Beigang Basin is not as large as the Huangze River, it has greater runoff with a peak value of over 2000 m3/s. This is because the Beigang Basin comes from a strong tidal section, the Ao river, and is subject to the two-way action of flood and tide.
3.1. Extension of Discharge Data
shows little variation in the same basin. Additionally, baseflow has little impact on the flood peak. Hence, the median of the parameters in Table 3 is taken. The theoretical values of and can be calculated from the rainfall data. The flood processes for rainfall events lacking discharge data are predicted by GUH model with the parameters in Table 4.
Table 4.
GUH model parameters for two watersheds.
It can be seen from Figure 6 that the predicted flood process responds to the rainfall process. In Figure 6a, the rainfall process in June 2003 had only one peak with maximum heavy rain intensity of 27.1 mm/h, and so does the flood process that lasts 17 h, having a peak discharge of 238.3 m3/s. In Figure 6b, there are two peaks during the rainfall period, and the second peak is much higher than the first one, which is also reflected in the predicted flood process. The maximum measured flood at Jiangjia station was 219 m3/s, generated by a rainstorm in July 1966, lasting for 17 h. The maximum rain intensity reached 19.3 mm/h, the average rain intensity was 8.6 mm/h, and the total rainfall was 145.9 mm.
Figure 6.
(a) GUH at Jiangjia station; (b) GUH at Zhudaogang station.
The peak floods are predicted by using GUH from the top five rainfall events with a 24 h cumulative total rainfall amount, of which the maximum value is regarded as the annual maximum flood. We used this method to predict the annual flood peak during 1962–2021, as listed in Table 5.
Table 5.
Prediction of annual flood peaks at Jiangjia station.
The observed data from 1963 to 1989 are compared with the predicted values in Figure 7, where the abscissas of the points represent the observed values, while the ordinates represent the predicted values. A point is on the solid line when the observed value is equal to the predicted one. The predicted values are generally slightly smaller than the observed ones, with a mean absolute percentage error of 4.83%. This means that GUH not only plays a good role in predicting flood processes but also has good performance in peak prediction.
Figure 7.
Comparison between observed and predicted values.
3.2. Flood Frequency Analysis
Flood frequency analysis is a theoretical basis for the planning, design, and operation of hydraulic engineering. However, the available data of discharge are far less than those of rainfall, which limits the accuracy of the flood frequency analysis. GUH is suitable for predicting the missing flood peaks from the known rainstorms in order to improve the P-III curve of the annual maximum discharge.
Based on the annual maximum discharges measured at Jiangjia station during 1963–1989, the P-III distribution curve with = 0.969 is shown in Figure 8. The calculated discharge with the return period of 50 years is 241.0 while the maximum value in 27 years is 219.0 .
Figure 8.
P-III distribution of annual maximum discharges at Jiangjia station during 1963–1989.
The calculated P-III distribution of the annual maximum discharge during 1962–2021 is shown in Figure 9, where the is raised to 0.982. According to the distribution in Figure 9, the 50-year recurrence flood is 247.1 , with an increase of 2.53% compared to that in Figure 8. The maximum value in 60 years is 249.5 .
Figure 9.
P-III distribution of annual maximum discharge at Jiangjia station during 1962–2021.
Similarly, based on the annual maximum discharge at Zhudaogang station from 1983 to 2007, the P-III distribution with = 0.989 is shown in Figure 10. The 50-year recurrence flood discharge is 1115.0 while the return period of 88 years corresponds to a maximum discharge of 1260 on the P-III curve.
Figure 10.
P-III distribution of annual maximum discharge at Zhudaogang station during 1983–2007.
After the duration of annual maximum discharge extended from 1957 to 2021, the P-III distribution is calculated, as shown in Figure 11, where is raised to 0.995. According to the P-III distribution in Figure 11, the 50-year recurrence flood is 949.1 , with a decrease of 15%. The maximum discharge 1260.0 corresponds to a return period of 256 years on the P-III curve.
Figure 11.
P-III distribution of annual maximum discharge at Zhudaogang station during 1957–2021.
In brief, it is found that after extending the data, the 50-year recurrence has changed and the P-III distribution curve become more accurate.
With a more accurate frequency curve available for distribution fitting, the mathematical model for frequency-shifts by Sun et al. [23] can be employed to achieve a better estimate and control of the gap between the predicted return period and the empirical return period of the highest peaks. As a result, the frequency curve can be further improved, leading to more reliable forecasting of extreme events.
3.3. Relation Between Flood Peaks and Rainstorm Types
We propose seven types of rainstorms, each with a total amount of 270 mm over 24 h and according to temporal distribution of rainstorm, to study the effect of rainstorm process on flood peaks, as listed in Table 6. In Table 6, the 270 mm rainfall is divided into four segments at 6 h intervals for each rain type. The time of the heaviest rainstorm continuously moves from the first 6 h to the fourth 6 h in rainstorm types 1–4. The maximum value of 120 mm for type 1 occurs in the first 6 h, while that for type 4 occurs in the fourth 6 h period. The maximum rainstorm of type 5 also occurs in the last 6 h, but the maximum values are different. The rainstorm of types 6 and7 is symmetrically distributed and, especially, type 7 is evenly distributed. Figure 12 shows the distribution of rainstorms.
Table 6.
Rainstorm types and the corresponding flood peaks.
Figure 12.
Rainstorm types 1–7.
The flood peaks are predicted by the GUH model according to 24 h continuous rainstorms in Table 6. It can be seen that flood peaks vary with different rainfall patterns under the same amount of total rainfall.
The phenomena of rapid flood rise and slow recession commonly exist in small watersheds throughout Zhejiang Province. It is found that the flood peaks continued to increase from type 1 to type 4. As the rainstorm process continues, when the flood generated by the rainstorm in the first 6 h is in the state of flood recession, the flood generated by the rainstorm in the second 6 h starts to rise. The GUH of the two are accumulated, resulting in a larger flood. When the maximum rainfall occurs in the fourth 6 h, the flood generated by the rainstorm in the previous 18 h has not yet completed the recession process, which results in a greater flood peak. When the maximum rainstorm occurs in the first 6 h, its flood peak is only related to the rainstorm in the first period, so the flood peak is smaller. Therefore, the later the peak rainstorm occurs, the greater the peak flood seems to be.
Types 6 and 7 are both symmetrically distributed, but the flood peak generated by type 4 is much greater than that of type 7. The peak flood value also gradually increases as the precipitation in the last hour of types 5 and6 gradually increases. These reflect the positive correlation between rainfall peak and flood peak values.
The maximum flood of 402.28 occurs in type 5, while the minimum value of 213.72 appears in type 7, between which there is a difference of 46.9%. If rainstorm of 195 mm/6 h continues for 24 h, totaling 780 , the flood peak will be 591.92 , and the disaster risk may reach one in ten thousand years.
4. Conclusions
The general unit hydrograph, recently established by Guo, is, in theory, superior to precedent hydrograph methods, such as Nash and Chow’s UH. However, how GUH can be put into use is another story. This research validates the feasibility of GUH in China and contains a methodology improvement to GUH-based modeling.
In fact, if one does not have sufficiently large amount flood records, the flood–rainfall united fitting method, originally suggested by Guo, is simply not enough. Instead, we have proposed an initial loss-based method to enrich the flood data and to determine the parameters in GUH. As a result, using merely rainstorm data collected from watersheds, an accurate prediction of flood processes is achieved through establishing the relation between flood processes and rainfall by GUH. The test results show that the simulated flood processes agree well with the measured flood data from Zhejiang.
This research also contains progress in understanding the hydrological features of Zhejiang. Some discoveries about Zhejiang can be summarized.
(1) After fitting a total of 60 rainstorm-flood events at Jiangjia and Daitou in the southwest, Huangze and Yuankou in the central, and Zhudaogang and Daixi in the northeast, we find that the peak time lag of the GUH has a gradual increase from the southwest to the northeast of Zhejiang.
(2) Floods in Zhejiang are mainly caused by plum rains and typhoon rainstorms, which often lead to flood processes of multiple peaks. The shape parameter of multi-peak floods is usually smaller than that of single-peak ones.
(3) The discharge data are extended, which makes the return period flood forecast more accurate. After the data length at Jiangjia station was extended from 27 years to 60 years, flood discharges with the return periods of 50 year increased by about 2.53%. However, the return period flood decreased by about 15% after the length of data at Zhudaogang station was extended from 25 years to 65 years.
(4) The impact of rain types is analyzed, and the flood process is predicted under the same amount of rainfall within 24 h. It is found that the rainfall patterns have a significant impact on flood peaks. The later the peak rainfall occurs, the greater the peak flood is.
The method of this research is expected to be useful in other regions as well, especially in those where available data on floods are scarce. It gives scientific support for basin flood prevention and mitigation and helps improve the discharge design and early-warning systems.
Author Contributions
Conceptualization, Z.S.; data curation, N.X. and F.G.; funding acquisition, Z.S. and Y.S. (Yingjun Sun); methodology, Y.S. (Yizhi Sun) and Z.S.; project administration, Y.S. (Yizhi Sun), Z.S. and Y.S. (Yingjun Sun); resources, F.G. and Y.S. (Yingjun Sun); software, N.X.; supervision, Y.S. (Yizhi Sun) and Z.S.; validation, N.X., F.G. and Y.S. (Yizhi Sun); visualization, N.X. and Y.S. (Yizhi Sun); writing—original draft, N.X.; writing—review and editing, N.X., Y.S. (Yizhi Sun) and Z.S. All authors have read and agreed to the published version of the manuscript.
Funding
This research was funded by the Zhejiang Provincial Water Resources Department, grant number RA2201, and Zhejiang Department of Science and Technology, grant number 2023C03119. Yizhi Sun acknowledges additional grant support from Zhejiang Provincial Postdoctoral Science Foundation (grant number: ZJ2022020).
Data Availability Statement
The Exposable Data have been exposed in the main text to support the analysis and results, and others that have not been exposed are confidential.
Conflicts of Interest
Authors Yingjun Sun and Fang Geng were employed by the Zhejiang New Hydrological Technology Development Company. The remaining authors declare that the research was conducted in the absence of any commercial or financial relationships that could be construed as a potential conflict of interest..
References
- Lee, H.; Calvin, K.; Dasgupta, D.; Krinner, G.; Mukherji, A.; Thorne, P.; Trisos, C.; Romero, J.; Aldunce, P.; Barret, K.; et al. Climate Change 2023: Synthesis Report; IPCC: Geneva, Switzerland, 2023; pp. 35–115. [Google Scholar] [CrossRef]
- Rosenzweig, C.; Karoly, D.; Vicarelli, M.; Neofotis, P.; Wu, Q.; Casassa, G.; Menzel, A.; Root, T.L.; Estrella, N.; Seguin, B.; et al. Attributing physical and biological impacts to anthropogenic climate change. Nature 2008, 453, 353–357. [Google Scholar] [CrossRef] [PubMed]
- Zhang, S.; Zhou, L.; Zhang, L.; Yang, Y.; Wei, Z.; Zhou, S.; Yang, D.; Yang, X.; Wu, X.; Zhang, Y.; et al. Reconciling disagreement on global river flood changes in a warming climate. Nat. Clim. Change 2022, 12, 1160–1167. [Google Scholar] [CrossRef]
- Sun, Z.; Lu, M.; Nie, H.; Huang, S. Impacts of climatological change on storm surge in Zhejiang coastal water. J. Zhejiang Univ. (Sci. Ed.) 2014, 41, 90–94. [Google Scholar] [CrossRef]
- Sun, Z.; Huang, S.; Jiao, J.; Nie, H.; InstitutionPort. Effect of Runoff on Typhoon Storm Surge in Estuaries. J. Tianjin Univ. (Sci. Technol.) 2017, 50, 519–526. [Google Scholar] [CrossRef]
- Sun, Z.; Huang, S.; Nie, H.; Jiao, J.; Huang, S.; Zhu, L.; Xu, D. Risk analysis of seawall overflowed by storm surge during super typhoon. Ocean. Eng. 2015, 107, 178–185. [Google Scholar] [CrossRef]
- Singh, P.K.; Mishra, S.K.; Jain, M.K. A review of the synthetic unit hydrograph: From the empirical UH to advanced geomorphological methods. Int. Assoc. Sci. Hydrol. Bull. 2014, 59, 239–261. [Google Scholar] [CrossRef]
- Nash, J.E. The form of the instantaneous unit hydrograph. Hydrol. Sci. B 1957, 45, 114–121. Available online: https://nora.nerc.ac.uk/id/eprint/508550 (accessed on 23 April 2024).
- Chow, V.T. Handbook of Applied Hydrology; McGraw-Hill: New York, NY, USA, 1964. [Google Scholar] [CrossRef]
- Bhunya, P.K.; Mishra, S.K.; Ojha, C.S.P.; Berndtsson, R. Parameter estimation of beta distribution for unit hydrograph derivation. J. Hydrol. Eng. 2004, 9, 325–332. [Google Scholar] [CrossRef]
- Bhunya, P.; Berndtsson, R.; Ojha, C.; Mishra, S. Suitability of Gamma, Chi-square, Weibull, and Beta distributions as synthetic unit hydrographs. J. Hydrol. 2007, 334, 28–38. [Google Scholar] [CrossRef]
- Singh, S.K. Simple Parametric instantaneous unit hydrograph. J. Irrig. Drain. Eng. 2015, 141, 04014066. [Google Scholar] [CrossRef]
- Hao, F.; Sun, M.; Geng, X.; Huang, W.; Ouyang, W. Coupling the Xinanjiang model with geomorphologic instantaneous unit hydrograph for flood forecasting in northeast China. Int. Soil Water Conserv. Res. 2015, 3, 66–76. [Google Scholar] [CrossRef]
- Sulistyowati, A.; Jayadi, R.; Rahardjo, A.P. Unit hydrograph modeling using geomorphological instantaneous unit hydrograph (GIUH) Method. J. Civ. Eng. Forum 2018, 4, 223–232. [Google Scholar] [CrossRef]
- Steinmetz, A.A.; Beskow, S.; Terra, F.d.S.; Nunes, M.C.M.; Vargas, M.M.; Horn, J.F.C. Spatial discretization influence on flood modeling using unit hydrograph theory. Braz. J. Water Resour. 2019, 24, e16. [Google Scholar] [CrossRef]
- Jun, C.; Yoo, C. Relative roles of time–area curve and storage coefficient on the shape of Clark’s instantaneous unit hydrograph: Analytical approach. J. Hydrol. Eng. 2021, 26, 06021001. [Google Scholar] [CrossRef]
- Guo, J. General and analytic unit hydrograph and its applications. J. Hydrol. Eng. 2022, 27, 04021046. [Google Scholar] [CrossRef]
- Guo, J. General unit hydrograph from Chow’s linear theory of hydrologic systems and its applications. J. Hydrol. Eng. 2022, 27, 04022020. [Google Scholar] [CrossRef]
- Liu, T.; Yan, T. Main meteorological disasters in China and their economic losses. J. Nat. Disasters 2011, 20, 90–95. [Google Scholar] [CrossRef]
- Zhang, J.; Wang, Y.; He, R.; Hu, Q.; Song, X. Discussion on the urban flood and waterlogging and causes analysis in China. Adv. Water Sci. 2016, 27, 485–491. [Google Scholar] [CrossRef]
- Ministry of Water Resources of the People’s Republic of China. China Bulletin for Flood and Drought Disaster Prevention in 2021; China Water Power Press: Beijing, China, 2022. (In Chinese) [Google Scholar] [CrossRef]
- Lin, X. Hydrological Records of Zhejiang Province; Zhonghua Book Company: Beijing, China, 2000. [Google Scholar]
- Sun, Y.; Sun, Z. A Frequency-Shift Estimation and Control Method for Extreme Events. Invention CN118469082A. 9 August 2024. Available online: https://kns.cnki.net/kcms2/article/abstract?v=94FxnJrPFCsQudurIP0zFQOSoWPqya6lCxWgLBXWKNjqTXPae2BeC_OUwhL16Em0AzZlnsXDda49duKJAutFizJ5f7TD-WfHppgbmB9OwsqlMK6XBKMr8QHAILohlEziGbIdkuf2Mhcn-7ozJKM61Fz9zwU_BmEusUdSz0VnSYQ6CI228_MTM0Hpe-qrkdzF&uniplatform=NZKPT&language=CHS (accessed on 10 August 2024). (In Chinese).
Disclaimer/Publisher’s Note: The statements, opinions and data contained in all publications are solely those of the individual author(s) and contributor(s) and not of MDPI and/or the editor(s). MDPI and/or the editor(s) disclaim responsibility for any injury to people or property resulting from any ideas, methods, instructions or products referred to in the content. |
© 2025 by the authors. Licensee MDPI, Basel, Switzerland. This article is an open access article distributed under the terms and conditions of the Creative Commons Attribution (CC BY) license (https://creativecommons.org/licenses/by/4.0/).