Article

Xylem Hydraulic Characteristics and Soil Water Content Drive Drought Sensitivity Differences in Afforestation Species

1
State Key Laboratory of Water Resource Protection and Utilization in Coal Mining, Yulin 719315, China
2
Shendong Coal Branch China Shenhua Energy Company Limited, Yulin 719315, China
3
National Energy Investment Group Co., Ltd., Beijing 100011, China
4
State Key Laboratory of Water Resource Protection and Utilization in Coal Mining, National Institute of Low Carbon and Clean Energy, Beijing 102209, China
5
National Institute of Clean-and-Low-Carbon Energy, Beijing 102211, China
*
Author to whom correspondence should be addressed.
Water 2025, 17(16), 2445; https://doi.org/10.3390/w17162445
Submission received: 14 July 2025 / Revised: 31 July 2025 / Accepted: 11 August 2025 / Published: 19 August 2025

Abstract

Drought is a critical factor influencing the distribution of forest species in both present and future global terrestrial ecosystems. Therefore, to investigate the sensitivity of typical afforestation tree species on the Loess Plateau to drought and its influencing factors, we conducted field experiments to measure the sap flow, soil moisture content, fine root density, leaf water potential, and xylem hydraulic characteristics of three deciduous trees: apple (Malus domestica), black locust (Robinia pseudoacacia), and jujube (Ziziphus jujube). We found that the canopy conductance (Gc) of black locust and apple trees was highly sensitive to VPD variations. Their transpiration (T) was also sensitive to soil moisture variation, especially for black locust. In contrast, the Gc and T sensitivity of jujube trees was low. The differences in their drought sensitivities can primarily be attributed to variations in xylem hydraulic conductivity and embolism vulnerability. Our results demonstrate that both mature black locust and apple trees on the Loess Plateau have strong drought sensitivity, especially black locust. Therefore, alterations in precipitation patterns driven by climate change may significantly influence the community distribution of black locusts trees on the Loess Plateau.

1. Introduction

Drought is one of the most common environmental pressures in global terrestrial ecosystems, and it is also a major factor affecting the distribution of forest species [1,2]. According to climate models, even under conservative scenarios, the intensity and frequency of droughts across large swaths of Earth will increase significantly in the coming decades [3]. Given the substantial biomass and carbon storage of forests and their essential ecological functions, enhancing our capacity to predict how forests will respond to future climate change is of paramount importance [4]. The Loess Plateau is home to the world’s largest ecological restoration project, the Grain-for-Green Program (GFGP), which converts farmland back to forests and grasslands [5]. Implementation of this ecological project has significantly mitigated soil erosion and land degradation on the Loess Plateau, enhanced its net primary productivity, improved the fragile regional ecological environment, and made substantial contributions to global “greening” [6]. However, the Loess Plateau exhibits a temperate continental monsoon climate characterized by strong atmospheric evaporation, low and unevenly distributed precipitation, and deep groundwater burial. Drought plays a crucial role in influencing the growth and distribution of trees and shrubs in this region [7,8]. In addition, the conversion of farmland to forests has led to the introduction of a large number of exotic, water-demanding species, causing frequent deep soil water deficits, particularly in arid and semi-arid regions [9,10]. This can result in loss of the drought-mitigating function of deep-rooted trees, which access deep soil water, increasing the risk of drought-induced decline or death of trees. Therefore, to ensure the sustainable development of ecological benefits from the farmland-to-forest project in the Loess Plateau, it is imperative to investigate the drought sensitivity and influencing factors of typical afforestation tree species in the region.
Drought sensitivity is defined as the short-term physiological and morphological responses of plants to drought stress [11]. Since plant gas exchange and water loss are regulated through the stomata, it is crucial for trees to efficiently modulate stomatal apertures under fluctuating meteorological conditions to maintain the equilibrium between photosynthetic carbon assimilation and transpirational water loss [12,13,14]. If the response is excessively delayed during periods of high transpiration demand, this may result in xylem embolism, causing catastrophic hydraulic failure and ultimately leading to shoot or whole-plant mortality. Conversely, an overly sensitive response may reduce photosynthetic yield, leading to stunted tree growth or carbon pool depletion and mortality [15], particularly under prolonged drought conditions [16]. Therefore, given the critical role of stomatal regulation in plant survival under drought conditions, the sensitivity of plants to meteorological drought can be quantified by the rate at which canopy conductance (Gc) or stomatal conductance (gs) decreases as the saturation water vapor pressure deficit (VPD) increases [17]. Canopy conductance (Gc) is a variable that is closely linked to photosynthesis and transpiration, serving as an indicator of species-specific responses to transpiration demand [18]. The sensitivity of canopy conductance to VPD variations differs significantly both within and between species. Additionally, individuals, species, and stands with high canopy conductance or stomatal conductance under low VPD conditions tend to exhibit greater sensitivity to changes in VPD [17]. The sensitivity of canopy conductance to drought is influenced by various physiological structural and functional aspects, including xylem anatomy, water storage capacity, tree size, and leaf habit [18,19,20,21]. Several studies have demonstrated that the sensitivity of canopy conductance to vapor pressure deficit (VPD) is closely linked to xylem hydraulic safety. Specifically, species with higher vulnerability to xylem embolism typically exhibit more pronounced sensitivity to drought conditions [16,19,22]. In addition, the hydraulic conductance of each component of the soil–plant continuum significantly influences stomatal conductance and canopy sensitivity to vapor pressure deficit (VPD). This influence is primarily mediated through its effect on maximum stomatal conductance [23]. Due to differences in leaf biomass, sapwood area, xylem hydraulic conductibility, embolism vulnerability, and water storage capacity between evergreen and deciduous trees, the crown conductibility of evergreen trees is more sensitive to VPD compared to deciduous trees [24]. Tree transpiration is closely linked to canopy conductance and its response to vapor pressure deficit (VPD) [24,25,26]. When conditions are favorable, trees with higher canopy conductance use more water to meet the increased evaporative demand. On the other hand, under drought conditions, trees can decrease whole-plant water consumption by downregulating canopy conductance, serving as an adaptation strategy to prevent hydraulic failure [27,28]. Consequently, the sensitivity of trees to soil drought can be assessed by examining the difference in transpiration rate responses to vapor pressure deficit and light radiation before and after precipitation [29]. In response to meteorological and soil drought stress, trees undergo structural and physiological adjustments to maintain the integrity of their hydraulic system and balance their carbon budget. These adjustments include xerophytic leaf structures, a well-developed root system, stems with high water conductivity and low cavitation risk, endurance of very low water potential, strict stomatal control, and osmotic regulation [30,31,32]. Existing studies indicate that seasonal drought exerts a more pronounced impact on the transpiration of shallow-rooted trees compared to deep-rooted trees [33]. Furthermore, trees that have previously experienced drought exhibit heightened sensitivity to subsequent drought events [34]. Additionally, the drought sensitivity of beech varies across regions with differing climatic drought intensities, with the highest sensitivity observed in the driest areas [35]. Conversely, the sensitivity of stomata to vapor pressure deficit diminishes as soil drought stress intensifies [27]. Consequently, tree drought sensitivity is not only influenced by inherent physiological traits, but also dynamically adjusts according to the growth environment, with variations in both direction and magnitude potentially differing among tree species. Several field investigations and greenhouse experiments have examined the responses of physiological indices, such as photosynthesis, transpiration, and growth rates, in some typical tree species (e.g., black locust) on the Loess Plateau to reduced precipitation or soil drought stress [8,29,36,37,38]. However, studies focusing on the drought sensitivity of these typical tree species in this region remain scarce, and existing studies have yet to thoroughly analyze the underlying factors influencing their sensitivity [29,30].
We selected apple trees in the semi-humid region, black locust trees in the semi-arid region, and jujube trees in the arid region as research subjects on the Loess Plateau. The sap flow of trees, leaf water potential, soil moisture, soil texture, distribution of fine roots, and hydraulic characteristics of the xylem were measured, and the sensitivity of fluid flow to precipitation and the sensitivity of canopy conductance to saturated water vapor pressure difference were analyzed. The objectives of our research are (1) to investigate the differences in drought sensitivity among typical tree species across three distinct climate zones; and (2) to identify the physiological traits and environmental factors influencing drought sensitivity. Our key hypotheses were (1) that drought sensitivity would follow the order: jujube > black locust > apple trees; and (2) that this sensitivity gradient would be governed by the interplay between root-zone water status and xylem hydraulic characteristics.

2. Materials and Methods

2.1. Experimental Location and Materials

The Loess Plateau is situated between 100°54′ and 114°33′ east longitude and 33°43′ and 41°16′ north latitude, covering a total area of 650,000 square kilometers (Figure 1). From southeast to northwest, the climate transitions sequentially through semi-humid, semi-arid, and arid zones. Annual rainfall across the region varies from 200 to 700 mm. This research was carried out in three distinct climatic regions of the Loess Plateau: Changwu (CW) in the semi-humid climate zone, Yan’an (YA) in the semi-arid climate zone, and Zhongwei (ZW) in the arid climate zone. The precise locations are illustrated in Figure 1. Changwu (35°14′ N, 107°41′ E, 1200 m altitude) is characterized by an average annual precipitation of 578 mm, an average temperature of 9.2°C, and a potential evapotranspiration of 893 mm per year. Yan’an (109°25′ N, 36°39′ E, 1200 m altitude) has a multi-year average precipitation of 498 mm, an average temperature of 10.6 °C, and a potential evapotranspiration of 632.7 mm. Zhongwei (105°17′ E, 36°56′ N, 1700 m above sea level) has a multi-year average precipitation of 200.0 mm, an average temperature of 7.5 °C, and an annual potential evapotranspiration of 2725.5 mm. The precipitation in these three study areas is primarily concentrated between July and September, leading to frequent occurrences of seasonal droughts.
The tree species investigated are representative afforestation species in three climate zones: apple trees (CW), black locust trees (YA), and jujube trees (ZW). Basic information regarding the tree characteristics and site features is presented in Table 1. The study areas are entirely rain-fed, with no external water sources for irrigation, and the groundwater levels exceed 50 m. The soil in the study area is predominantly loess. The soil layers in CW and YA are exceptionally deep, whereas the average soil layer thickness in ZW is less than 2 m. The average soil particle size composition in the apple field of CW consisted of 29% sand grains, 51% silt grains, and 20% clay grains. In the black locust field of YA, the composition was 13% sand grains, 64% silt grains, and 23% clay grains. In the jujube tree field of ZW, it was 15% sand grains, 41% silt grains, and 43% clay grains. Detailed soil texture composition information is presented in Figure A1 (See Appendix A).

2.2. Soil Water Content, Texture, and Fine Roots

Determination of soil water content was conducted using the conventional drying method. During the growing season of 2020 (from May to September), the water content in the shallow soil layer (0–5 m) of CW and YA, as well as the entire soil profile (0–1.8 m) of ZW, was measured. Sampling intervals were approximately 30 days. Soil samples at various depths were collected using the soil core sampling method and placed into aluminum boxes. Following measurement of the fresh weight, the soil samples contained in the aluminum boxes were oven-dried at 105 °C to constant weight. The difference in mass before and after drying, which represents the gravimetric soil water content, was measured using an analytical balance with an accuracy of 0.01 g.
The volumetric water content of the soil was calculated by multiplying the mass moisture content by the soil’s bulk density. The soil bulk density for the CW deep profile was measured in December 2019 in farmland adjacent to an apple orchard. This was achieved using a soil extraction machine (Powerprobe 9520, Inc., Irvine, CA, USA) in conjunction with a custom-made circular knife, which has a diameter of 11.6 cm and a length of 60 cm, to collect undisturbed soil samples. Due to the relatively shallow soil depth in the jujube tree land in ZW, the soil bulk density in this region was determined by collecting undisturbed soil samples with a ring knife after manually excavating the soil profile. Soil bulk density is measured by collecting undisturbed samples with a cutting ring, oven-drying at 105 °C to constant weight, and calculating the dry soil mass per unit volume. For the black locust site in YA, located on a slope inaccessible to soil extraction machines, the soil bulk density was estimated using the depth conversion function [39].
Fine root samples were collected using the root drill method. The root drill had a diameter of 10 cm and a length of 20 cm. Fine roots from apple trees, black locust trees, and jujube trees were sampled in November 2020, July 2020, and September 2020, respectively. Three profiles were collected from each sample plot, with a vertical sampling interval distance of 20 cm. The sampling positions were determined at intervals corresponding to 0.5 times, 0.25 times, and 0.1 times the distance between the two nearest trees in the same row. The drilled soil samples were placed into plastic bags, transported to the laboratory, and subsequently passed through a 1 mm sieve to isolate the fine root samples. Additionally, a small amount of root-free soil was collected from the same soil sample, sealed in self-closing bags, air-dried, and sieved through a 2 mm sieve. Soil texture was analyzed using the pipette method or the laser particle size analyzer method. Fine roots (≤2 mm) and coarse roots (>2 mm) were carefully separated using a Vernier caliper and subsequently scanned at a resolution of 300 dpi. The resulting images were analyzed with DELTA-T SCAN image analysis software v2.3 (Delta-T Devices Company, Cambridge, UK). The fine root length density (FRLD) was calculated as the ratio of fine root length to soil volume, expressed as length/Vs, where length represents the total fine root length and Vs denotes the soil volume sampled.

2.3. Leaf Area Index and Leaf Water Potential

The leaf area index (LAI) was measured using an LAI-2200c plant canopy analyzer (Li-Cor, Inc., Lincoln, NE, USA). Measurements were taken on clear, cloudless evenings just before sunset (19:00 to 20:00) to minimize errors caused by direct sunlight. During measurements, the lens is 0.5 m above the ground surface, and the measurement range is 90 degrees. During each period, three measurements were conducted at each observation point. The measurement period spanned from May to September during the growing season, with intervals of approximately 30 days.
The xylem water potential was measured using a Scholander pressure bomb (model 1505D-Exp; PMS Instruments, Albany, OR, USA). Predawn and midday leaf water potentials (ψpd and ψmd) were measured at 4:00–6:00 and 13:00–15:00, respectively. When conducting the measurement, a sunny day was selected. In the field, three to four leaves from the canopy light layer were measured using a pressure chamber to prevent changes in water potential that may result from variations in stomatal opening during transportation.

2.4. Xylem Conductivity and Embolism Vulnerability Curves

The maximum specific hydraulic conductivity of the xylem was measured using a low-pressure liquid flow system [40]. A branch segment with a basal diameter of approximately 6.5 mm was selected, cut underwater to a length of 27.4 cm using a sharp blade, and subsequently connected to the low-pressure liquid flow apparatus. The branches were repeatedly flushed with degassed and filtered 0.01 mol/L KCl solution at a pressure of 0.25 MPa for 5–10 min to eliminate embolisms caused by their natural state and artificially induced during sampling. This process continued until hydraulic conductivity stabilized without further increase. This hydraulic conductivity was then used to calculate the specific conductivity, accounting for branch length and basal diameter.
A four-cuvette long rotor (28 cm) Cochard centrifuge was employed to determine the vulnerability curves of branches that had been rinsed with a 0.01 mol L−1 KCl solution under 150 kPa pressure [41]. To prevent air from entering the large vessels, the stems were maintained in a horizontal position while transferring them from the water bath for attachment to the apparatus. Maximum conductivity (Kmax) was measured at a low spin rate, which induces minimal or no embolism formation. As the spin rate increases, stem tension (P) rises and hydraulic conductivity (Kh) decreases accordingly. The percentage loss of conductivity (PLC) was calculated based on Kmax values. Kh was repeatedly measured with incremental pressure steps of 0.2–0.3 MPa until the PLC reached at least 98%. The vulnerability curve for each sample group was derived by fitting a single Weibull function to the mean measured values of six branches at each pressure level. PLC can be computed and fitted as follows:
P L C = 100 × 1 K h K m a x
P L C = 100 1 + e x p α P P 50
where P is the corresponding xylem water potential (MPa), α is the curve shape parameter, and P50 is the xylem water potential when the hydraulic conductivity is reduced to 50% of Kmax.
The xylem vulnerability curve of black locust trees was generated using the bench-top dehydration method. Sample shoots were collected in the early morning, prior to sunrise, and subsequently dehydrated on a laboratory bench to determine both the percentage loss of conductivity (PLC) and the corresponding xylem tension. To ensure equilibration of water potential between the xylem and leaves, the measured shoot was enclosed in a black plastic bag once the desired xylem tension was achieved. Following a minimum equilibration period of 1 h, three leaves were carefully excised from the wrapped shoots. The equilibrated leaf water potential was then measured using a pressure chamber (model 1505D; PMS Instruments, Albany, OR, USA). Immediately after excising the leaves, PLC due to embolism was assessed in three 10 cm long stem segments. The xylem vulnerability curve was constructed by fitting a single Weibull function (Equation (2)).

2.5. Sap Flow and Meteorological Data

Hourly-scale data of precipitation, temperature, solar radiation, and air relative humidity for the apple trees and black locust trees were obtained from the meteorological stations of the CW Agricultural Ecosystem National Field Scientific Observation Station and the Ansai Agricultural Ecosystem National Field Scientific Observation Station, respectively, which are located near the experimental sites. The meteorological data for the jujube tree site were acquired from the meteorological observation station at the Agricultural Research Station of Ningxia University.
The sap flow in the trunk was measured using a thermal diffusion probe (TDP) during the growing season from May to September 2020. The TDP probe was installed at a height of approximately 0.8 m above ground level on the north side of the tree trunk, with a penetration depth of 1 cm. After installation, the probe was insulated with a 2 cm thick anti-radiation film to minimize external interference. The collected data were recorded using a data logger CR1000 (Campbell Scientific, Logan, UT, USA) every 10 min. The sap flow (FD, cm day−1) was calculated based on the temperature difference between the two probes, following the methodology described by Equation (3):
F D = 0.0119 × Δ T m Δ T Δ T × 3600
where ΔT represents the real-time temperature difference between the two probes in degrees Celsius (°C), while ΔTm denotes the maximum temperature difference between the two probes. In this study, the average temperature difference between 2:00 and 5:00 was defined as the maximum temperature difference.

2.6. Data Analysis

Canopy conductance (Gc) was determined by transpiration (EL). The estimation of transpiration per unit leaf area was based on Equation (4):
G c = ( G V T A ρ E L ) / D
where G V is the universal gas constant for water vapor (0.462 m3 kPa−1 K−1 kg−1), TA is the air temperature in Kelvin (K), ρ is the density of liquid water (998 kg/m3), and VPD is the vapor pressure deficit (kPa). We estimated E L using the sap flow density (JS) of each tree and the ratio of sapwood area to leaf area (AS:AL).
The sensitivity of the canopy to VPD is quantified by fitting the data to a functional relationship (5):
G c = b m l n D
The slope of the curve ( m d G c / l n D ) indicates sensitivity, while the intercept (b) corresponds to Gc at D = 1 kPa, also referred to as Gcref.
This study focused on comparing the transpiration rates of different tree species before and after rainfall. The transpiration of the tree was calculated by proportionally scaling up (multiplying) the average Fd value and the sapwood area. When analyzing transpiration characteristics rather than absolute water consumption, this method is deemed reasonable, because the Fd value correlates with the overall water consumption of the tree. Additionally, normalized Fd data were utilized to minimize variability among replicates as much as possible. Normalization was achieved by dividing all Fd values for each replicate tree by the maximum Fd value recorded over the past three months. Consequently, when the maximum normalized Fd for each replicate individual equals 1.0, the average intraspecific repeats can be calculated.
The sensitivity of tree transpiration to soil drought was quantified by analyzing the relationship between the standardized liquid flow (Fd) before and after precipitation and the coupling variable VT, which integrates the saturated water vapor pressure deficit D and the light radiation RS. Because the saturated water vapor pressure difference (VPD) and solar radiation (RS) are the primary drivers of tree transpiration, even during short-term droughts [42], VPD was calculated using 1 h average temperature and relative humidity. Vapor transport (VT) was estimated as a simplified function combining VPD and RS [29]. This approach is justified, because VPD typically accounts for more than two-thirds of total transpiration, making it the dominant environmental variable, while the remaining contribution originates from the radiation component [43].
V T = V P D × R S 1 2
where VPD and RS represent the saturated water vapor pressure difference (kPa) and solar radiation intensity (W m−2 s−1), respectively.
Previous researchers often utilized the following exponential saturation function to examine the relationship between liquid flux and VT:
N F D = a ( 1 exp b V T )
where NFD represents the standardized sap flow, VT serves as the coupling variable between RS and VPD, and a and b denote the fitting parameters. The variations in the fitted parameters a and b across datasets reflect differences in sensitivity.
Statistical analysis was performed on the NFD and RS datasets before and after multiple precipitation events during the growing season to investigate differences in the sensitivity of tree transpiration to soil drought. To minimize potential hysteresis effects between sap flow and environmental factors, only datasets collected in the morning were utilized for each analysis. Datasets collected after the noon peaks of each environmental factor were excluded from consideration.

3. Results

3.1. Sensitivity of Canopy Conductance to VPD and Response of Sap Flow to Precipitation

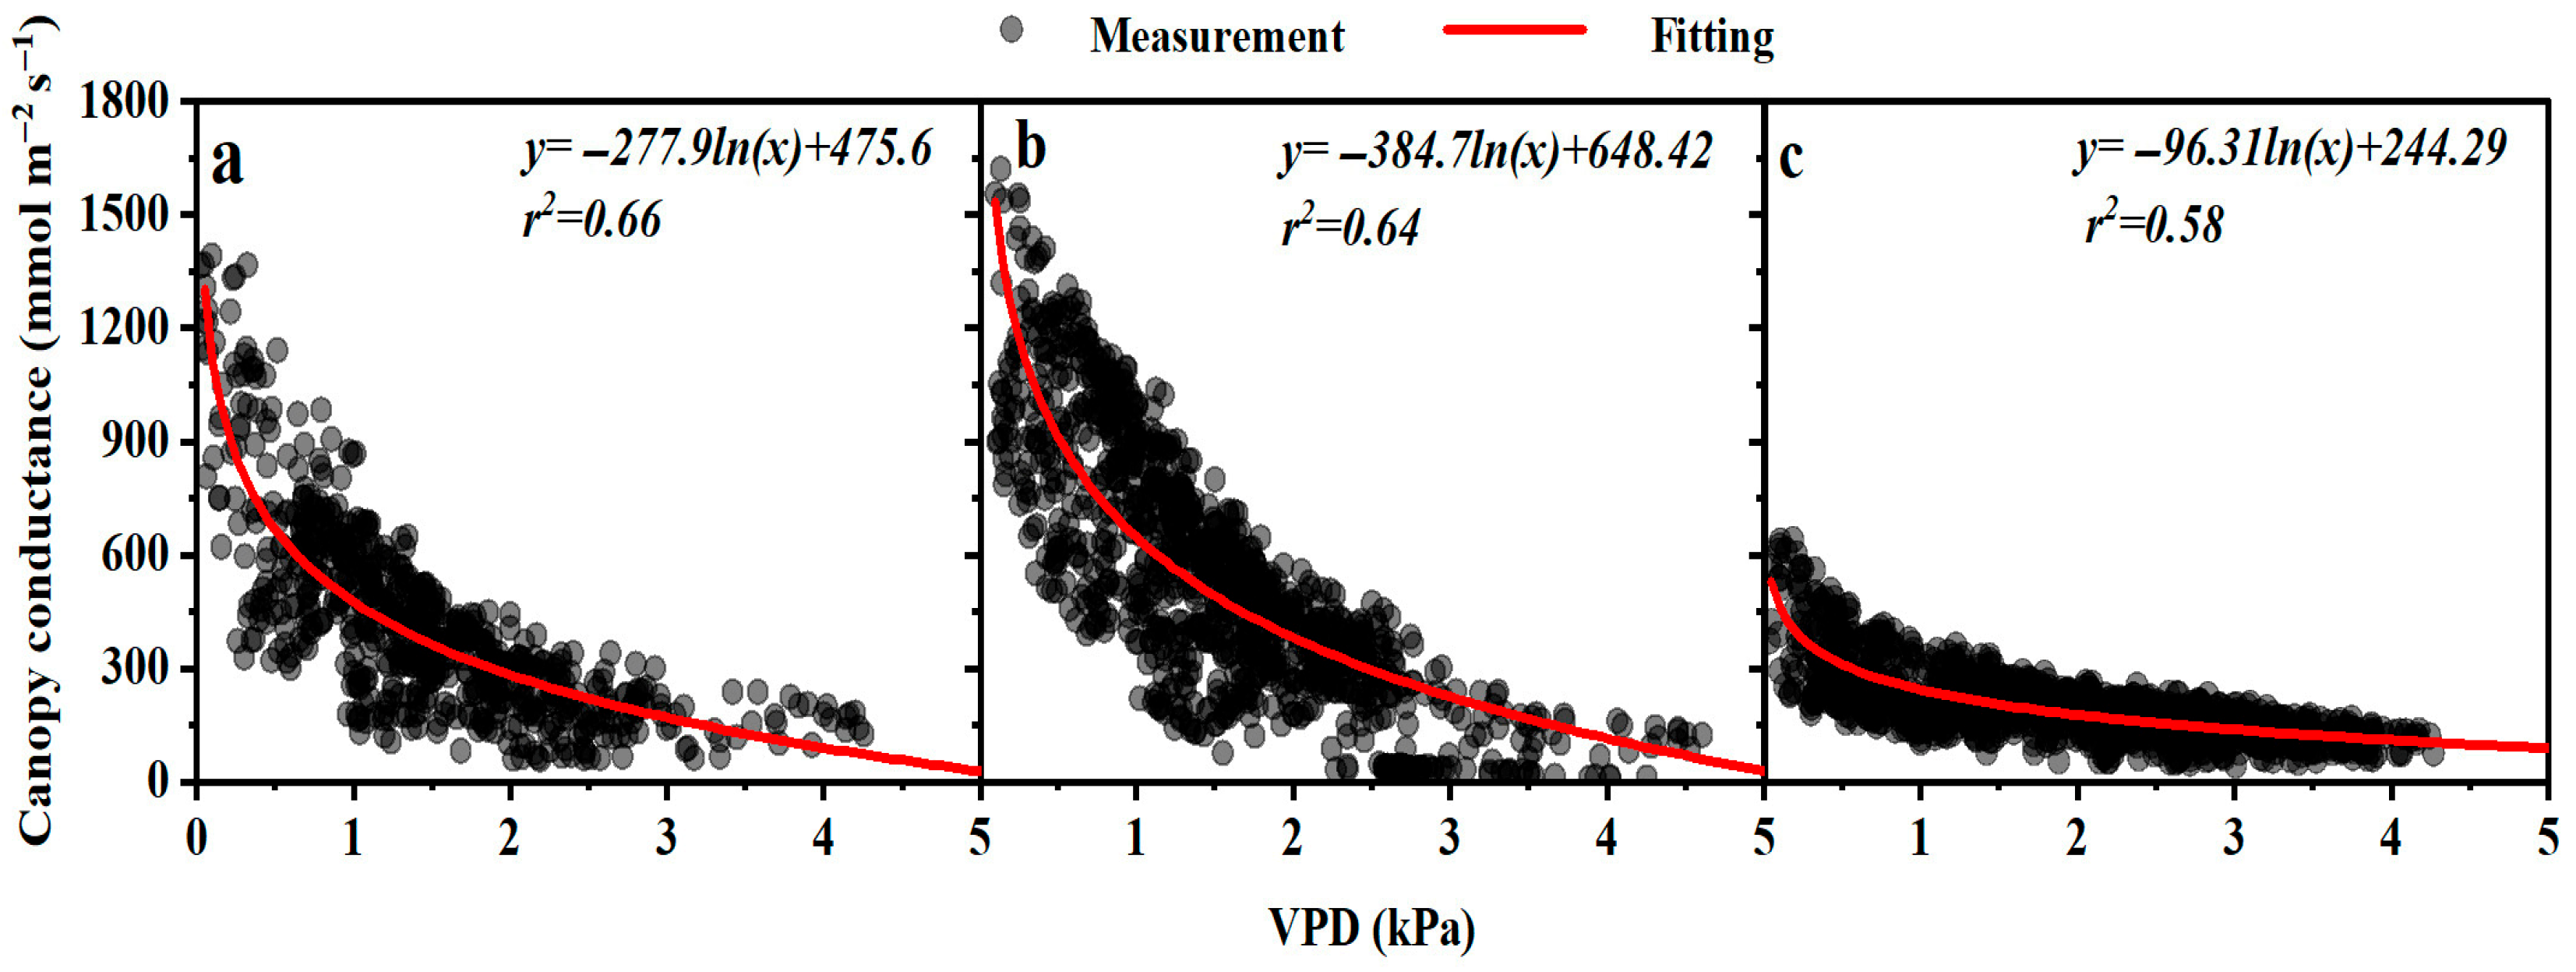
The reference canopy conductivity (Gcref) of jujube trees, black locust trees, and apple trees was 244.29, 648.42, and 475.6 (Figure 2), respectively, when the vapor pressure deficit (VPD) was 1 kPa. Additionally, the sensitivity index (m) of Gcref to VPD for these species was −96.31, −384.7, and −277.9, respectively. This result suggests that, under low VPD conditions, the canopy conductance of black locust trees was the highest, followed by apple trees, while jujube trees exhibit the lowest canopy conductance.
It is worth noting that the canopy conductance of black locust trees is most sensitive to changes in VPD, followed by apple trees, while jujube trees exhibit the least sensitivity. In other words, sensitivity increases with higher reference conductance values. The parameters representing the water strategy of plants (−m/Gcref) are 0.40, 0.59, and 0.59, respectively.
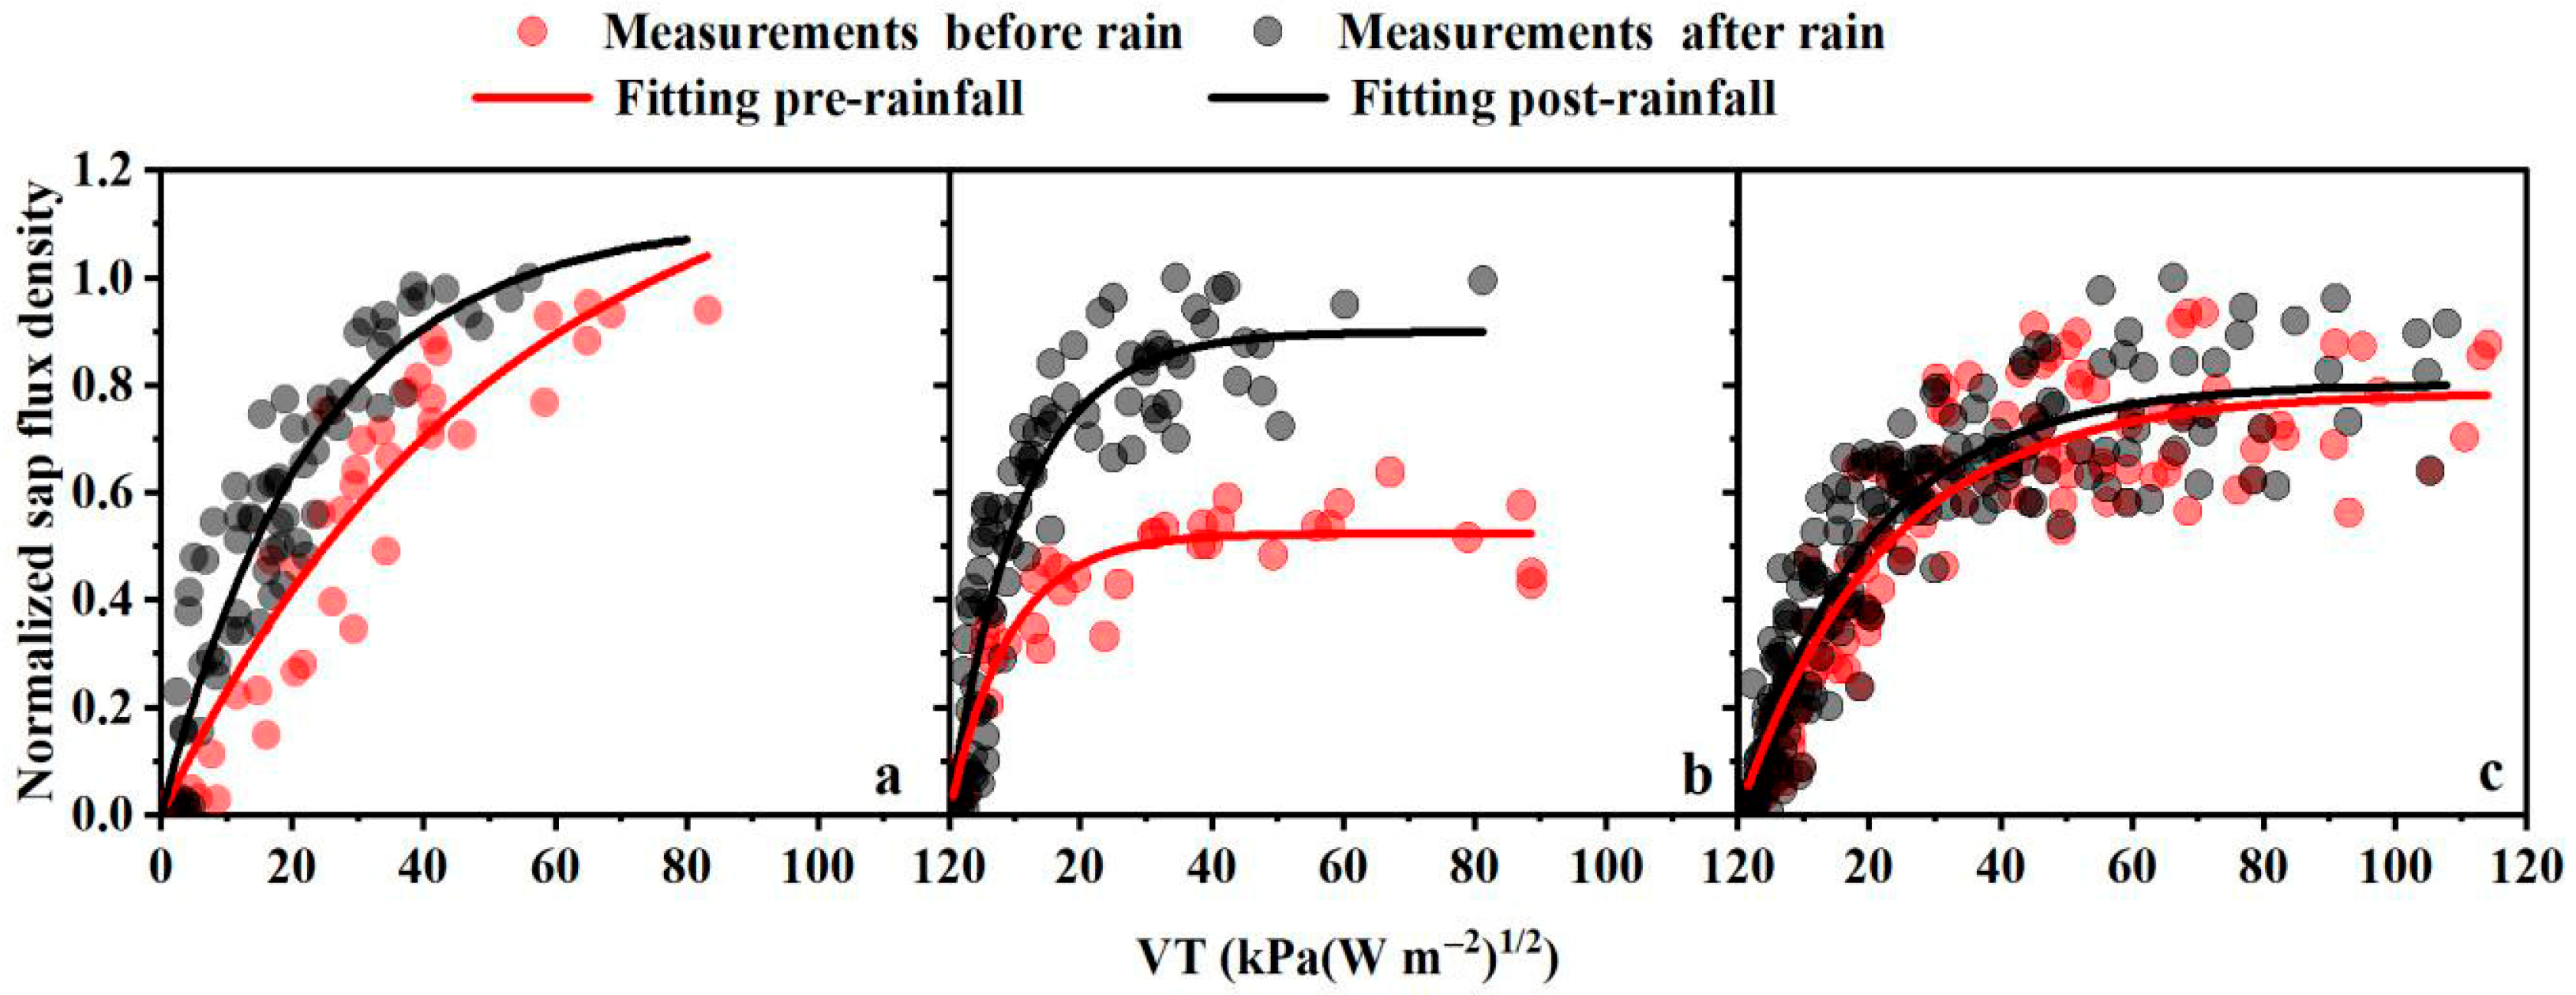
The standardized sap flow rates (NFDs) of CW apple trees, YA acacia trees, and ZW jujube trees exhibited distinct variations before and after rainfall in response to changes in VT (the composite function of solar radiation and saturated vapor pressure deficit) (Figure 3). This indicates that rainfall increased the sap flow rates across all species. However, the magnitudes of the sap flow rate responses to precipitation among the three tree species were contrary to expectations. Specifically, the semi-arid region’s black locust trees showed the strongest response, whereas the arid region’s jujube trees exhibited the weakest response (Table 2).

3.2. Soil Water Content and Physiological Characteristics in the Rhizosphere

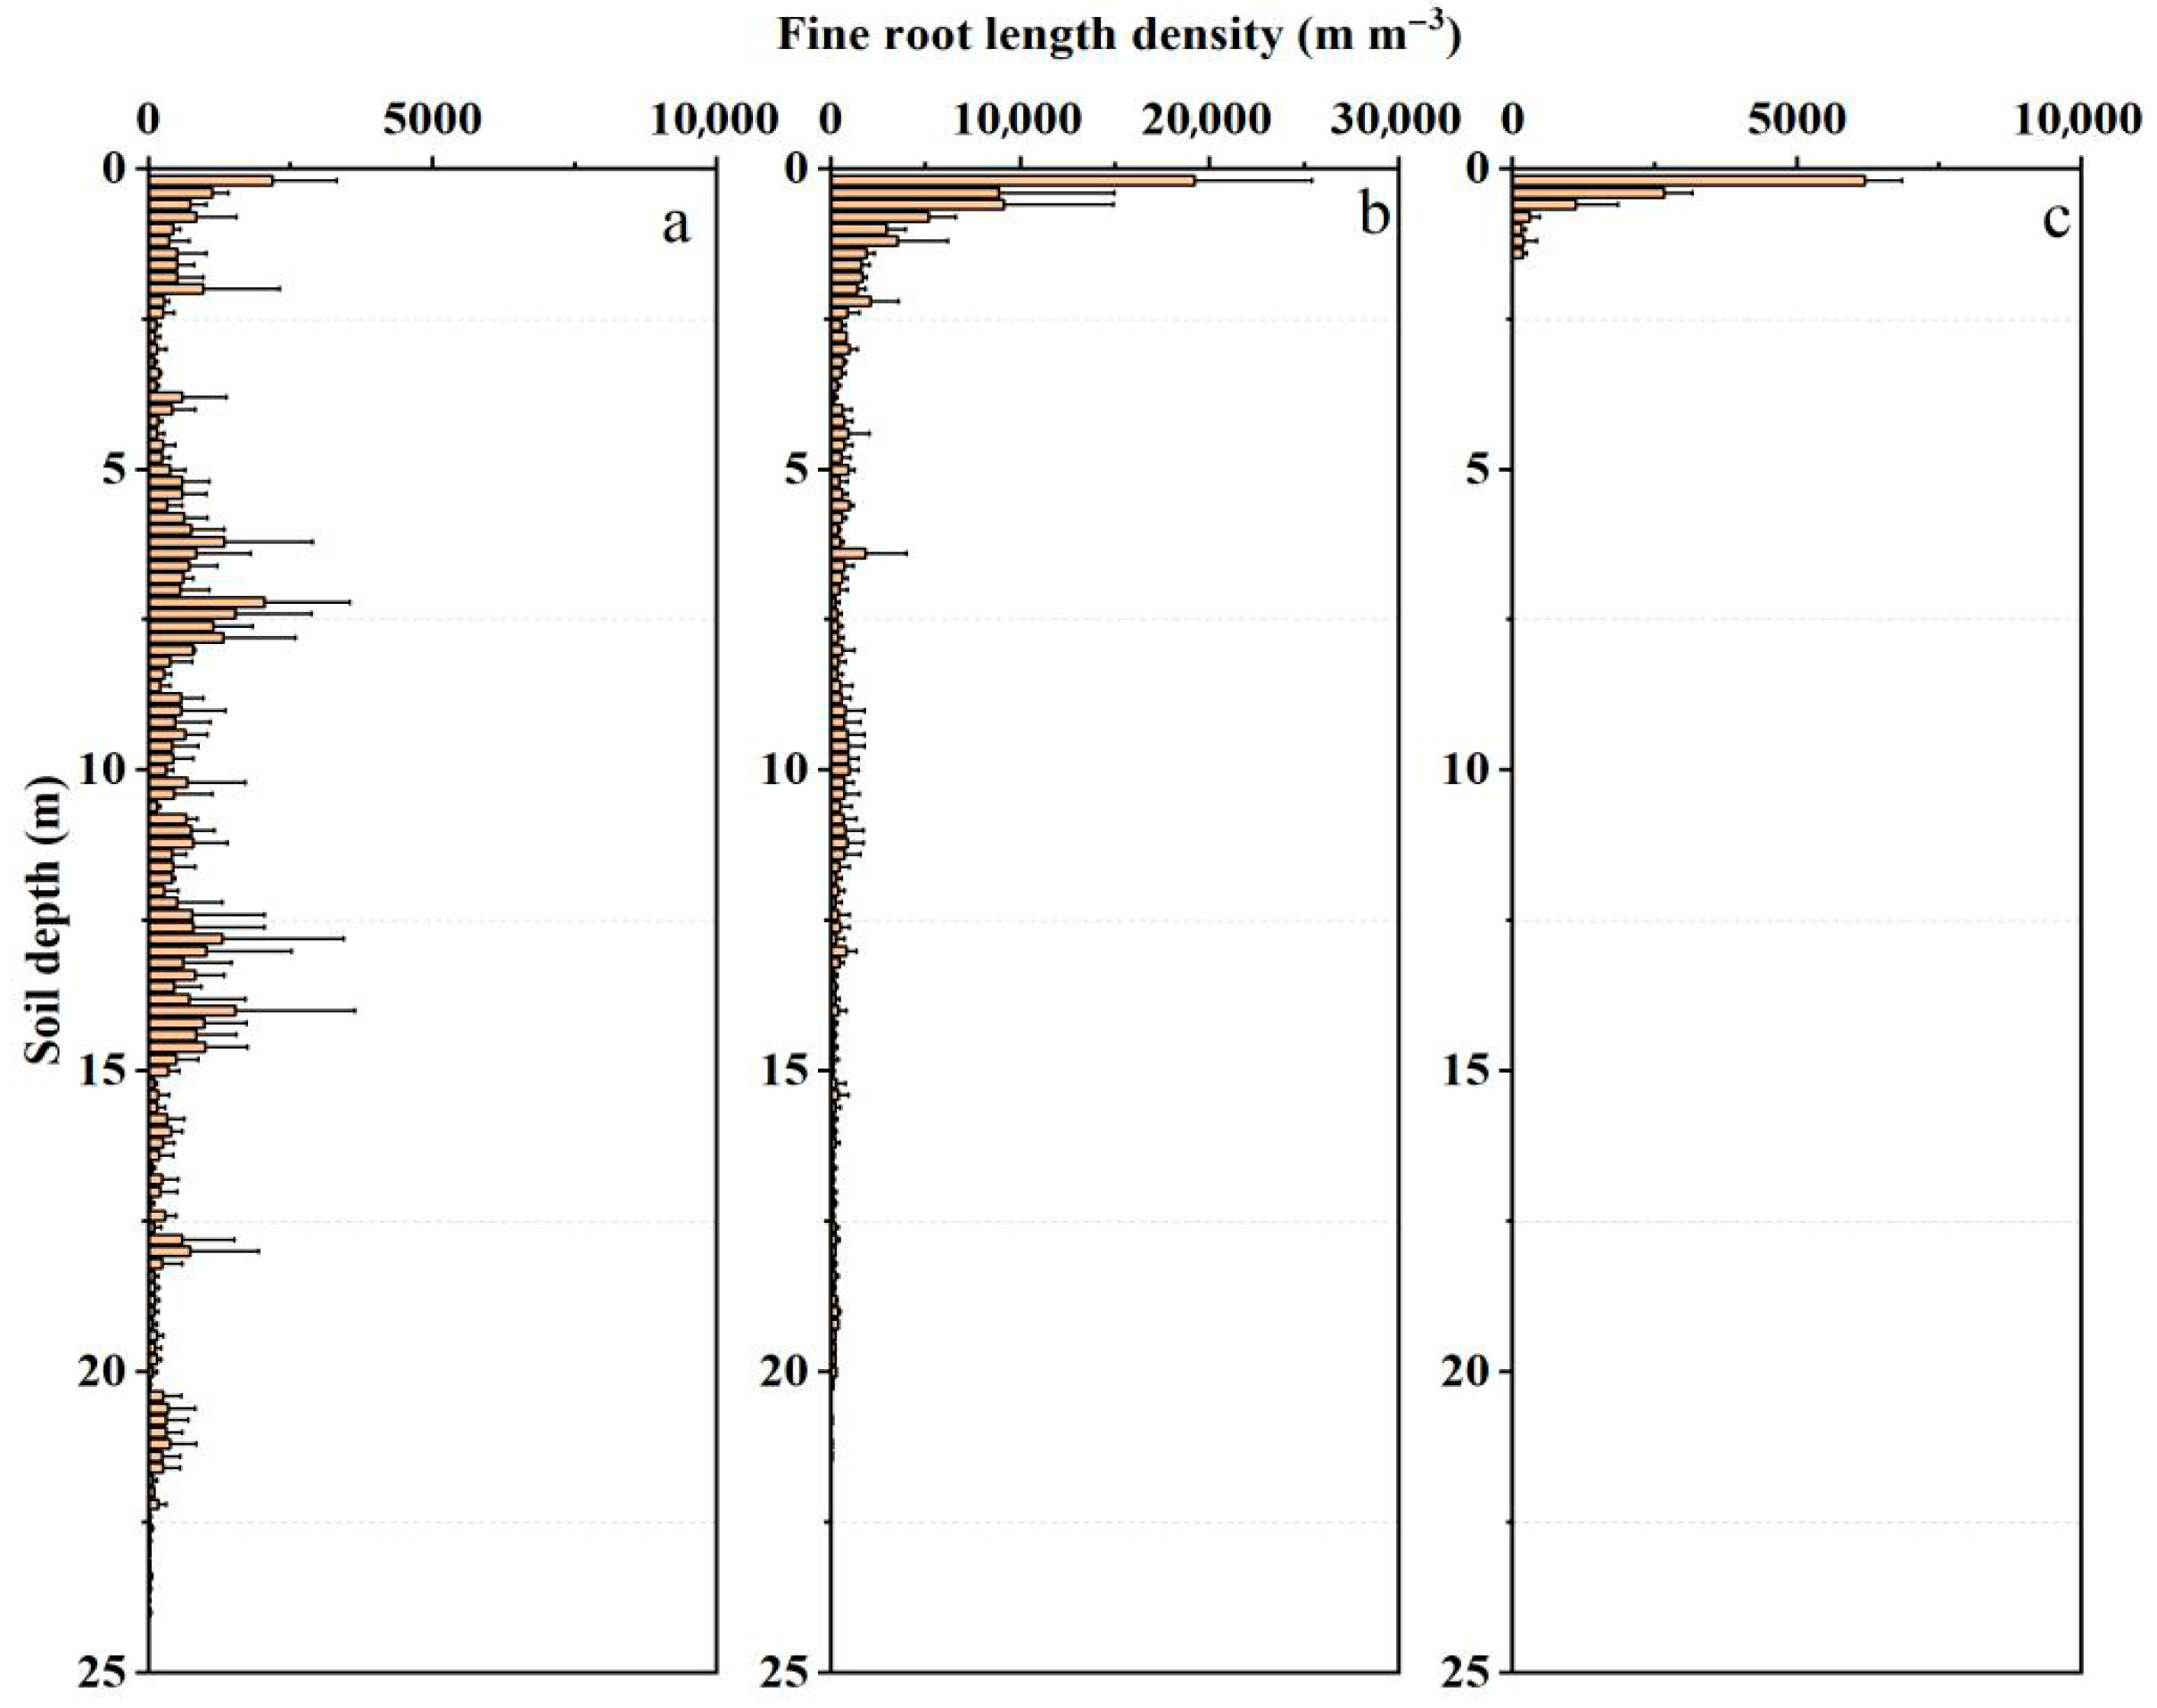
The root distribution of tree species varies significantly across the three study areas. Specifically, the maximum root depths of apple trees and locust trees were 22.8 m and 22.6 m, respectively, whereas the maximum root depth of jujube trees was only 1.4 m (Figure 4). Within the 0–20 cm surface layer, the fine root density followed the order: black locust tree (24,307 m m−3) > jujube tree (6193 m m−3) > apple tree (2179 m m−3).
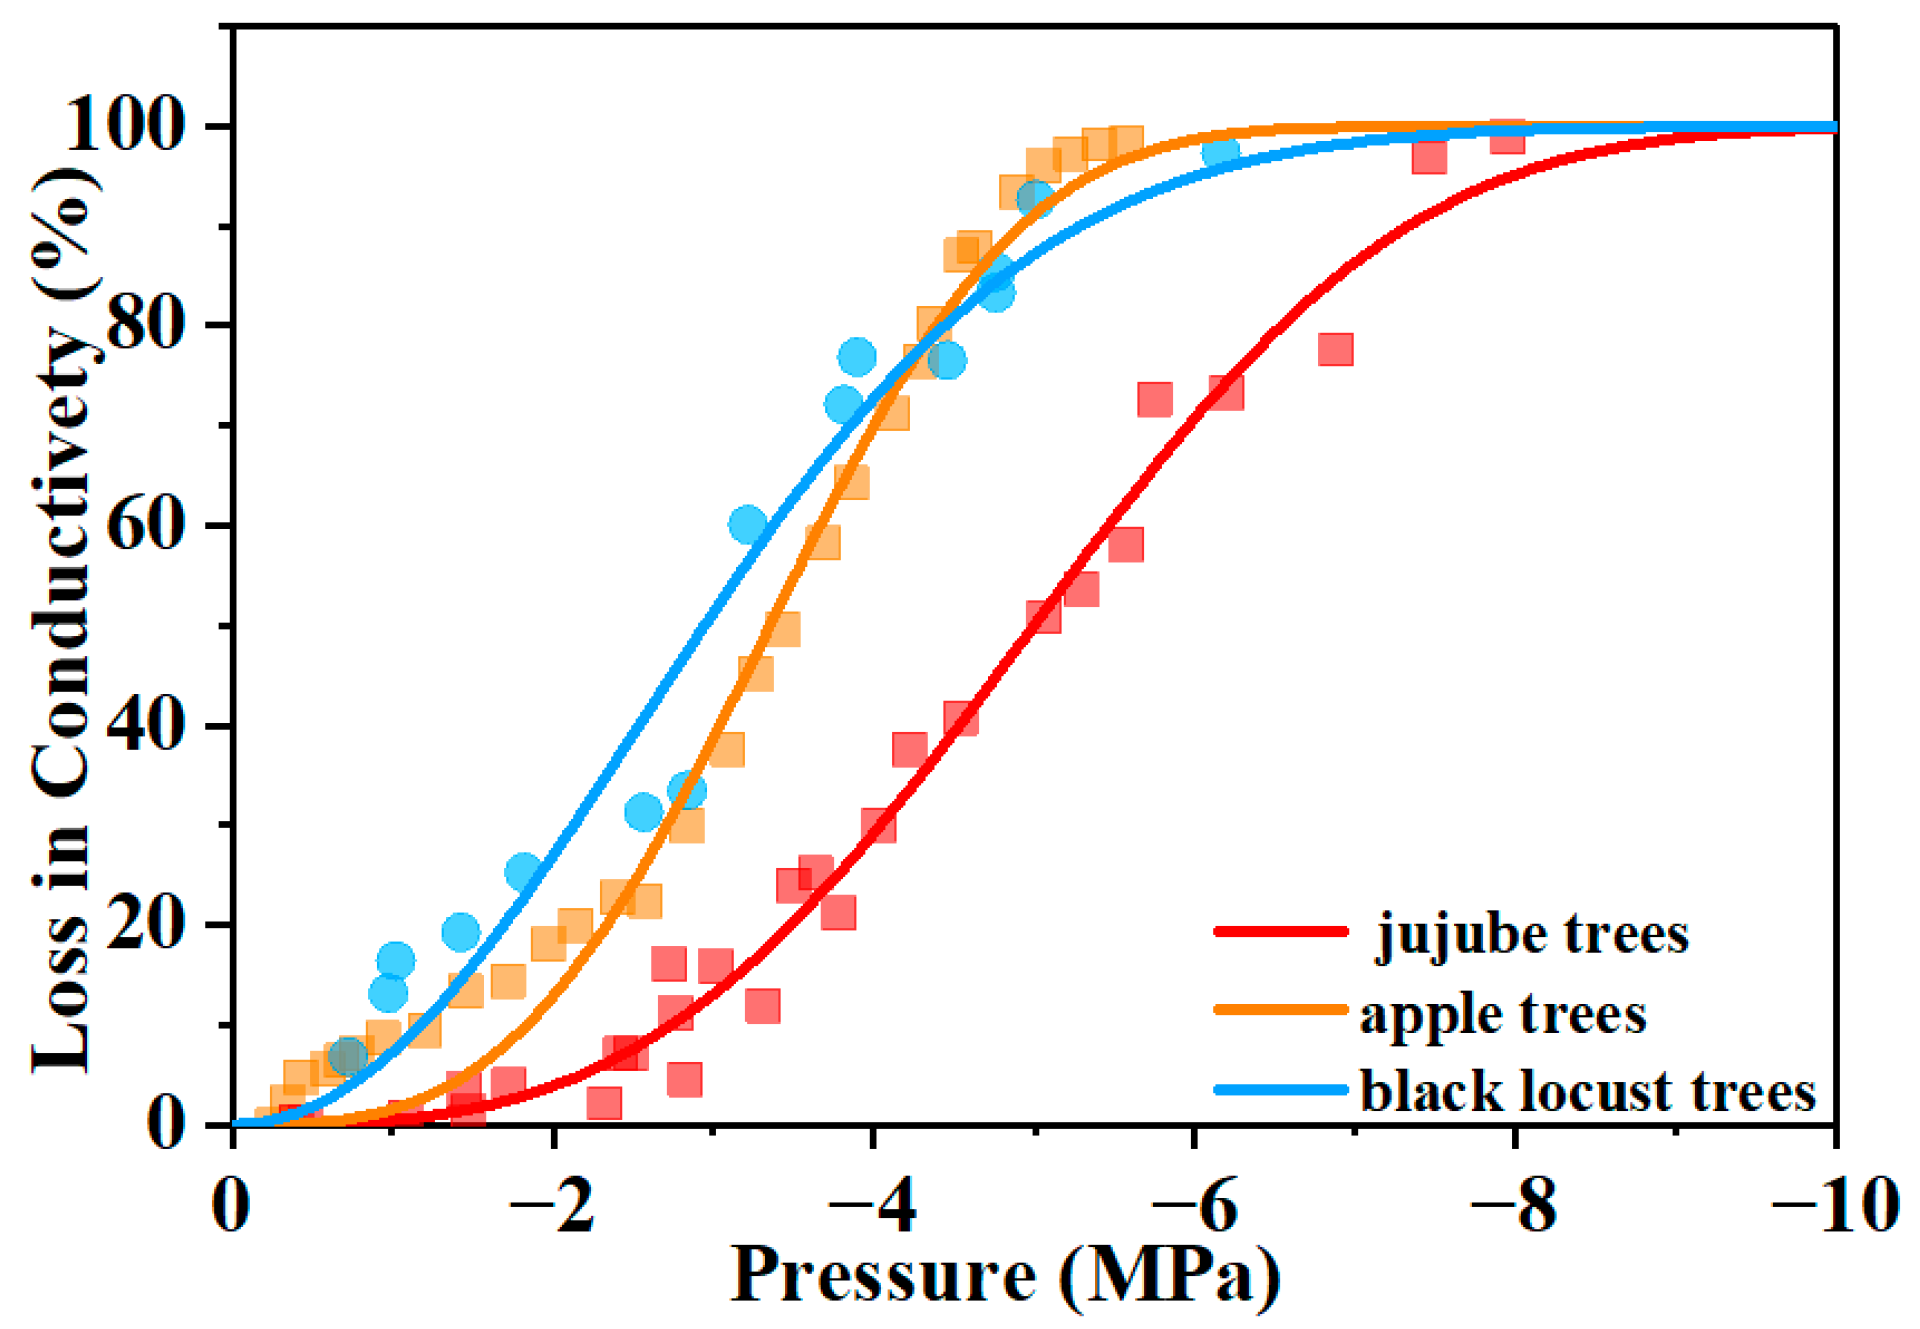
According to the embolization vulnerability curves of apple trees, black locust trees, and jujube trees, the water potential (P12) at which xylem conductivity begins to decline due to embolism is −1.99 ± 0.18, −1.30 ± 0.34, and −2.95 MPa (Figure 5), respectively. The water potential (P50) corresponding to a 50% loss of xylem conductivity is −3.39 ± 0.14, −2.95 ± 0.34, and −4.95 MPa, respectively. The water potentials (P88) indicating near-complete xylem embolization are −4.82 ± 0.15, −5.10 ± 0.34, and −7.05 MPa, respectively (Figure 5). This result suggests that apple trees and locust trees exhibit similar embolism vulnerability, and both are significantly more sensitive to embolism than jujube trees. The specific hydraulic conductivities (Ks) of the xylem of apple trees, black locust trees, and jujube trees were 1.47 ± 0.34, 7.75 ± 1.77, and 0.03 ± 0.01 kg m−1 Mpa−1 s−1, respectively (Table 3). This suggests that the hydraulic transport efficiencies of the xylem of acacia and apple trees are much higher than that of jujube trees.
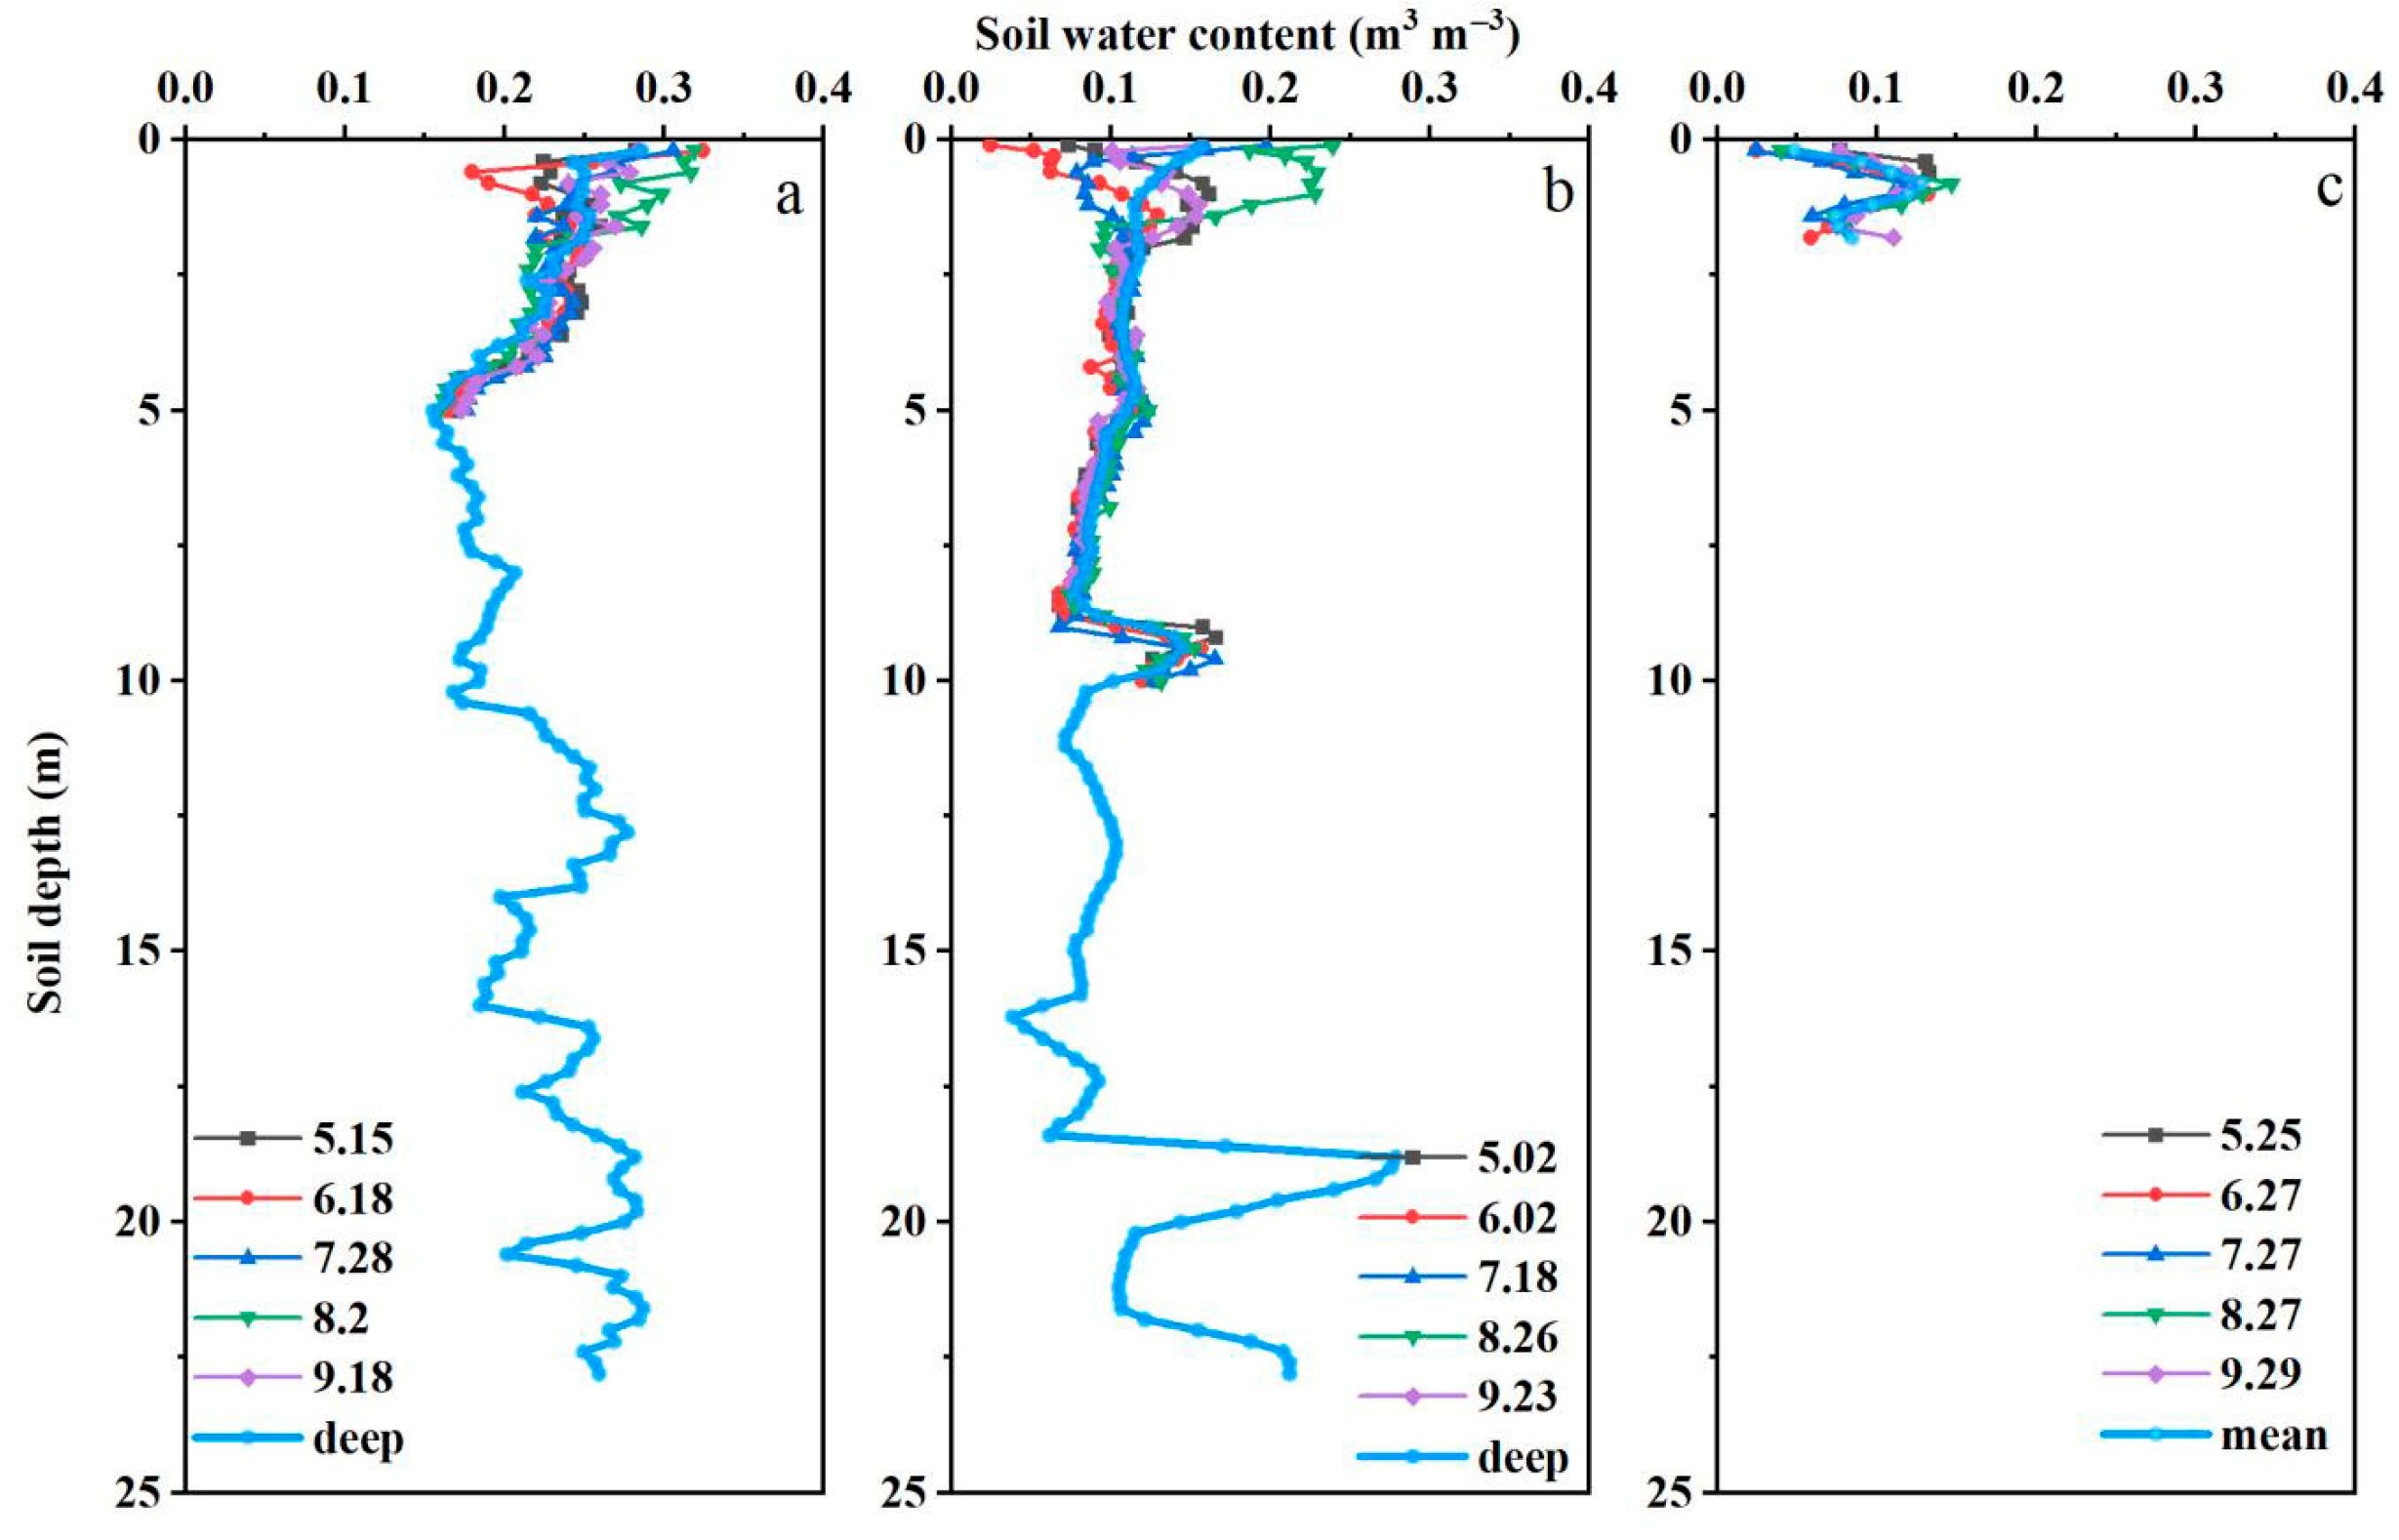
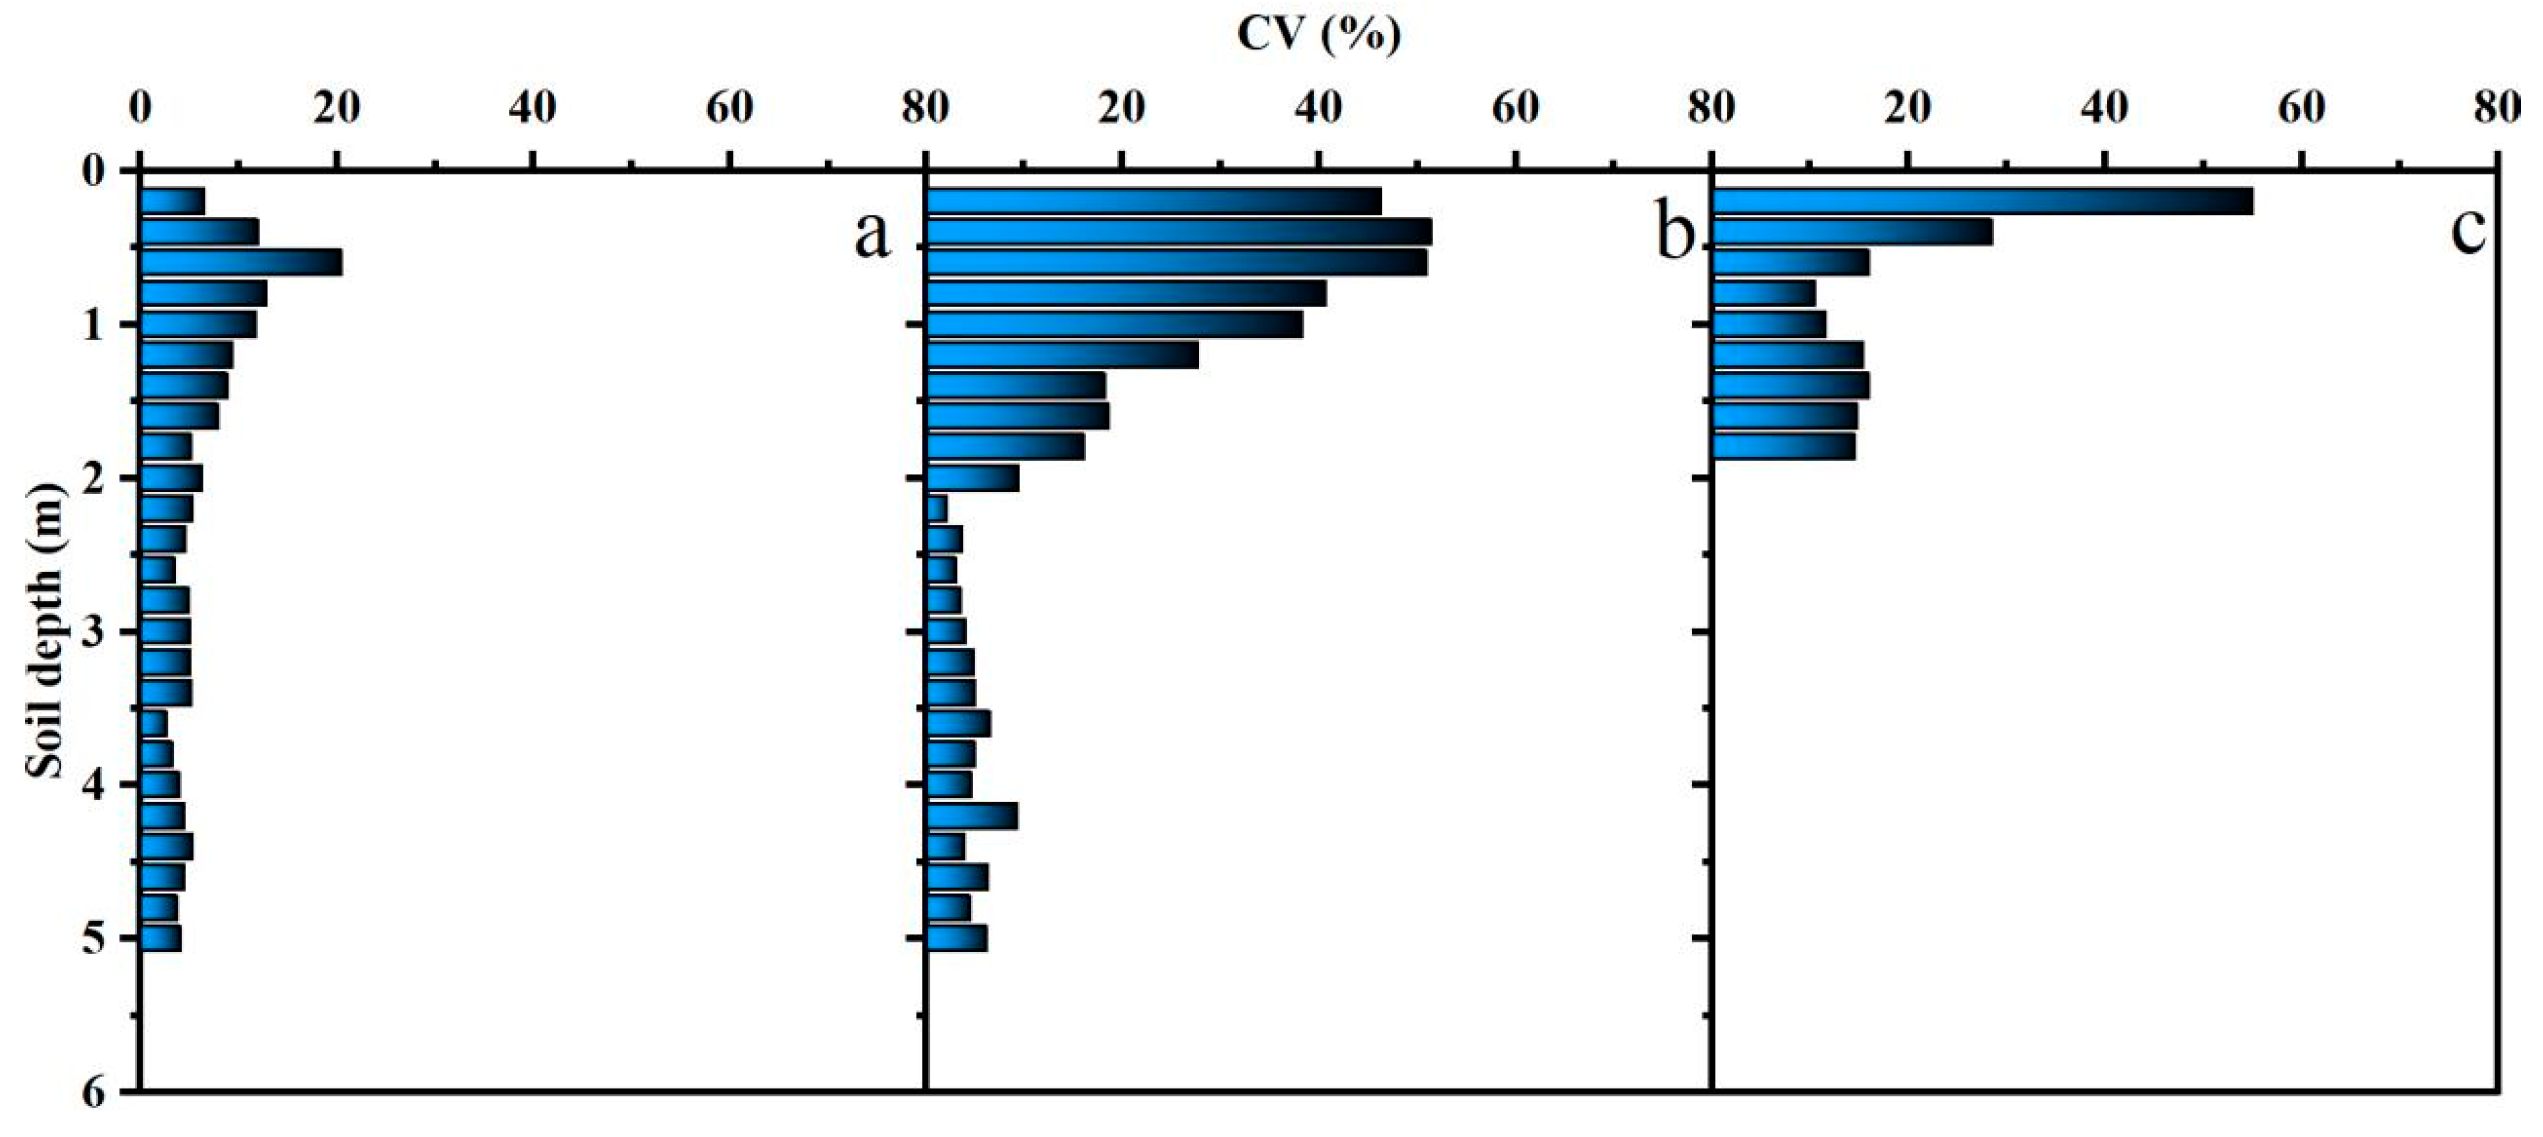
During the growing season of 2020, the water content of the shallow soil of the three tree species changed significantly from May to September, while the water content of the deep soil changed very little and remained almost unchanged (Figure 6). Specifically, in the acacia fields of YA, the coefficient of variation [43] of soil water content within the 0–2 m layer ranged between 10% and 64%, while the CV values for soil layers below 2 m were consistently less than 10%. In the CW apple orchard, the CV of soil water content from 0 to 1 m was between 10% and 20%, and the CV values for soil layers below 1 m were all below 10%. For the ZW jujube trees, the CV of soil water content across the entire profile (0–1.8 m) was greater than or equal to 10%, with a range of 10% to 55% (Figure 7).
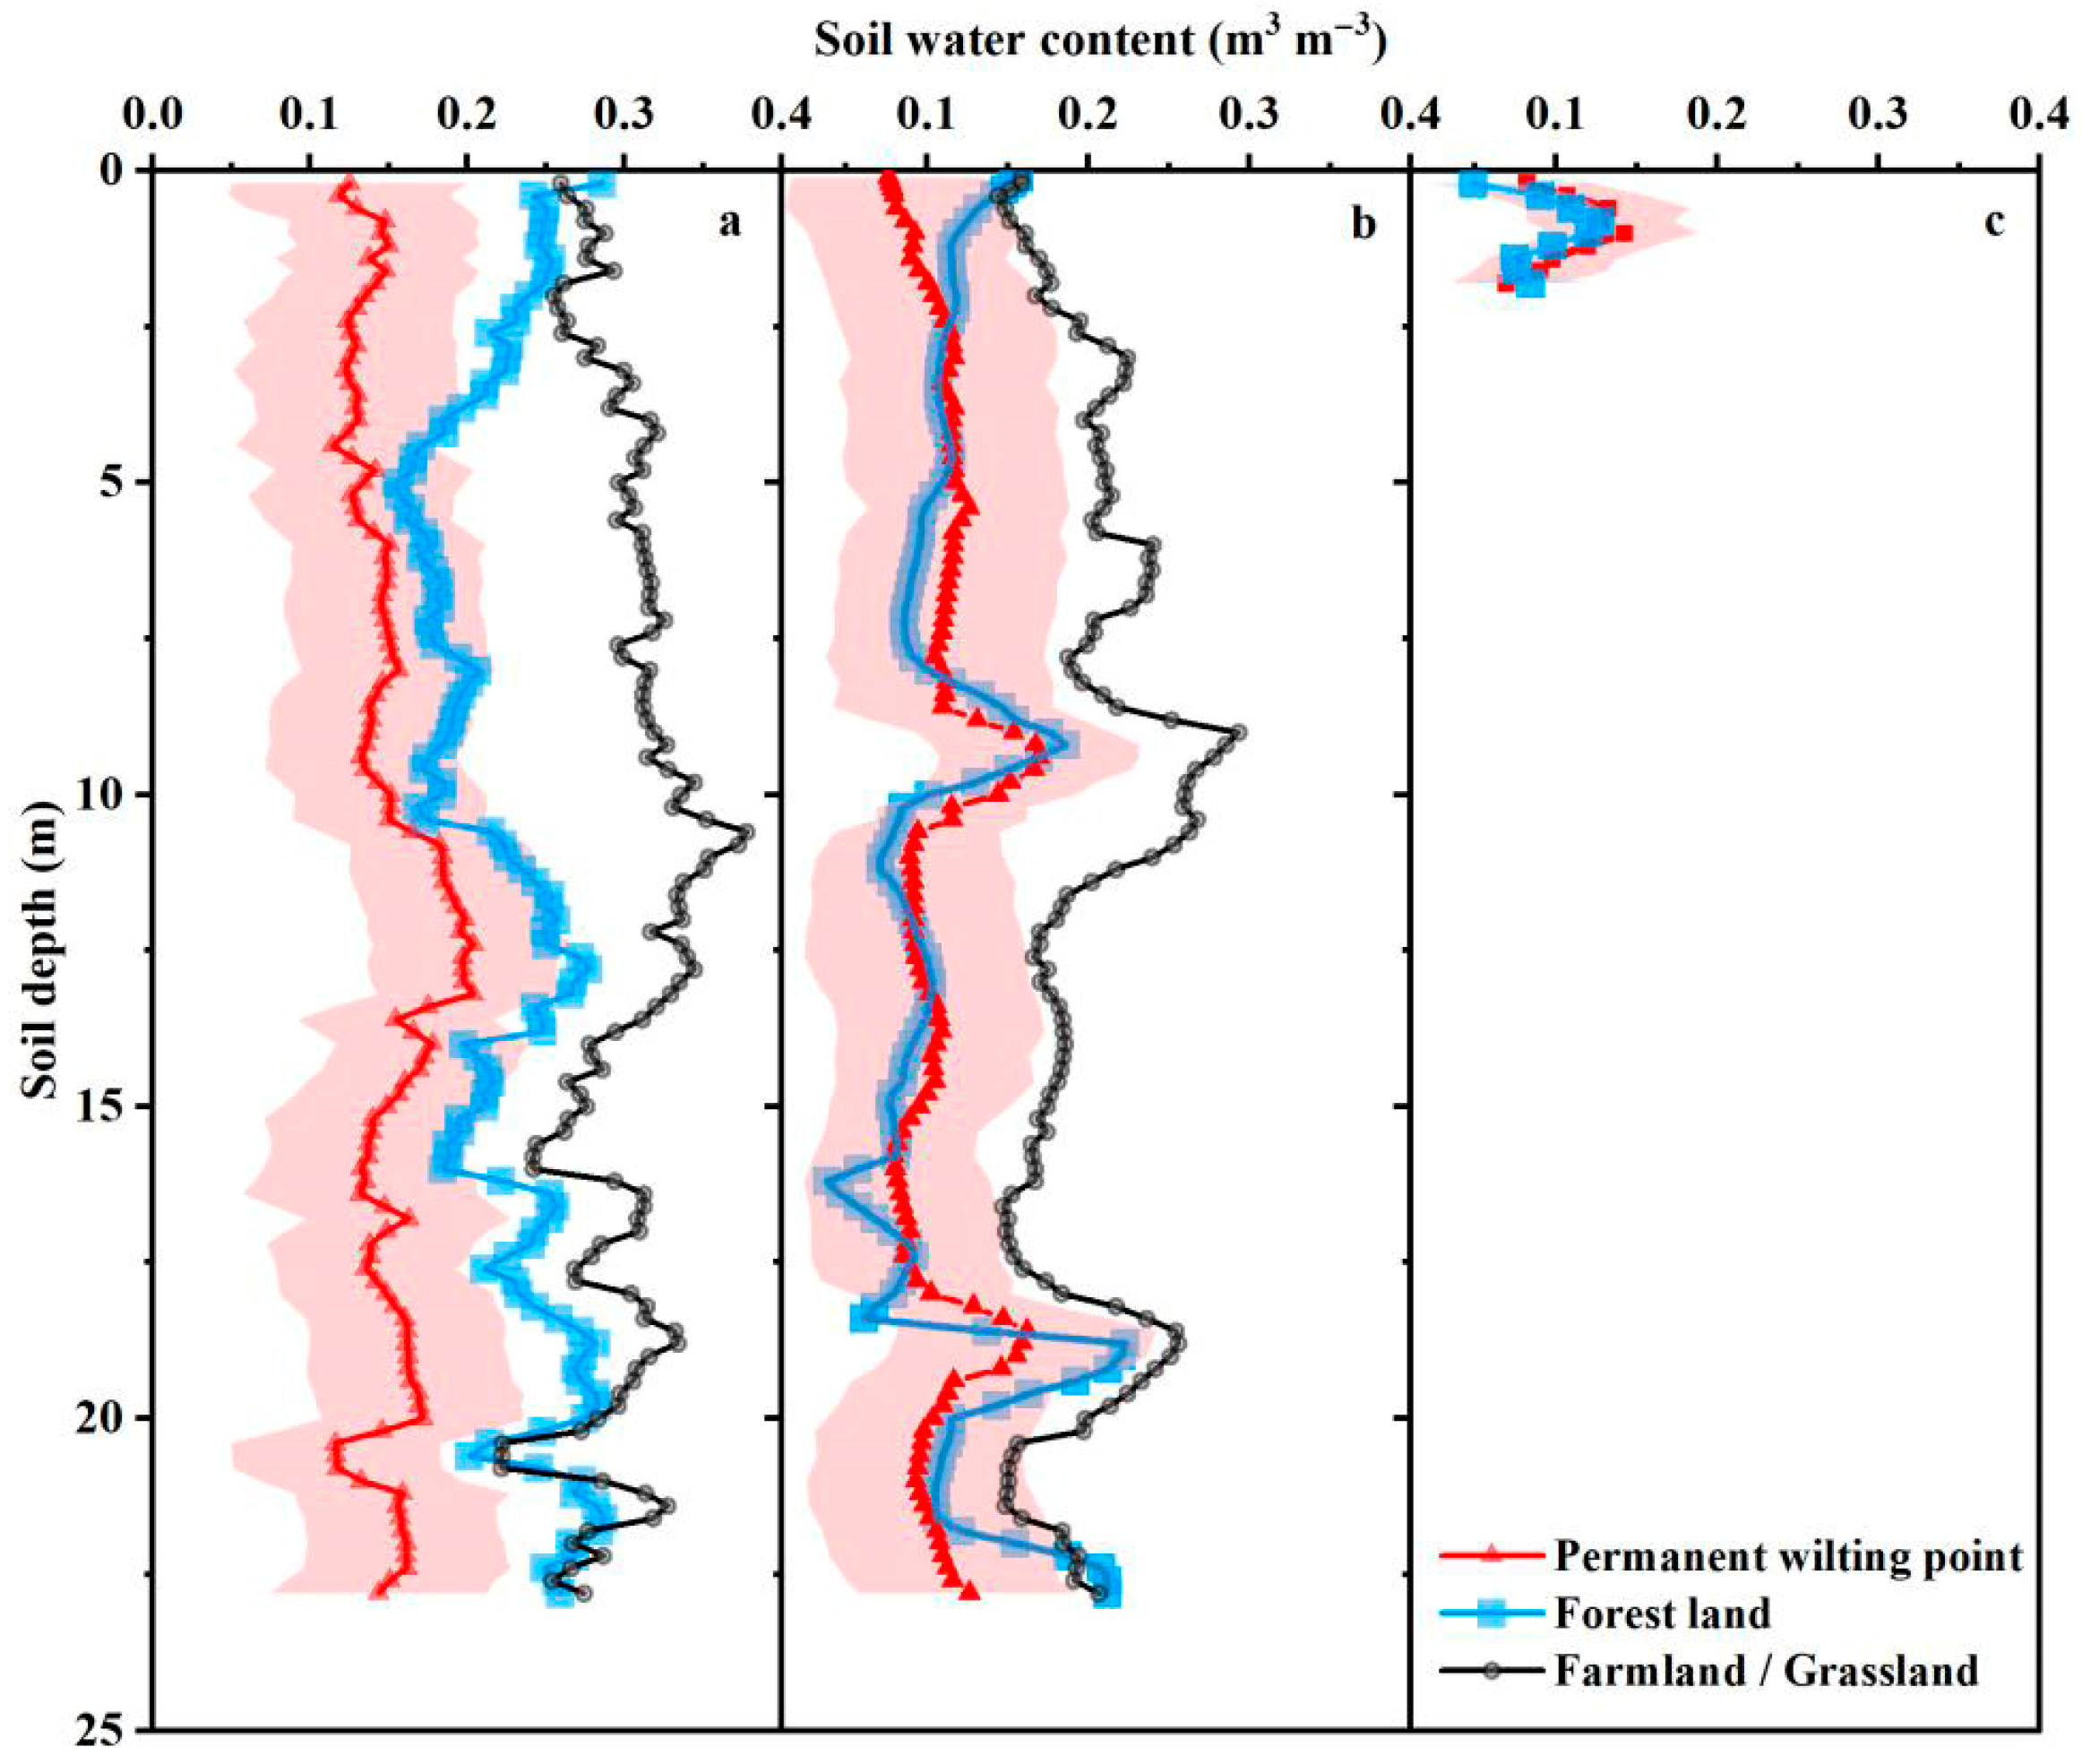
The average soil wilting water content in the root zones of the CW apple orchard, YA acacia plantation, and ZW jujube tree field were 0.14 m3/m3, 0.11 m3/m3, and 0.11 m3/m3, respectively. This result was derived through the application of multiple soil transformation functions. By comparing the soil water content of the current three study areas with the calculated soil withering water content, it is evident that the soil water content for CW apple trees at depths of 0–4.4 m and 16.2–22.8 m exceeds the withering water content, whereas the content at depths of 4.6–16.0 m is nearly equal to the withering water content. For YA acacia and ZW jujube trees, the soil water content across all measured sections remains largely close to the withering water content (Figure 8). The available deep soil water volume for apple trees (below 1 m) is approximately 0.07 m3/m3, while that for black locust trees (below 2 m) approaches zero.
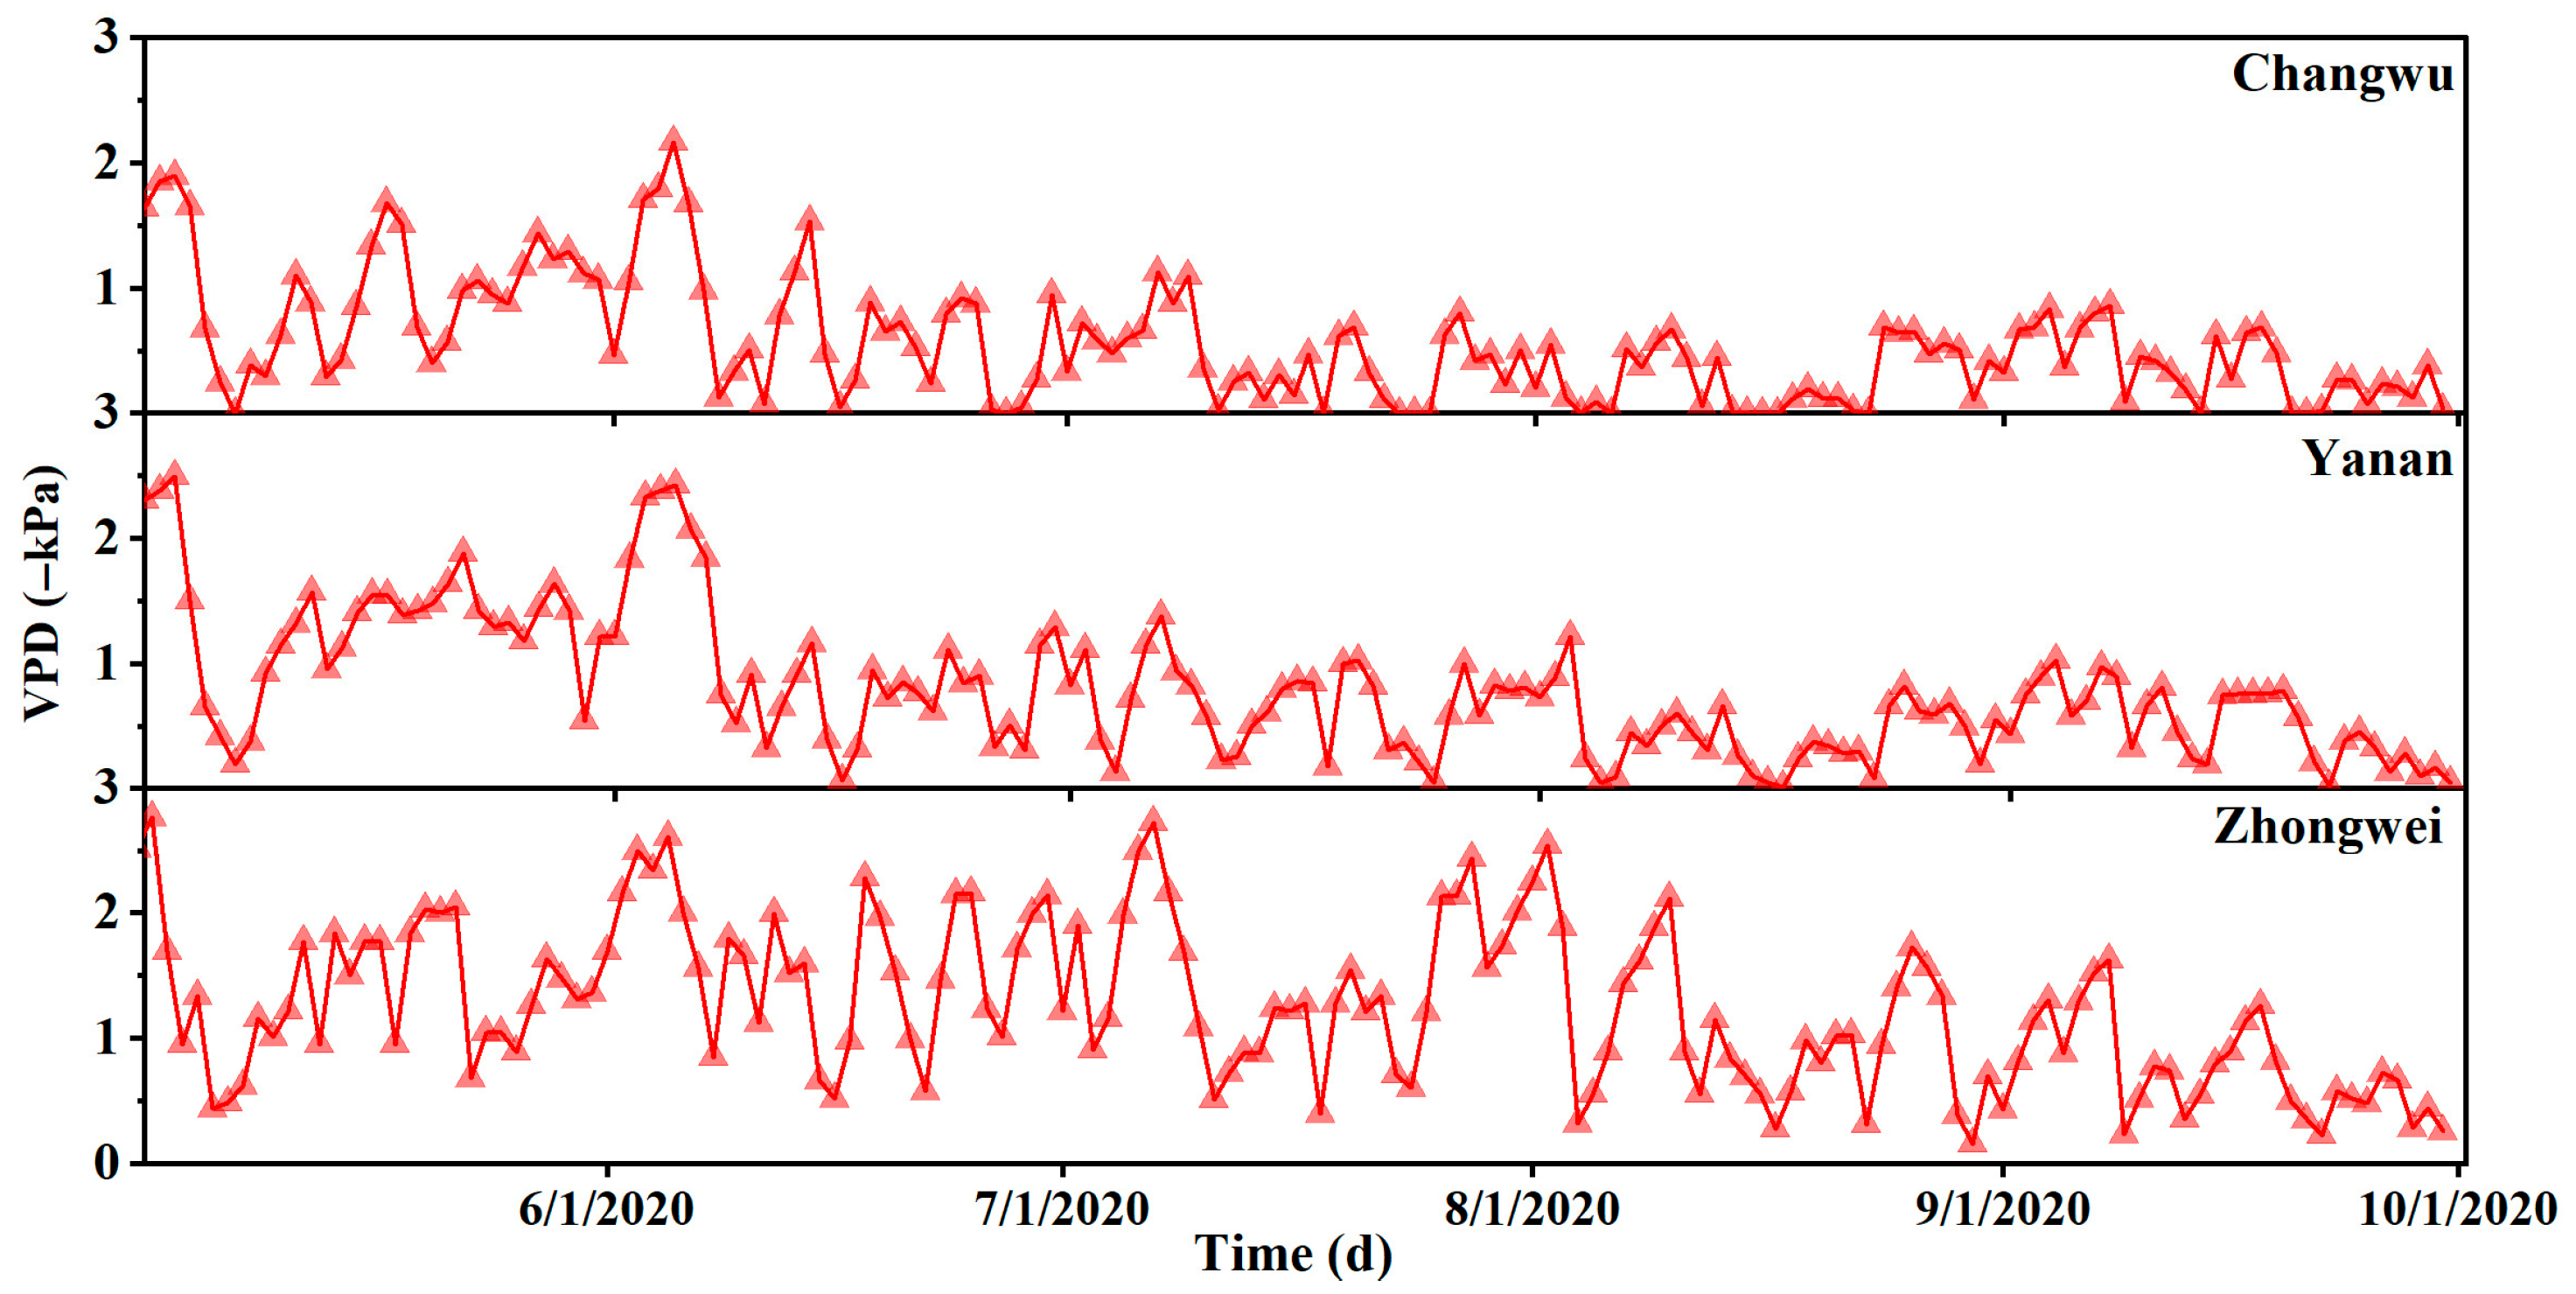
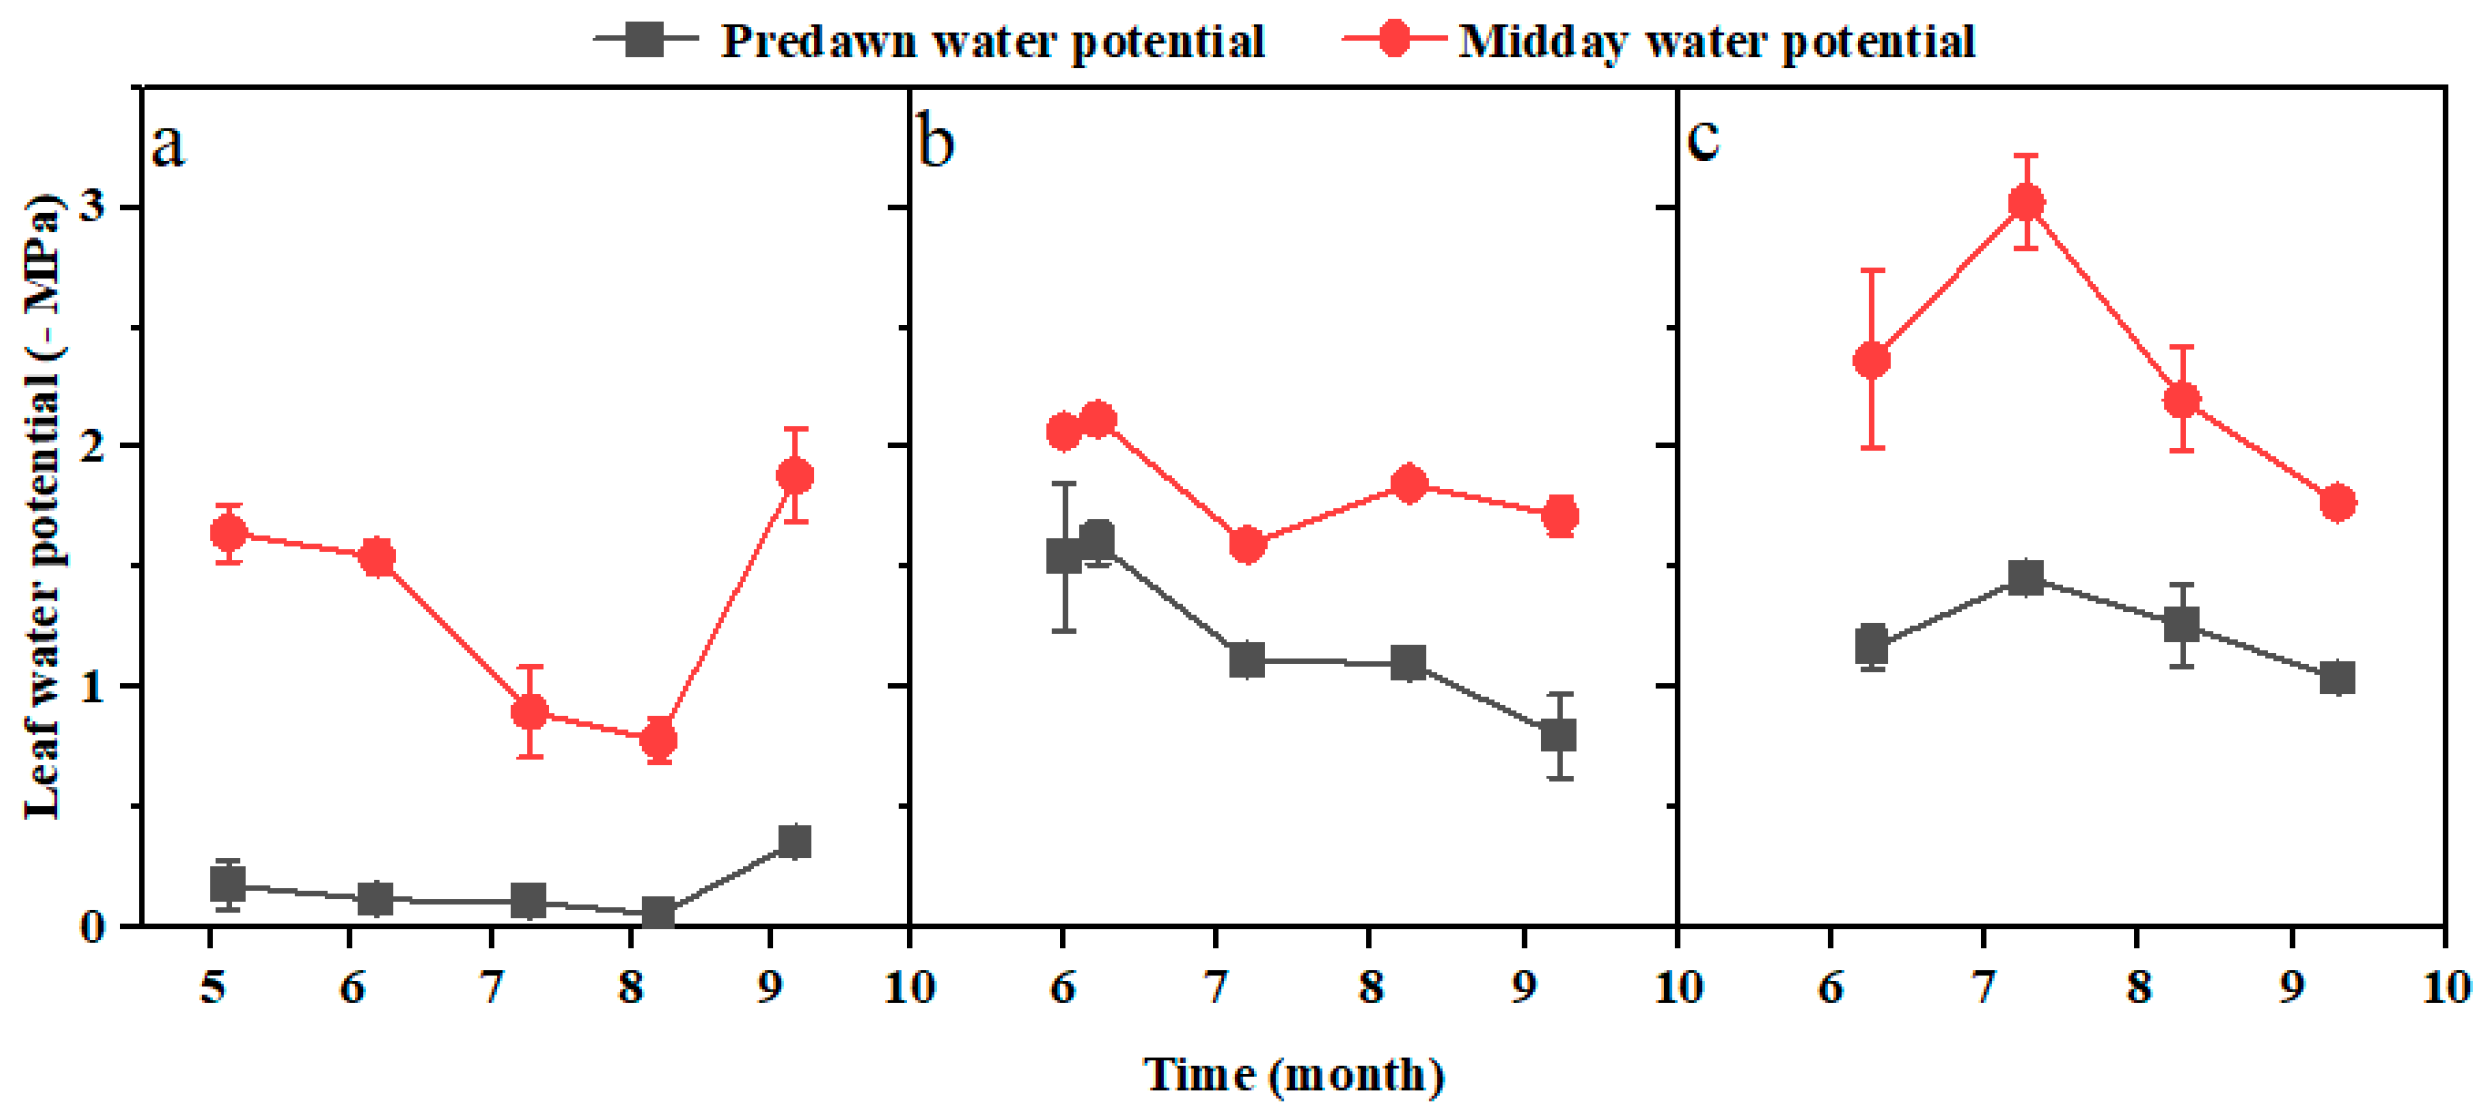
The midday leaf water potential of the three tree species was significantly lower than their predawn leaf water potential, particularly in jujube trees, where the difference between the two was the greatest. The predawn leaf water potential of black locust trees (−1.23 ± 0.34 MPa) and jujube trees (−1.23 ± 0.18 MPa) was significantly lower than that of apple trees (0.17 ± 0.12 MPa) (Figure 9), which was consistent with the results for soil water content. The order of midday leaf water potential of the three species was as follows: jujube tree (−2.34 ± 0.51 MPa) < black locust tree (−1.87 ± 0.21 MPa) < apple tree (−1.35 ± 0.46 MPa). This sequence aligns with the saturated water vapor pressure observed in the three study areas (Figure A2).

4. Discussion

Our results show that the Gc of jujube trees is highly insensitive to VPD changes and exhibits a limited response to precipitation compared with black locust and apple trees. In contrast, black locust and apple trees display high sensitivity of Gc to VPD, with their sap flows responding strongly to precipitation, especially in black locust trees. This aligns with the findings of [29]), indicating that the exotic tree species black locust exhibits greater sensitivity to variations in soil moisture compared to native tree species. Furthermore, ref. [27] found that, as soil drought stress in pine trees intensifies, the sensitivity of stomata to VPD diminishes progressively.
This may be attributed to multiple factors, including root zone soil water availability, the abundance and spatial distribution of fine roots, and the hydraulic properties of the trees [16,19,22,33,44]. The adaptive adjustment of the structure and function of the tree hydraulic transportation system under long-term drought conditions is characterized by increased hydraulic safety at the expense of reduced transportation efficiency [45,46]. The canopy conductance of jujube trees is low (Figure 3), indicating limited transport efficiency in their hydraulic system. Our findings also show very low xylem conductivity (Ks) (Table 3). Furthermore, susceptibility to xylem embolism has been shown to be closely associated with the sensitivity of Gc to VPD. Specifically, species with higher vulnerability to xylem cavitation typically exhibit greater sensitivity of Gc to VPD [19,20,22]. Our results indicate that jujube trees are significantly less vulnerable to xylem embolism compared to black locust trees and apple trees (Figure 5). Thus, the low susceptibility of jujube trees to embolism may represent a key physiological factor contributing to their reduced drought sensitivity. Meanwhile, the soil water content in the root zone of jujube trees has consistently remained near the wilting point. Excessive soil dryness can increase root suberization [47,48], impair root water absorption capacity [49], and reduce rhizosphere hydraulic conductivity. This irreversible structural change prevents rapid recovery of root zone hydraulic conductance even after precipitation [50].
Black locust trees exhibit higher xylem hydraulic conductivity and greater Gcref than apple trees, suggesting a more efficient soil-to-leaf hydraulic system. However, this also demonstrates lower vulnerability to xylem embolism (Figure 5). This divergence is further influenced by root-zone water availability: although both species develop fine roots beyond 20 m in depth, black locust trees have significantly higher shallow root density (Figure 4), yet their deep soil moisture remains near the wilting point, unlike apple trees, which access more favorable deep water reserves (5–15 m; Figure 8). Research has demonstrated that the hydraulic conductivity of rhizosphere soil and root length density play a critical role in shaping the transpiration rate of trees during drought periods [51,52,53]. Therefore, the above hydraulic and edaphic differences explain why black locust trees exhibit greater drought stress (as evidenced by lower leaf water potential) and stronger Gc-VPD sensitivity.
Jujube trees in arid regions exhibit high hydraulic safety (low xylem embolism vulnerability) that enhances drought survival [54,55], but their low hydraulic efficiency limits photosynthetic productivity and post-precipitation water-use capacity [56]. While traits such as Gc to VPD reduce mortality risk, the limited hydraulic transport restricts rapid growth recovery after rainfall [57,58]. Therefore, surface soil water retention measures, such as gravel mulching, are essential to compensate for brief soil moisture availability under high evapotranspiration, as natural precipitation alone cannot ensure long-term survival, given these trade-offs between safety and growth. Similarly, black locust trees in semi-arid regions show strong precipitation-dependent transpiration due to depleted deep soil moisture (near wilting point), making them particularly vulnerable to future climate shifts involving reduced rainfall and increased vapor pressure deficit [59,60]. However, the physiological characteristics of trees may also exhibit adaptive changes following exposure to prolonged mild drought, thereby enhancing their resilience to future climate change [61,62]. Therefore, to reliably predict the survival status of black locust trees in semi-arid regions under future climate change scenarios, further investigation into the plasticity of their physiological traits in response to arid conditions is essential.

5. Conclusions

Our results show that the transpiration and canopy conductance of black locust trees in semi-arid regions and apple trees in semi-humid regions exhibit heightened sensitivity to vapor pressure deficit (VPD) and precipitation. In contrast, the sensitivity of jujube trees in arid regions is comparatively lower. This phenomenon is associated with the vulnerability of xylem embolism, soil water availability, and fine root density. Low hydraulic transport efficiency, as determined by the structure and function of the xylem and root system, restricts transpiration in jujube trees. These results indicate that the transpiration of black locust trees in the semi-arid region and apple trees in the semi-humid area is strongly dependent on precipitation, particularly for black locust trees. Future alterations in precipitation patterns could significantly affect the productivity and survival of black locust trees. Moreover, after rainfall events, the transpiration of jujube trees in arid regions remains constrained by the transport efficiency of their hydraulic system, preventing them from fully utilizing the available precipitation within a short timeframe. Consequently, soil surface measures designed to retain precipitation are crucial for the survival of jujube trees in arid environments.

Author Contributions

Conceptualization, R.H. and J.F.; data curation, Z.X., M.L., and G.L.; formal analysis, R.H.; investigation, M.L., X.L., and D.L.; software, Z.X. and G.L.; validation, X.L. and X.Z.; writing—original draft, R.H.; writing—review and editing, Z.X., M.L., G.L., J.F., D.L., and X.Z. All authors have read and agreed to the published version of the manuscript.

Funding

This research received no external funding.

Data Availability Statement

The original contributions presented in this study are included in the article. Further inquiries can be directed to the corresponding author(s).

Acknowledgments

We thank the National Field Observation and Research Station of Changwu Farmland Ecosystem for providing technical support during soil moisture and root data collection.

Conflicts of Interest

Authors Ruimin He, Zhenguo Xing, Xiaoqing Liu, and Xin Zou were employed by the State Key Laboratory of Water Resource Protection and Utilization in Coal Mining. Mingzhe Lei and Guanjie Li were employed by the Shendong Coal Branch, China Shenhua Energy Company Limited. Jie Fang and Da Lei were employed the National Institute of Low Carbon and Clean Energy and National Energy Investment Group Co., Ltd.. The remaining authors declare that the research was conducted in the absence of any commercial or financial relationships that could be construed as a potential conflict of interest.

Abbreviations

The following abbreviations are used in this manuscript:
VPDVapor pressure deficit
GcCanopy conductance
GcrefReference canopy conductivity
VT Composite function of solar radiation and saturated vapor pressure deficit
NFDStandardized sap flow
PLCPercentage loss of conductivity

Appendix A

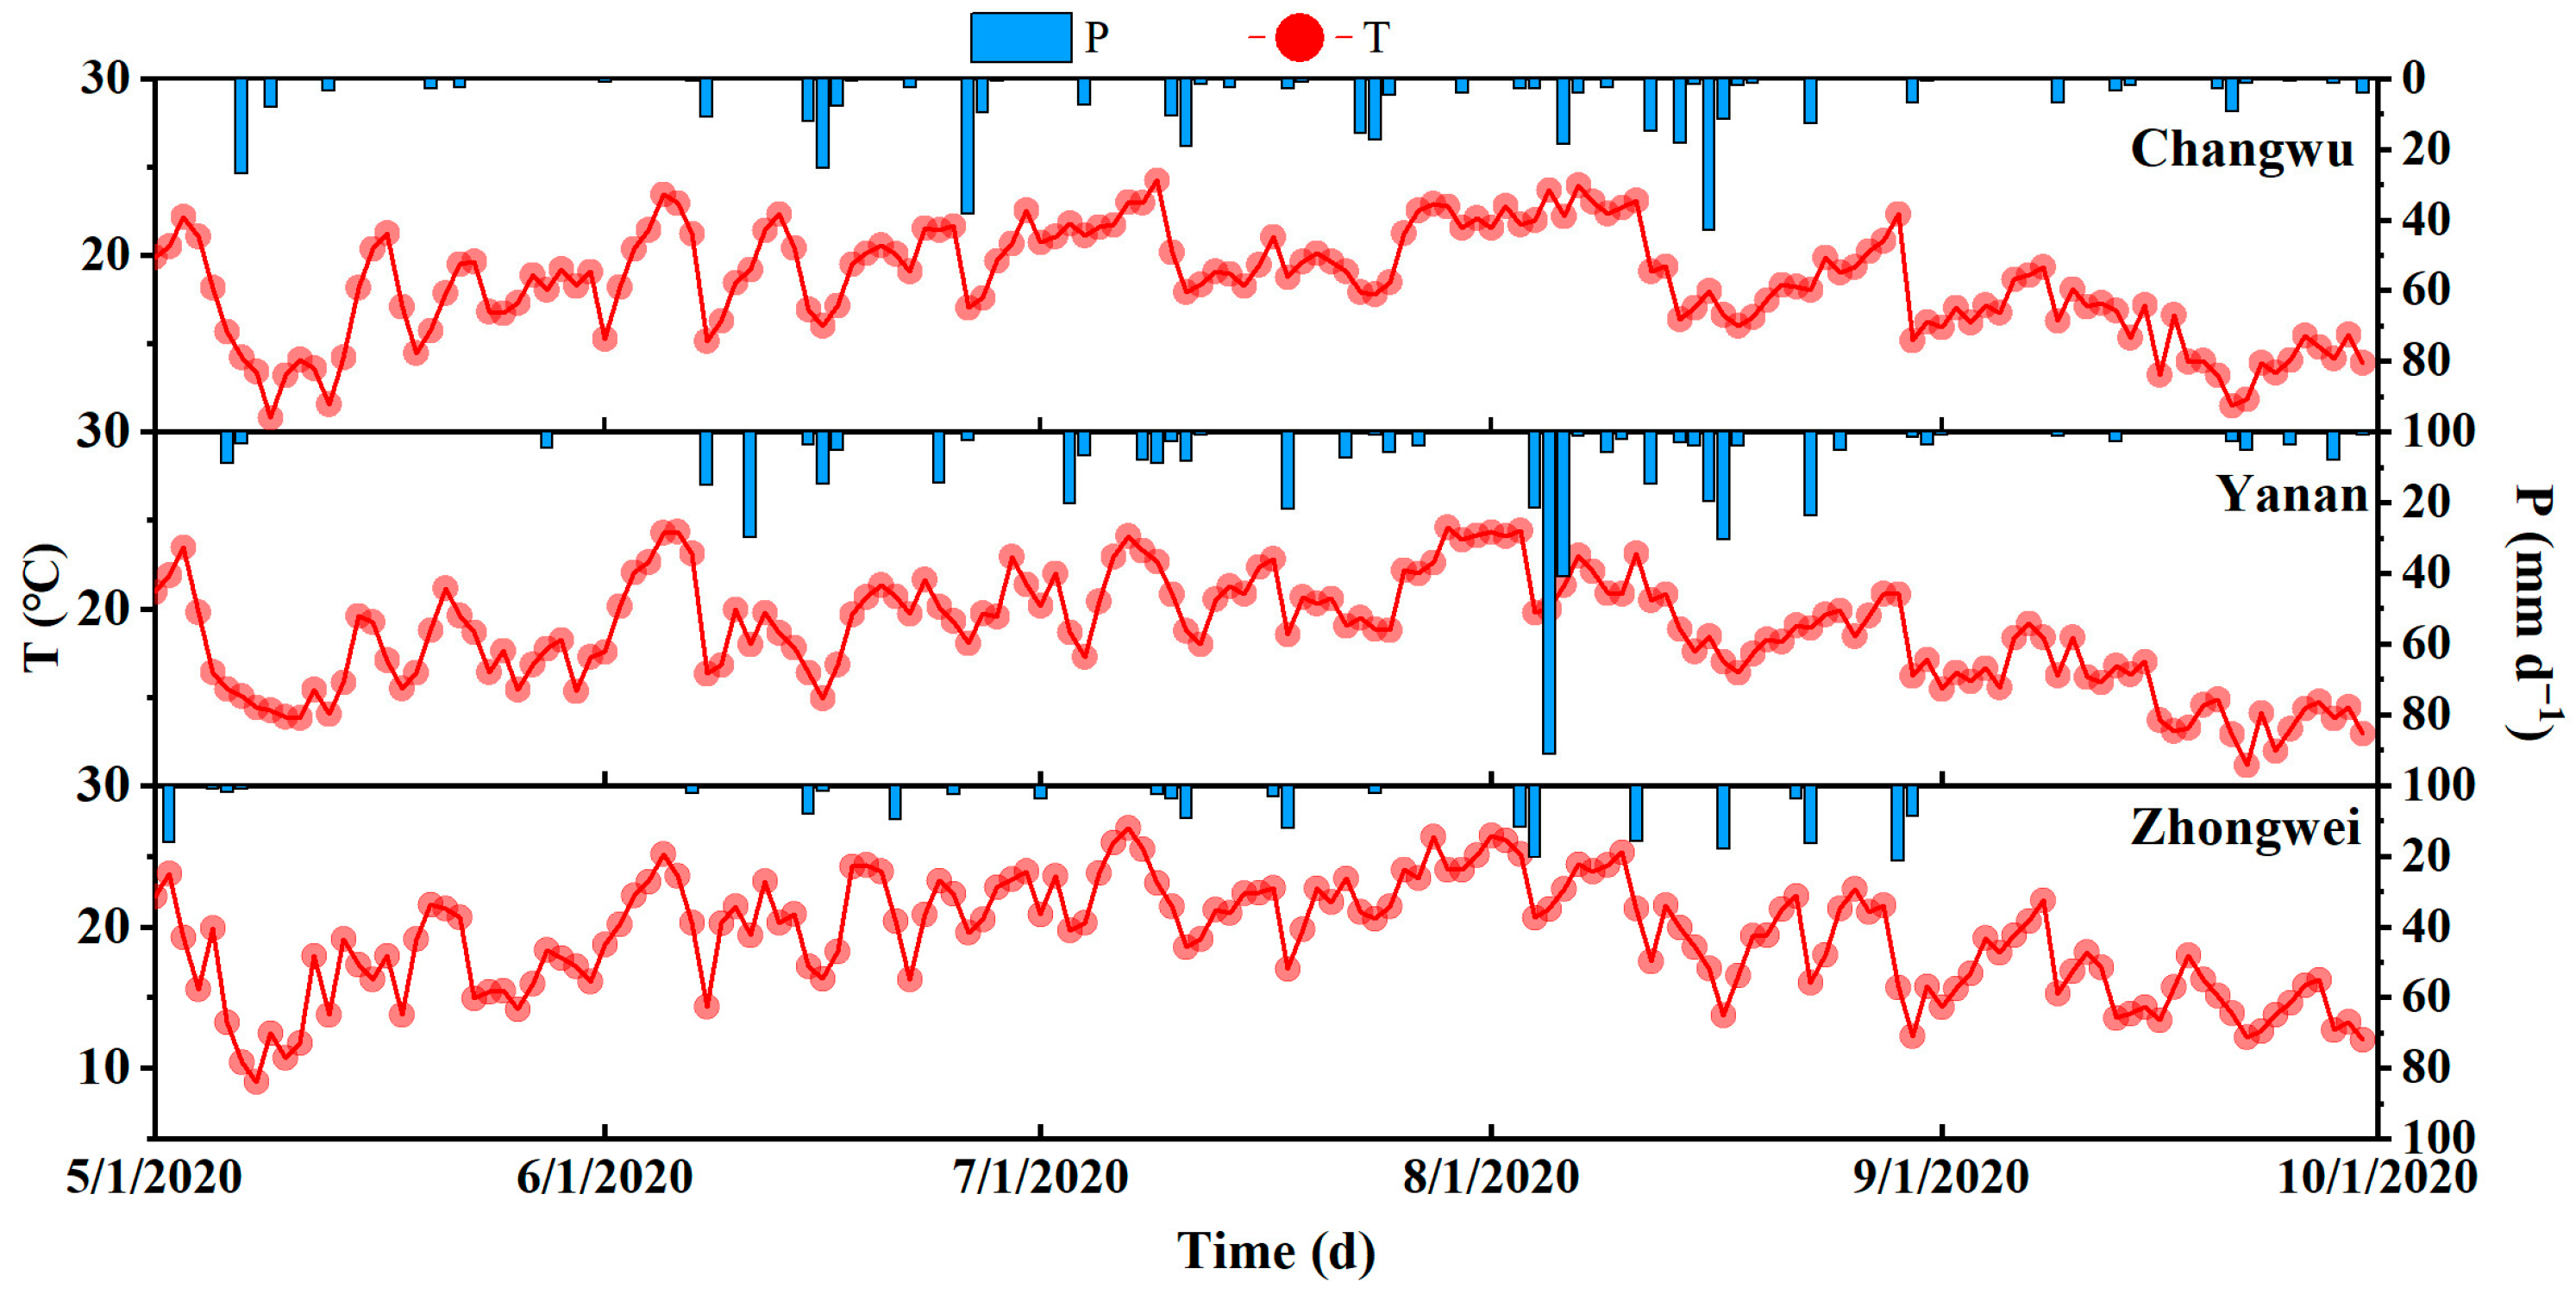
In 2020, during the growing season (May to September), in CW, Yan’an, and ZW, the numbers of precipitation days were 66, 78, and 36, respectively. The numbers of effective precipitation days, defined as those with precipitation exceeding 2 mm, were 37, 39, and 20, respectively. Total precipitation amounts were 419.4 mm, 504 mm, and 201 mm, respectively. Maximum temperatures in these three regions were 33.1 °C, 34.5 °C, and 33.2 °C, respectively, with the number of days where the maximum temperature exceeded 30 °C being 14, 20, and 26, respectively. The daily average saturated water vapor pressure deficits (VPDs) during the growing season were −0.56 kPa, −0.8 kPa, and −1.25 kPa, respectively. The numbers of days with a daily average value less than −1 kPa were 24, 42, and 91, while the maximum values were −4.25 kPa, −4.9 kPa, and −4.27 kPa, respectively.
Figure A1. The daily precipitation and average air temperature in Changwu, Yan’an, and Zhongwei during the growing season (May–September) in 2020.
Water 17 02445 g0a1
Figure A2. The daily saturated water vapor pressure in Changwu, Yan‘an, and Zhongwei during the growing season (May–September) in 2020.
Water 17 02445 g0a2

Appendix B

The percentages of clay particles, silt particles, and sand particles in the root profiles of Changwu apple trees were 20%, 51%, and 29%, respectively. In the root profile of black locust trees in Yan’an, the percentages of clay particles, silt particles, and sand particles were 13%, 64%, and 23%, respectively. For Zhongwei jujube trees, the corresponding percentages were 15%, 41%, and 43%, respectively. The soil profile of the locust tree field in Changwu had the highest clay particle content, followed by the soil in the jujube tree field in Zhongwei. Notably, the sand content in the jujube tree fields in Zhongwei was significantly higher than that in the apple fields in Changwu and the acacia fields in Yan’an.
Figure A3. Soil particle composition within the depth range of the root zone of apple (a), black locust (b), and jujube (c) trees.
Water 17 02445 g0a3

References

  1. Allen, C.D.; Macalady, A.K.; Chenchouni, H.; Bachelet, D.; McDowell, N.; Vennetier, M.; Kitzberger, T.; Rigling, A.; Breshears, D.D.; Hogg, E.H.; et al. A global overview of drought and heat-induced tree mortality reveals emerging climate change risks for forests. For. Ecol. Manag. 2010, 259, 660–684. [Google Scholar] [CrossRef]
  2. Huang, L.; He, B.; Chen, A.F.; Wang, H.Y.; Liu, J.J.; Lu, A.F.; Chen, Z.Y. Drought dominates the interannual variability in global terrestrial net primary production by controlling semi-arid ecosystems. Sci. Rep. 2016, 6, 24639. [Google Scholar] [CrossRef]
  3. Xu, L.; Chen, N.C.; Zhang, X. Global drought trends under 1.5 and 2 degrees C warming. Int. J. Clim. 2019, 39, 2375–2385. [Google Scholar] [CrossRef]
  4. Pan, Y.D.; Birdsey, R.A.; Fang, J.Y.; Houghton, R.; Kauppi, P.E.; Kurz, W.A.; Phillips, O.L.; Shvidenko, A.; Lewis, S.L.; Canadell, J.G.; et al. A Large and Persistent Carbon Sink in the World’s Forests. Science 2011, 333, 988–993. [Google Scholar] [CrossRef]
  5. Feng, X.M.; Fu, B.J.; Piao, S.; Wang, S.H.; Ciais, P.; Zeng, Z.Z.; Lu, Y.H.; Zeng, Y.; Li, Y.; Jiang, X.H.; et al. Revegetation in China’s Loess Plateau is approaching sustainable water resource limits. Nat. Clim. Change 2016, 6, 1019–1022. [Google Scholar] [CrossRef]
  6. Lu, F.; Hu, H.; Sun, W.; Zhu, J.; Liu, G.; Zhou, W.; Zhang, Q.; Shi, P.; Liu, X.; Wu, X.; et al. Effects of national ecological restoration projects on carbon sequestration in China from 2001 to 2010. Proc. Natl. Acad. Sci. USA 2018, 115, 4039–4044. [Google Scholar] [CrossRef]
  7. Liu, M.X.; Xu, X.L.; Sun, A.Y. New drought index indicates that land surface changes might have enhanced drying tendencies over the Loess Plateau. Ecol. Indic. 2018, 89, 716–724. [Google Scholar] [CrossRef]
  8. Zhang, Q.Y.; Jia, X.X.; Shao, M.G.; Zhang, C.C.; Li, X.D.; Ma, C.K. Sap flow of black locust in response to short-term drought in southern Loess Plateau of China. Sci. Rep. 2018, 8, 6222. [Google Scholar] [CrossRef] [PubMed]
  9. Jia, X.X.; Shao, M.A.; Zhu, Y.J.; Luo, Y. Soil moisture decline due to afforestation across the Loess Plateau, China. J. Hydrol. 2017, 546, 113–122. [Google Scholar] [CrossRef]
  10. Zhao, C.; Jia, X.; Gongadze, K.; Shao, M.; Wu, L.; Zhu, Y. Permanent dry soil layer a critical control on soil desiccation on China’s Loess Plateau. Sci. Rep. 2019, 9, 3296. [Google Scholar] [CrossRef] [PubMed]
  11. Phillips, R.P.; Ibanez, I.; D’Orangeville, L.; Hanson, P.J.; Ryan, M.G.; McDowell, N.G. A belowground perspective on the drought sensitivity of forests: Towards improved understanding and simulation. For. Ecol. Manag. 2016, 380, 309–320. [Google Scholar] [CrossRef]
  12. Breda, N.; Huc, R.; Granier, A.; Dreyer, E. Temperate forest trees and stands under severe drought: A review of ecophysiological responses, adaptation processes and long-term consequences. Ann. For. Sci. 2006, 63, 625–644. [Google Scholar] [CrossRef]
  13. Wolf, A.; Anderegg, W.R.L.; Pacala, S.W. Optimal stomatal behavior with competition for water and risk of hydraulic impairment. Proc. Natl. Acad. Sci. USA 2016, 113, E7222–E7230. [Google Scholar] [CrossRef]
  14. Fiorin, L.; Brodribb, T.J.; Anfodillo, T. Transport efficiency through uniformity: Organization of veins and stomata in angiosperm leaves. New Phytol. 2016, 209, 216–227. [Google Scholar] [CrossRef]
  15. Mitchell, P.J.; O’Grady, A.P.; Tissue, D.T.; White, D.A.; Ottenschlaeger, M.L.; Pinkard, E.A. Drought response strategies define the relative contributions of hydraulic dysfunction and carbohydrate depletion during tree mortality. New Phytol. 2013, 197, 862–872. [Google Scholar] [CrossRef]
  16. Sperry, J.S. Hydraulic constraints on plant gas exchange. Agric. For. Meteorol. 2000, 104, 13–23. [Google Scholar] [CrossRef]
  17. Oren, R.; Sperry, J.S.; Katul, G.G.; Pataki, D.E.; Ewers, B.E.; Phillips, N.; Schafer, K.V.R. Survey and synthesis of intra- and interspecific variation in stomatal sensitivity to vapour pressure deficit. Plant Cell Environ. 1999, 22, 1515–1526. [Google Scholar] [CrossRef]
  18. Naithani, K.J.; Ewers, B.E.; Pendall, E. Sap flux-scaled transpiration and stomatal conductance response to soil and atmospheric drought in a semi-arid sagebrush ecosystem. J. Hydrol. 2012, 464, 176–185. [Google Scholar] [CrossRef]
  19. McCulloh, K.A.; Woodruff, D.R. Linking stomatal sensitivity and whole-tree hydraulic architecture. Tree Physiol. 2012, 32, 369–372. [Google Scholar] [CrossRef]
  20. Bush, S.E.; Pataki, D.E.; Hultine, K.R.; West, A.G.; Sperry, J.S.; Ehleringer, J.R. Wood anatomy constrains stomatal responses to atmospheric vapor pressure deficit in irrigated, urban trees. Oecologia 2008, 156, 13–20. [Google Scholar] [CrossRef]
  21. Klein, T. The variability of stomatal sensitivity to leaf water potential across tree species indicates a continuum between isohydric and anisohydric behaviours. Funct. Ecol. 2014, 28, 1313–1320. [Google Scholar] [CrossRef]
  22. Litvak, E.; McCarthy, H.R.; Pataki, D.E. Transpiration sensitivity of urban trees in a semi-arid climate is constrained by xylem vulnerability to cavitation. Tree Physiol. 2012, 32, 373–388. [Google Scholar] [CrossRef]
  23. Addington, R.N.; Mitchell, R.J.; Oren, R.; Donovan, L.A. Stomatal sensitivity to vapor pressure deficit and its relationship to hydraulic conductance in Pinus palustris. Tree Physiol. 2004, 24, 561–569. [Google Scholar] [CrossRef]
  24. Siddiq, Z.; Chen, Y.-J.; Zhang, Y.-J.; Zhang, J.-L.; Cao, K.-F. More sensitive response of crown conductance to VPD and larger water consumption in tropical evergreen than in deciduous broadleaf timber trees. Agric. For. Meteorol. 2017, 247, 399–407. [Google Scholar] [CrossRef]
  25. Oren, R.; Sperry, J.S.; Ewers, B.E.; Pataki, D.E.; Phillips, N.; Megonigal, J.P. Sensitivity of mean canopy stomatal conductance to vapor pressure deficit in a flooded Taxodium distichum L. forest: Hydraulic and non-hydraulic effects. Oecologia 2001, 126, 21–29. [Google Scholar] [CrossRef]
  26. Klein, T.; Shpringer, I.; Fikler, B.; Elbaz, G.; Cohen, S.; Yakir, D. Relationships between stomatal regulation, water-use, and water-use efficiency of two coexisting key Mediterranean tree species. For. Ecol. Manag. 2013, 302, 34–42. [Google Scholar] [CrossRef]
  27. Song, L.N.; Zhu, J.J.; Zheng, X.; Wang, K.; Zhang, J.X.; Hao, G.Y.; Wang, G.C.; Liu, J.H. Comparison of canopy transpiration between Pinus sylvestris var. mongolica and Pinus tabuliformis plantations in a semiarid sandy region of Northeast China. Agric. For. Meteorol. 2022, 314, 108784. [Google Scholar] [CrossRef]
  28. Igarashi, Y.; Kumagai, T.; Yoshifuji, N.; Sato, T.; Tanaka, N.; Tanaka, K.; Suzuki, M.; Tantasirin, C. Environmental control of canopy stomatal conductance in a tropical deciduous forest in northern Thailand. Agric. For. Meteorol. 2015, 202, 1–10. [Google Scholar] [CrossRef]
  29. Du, S.; Wang, Y.-L.; Kume, T.; Zhang, J.-G.; Otsuki, K.; Yamanaka, N.; Liu, G.-B. Sapflow characteristics and climatic responses in three forest species in the semiarid Loess Plateau region of China. Agric. For. Meteorol. 2011, 151, 1–10. [Google Scholar] [CrossRef]
  30. Lyu, J.L.; He, Q.Y.; Chen, Q.W.; Cheng, R.R.; Li, G.Q.; Otsuki, K.; Yamanaka, N.; Du, S. Distinct transpiration characteristics of black locust plantations acclimated to semiarid and subhumid sites in the Loess Plateau, China. Agric. Water Manag. 2022, 262, 107402. [Google Scholar] [CrossRef]
  31. Weithmann, G.; Schuldt, B.; Link, R.M.; Heil, D.; Hoeber, S.; John, H.; Muller-Haubold, H.; Schuller, L.M.; Schumann, K.; Leuschner, C. Leaf trait modification in European beech trees in response to climatic and edaphic drought. Plant Biol. 2021, 24, 1272–1286. [Google Scholar] [CrossRef] [PubMed]
  32. Schuldt, B.; Knutzen, F.; Delzon, S.; Jansen, S.; Muller-Haubold, H.; Burlett, R.; Clough, Y.; Leuschner, C. How adaptable is the hydraulic system of European beech in the face of climate change-related precipitation reduction? New Phytol. 2016, 210, 443–458. [Google Scholar] [CrossRef]
  33. Kume, T.; Takizawa, H.; Yoshifuji, N.; Tanaka, K.; Tantasirin, C.; Tanaka, N.; Suzuki, M. Impact of soil drought on sap flow and water status of evergreen trees in a tropical monsoon forest in northern Thailand. For. Ecol. Manag. 2007, 238, 220–230. [Google Scholar] [CrossRef]
  34. Yan, W.; Zhong, Y.; Shangguan, Z. Rapid response of the carbon balance strategy in Robinia pseudoacacia and Amorpha fruticosa to recurrent drought. Environ. Exp. Bot. 2017, 138, 46–56. [Google Scholar] [CrossRef]
  35. Weber, P.; Bugmann, H.; Pluess, A.R.; Walthert, L.; Rigling, A. Drought response and changing mean sensitivity of European beech close to the dry distribution limit. Trees 2012, 27, 171–181. [Google Scholar] [CrossRef]
  36. He, Q.-Y.; Yan, M.-J.; Miyazawa, Y.; Chen, Q.-W.; Cheng, R.-R.; Otsuki, K.; Yamanaka, N.; Du, S. Sap flow changes and climatic responses over multiple-year treatment of rainfall exclusion in a sub-humid black locust plantation. For. Ecol. Manag. 2020, 457, 117730. [Google Scholar] [CrossRef]
  37. Yan, M.J.; Zhang, J.G.; He, Q.Y.; Shi, W.Y.; Otsuki, K.; Yamanaka, N.; Du, S. Sapflow-Based Stand Transpiration in a Semiarid Natural Oak Forest on China’s Loess Plateau. Forests 2016, 7, 227. [Google Scholar] [CrossRef]
  38. Tang, Y.; Wu, X.; Chen, Y. Sap flow characteristics and physiological adjustments of two dominant tree species in pure and mixed plantations in the semi-arid Loess Plateau of China. J. Arid Land 2018, 10, 833–849. [Google Scholar] [CrossRef]
  39. Seleiman, M.F.; Al-Suhaibani, N.; Ali, N.; Akmal, M.; Alotaibi, M.; Refay, Y.; Dindaroglu, T.; Abdul-Wajid, H.H.; Battaglia, M.L. Drought Stress Impacts on Plants and Different Approaches to Alleviate Its Adverse Effects. Plants 2021, 10, 259. [Google Scholar] [CrossRef]
  40. Wang, R.; Zhang, L.; Zhang, S.; Cai, J.; Tyree, M.T. Water relations of Robinia pseudoacacia L.: Do vessels cavitate and refill diurnally or are R-shaped curves invalid in Robinia? Plant Cell Environ. 2014, 37, 2667–2678. [Google Scholar] [CrossRef] [PubMed]
  41. Du, G.; Feng, F.; Wang, Y.; Tyree, M.T. Do nano-particles cause recalcitrant vulnerability curves in Robinia? Testing with a four-cuvette Cochard rotor and with water extraction curves. Tree Physiol. 2019, 39, 156–165. [Google Scholar] [CrossRef]
  42. Oogathoo, S.; Houle, D.; Duchesne, L.; Kneeshaw, D. Vapour pressure deficit and solar radiation are the major drivers of transpiration of balsam fir and black spruce tree species in humid boreal regions, even during a short-term drought. Agric. For. Meteorol. 2020, 291, 108063. [Google Scholar] [CrossRef]
  43. Zhang, H.P.; Simmonds, L.P.; Morison, J.I.L.; Payne, D. Estimation of transpiration by single trees: Comparison of sap flow measurements with a combination equation. Agric. For. Meteorol. 1997, 87, 155–169. [Google Scholar] [CrossRef]
  44. Bovard, B.D.; Curtis, P.S.; Vogel, C.S.; Su, H.B.; Schmid, H.P. Environmental controls on sap flow in a northern hardwood forest. Tree Physiol. 2005, 25, 31–38. [Google Scholar] [CrossRef]
  45. Fonti, P.; Heller, O.; Cherubini, P.; Rigling, A.; Arend, M. Wood anatomical responses of oak saplings exposed to air warming and soil drought. Plant Biol. 2013, 15, 210–219. [Google Scholar] [CrossRef]
  46. Brunner, I.; Herzog, C.; Dawes, M.A.; Arend, M.; Sperisen, C. How tree roots respond to drought. Front. Plant Sci. 2015, 6, 547. [Google Scholar] [CrossRef]
  47. Moura, J.; Bonine, C.A.V.; Viana, J.D.F.; Dornelas, M.C.; Mazzafera, P. Abiotic and Biotic Stresses and Changes in the Lignin Content and Composition in Plants. J. Integr. Plant Biol. 2010, 52, 360–376. [Google Scholar] [CrossRef]
  48. Zhang, L.; Merlin, I.; Pascal, S.; Bert, P.F.; Domergue, F.; Gambetta, G.A. Drought activates MYB41 orthologs and induces suberization of grapevine fine roots. Plant Direct 2020, 4, e00278. [Google Scholar] [CrossRef] [PubMed]
  49. Steudle, E. Water uptake by roots: Effects of water deficit. J. Exp. Bot. 2000, 51, 1531–1542. [Google Scholar] [CrossRef]
  50. Cuneo, I.F.; Knipfer, T.; Brodersen, C.R.; McElrone, A.J. Mechanical Failure of Fine Root Cortical Cells Initiates Plant Hydraulic Decline during Drought. Plant Physiol. 2016, 172, 1669–1678. [Google Scholar] [CrossRef]
  51. Mackay, D.S.; Savoy, P.R.; Grossiord, C.; Tai, X.; Pleban, J.R.; Wang, D.R.; McDowell, N.G.; Adams, H.D.; Sperry, J.S. Conifers depend on established roots during drought: Results from a coupled model of carbon allocation and hydraulics. New Phytol. 2020, 225, 679–692. [Google Scholar] [CrossRef]
  52. Carminati, A.; Javaux, M. Soil Rather Than Xylem Vulnerability Controls Stomatal Response to Drought. Trends Plant Sci. 2020, 25, 868–880. [Google Scholar] [CrossRef]
  53. Cai, G.; Ahmed, M.A.; Abdalla, M.; Carminati, A. Root hydraulic phenotypes impacting water uptake in drying soils. Plant Cell Environ. 2022, 45, 650–663. [Google Scholar] [CrossRef]
  54. Choat, B.; Brodribb, T.J.; Brodersen, C.R.; Duursma, R.A.; Lopez, R.; Medlyn, B.E. Triggers of tree mortality under drought. Nature 2018, 558, 531–539. [Google Scholar] [CrossRef] [PubMed]
  55. Anderegg, W.R.L.; Klein, T.; Bartlett, M.; Sack, L.; Pellegrini, A.F.A.; Choat, B.; Jansen, S. Meta-analysis reveals that hydraulic traits explain cross-species patterns of drought-induced tree mortality across the globe. Proc. Natl. Acad. Sci. USA 2016, 113, 5024–5029. [Google Scholar] [CrossRef]
  56. McDowell, N.G.; Sevanto, S. The mechanisms of carbon starvation: How, when, or does it even occur at all? New Phytol. 2010, 186, 264–266. [Google Scholar] [CrossRef]
  57. Fan, Z.-X.; Zhang, S.-B.; Hao, G.-Y.; Ferry Slik, J.W.; Cao, K.-F. Hydraulic conductivity traits predict growth rates and adult stature of 40 Asian tropical tree species better than wood density. J. Ecol. 2012, 100, 732–741. [Google Scholar] [CrossRef]
  58. Zhang, J.L.; Cao, K.F. Stem hydraulics mediates leaf water status, carbon gain, nutrient use efficiencies and plant growth rates across dipterocarp species. Funct. Ecol. 2009, 23, 658–667. [Google Scholar] [CrossRef]
  59. Dai, A. Increasing drought under global warming in observations and models. Nat. Clim. Change 2012, 3, 52–58. [Google Scholar] [CrossRef]
  60. Yuan, X.; Wang, L.; Wu, P.; Ji, P.; Sheffield, J.; Zhang, M. Anthropogenic shift towards higher risk of flash drought over China. Nat. Commun. 2019, 10, 4661. [Google Scholar] [CrossRef]
  61. Tomasella, M.; Beikircher, B.; Haberle, K.H.; Hesse, B.; Kallenbach, C.; Matyssek, R.; Mayr, S. Acclimation of branch and leaf hydraulics in adult Fagus sylvatica and Picea abies in a forest through-fall exclusion experiment. Tree Physiol. 2018, 38, 198–211. [Google Scholar] [CrossRef] [PubMed]
  62. Tng, D.Y.P.; Apgaua, D.M.G.; Ishida, Y.F.; Mencuccini, M.; Lloyd, J.; Laurance, W.F.; Laurance, S.G.W. Rainforest trees respond to drought by modifying their hydraulic architecture. Ecol. Evol. 2018, 8, 12479–12491. [Google Scholar] [CrossRef] [PubMed]
Figure 1. Location of the research site and distribution map of its long-term average precipitation.
Water 17 02445 g001
Figure 2. Trends in canopy conductance (Gc) for apple trees (a), black locust trees (b), and jujube trees (c) in response to variations in the saturated water vapor pressure deficit (VPD).
Water 17 02445 g002
Figure 3. The relationship between the normalized sap flow (FD) before and after rainfall and the coupling index (VT), which represents the combined effect of light exposure and saturated water vapor pressure difference, is examined for apple trees (a), black locust trees (b), and jujube trees (c). The exponential saturation curve provides a good fit for all normalized FD and VT datasets.
Water 17 02445 g003
Figure 4. The vertical distribution of fine root length density and maximum root depth for apple trees (a), black locust trees (b), and jujube trees (c).
Water 17 02445 g004
Figure 5. Embolic vulnerability curves of the xylem of apple, black locust, and jujube trees.
Water 17 02445 g005
Figure 6. Seasonal variations in soil water content for apple trees (a), locust trees (b), and jujube trees (c).
Water 17 02445 g006
Figure 7. The coefficient of variation in soil water content for apple trees (a), black locust trees (b), and jujube trees (c) during the growing season (May to September) was analyzed.
Water 17 02445 g007
Figure 8. Soil water content in the root zones of apple trees (a), black locust trees (b), and jujube trees (c), as well as the soil water content of withering point and the adjacent grassland.
Water 17 02445 g008
Figure 9. The predawn and midday leaf water potential of apple trees (a), black locust trees (b), and jujube trees (c).
Water 17 02445 g009
Table 1. Summary plantation characteristics of the tree species in the growing season, including location, slope, tree height (H), diameter at breast height (DBH), age, planting density (D), maximum leaf area index (MLAI), and plant density (± standard error).
SpeciesLocationsSlopeD
(ha−1)
Age
(Years)
DBH
(cm)
H
(m)
MLAI
(m−2 m−2)
apple treeChangwu
(CW)
9522220.0 ± 0.33.0 ± 0.22.38
black locust treeYan’an
(YA)
35°
(southwest)
25001710.2 ± 0.59.6 ± 0.23.83
jujube treeZhongwei
(ZW)
4171510.6 ± 0.54.3 ± 0.20.98
Notes: D represents tree density, defined as the number of trees per hectare (stems/ha).
Table 2. Summary table of significant parameters for differences in fitting functions before and after rainfall.
SpeciesPre-RainfallPost-RainfallDifference Between Coefficients
apple treesa = 1.298a = 1.107p < 0.05
b = 0.0194b = 0.0426p < 0.01
r2 = 0.8910r2 = 0.8436
p < 0.01p < 0.01
black locust treesa = 0.523a = 0.899p < 0.01
b = 0.109b = 0.0914p < 0.01
r2 = 0.8016r2 = 0.8551
p < 0.01p < 0.01
jujube treesa = 0.786a = 0.802p < 0.01
b = 0.045b = 0.051Not significant
r2 = 0.8050r2 = 0.8764
p < 0.01p < 0.01
Table 3. Table of specific hydraulic conductance values of xylem in the three tree species.
SpeciesApple TreesBlack Locust TreesJujube Trees
Xylem specific conductivity (Ks)
(kg m−1 Mpa−1 s−1)
1.47 ± 0.347.75 ± 1.770.03 ± 0.01
Disclaimer/Publisher’s Note: The statements, opinions and data contained in all publications are solely those of the individual author(s) and contributor(s) and not of MDPI and/or the editor(s). MDPI and/or the editor(s) disclaim responsibility for any injury to people or property resulting from any ideas, methods, instructions or products referred to in the content.