Abstract
This study delivers a pioneering, high-resolution hydrogeochemical assessment of surface waters in the Upper Velhas and Upper Paraopeba river basins within Brazil’s Iron Quadrangle—an area of critical socioeconomic importance marked by intensive mining and urbanization. Through a dense sampling network of 315 surface water points (one every 23 km2), the research generates an unprecedented spatial dataset, enabling the identification of contamination hotspots and the differentiation between lithogenic and anthropogenic sources of potentially toxic elements (PTEs). Statistical methods, including exploratory data analysis and cluster analysis, were applied to determine background and anomalous concentrations of potentially toxic elements (PTEs). Geospatial distribution maps were generated using GIS. The results revealed widespread contamination by As, Cd, Cr, Ni, Pb, and Zn, with many samples exceeding Brazilian, European, and global drinking water standards. Arsenic and cadmium anomalies in rural and peri-urban communities raise concerns due to the direct consumption of contaminated water. The innovative application of dense spatial sampling and integrated geostatistical methods offers new insights into the pathways and sources of PTE pollution, identifying specific lithological units (e.g., gold schists, mafic intrusions) and land uses (e.g., urban effluents, mining sites) associated with elevated contaminant levels. By establishing robust regional geochemical baselines and source attributions, this study sets a new standard for environmental monitoring in mining-impacted watersheds and provides a replicable framework for water governance, environmental licensing, and risk management in similar regions worldwide.
1. Introduction
The contamination of surface waters by potentially toxic elements (PTEs) is a growing global concern in recent decades, as increasing human activity places mounting pressure on freshwater systems, driven by the ability of these elements to bioaccumulate in aquatic ecosystems and pose long-term risks to environmental and human health [1]. These contaminants can originate from a range of sources, including atmospheric deposition, natural geological weathering, and the discharge of untreated agricultural, industrial, and domestic effluents [2,3,4].
Exposure to PTEs has been linked to a wide array of health issues, including neurodegenerative disorders, cognitive impairment, hypertension, cancer, and even mortality [5,6]. Once introduced into aquatic environments, these elements can migrate into other environmental compartments such as soils, sediments, and biological tissues, ultimately entering the food chain and intensifying the risks to ecosystems and public health [3,7].
This issue is further exacerbated by rapid urbanization, demographic growth, agricultural expansion, and industrial development, which have contributed to the degradation and contamination of surface water resources worldwide [8,9,10]. These trends are particularly critical in developing countries, where land-use change and environmental degradation often outpace regulatory capacity and monitoring infrastructure [4,5,11].
Among the anthropogenic activities most strongly associated with surface water contamination, mining remains a significant and widespread contributor to elevated levels of heavy metals in aquatic systems [3,12,13,14,15,16]. Numerous studies worldwide have reported severe degradation in river basins affected by mining, including increased PTE concentrations, ecological imbalances, and health risks to local populations [16,17,18,19,20,21].
In Brazil, the Iron Quadrangle (IQ), located in the state of Minas Gerais, represents a region of strategic economic importance due to its mineral wealth and long-standing history of mining and steelmaking. Within this context, the Upper das Velhas and Upper Paraopeba river basins are particularly vulnerable, as they encompass densely populated areas, critical water supply sources, and regions heavily impacted by extractive activities. These basins have been extensively studied in the past two decades due to their diverse lithology and long-standing mining legacy [14,15,16,20,21,22,23,24,25,26,27,28,29].
However, many of these studies are limited by low spatial sampling density, restricted spatial coverage, or a lack of integration between geochemical, statistical, and spatial analysis.
To address these gaps, this study applies an innovative, high-density geochemical mapping strategy, involving the collection of 315 surface water samples from two major river basins within Brazil’s Iron Quadrangle—achieving an unprecedented spatial resolution of one sample per 23 km2. The dataset is analyzed using multivariate statistical techniques and integrated with GIS-based spatial modeling to produce a comprehensive assessment of water quality across the region.
The primary goals of this research are to identify the most prevalent potentially toxic elements (PTEs) in the surface waters of the Upper das Velhas and Upper Paraopeba river basins, determine the main sources of contamination—whether predominantly geogenic or linked to human activities such as mining and urbanization—and to locate the areas that pose the highest environmental and public health risks. By addressing these key questions, the study aims to generate scientifically robust data that can support effective environmental monitoring, guide informed decision-making, and contribute to the sustainable management of water resources in one of Brazil’s most environmentally sensitive and economically strategic mining regions.
2. Study Area
The Upper Rio das Velhas and Upper Paraopeba basins, situated in Minas Gerais, southeastern Brazil, are part of the São Francisco River system. These basins hold significant strategic value, both environmentally and economically, as they encompass a high concentration of industrial and mining activities. Additionally, they are essential for supplying water to the Metropolitan Region of Belo Horizonte (MRBH), which is home to more than 5.8 million people, making it the third-largest urban center in Brazil and the 52nd largest worldwide [30].
The Upper Rio das Velhas basin is located within the Iron Quadrangle (IQ), a region of historical and economic importance spanning roughly 3200 km2. Since the 17th century, during the early settlement of Minas Gerais, the area has undergone extensive urban development and mineral exploitation [31,32]. Its economy is strongly driven by mining—particularly of iron, gold, limestone, dolomite, bauxite, manganese, and topaz—alongside metallurgy, steel manufacturing, agriculture, and tourism [33].
The watershed is geographically bordered by Belo Horizonte to the north, Ouro Preto to the south-southeast, the Serra da Moeda to the west, and the Serra da Piedade to the east (Figure 1). The Rio das Velhas and its tributaries flow through a mosaic of land uses, from forested areas to densely urbanized zones and heavily mined landscapes. Mining activities—particularly for iron and gold—have significantly impacted water quality throughout the basin, with numerous studies reporting extensive contamination [14,15,21,24,26,29].
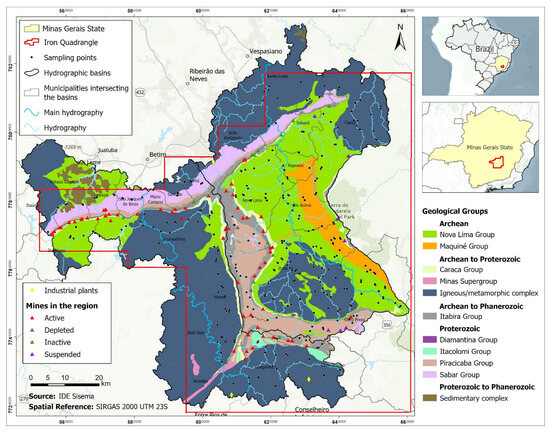
Figure 1.
Simplified geological map of the Upper Velhas River and Paraopeba basin showing the location of sampling points.
The Upper Paraopeba basin covers roughly 4120 km2 [34] and is home to over 1.3 million people [35], distributed among major municipalities such as Conselheiro Lafaiete, Congonhas, Ouro Branco, Jeceaba, Moeda, Brumadinho, Belo Vale, Sarzedo, and Belo Horizonte. It supplies approximately 53% of the water consumed in the MRBH [35]. Part of the basin lies within the Iron Quadrangle (IQ), an area of intense industrial activity, particularly steel production and mining of high-grade iron ore, construction materials (including sand and clay), and ornamental stones such as slate [35]. The Paraopeba River basin gained international attention after the 2019 Brumadinho tailings dam disaster, which caused severe environmental impacts [16].
The Upper Velhas and Upper Paraopeba basins are underlain by a similar geological framework, with the Moeda Ridge forming a key topographic and hydrological boundary between them. This prominent ridge, oriented north to south, consists primarily of ancient gneissic and granitoid rocks belonging to the Archean Bonfim Complex [36]. The broader region features a complex stratigraphy divided into five principal lithostratigraphic units, detailed in the following sections and depicted in Figure 1.
These units, listed from oldest to youngest, are as follows:
- (i)
- Metamorphic Complexes are units that form the Precambrian crystalline basement and are characterized by deformed tonalitic gneisses, granites, granodiorites, and mafic to ultramafic intrusions [37,38]. These rocks belong to the Bonfim, Belo Horizonte, and Divinópolis complexes (Upper Paraopeba basin), as well as the Bação, Caeté, and Santa Bárbara complexes (Upper Rio das Velhas basin) [39].
- (ii)
- The Rio das Velhas Supergroup, composed of metavolcanic and metasedimentary sequences, is divided into the Nova Lima and Maquiné groups. The Nova Lima Group is predominantly composed of volcano-sedimentary rocks such as carbonaceous schists, banded iron formations (BIFs), phyllites, and metacherts. The overlying Maquiné Group begins with metaconglomerates and transitions into thick beds of sericitic quartzites, phyllites, and quartz-rich schists. These formations mark an early Paleoproterozoic stage in the geological evolution of the region [36].
- (iii)
- The Minas Supergroup, which lies unconformably over the Rio das Velhas Supergroup, comprises predominantly pelitic and quartz-rich metasediments organized into four lithostratigraphic groups [40]. The basal Caraça Group consists of metaconglomerates and metarenites deposited in fluvial to shallow marine settings. It is overlain by the Itabira Group, dominated by chemical sedimentary rocks and iron-rich itabirites. Next is the Piracicaba Group, composed mainly of metapelites and interbedded chemical layers. The sequence concludes with the Sabará Group, consisting of terrigenous sediments including basal conglomeratic phyllites, possibly deposited during tectonically active stages of basin evolution [40].
- (iv)
- The Itacolomi Group, composed of quartzites and metaconglomerates, was deposited in fluvial-deltaic to shallow marine environments and marks a transitional Paleoproterozoic phase [40,41].
- (v)
- Tertiary and Quaternary deposits, comprising unconsolidated sediments associated with modern fluvial systems and weathering processes, represent ongoing sedimentation since the Cenozoic [40,41].
3. Materials and Methods
3.1. Sampling
To achieve a high sampling density, water samples were collected at the mouths of third-order drainage basins [42,43], as defined using ArcGIS 10.8 software. The selection process was carried out by overlaying topographic, hypsometric, and hydrographic maps at a 1:25,000 scale provided by the Institute of Water Management and the Geological Survey of Brazil. This approach led to the collection of 315 surface water samples in both basins, providing a sampling density of 1 sample per 23 km2 (Figure 1). Due to the high sample volume, samples were collected only once throughout the study.
Water samples were collected, filtered using a cellulose acetate membrane (Millipore, 0.45 μm, Darmstadt, Germany), and acidified with three drops of nitric acid. The collected samples were preserved and transported to the laboratory within a few hours, stored at 4 °C until analysis [44]. To complement the field data, in situ measurements were taken at each sampling point for pH, electrical conductivity (EC-μS cm−1), total dissolved solids (TDS-mg kg−1), and oxidation-reduction potential (ORP-mV), using a multiparameter probe (Ultrameter II, Myron L Company, Carlsbad, CA, USA).
3.2. Chemical Analyses and Quality Control
Water samples were analyzed for Al, As, Ca, Cd, Cr, Cu, Fe, K, Mg, Mn, Na, Ni, Pb, Ti, and Zn using inductively coupled plasma atomic emission spectrometry (ICP-AES; Spectro Ciros CCD). All analyses were performed at the Geochemistry Laboratory of the Federal University of Ouro Preto. Detection limits for each element are provided in Table 1. To ensure data accuracy, the concentration of each analyzed element was determined as the average of two measurements. Quality assurance procedures included the preparation of a blank every 10 samples and the duplicate analysis of 10% of the total sample set. Method accuracy was validated using certified reference material (NIST SRM 1643e—Trace Elements in Water), with measured concentrations showing recovery rates always between 86.8 and 105.7%, as presented in Table 2.

Table 1.
Detection limits for major, minor, and trace elements determined by ICP-AES.

Table 2.
Results for certified reference material (NIST SRM 1643e, trace elements in water, 50 mL).
3.3. Data Analysis
The entire dataset of water chemical analyses was subjected to exploratory data analysis using Minitab 18 software, and boxplot graphs were generated. To differentiate between normal concentrations and anomalies, the quartile separation method (Q1, Q2, and Q3) was employed to classify the data into reference values, high reference values, and outliers [45,46,47]. Anomalies were defined based on the boxplot’s upper inner fence (UIF), which is calculated by multiplying the interquartile range (IQR) by 1.5. Specifically, the anomaly threshold is determined by the formula: Q3 + 1.5 × (Q3 − Q1).
The data were also analyzed using cluster analysis (CA) to explore associations and variations in element concentrations across different locations. CA is a multivariate analytical technique that groups similar observations into classes, employing similarity or distance measures to form a dendrogram [48].
3.4. Geochemical Maps
The dataset generated from surface water samples was used to create iso-value maps illustrating the spatial distribution of PTEs in the study area. The GIS environment was designed according to the World Geodetic System 1984 (WGS84) datum, and the geostatistical interpolation tool Inverse Distance Weighting (IDW) was used using ArcGIS 10.8 software, selecting 15 points as nearest neighbors. This tool, which considers the Euclidean distance between two points to establish their spatial correlation, has already been adopted in numerous works and was chosen based on the proximity of the sample points, which reflects well the real values in areas with dense sampling [49,50,51].
4. Results
4.1. Elemental Concentrations and Comparative Data
Table 3 presents descriptive statistics for selected elements and compares the observed concentrations with global and European reference medians [52,53].

Table 3.
Descriptive statistics (for selected elements) of surface water samples from Upper Rio das Velhas and Upper Paraopeba Basin, Minas Gerais, Brazil, compared to data from Europe (EUR) and the world.
The concentration distributions of most elements were positively skewed, with mean values exceeding medians. This was especially pronounced for Cu, where the mean was 8.2 times higher than the median. Among major elements, the abundance order was Ca > Mg > K > Fe > Al > Mn, while for trace elements, the average concentration order was Zn > As > Cr > Cu > Ni > Pb.
Significant variability was observed in Al, Fe, Ca, and Mg, with maximum concentrations two to three orders of magnitude greater than minimum values. Among trace elements, Mn and Zn also displayed large concentration ranges, while As and Cd exhibited narrower distributions.
Table 4 compares maximum values from this study with those reported for other mining-impacted rivers worldwide. Likewise, the highest concentrations of Cd and Pb exceeded the reported values in most of the mining-impacted rivers shown in Table 4. When compared with prior studies in the same region, the concentrations of all PTEs were substantially higher, likely due to the greater sampling density used in this study, which included locations not previously investigated.

Table 4.
Ranges of PTEs concentrations in surface water samples from various rivers around the world and from the Velhas and Paraopeba river basins (µg·L−1).
4.2. Physicochemical Parameters
Table 5 presents the descriptive statistics of the physicochemical characteristics of the samples. The pH values ranged from 5.11 to 10.43, with 99.2% of samples falling within the acceptable range (5–9) established by Brazilian standards. Lower pH values were recorded in the Velhas basin (5.11 to 8.13), while higher values occurred in the Paraopeba basin (6.26 to 10.43), with the highest pH detected downstream of a steel plant in Congonhas.

Table 5.
Descriptive statistics of physicochemical parameters of surface waters samples from upper Rio das Velhas and Upper Paraopeba basin, Minas Gerais, Brazil.
Redox potential (ORP) values were predominantly oxidative, ranging from −49 to 325 mV. Reducing conditions were more frequent in the Paraopeba basin, especially in urbanized areas such as Ibirité, Itatiaiuçu, Igarapé, and Mateus Leme, where domestic sewage discharges were observed.
Electrical conductivity (EC) ranged from 4.2 to 476.3 µS·cm−1. Higher values were concentrated in regions under anthropogenic pressure, including Itabirito, Nova Lima, and Congonhas. A similar trend was observed for total dissolved solids (TDS), which ranged from 2.50 to 314 mg·L−1. Elevated EC and TDS values were generally co-located and often associated with urban wastewater inputs.
4.3. Classification of Contamination Levels and Spatial Distribution
Table 6 presents the classification of concentrations for selected PTEs using quartile-based thresholds and UIF (upper inner fence) values, alongside Brazilian drinking water standards [61].

Table 6.
Limits for drinking water, concentration ranges, classification of reference values, and percentage of sampling points exceeding the drinking water limits for PTEs in the surface waters of Upper Paraopeba and Velhas River basin.
For arsenic, 26.7% of the samples exceeded the limit of quantification (57.7 µg·L−1), with concentrations up to 414 µg·L−1. Most elevated values occurred in the Velhas basin, particularly in Ouro Preto, Rio Acima, Nova Lima, Raposos, and Caeté. The Paraopeba basin had only two quantifiable values above 90 µg·L−1 in a minimally impacted area in the city of Brumadinho (Figure 2).
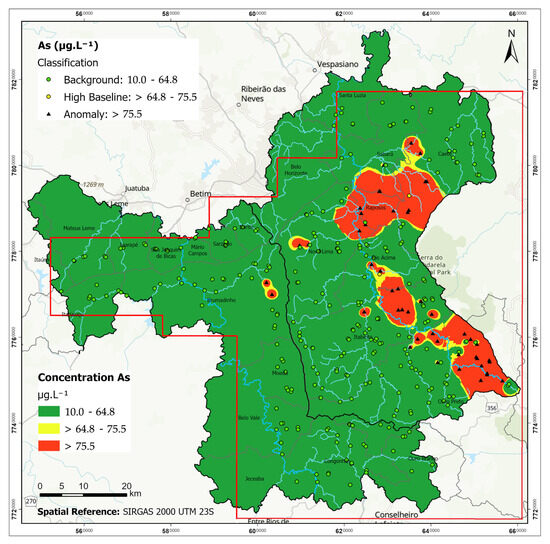
Figure 2.
As geochemical map of surface waters in Upper Velhas River and Paraopeba River basin, IQ region, Brazil.
Cadmium levels ranged from <5 to 19.6 µg·L−1, with 73% of values below the detection limit. Among quantifiable samples, 74 points exceeded the drinking water limit (5 µg·L−1). The spatial distribution (Figure 3) shows that most anomalies are observed in the Velhas basin, particularly in the headwaters and areas with mining or domestic effluent discharge.
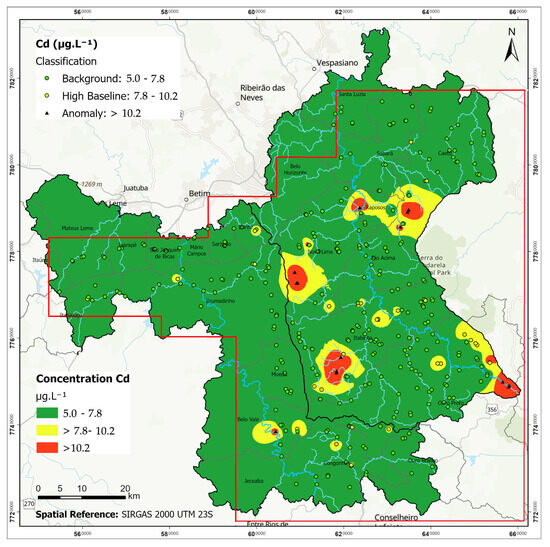
Figure 3.
Cd Geochemical map of Surface waters in Upper Velhas River and Paraopeba River basin, IQ region, Brazil.
Lead concentrations ranged from <7.2 to 201.4 µg·L−1. The median was 8.2 µg·L−1, while 25.3% of samples exceeded the national standard (10 µg·L−1). Approximately 75% of the samples showed lead concentrations of up to 21.3 μg·L−1, which can be considered representative of the regional background (Figure 4a). A total of 60 samples exceeded the anomaly threshold of 42.5 µg·L−1, with elevated values present in both basins.
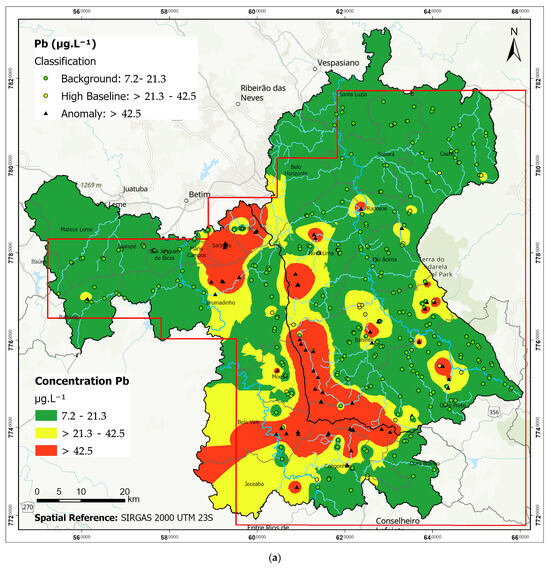
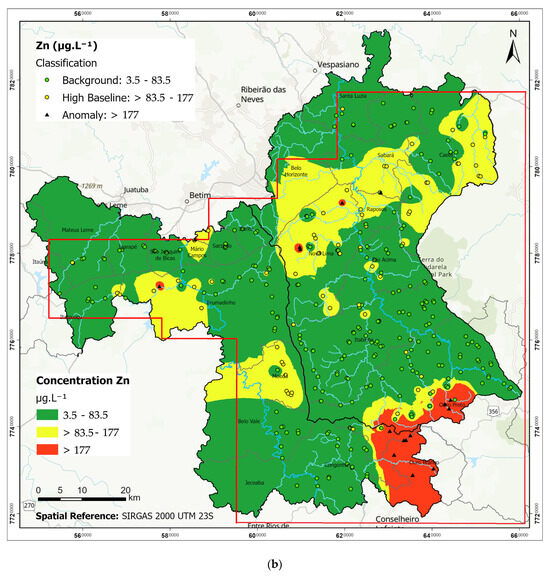
Figure 4.
Pb (a) and Zn (b) geochemical map of surface waters in Upper Velhas River and Paraopeba River basin, IQ region, Minas Gerais, Brazil.
Zinc ranged from <3.5 to 2198 µg·L−1, with a median of 45.3 µg·L−1. Only 2.8% of samples exceeded the Brazilian limit of 250 µg·L−1. Zn anomalies were spatially dispersed, occurring in both rural and urban areas, as well as in some environmentally protected zones. Concentrations above the UIF value (177 μg·L−1) were observed at 18 sites across the two basins (Figure 4b).
Chromium concentrations (Figure 5a) varied between <5.3 and 326.4 µg·L−1, with 38.3% of samples exceeding the drinking water threshold of 50 µg·L−1. Anomalies above 131.5 µg·L−1 were recorded in 18% of the samples. Nickel levels ranged from <20 to 264.7 µg·L−1 (Figure 5b). Seventy-five percent of samples were below 31.5 µg·L−1. A total of 57 anomalies were identified, with 10.1% of samples exceeding the Brazilian standard (70 µg·L−1).
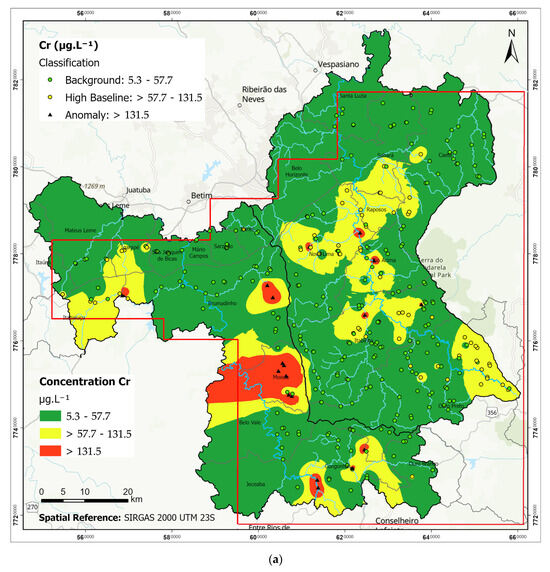
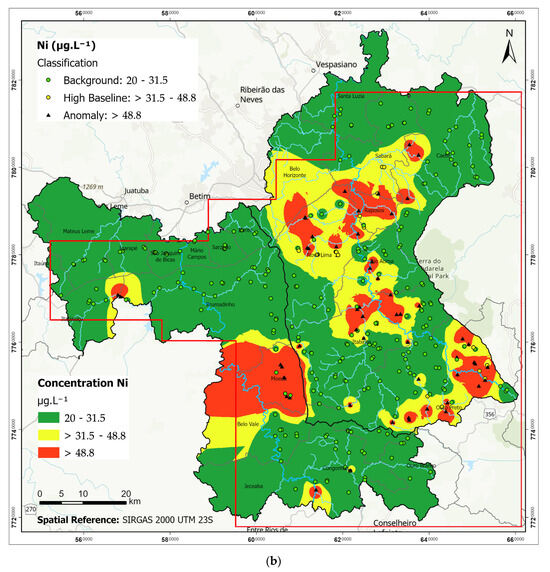
Figure 5.
Cr (a) and Ni (b) geochemical map of surface waters in Upper Velhas River and Paraopeba River basin, IQ region, Minas Gerais, Brazil.
Copper values ranged from <3.5 to 263.7 µg·L−1. Although no samples exceeded the national limit of 2000 µg·L−1, 2% of samples had concentrations above 162.9 µg·L−1 (UIF threshold), mainly in the Velhas basin. These anomalies, ranging from 164.7 to 263.8 μg·L−1, were spatially limited to an area of 0.2%. They were identified at six sites along the Rio das Velhas basin (Figure 6) and were located within the municipalities of Itabirito, Nova Lima, and Rio Acima.
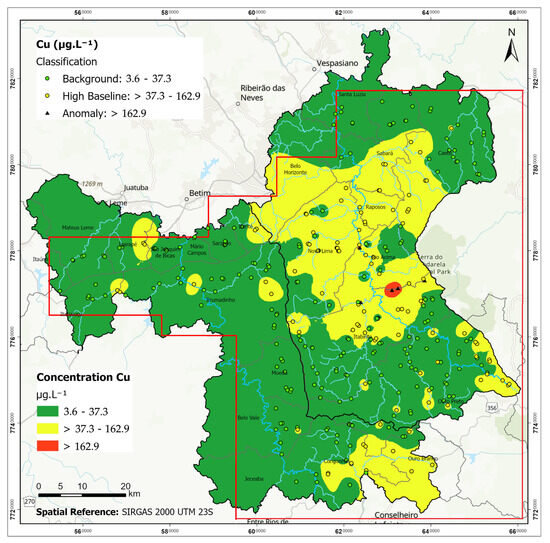
Figure 6.
Cu geochemical map of surface waters in Upper Velhas River and Paraopeba River basin, IQ region, Minas Gerais, Brazil.
4.4. Multivariate Analyses
Cluster analysis (CA) was applied to the geochemical dataset to identify patterns of elemental association in surface waters from the Upper Velhas and Upper Paraopeba basins. Three main clusters were identified among the major elements (Figure 7): Group I: Fe, Al, and Mn; Group II: Ca and Mg, and Group III: Na and K. Within Group I, Fe and Mn show closer proximity in the dendrogram, while Al appears at a greater distance, indicating lower similarity within the group. Group II elements, Ca and Mg, are closely associated, as are Na and K in Group III. Among the trace elements, three main clusters were identified (Figure 6): Group I: Ti and Zn, with a very strong correlation (R2 = 0.91); Group II: Cd and Pb, with a relatively low correlation, and Group III: Cr, Ni, Cu, and As.
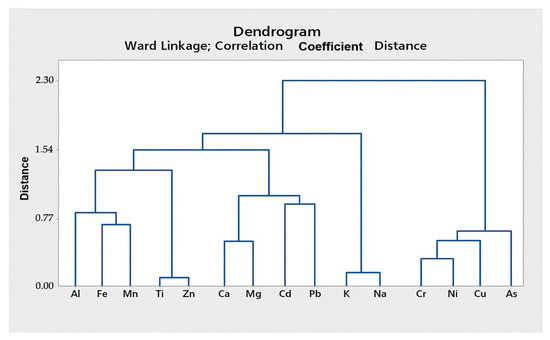
Figure 7.
Cluster analysis of major, minor and trace elements in surface waters in Upper Velhas River and Paraopeba River basin, IQ region, Minas Gerais, Brazil.
Ti and Zn form a tightly grouped pair, while Cd and Pb, although included in the same cluster, show greater internal distance. Cr, Ni, Cu, and As cluster together, but two subgroups are distinguishable: Cr and Ni show strong correlation (R2 = 0.67), whereas Cu and As are separated by a greater distance in the dendrogram, consistent with their low statistical correlation (R2 = 0.28).
Although Group I elements are classified within the same cluster, they are relatively distant from each other. However, it can be inferred that Fe and Mn are associated due to their significant presence in itabirites, hematites, and phyllites of the Minas Supergroup. Although Al is not associated with itabirites, it may be present in phyllites, and high concentrations have been observed in areas that drain over the aforementioned rocks in densely urbanized regions.
The results for Group II suggest that calcium and magnesium originate from similar geological sources, primarily linked to dolomites, limestones, and dolomitic itabirites within the Minas Supergroup—specifically the Itabira Group and Cauê Formation. In contrast, sodium and potassium (Group III) exhibit a strong geochemical affinity associated with granitic and gneissic rocks found in the region’s metamorphic complexes.
Regarding trace elements, three main groups were observed (Figure 7): Group I (Ti and Zn), Group II (Cd and Pb), and Group III (Cr, Ni, Cu, As). The elements in Group I showed a significant correlation (R2 = 0.91), and this association may be attributed to the presence of these elements in the phyllites and itabirites of the Minas Supergroup, as most joint anomalies were observed in areas draining over this lithotype.
Group II, involving Cd and Pb in the same cluster, showed the greatest relative distance between elements, indicating a low correlation. This association is believed to be related to the interaction between lithology (phyllites and itabirites) and anthropogenic activity, as joint anomalies of these elements were found in areas heavily impacted by mining activities.
In Group III, two trends can be observed, explained by the metallic associations of Co–Ni–Cr and Cu–As found in the schists of the Nova Lima Group (Rio das Velhas Supergroup), as identified in other studies [14,15,20,23,24,29]. These associations are related to sulfide veins and gold deposits occurring in the region. Cu and As show a greater distance between them, which is supported by their low correlation (R2 = 0.28). However, Cr and Ni show a high correlation (R2 = 0.67).
5. Discussion
The geochemical profiles of surface waters in the Upper Velhas and Upper Paraopeba basins reveal significant enrichment in PTEs, with concentrations well above regional and international baselines. The comparison with European and global reference medians [52,53] highlights the magnitude of contamination: Fe, Mn, and Zn presented median concentrations 5.2–16.9 times higher than the European values and 2.3–9.8 times higher than global medians (Table 2). However, the most extreme enrichments were observed for Pb and Cr, with median values up to 91 and 85.5 times higher than those reported for Europe and 273 and 32 times higher than global references, respectively.
This pronounced geochemical anomaly reflects the interplay between lithological controls and anthropogenic pressures. The elevated background levels of Fe, Mn, and Al align with the weathering of itabirites, phyllites, and hematite-bearing lithologies of the Minas Supergroup, particularly in areas affected by mining (Figure 1). The consistent association of Fe and Mn with these units confirms prior findings in iron ore provinces [62,63]. Similarly, high Zn concentrations, often co-occurring with Ti, suggest a strong lithogenic influence linked to phyllitic and itabiritic terrains, as supported by the strong correlation between these elements (R2 = 0.91).
In contrast, the distribution of As, Cr, Ni, and Cd reveals a strong spatial correlation with sulfide-rich lithologies, particularly the Nova Lima Group schists, which are known to harbor primary gold deposits and already naturally contain high levels of these elements [15,24,29]. Arsenic concentrations reached 414 µg·L−1, with 26.7% of samples exceeding the national limit of 10 µg·L−1 (Table 5). These values are mostly concentrated in the Rio das Velhas basin, particularly in Ouro Preto, Nova Lima, and Rio Acima (Figure 2), where arsenic-bearing minerals such as arsenopyrite, realgar, and arseniferous pyrite are abundant [24,25].
The spatial overlap between As and Cd anomalies is noteworthy. Despite a high quantification limit for Cd (5 µg·L−1), 74 samples surpassed this threshold, particularly in mining-influenced zones of Itabirito and Nova Lima (Figure 3). This co-occurrence is supported by previous studies [25] and suggests a mixed control involving both lithological sources and anthropogenic inputs, including mining and metallurgical effluent discharges.
Lead concentrations exhibited the largest anomalous area (13.8%), with values up to 201.4 µg·L−1 (Figure 4a), far exceeding the national limit (10 µg·L−1) in 25.3% of samples (Table 5). Elevated Pb levels were prevalent in both basins, notably in the southwestern Velhas basin and phyllite/itabirite domains of the Paraopeba basin, where mining activities are intensive.
Chromium and nickel displayed similarly elevated levels, with maximum of 326.4 and 264.7 µg·L−1, respectively, values that surpass other studies conducted in the same basins. Cr exceeded the drinking water limit (50 µg·L−1) in 38.3% of samples, while Ni surpassed its threshold (70 µg·L−1) in 10.1% (Table 5). The co-occurrence of Cr and Ni anomalies, especially in rural zones of Moeda and Nova Lima (Figure 5a,b), reflects their shared natural geogenic source in mafic dikes and ultramafic rocks, since the region does not have intense economic activities, consistent with known Cr–Ni associations in the Nova Lima Group [14,20].
Although Cu concentrations did not exceed national limits (2000 µg·L−1), localized anomalies (>162.9 µg·L−1) were detected at six sites in the Velhas basin (Figure 6), closely associated with the schists of the Nova Lima Group and areas with intense land use. Cu and As clustered together in the multivariate analysis (Figure 6), but with a weak correlation (R2 = 0.28), indicating distinct geochemical behaviors or source pathways.
The multivariate analysis (Figure 7) elucidates the geochemical structure of the region. Among the major elements, three groups were identified: Fe, Mn, and Al (Group I); Ca and Mg (Group II); and Na and K (Group III). Group I reflects the weathering of ferruginous rocks, especially in mining zones. Group II elements are derived from dolomitic and calcareous rocks, while Group III reflects contributions from silicate weathering in granitic and gneissic terrains. Among the trace elements analyzed, the Ti–Zn and Cd–Pb clusters indicate distinct geogenic associations, suggesting different lithological origins and sources of contamination. The Ti–Zn pair is related to volcano-sedimentary units, while the Cd–Pb association, in addition to reflecting natural components present in the iron formations of the Minas Supergroup and in metasedimentary rocks, also suggests strong anthropogenic influence, primarily linked to industrial, urban, and mining activities, which favor the accumulation of these metals in water systems. On the other hand, the Cr–Ni–Cu–As cluster reveals a clear relationship with the metallogenic patterns typical of the Nova Lima Group. These elements are commonly associated with mafic and ultramafic rocks, and especially with mineralized hydrothermal veins rich in sulfides, characteristic of the region’s gold mineralization [20,24,29].
Altogether, the integration of spatial distribution (Figure 2, Figure 3, Figure 4, Figure 5 and Figure 6), multivariate analysis (Figure 7), and regulatory comparison (Table 2 and Table 5) highlights the significant environmental burden on surface waters in these basins. The presence of multiple PTEs above legal thresholds, particularly in areas of limited water treatment and socioeconomically vulnerable populations, poses a tangible risk to human health. These findings emphasize the need for targeted environmental management and urgent public health interventions. Furthermore, the methodological approach adopted, based on dense spatial sampling, geochemical mapping, and multivariate interpretation, provides a valuable framework for water quality monitoring in other mining-impacted catchments.
6. Conclusions
This study provides a detailed geochemical assessment of surface water quality in two major river basins of Brazil’s Iron Quadrangle, revealing widespread contamination by potentially toxic elements (PTEs) such as arsenic, cadmium, chromium, and lead. Many concentrations exceed both national and international water quality standards, highlighting significant environmental and health risks.
Elevated PTEs levels were strongly linked to mining-affected lithologies and zones receiving untreated urban discharge. Critical risk areas include rural and peri-urban regions in the Velhas basin, where arsenic and cadmium pose long-term health threats, and the Paraopeba basin, where chromium and nickel anomalies are closely tied to mafic rock formations and industrial effluent sources, as these were observed in a region with intense metallurgical activity. Overall, the contamination patterns underscore the dual impact of natural geological background and human activities on regional water quality.
Through geochemical clustering and spatial analysis to differentiate lithogenic and anthropogenic sources, the study provides a clearer understanding of contamination pathways. This integrated approach enables more effective targeting of mitigation strategies and prioritization of monitoring efforts.
Importantly, this study advances regional water management by employing a high-resolution, replicable methodology that enhances source identification and contamination mapping. Unlike earlier research limited by low sampling density or coarse spatial resolution, this approach allows for more accurate environmental assessments in mining-affected areas.
The geochemical baselines, risk zones, and multielemental relationships identified here are directly applicable to monitoring programs, licensing decisions, and rehabilitation planning. These tools can also inform public policy aimed at safeguarding water resources and protecting vulnerable populations in other regions under similar pressures.
This research offers a scalable and replicable framework for water quality monitoring in mining-affected areas worldwide. The results are directly applicable to policy-making, environmental risk assessment, public health interventions, and watershed rehabilitation planning. In particular, the identification of vulnerable rural and peri-urban populations consuming contaminated water underscores the urgent need for targeted water treatment and governance measures. By bridging critical knowledge gaps and setting methodological standards, this study contributes significantly to both the science and practice of environmental geochemistry.
Author Contributions
Conceptualization, R.V., T.V., M.G.P.L., L.P.L., R.F. and H.A.N.J.; Methodology, R.V., M.G.P.L., R.F., L.P.L. and D.C.d.C.e.S.; Validation, R.V., R.F. and T.V.; Writing—original draft, R.V., T.V., R.F., M.G.P.L., L.P.L., H.A.N.J. and D.C.d.C.e.S.; Supervision, R.V., T.V., R.F. and M.G.P.L. All authors have read and agreed to the published version of the manuscript.
Funding
This research was supported by Multi-annual funding of ICT through the contract with the Foundation for Science and Technology (FCT), under project ID/04683. The authors highly appreciate the financial support of the institutions CNPq, FAPEMIG and mainly CAPES for the scholarship Proc. No. 10228/13-6.
Data Availability Statement
Data are contained within the article.
Acknowledgments
The authors highly appreciate the valuable comments of the anonymous reviewers.
Conflicts of Interest
The authors declare no conflicts of interest.
References
- Tscheikner-Gratl, F.; Bellos, V.; Schellart, A.; Moreno- Rodenas, A.; Muthusamy, M.; Langeveld, J.; Clemens, F.; Benedetti, L.; Rico-Ramirez, M.A.; Carvalho, R.F.; et al. Recent insights on uncertainties present in integrated catchment water quality modelling. Water Res. 2019, 150, 368–379. [Google Scholar] [CrossRef]
- Dawson, E.J.; Macklin, M.G. Speciation of heavy metals in floodplain and flood sediments: A reconnaissance survey of the Aire Valley, West Yorkshire, Great Britain. Environ. Geochem. Health 1998, 20, 67e76. [Google Scholar] [CrossRef]
- Salomons, W.; Forstner, U. Metals in the Hydrocycle; Springer: Berlin/Heidelberg, Germany, 2012. [Google Scholar] [CrossRef]
- Hemachandra, S.C.S.M.; Sewwandi, B.G.N. Application of water pollution and heavy metal pollution indices to evaluate the water quality in St. Sebastian Canal, Colombo, Sri Lanka. Environ. Nanotechnol. Monit. Manag. 2023, 20, 100790. [Google Scholar] [CrossRef]
- Kumar, V.; Parihar, R.D.; Sharma, A.; Bakshi, P.; Sidhu, G.P.S.; Bali, A.S.; Karaouzas, I.; Bhardwaj, R.; Thukral, A.S.; Gyasi-Agyei, Y.; et al. Global evaluation of heavy metal content in surface water bodies: A meta-analysis using heavy metal pollution indices and multivariate statistical analyses. Chemosphere 2019, 236, 124364. [Google Scholar] [CrossRef]
- Wongsasuluk, P.; Chotpantarat, S.; Siriwong, W.; Robson, M. Heavy metal contamination and human health risk assessment in drinking water from shallow groundwater wells in an agricultural area in Ubon Ratchathani province, Thailand. Environ. Geochem. Health 2014, 36, 169–182. [Google Scholar] [CrossRef]
- Yin, K.; Wang, Q.; Lv, M.; Chen, L. Microorganism remediation strategies towards heavy metals. Chem. Eng. J. 2019, 360, 1553–1563. [Google Scholar] [CrossRef]
- Vörösmarty, C.J.; McIntyre, P.B.; Gessner, M.O.; Dudgeon, D.; Prusevich, A.; Green, P.; Glidden, S.; Bunn, S.E.; Sullivan, C.A.; Reidy Liermann, C.; et al. Global threats to human water security and river biodiversity. Nature 2010, 467, 555–561. [Google Scholar] [CrossRef]
- Li, H.; Li, Y.; Lee, M.K.; Liu, Z.; Miao, C. Spatiotemporal analysis of heavy metal water pollution in transitional China. Sustainability 2015, 7, 9067–9087. [Google Scholar] [CrossRef]
- Qu, L.; Huang, H.; Xia, F.; Liu, Y.; Dahlgren, R.A.; Zhang, M.; Mei, K. Risk analysis of heavy metal concentration in surface waters across the rural-urban interface of the Wen-Rui Tang River, China. Environ. Pollut. 2018, 237, 639–649. [Google Scholar] [CrossRef]
- Kumar, V.; Sharma, A.; Kumar, R.; Bhardwaj, R.; Thukral, A.K.; Rodrigo-Comino, J. Assessment of heavy-metal pollution in three different Indian water bodies by combination of multivariate analysis and water pollution indices. Hum. Ecol. Risk Assess. Int. J. 2018, 26, 1–16. [Google Scholar] [CrossRef]
- Thornton, I. Environmental geochemistry: 40 years research at Imperial College, London, United Kingdom. Appl. Geochem. 2012, 27, 939–953. [Google Scholar] [CrossRef]
- Wolkersdorfer, C.; Mugova, E. Effects of mining on surface water. Encycl. Inland Waters 2022, 4, 170–188. [Google Scholar] [CrossRef]
- Matschullat, J.; Borba, R.P.; Deschamps, E.; Figueiredo, B.F.; Gabrio, T.; Schwenk, M. Human and environmental contamination in the Quadrilátero Ferrífero, Brazil. Appl. Geochem. 2000, 15, 181–190. [Google Scholar] [CrossRef]
- Vicq, R.; Matschullat, J.; Leite, M.G.P.; Nalini Junior, H.A.; Mendonça, F.P.C. Iron Quadrangle stream sediments, Brazil: Geochemical maps and reference values. Environ. Earth Sci. 2015, 74, 4407–4417. [Google Scholar] [CrossRef]
- Pacheco, F.A.L.; Valle Junior, R.F.d.; Melo, M.M.A.P.d.; Pissarra, T.C.T.; Souza Rolim, G.d.; Melo, M.C.d.; Valera, C.A.; Moura, J.P.; Fernandes, L.F.S. Geochemistry and contamination of sediments and water in rivers affected by the rupture of tailings dams (Brumadinho, Brazil). Appl. Geochem. 2023, 152, 105644. [Google Scholar] [CrossRef]
- Pyrgaki, K.; Gemeni, V.; Karkalis, C.; Koukouzas, N.; Koutsovitis, P.; Petrounias, P. Geochemical occurrence of rare earth elements in mining waste and mine water: A review. Minerals 2021, 11, 860. [Google Scholar] [CrossRef]
- Moldovan, A.; Török, A.I.; Kovacs, E.; Cadar, O.; Mirea, I.C.; Micle, V. Metal contents and pollution indices assessment of surface water, soil, and sediment from the Arieș River Basin Mining Area, Romania. Sustainability 2022, 14, 8024. [Google Scholar] [CrossRef]
- Gomes, P.; Valente, T. Seasonal impact of acid mine drainage on water quality and potential ecological risk in an old sulfide exploitation. Environ. Sci. Pollut. Res. 2024, 31, 21124–21135. [Google Scholar] [CrossRef]
- Costa, A.T. Registro Histórico de Contaminação Por Metais Pesados, Associadas à Exploração Aurífera No Alto e Médio Curso da Bacia do Ribeirão do Carmo, Quadrilátero Ferrífero, Minas Gerais: Um Estudo de Sedimentos de Planícies De Inundação e Terraços Aluviais. Ph.D. Thesis, Federal University of Ouro Preto, Departamento de Geologia, Programa de Pós-Graduação em Evolução Crustal e Recursos Naturais, Escola de Minas, Brazil, 2007. [Google Scholar]
- Deschamps, E.; Matschullat, J. Arsenic in the Environment. In Arsenic: Natural and Anthropogenic; CRC Press: Boca Raton, FL, USA, 2011; Volume 4, p. 209. [Google Scholar]
- Mendes, M.A.M. Influência Antrópica Nas Características Hidrossedimentológicas e Geoquímicas da Bacia do Ribeirão Caraça, Quadrilátero Ferrífero, Minas Gerais, Brasil. Master’s Thesis, Universidade Federal de Ouro Preto, Departamento de Geologia, Programa de Pós-Graduação em Evolução Crustal e Recursos Naturais, Escola de Minas, Brazil, 2007. [Google Scholar]
- Parra, R.R.; Roeser, H.M.P.; Leite, M.G.P.; Nalini, H.A.J.; Guimarães, A.T.A.; Pereira, J.C.; Friese, K. Influência antrópica na geoquímica de água e sedimentos do Rio Conceição, Quadrilátero Ferrífero, Minas Gerais–Brasil. Geochim. Bras. 2007, 21, 36–49. Available online: https://geobrasiliensis.org.br/geobrasiliensis/article/view/255/pdf (accessed on 8 January 2025).
- Pereira, J.C.; Guimarães-Silva, A.K.; Nalini, H.A.J.; Pacheco-Silva, E.; Lena, J.C.D. Distribuição, fracionamento e mobilidade de elementos traço em sedimentos superficiais. Quim. Nova 2007, 30, 1249–1255. [Google Scholar] [CrossRef]
- Varejão, E.V.; Bellato, C.R.; Fontes, M.P.F.; Mello, J.W.V. Arsenic and trace metals in river water and sediments from southeast portion of Quadrilátero Ferrífero, Brazil. Environ. Monit. Assess. 2010, 172, 631–642. [Google Scholar] [CrossRef]
- Mendonça, F.P.C. Influência da Mineração na Geoquímica Das Águas Superficiais e Nos Sedimentos No Alto Curso da Bacia do Ribeirão Mata Porcos, Quadrilátero Ferrífero, Minas Gerais. Master’s Thesis, Federal University of Ouro Preto, Departamento de Geologia, Programa de Pós-Graduação em Evolução Crustal e Recursos Naturais, Escola de Minas, Brazil, 2012. [Google Scholar]
- Leão, L.P.; Vicq, R.; Nalini, H.A., Jr.; Leite, M.G.P. Mapeamento Geoquímico do Manganês e Avaliação da Qualidade de Sedimentos Fluviais e Águas Superficiais do Quadrilátero Ferrífero, Brasil. In Anuário do Instituto de Geociências; Universidade Federal do Rio de Janeiro: Rio de Janeiro, Brazil, 2019; Volume 42, pp. 444–455. [Google Scholar] [CrossRef]
- Marques, E.D.; Castro, C.C.; de Assis Barros, R.; Lombello, J.C.; de Souza Marinho, M.; Araújo, J.C.S.; Santos, E.A. Geochemical mapping by stream sediments of the North West portion of Quadrilátero Ferrífero, Brazil: Application of the exploratory data analysis (EDA) and a proposal for generation of new gold targets in Pitangui gold district. J. Geochem. Explor. 2023, 250, 107232. [Google Scholar] [CrossRef]
- Vicq, R.; Leite, M.G.P.; Leão, L.P.; Nallini Júnior, H.A.; Valente, T. Geochemical Mapping and Reference Values of Potentially Toxic Elements in a Contaminated Mining Region: Upper Velhas River Basin Stream Sediments, Iron Quadrangle, Brazil. Minerals 2023, 13, 1545. [Google Scholar] [CrossRef]
- Instituto Brasileiro de Geografia e Estatística (IBGE) Censo Demográfico do Brasil. 2021. Available online: https://censo2022.ibge.gov.br/ (accessed on 15 December 2024).
- Larizzatti, J.H.; Marques, E.D.; Silveira, F.V. Geochemical Mapping of the Quadrilátero Ferrífero, Brazil and Surroundings; Informe de Recursos Minerais; (Série Metais-Informes Gerais 2); CPRM-Geological Survey of Brazil: Brasília, Brazil, 2014; p. 208. ISBN 978-85-7499-153-5. Available online: https://www.researchgate.net/publication/304580521_MAPEAMENTO_GEOQUIMICO_DO_QUADRILATERO_FERRIFERO_E_SEU_ENTORNO_Geochemical_Mapping_of_Iron_Quadrangle_and_Surroundings (accessed on 5 January 2025).
- Weber, A.A.; Moreira, D.P.; Melo, R.M.C.; Vieira, A.B.C.; Prado, P.S.; Silva, M.A.N.d.; Bazzoli, N.; Rizzo, E. Reproductive effects of oestrogenic endocrine disrupting chemicals in Astyanax rivularis inhabiting headwaters of the Velhas River, Brazil. Sci. Total Environ. 2017, 592, 693–703. [Google Scholar] [CrossRef]
- Nalini, H.A.J. Estudos Geoambientais No Quadrilátero Ferrífero: Mineração e Sustentabilidade; Departamento de Geologia Universidade Federal de Ouro Preto: Ouro Preto, Brazil, 2009; p. 52. [Google Scholar]
- Coelho Filho, J.A.; Durães, M.F. Hydrological regionalization of the annual maximum streamflows of the upper and middle Paraopeba river–MG using the index-flood technique. Rev. Eng. Agrícola 2022, 42, e20220035. [Google Scholar] [CrossRef]
- Soares, A.L.C. Bacia Hidrográfica do Rio Paraopeba: Análise Integrada Dos Diferentes Impactos Antrópicos. Ph.D. Thesis, Programa de Pós-Graduação em Saneamento, Meio Ambiente e Recursos Hídricos-Universidade Federal de Minas Gerais, Belo Horizonte, Brazil, 2021. Available online: https://bdtd.ibict.br/vufind/Record/UFMG_ba4d465404323b812b8cab356f4b4acd (accessed on 7 February 2025).
- Alkmim, F.F.; Teixeira, W. The Paleoproterozoic Mineiro Belt and the Quadrilátero Ferrífero. In São Francisco Craton, Eastern Brazil. Regional Geology Reviews; Heilbron, M., Cordani, U., Alkmim, F., Eds.; Springer: Cham, Switzerland, 2017. [Google Scholar] [CrossRef]
- Ladeira, E.A.; Roeser, H.M.P.; Tobschall, H.J. Evolução Petrogenética do Cinturão de Rochas Verdes, Rio das Velhas, Quadrilátero Ferrífero, Minas Gerais. In Proceedings of the Simpósio Geológico, Belo Horizonte, Brazil, 10–14 August 1983; pp. 149–165. [Google Scholar]
- Teixeira, W.; Sabate, P.; Barbosa, J.; Noce, C.M.; Carneiro, M.A. Archean and paleoproterozoic tectonic evolution of the São Francisco craton, Brazil. In Tectonic Evolution of South America; Instituto de Geociências, Universidade de São Paulo: São Paulo, Brazil, 2000; Available online: https://www.researchgate.net/publication/236348451_Archean_and_Paleoproterozoic_tectonic_evolution_of_the_Sao_Francisco_Craton_Brazil (accessed on 10 February 2025).
- Lobato, L.M.; Ribeiro-Rodrigues, L.C.; Zucchetti, M.; Noce, C.M.; Baltazar, O.F.; Silva, L.C.d.; Pinto, C.P. Brazil’s premier gold province. Part I: The tectonic, magmatic, and structural setting of the Archean Rio das Velhas greenstone belt, Quadrilátero Ferrífero. Miner. Depos. 2001, 36, 228–248. [Google Scholar] [CrossRef]
- Alkmim, F.F.; Marshak, S. Transamazonian orogeny in the southern São Francisco craton region, Minas Gerais, Brazil: Evidence for Paleoproterozoic collision and collapse in the Quadrilátero Ferrífero. Precambrian Res. 1998, 90, 29–58. [Google Scholar] [CrossRef]
- Dorr, J.N. Physiographic, Stratigraphic, and Structural Development of the Quadrilátero Ferrífero, Minas Gerais; Professional Paper; U.S. Geological Survey: Reston, VA, USA, 1969. [Google Scholar] [CrossRef]
- Bølviken, B.; Bogen, J.; Jartun, M.; Langedal, M.; Ottesen, R.T.; Volden, T. Overbank sediments: A natural bed blending sampling medium for large-scale geochemical mapping. Chemom. Intell. Lab. Syst. 2004, 74, 183–199. [Google Scholar] [CrossRef]
- Salminen, R.; Tarvainen, T.; Demetriades, A.; Duris, M.; Fordyce, F.M.; Gregorauskiene, V.; Kahelin, H.; Kivisilla, J.; Klaver, G.; Klein, H.; et al. Foregs Geochemical Mapping Field Manual; Guide 47; Geological Survey of Finland: Espoo, Finland, 2005; p. 36. Available online: https://www.researchgate.net/publication/237315248_FOREGS_geochemical_mapping_field_manual (accessed on 17 January 2025).
- USEPA-U.S. Environmental Protection Agency. Drinking Water Standards and Health Advisories: U.S. Environmental Protection Agency, Office of Water, EPA-822-B-00-001. 2000. Available online: https://www.epa.gov/sdwa/drinking-water-health-advisories-has (accessed on 21 April 2025).
- Smith, D.B.; Smith, S.M.; Horton, J.D. History and evaluation of a national scale geochemical data sets for the United States. Geosci. Front. 2013, 4, 167–183. [Google Scholar] [CrossRef]
- Reimann, C.; Caritat, P.d. Establishing geochemical background variation and threshold values for 59 elements in Australian surface soil. Sci. Total Environ. 2017, 578, 633–648. [Google Scholar] [CrossRef]
- Fernández-Caliani, J.C.; Romero-Baena, A.; González, I.; Galán, E. Geochemical anomalies of critical elements (Be, Co, Hf, Sb, Sc, Ta, V, W, Y and REE) in soils of western Andalusia (Spain). Appl. Clay Sci. 2020, 191, 105610. [Google Scholar] [CrossRef]
- Singh, K.P.; Malik, A.; Sinha, S. Water quality assessment and apportionment of pollution sources of Gomti river (India) using multivariate statistical techniques—A case study. Anal. Chim. Acta 2005, 538, 355–374. [Google Scholar] [CrossRef]
- Albanese, S.; Devivo, B.; Lima, A.; Cicchella, D. Geochemical background and baseline values of toxic elements in stream sediments of Campania region, Italy. J. Geochem. Explor. 2006, 93, 21–34. [Google Scholar] [CrossRef]
- Bai, J.; Porwal, A.; Hart, C.; Ford, A.; Yu, L. Mapping geochemical singularity using multifractal analysis: Application to anomaly definition on stream sediments data from Funin Sheet, Yunnan, China. J. Geochem. Explor. 2010, 104, 1–11. [Google Scholar] [CrossRef]
- Ranasinghe, P.N.; Fernando, G.W.A.R.; Dissanayake, C.B.; Rupasinghe, M.S.; Witter, D.L. Statistical evaluation of stream sediment geochemistry in interpreting the river catchment of high-grade metamorphic terrains. J. Geochem. Explor. 2009, 103, 97–114. [Google Scholar] [CrossRef]
- Forum of European Geological Surveys-FOREGS. Euro Geo Surveys: Geochemical Baseline Database, Geochemical Atlas of Europe, Part 1 and 2. 2005. Available online: http://weppi.gtk.fi/publ/foregsatlas/ (accessed on 11 April 2025).
- Reimann, C.; Caritat, P. Chemical Elements in the Environment: Factsheets for the Geochemist and Environmental Scientist; Springer: Berlin/Heidelberg, Germany, 1998; p. 398. [Google Scholar] [CrossRef]
- Sundaray, S.K.; Nayak, B.B.; Kanungo, T.K.; Bhatta, D. Dynamics and quantification of dissolved heavy metals in the Mahanadi River estuarine system, India. Environ. Monit. Assess. 2012, 184, 1157–1179. [Google Scholar] [CrossRef]
- Ali, M.M.; Ali, M.L.; Islam, M.S.; Rahman, M.Z. Preliminary assessment of heavy metals in water and sediment of Karnaphuli River, Bangladesh. Environ. Nanotechnol. Monit. Manag. 2016, 5, 27–35. [Google Scholar] [CrossRef]
- Edokpayi, J.N.; Odiyo, J.O.; Popoola, O.E.; Msagati, T.A.M. Assessment of tracemetals contamination of surface water and sediment: A case study of Mvudi River, South Africa. Sustainability 2016, 8, 135. [Google Scholar] [CrossRef]
- Custodio, M.; Alvarez, D.; Cuadrado, W.; Montalvo, R.; Ochoa, S. Potentially toxic metals and metalloids in surface water intended for human consumption and other uses in the Mantaro River watershed, Peru. Soil Water Res. 2020, 15, 237–245. [Google Scholar] [CrossRef]
- Mohanakavitha, T.; Divahar, R.; Meenambal, T.; Shankar, K.; Rawat, V.S.; Haile, T.D.; Gadafa, C. Dataset on the assessment of water quality of surface water in Kalingarayan Canal for heavy metal pollution, Tamil Nadu. Data Brief 2019, 22, 878–884. [Google Scholar] [CrossRef]
- Gonçalves, G.H.T. Avaliação Geoambiental de Bacias Contíguas Situadas na Área de Proteção Ambiental Cachoeira das Andorinhas e Floresta Estadual do Uaimii, Ouro Preto-Minas Gerais: Diagnóstico e Percepção Ambiental. Master’s Thesis, Federal University of Ouro Preto, Departamento de Geologia, Programa de Pós-Graduação em Evolução Crustal e Recursos Naturais, Escola de Minas, Brazil, 2010. [Google Scholar]
- IGAM–Instituto Mineiro de Gestão das Águas. Monitoramento da Qualidade das Águas Superficiais da Bacia do rio Paraopeba: Relatório Anual 2019; IGAM: Belo Horizonte, Brazil, 2020. Available online: http://repositorioigam.meioambiente.mg.gov.br/handle/123456789/198 (accessed on 2 January 2025).
- Brasil Ministério da Saúde. Portaria de Consolidação MS/GM n 5, de 28 de setembro de 2017. Consolidação das normas sobre as ações e os serviços de saúde do Sistema Único de Saúde. Anexo XX-Do controle e da vigilância da qualidade da água para consumo humano e seu padrão de potabilidade. In Diário Oficial da União, Brasília; Brasil Ministério da Saúde: Brasília, Brazil, 2017; pp. 360–568. Available online: https://portalsinan.saude.gov.br/images/documentos/Legislacoes/Portaria_Consolidacao_5_28_SETEMBRO_2017.pdf (accessed on 8 January 2025).
- Cheng, Z.; Xie, X.; Yao, W.; Feng, J.; Zhang, Q.; Fang, J. Multi-element geochemical mapping in Southern China. J. Geochem. Explor. 2014, 139, 183–192. [Google Scholar] [CrossRef] [PubMed]
- Merian, E.; Anke, M.; Ihnat, M.; Stoeppler, M. Elements and Their Compounds in the Environment: Occurrence, Analysis and Biological Relevance; WILEY-VCH Verlag GmbH & Co. KGaA: Hoboken, NJ, USA, 2004; Volume 1–3, p. 1773. ISBN 3-527-30459-2. [Google Scholar]
Disclaimer/Publisher’s Note: The statements, opinions and data contained in all publications are solely those of the individual author(s) and contributor(s) and not of MDPI and/or the editor(s). MDPI and/or the editor(s) disclaim responsibility for any injury to people or property resulting from any ideas, methods, instructions or products referred to in the content. |
© 2025 by the authors. Licensee MDPI, Basel, Switzerland. This article is an open access article distributed under the terms and conditions of the Creative Commons Attribution (CC BY) license (https://creativecommons.org/licenses/by/4.0/).