Abstract
Urban water supply pipelines play a critical role in ensuring the continuous delivery of water, and their failure during earthquakes can result in significant societal disruptions. This study proposes a seismic damage prediction method for urban buried water supply pipelines affected by seismic wave propagation, grounded in empirical data from past earthquake events. The method integrates key influencing factors, including pipeline material, diameter, joint type, age, and soil corrosivity. To enhance its practical applicability and address the challenge of quantifying soil corrosivity, a simplified classification approach is introduced. The proposed model is validated using observed pipeline damage data from the 2008 Wenchuan earthquake, with predicted results showing relatively good agreement with actual failure patterns, thereby demonstrating the model’s reliability for seismic risk assessment. Furthermore, the model is applied to assess potential earthquake-induced damage to buried pipelines in the city center of Ganzhou, and the corresponding results are presented. The findings support earthquake risk mitigation and the protection of urban infrastructure, while also providing valuable guidance for the replacement of aging pipelines and the enhancement of urban disaster resilience.
1. Introduction
Lifeline engineering is an important part of modern production and residents’ lives. The buried pipeline network carries urban water supply and gas supply and performs other transmission tasks. It is an indispensable part of guaranteeing the basic quality of life of urban residents and maintaining the operation of the city. With the continuous advancement of the urbanization process, the demand for water from residents has increased dramatically, leading to a rapid expansion in the scale of buried water supply pipelines. Taking China as an example, in 2022, the total length of urban water supply pipelines reached 959,600 km. In the event of a destructive earthquake, these pipelines will face high risks of damage, which can lead to water leakage or the interruption of water supply, seriously affecting the basic living standards of residents after the earthquake.
For example, the 1994 Northridge earthquake (MW 6.7) damaged key water pipelines in San Fernando Canyon, leading to prolonged water shortages for residents [1]. Similarly, the 2007 Niigata Chuetsu Oki earthquake (MW 6.8) disrupted the water supply in Kashiwazaki City, with emergency repairs taking 15 to 30 days [2]. The 2008 Wenchuan earthquake (MW 8.0) caused extensive disruptions to the water supply, marking the most severe infrastructure damage from an earthquake in China’s history [3]. Statistical analysis reveals that in the affected areas, particularly Dujiangyan City, pipelines sustained damage at a rate of 2.6 times per kilometer [4].
To reduce seismic risks for urban buried water supply pipelines, it is important to identify and strengthen or replace their weak points beforehand. Therefore, conducting earthquake disaster prediction analysis for urban buried pipelines is of great importance. Earthquake disaster prediction analysis usually involves assessing the possible damage to buried pipelines in the event of future earthquakes [5]. This method can identify potential hazards before earthquakes. It also aids in rapid assessment after an earthquake, enabling industries to quickly estimate the repair workload and develop scientific and effective repair plans.
Earthquake disaster prediction methods for buried pipelines mainly include theoretical and empirical analyses [6]. The theoretical analysis method is usually based on numerical modeling to simulate the damage of pipelines under earthquakes, such as in the study by Pan et al. [7]. The evaluation results of this kind of method are more accurate, but because of the need for fine modeling, the workload is larger and more complex. Therefore, it generally applies to cases with sufficient data needing high-precision prediction or an in-depth study of the pipeline failure mechanism.
The empirical analysis method is based on the statistical analysis of historical seismic damage data to predict the future damage of buried pipelines in earthquakes, such as in the studies by Eguchi [8], O’Rourke and Ayala [9], Isoyama et al. [10], and Pineda-Porras and Ordaz [11]. This kind of method is simple and can provide prediction results quickly. Therefore, it can be used for emergencies requiring quick preliminary prediction results, such as the emergency rescue stage after an earthquake, providing timely and effective guidance for decision-making.
Empirical analysis methods are widely utilized in earthquake disaster prediction for buried pipelines because of their simplicity and practicality. This is mainly because this method does not require complex theoretical support, can quickly provide prediction results, and meets the prediction needs of most engineering practices. However, most of the empirical analysis methods consider a relatively single factor, generally using seismic strength and pipe material as the main influencing factors. Examples include studies by Katayama et al. [12], O’Rourke et al. [13], and Hazus-MH [14]. While soil conditions are recognized as influential, their characterization in existing empirical models often remains rudimentary or overly complex.
For instance, some approaches classify soils primarily based on liquefaction susceptibility (e.g., Wang et al. [15], Isoyama et al. [10]), which does not directly address corrosion effects on pipelines, and seismic wave propagation and liquefaction effects are typically considered separately. Other methods, like that of Eidinger et al. [16], incorporate subjective corrosion factors but lack clear, quantifiable criteria for defining soil corrosivity, relying instead on engineering judgment. Recent efforts have sought to introduce quantifiable soil chemical properties. Notably, Li et al. [17] proposed a corrosion environment classification based solely on soil pH (acidic, near-neutral, or alkaline) for differentiated corrosion modeling, offering a more objective approach than subjective judgment. However, relying on a single parameter like pH may not fully capture the complexity of soil corrosivity.
Comprehensive soil corrosivity assessment methods do exist (e.g., the German Beckmann scoring method), aiming for accuracy by considering multiple factors. However, these methods typically require extensive and detailed soil data, which are often impractical to collect for large-scale pipeline network vulnerability assessments, especially in rapid prediction scenarios.
Therefore, this study uses the empirical analysis method to construct an earthquake disaster prediction model for urban buried water supply pipelines under wave propagation considering multiple factors, including soil corrosivity as a key environmental influence. The earthquake disaster prediction model proposed in this study integrates the characteristics of the pipeline itself and soil environmental factors. It aims to rapidly assess the damage to buried pipelines in earthquakes and improve the accuracy of these results. Specifically, to address the identified challenges in defining soil corrosivity—balancing the need for objectivity against the impracticality of comprehensive data collection—this study proposes a simplified and practical method for classifying soil corrosivity levels tailored for pipeline seismic vulnerability assessment. This enhancement improves the model’s practicality and applicability. Finally, earthquake disaster prediction analysis based on this model was conducted using the city center of the Ganzhou district as an example, verifying the model’s validity. This study is expected to provide assistance and reference for seismic risk management and urban infrastructure protection.
2. Technical Framework
This section details the complete process of earthquake disaster prediction work, as shown in Figure 1. It is intended to provide engineers and related researchers with a set of practical operational guidelines. These guidelines aim to effectively assess and predict the extent of damage that buried pipelines may suffer in an earthquake. The specific steps are as follows:
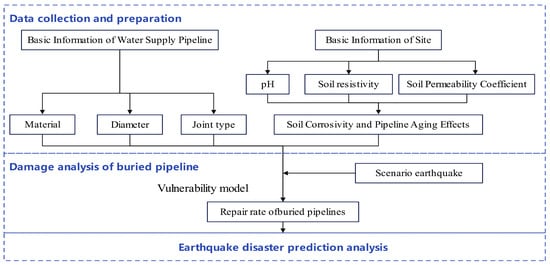
Figure 1.
The workflow diagram for earthquake disaster prediction.
- Data collection and preparation;
The study begins with the collection of essential attributes of the pipelines within the specified area. This includes information on the material, diameter, joint type, and age of the pipes. The required data can be sourced from local government authorities or water supply companies. Following this, the corrosivity of the soil surrounding the pipelines can be classified using the procedure outlined in Section 4.3.1. To complete this phase, seismic context data, such as peak ground acceleration, must also be gathered.
- 2.
- Damage analysis of buried pipeline;
Based on the seismic context data and basic pipeline information, the repair rate for buried pipelines in the study area can be estimated using the buried pipeline vulnerability function proposed in this study. In this study, the repair rate is defined as the number of individual repair sites per kilometer of pipeline, representing the spatial frequency of locations requiring repair. This includes both leaking and ruptured sections of the pipeline, rather than the total number of repair actions performed.
- 3.
- Earthquake disaster prediction analysis;
According to the pipeline repair rate, the damage status of the pipeline can be defined based on the principle of damage classification in the corresponding region. For example, in China, the damage classification can refer to the “Classification of Earthquake Damage to Lifeline Engineering (GB/T 24336-2009)” [18]. This standard categorizes damage into five levels based on the pipeline repair rate, representing the pipeline’s condition during an earthquake (Table 1).

Table 1.
Classification of damage to buried pipelines [18].
3. Date
Earthquake-induced damage to buried pipelines is primarily attributed to wave propagation, liquefaction, landslide, and fault offset. Among these factors, wave propagation is typically the leading cause of such damage [19]. For instance, Keith [20] analyzed pipeline damage in the East Bay Municipal Utility District under the HayWired earthquake scenario, revealing that wave propagation accounted for approximately 60% of the total damage. Based on these insights, the present study developed an empirically based earthquake disaster prediction model specifically for buried pipelines subjected to wave propagation. To construct this model, a dataset about pipeline damage caused by wave propagation was imperative. The following section elaborates on the methodology for data collection and processing.
3.1. Data Collection
This study collected data from 22 historical earthquakes between 1923 and 2009, totaling 352 sample points, to create an original seismic hazard dataset. This dataset includes some details such as the earthquake name, occurrence time, seismic strength, and pipeline repair rate. Some sample points also include other essential information about pipe material and diameter.
Since the sample points collected were from various countries, the expressions of seismic strength differed among them. These expressions are categorized into four types: Peak Ground Velocity (PGV), Peak Ground Acceleration (PGA), Modified Mercalli Intensity (MMI), and China Seismic Intensity Scale (CSIS). The distribution of sample points, using these four expressions combined with the pipeline repair rate, is shown in Figure 2.
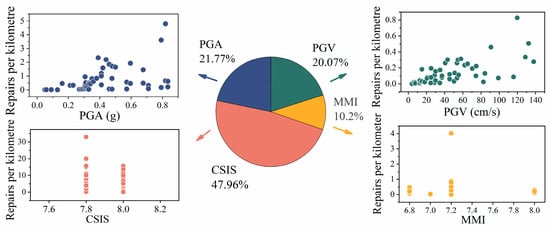
Figure 2.
Distribution of sample points in the original seismic hazard dataset.
This figure shows no significant difference in the number of sample points for different seismic strength expressions. However, to build the earthquake disaster prediction model, one of the seismic intensity expressions needs to be chosen for analysis. Additionally, there may be duplicate or abnormal points in the original dataset. So, it is necessary to process the original dataset to unify the analysis format.
3.2. Data Processing
This section aims to establish a dataset with a unified analysis format.
3.2.1. Data Filtering
Since this study focuses on buried pipelines under the action of wave propagation, it is necessary to exclude sample points that other factors, such as liquefaction, may have damaged.
At the time of constructing the original dataset, the data reference clearly stated that the data pertained to pipeline damage caused by wave propagation. For example, O’Rourke and Ayala [9] distinguished damage due to wave propagation from damage due to liquefaction by the method of Eguchi et al. [21]. Additionally, some sample points exhibited significantly higher repair rates than others under similar conditions. These anomaly sample points are believed to have been caused by factors like liquefaction. Therefore, these sample points were excluded.
3.2.2. Selecting the Appropriate Expression of Seismic Strength
From Figure 2, the expressions of seismic strength in the original seismic dataset mainly include PGA, PGV, MMI, and CSIS. The selection of PGA as the expression of seismic strength in this study is mainly based on the following considerations:
- The classifications of seismic intensity used in different countries are generally different. Therefore, to avoid the need for conversion between different national intensities when using earthquake disaster prediction models, it is not recommended to use national seismic intensities, including MMI and CSIS, to express seismic strength. It is worth noting that some sample points express seismic strength using the CSIS scale, providing additional valuable information, such as pipe diameter. These sample points support further investigation into other factors affecting the pipeline repair rate.
- PGA data can be directly obtained from seismic zoning maps in many countries and regions, such as China, the United States, and various European nations. This means that the earthquake disaster prediction model based on PGA as a parameter can conveniently refer to seismic zoning maps of various countries before earthquakes occur, enhancing the model’s practicality.
- Since most seismic stations directly measure acceleration data, using PGA as a parameter simplifies parameter conversion in post-earthquake assessment. This improves the efficiency and accuracy of emergency response.
The conversion methods for PGV and MMI to PGA are shown in Table 2. The method of Wen et al. [22] is applied to seismic events in China, while the method of Wald et al. [23] is applied to seismic events in other countries. These methods were chosen because they reference seismic events that are essentially the same as those referenced in this study. This ensures conversion accuracy and reduces modeling errors.
Table 2.
The conversion methods.
3.3. Data Analysis
Following data screening and adjustments, this study retained 208 sample points from 18 seismic events. According to the correlation between seismic intensity and peak ground acceleration (PGA) specified in the “Chinese Seismic Intensity Scale (GB/T 17742-2020)” [24], the PGA values were classified into five intervals: ≤0.01 g (≤Intensity VI), 0.01–0.20 g (Intensity VII), 0.20–0.41 g (Intensity VIII), 0.41–0.85 g (Intensity IX), and ≥0.85 g (≥Intensity X). This classification scheme was adopted to better characterize the distribution patterns of the sample data across different seismic intensity levels.
The sample point distribution was then analyzed by pipe material (Figure 3), including gray cast iron pipes (CI), ductile iron pipes (DI), steel pipes (S), and asbestos cement pipes (AC). The analysis revealed that the highest concentration of samples (0.20–0.41 g PGA range, corresponding to Intensity VIII) was observed in this moderate intensity range, with gray cast iron pipes being the predominant material type.
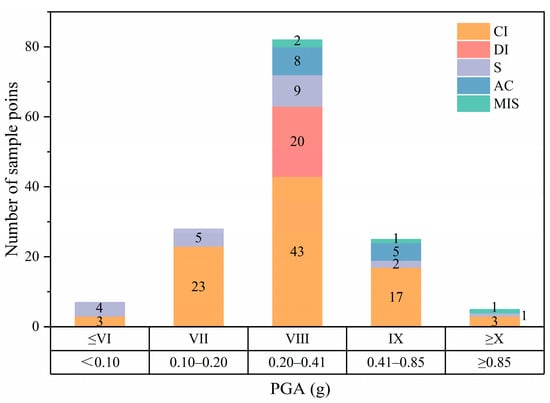
Figure 3.
Distribution of data points for different pipe materials.
4. Methodology
Earthquake disaster prediction work generally refers to assessing the potential damage to pipelines under a set seismic scenario using the pipeline vulnerability function based on the damage classification principle. The vulnerability function is the key to constructing the earthquake disaster prediction model. In this section, an earthquake disaster prediction model for buried pipelines under the action of wave propagation is constructed based on the seismic hazard dataset collated in Section 2. The model is built around the construction of the vulnerability function and considers various factors.
4.1. Preliminary Vulnerability Function
Before constructing the vulnerability function considering multiple factors, it is necessary first to select a specific pipeline type to establish a preliminary vulnerability function. This function reveals the pattern of the pipeline repair rate changing with PGA when seismic intensity is the sole influencing factor. Then, a correction factor is introduced to adjust the preliminary vulnerability function to comprehensively consider other factors, such as pipe materials and diameters. Thus, a vulnerability function considering multiple factors is constructed.
In this study, based on seismic damage examples and the types of existing urban buried pipelines, data for grey cast iron pipelines with a diameter of 300 mm or less were selected to fit the preliminary vulnerability function. There are two main reasons for choosing this type of pipeline:
- A relatively high number of sample points. As can be learned from Figure 3, the percentage of grey cast iron pipes in the seismic hazard dataset is relatively high. Because of this, grey cast iron pipes were chosen, considering the impact of data quantity on the model’s accuracy.
- This type of pipe is more likely to be damaged in future seismic events. Grey cast iron pipes are brittle materials with lower seismic resistance. Additionally, these pipes have usually been in use for a longer time, making them more vulnerable to damage in future seismic events. Therefore, studying the seismic performance of this type of pipe is more representative.
Through the above screening, 62 sample points were finally selected from the seismic hazard dataset. Due to the large dispersion of data, the study divided the PGA range to better identify the relationship between repair rate and PGA, as shown in Figure 4. It was found that PGA is positively correlated with the repair rate. Therefore, the study selected multiple positive-correlation function models for fitting, including the median model, the linear model, and the power model, as shown in Figure 5. The specific formulas are given by:
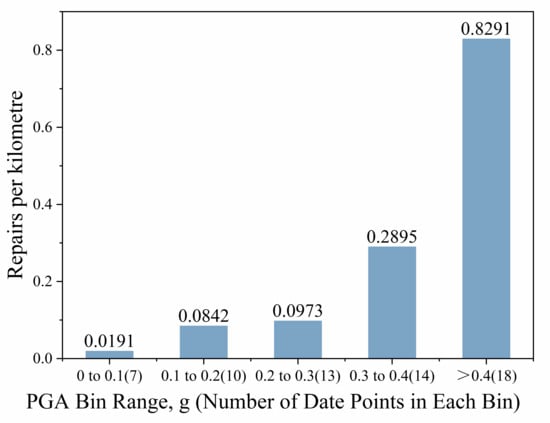
Figure 4.
Bin median values.
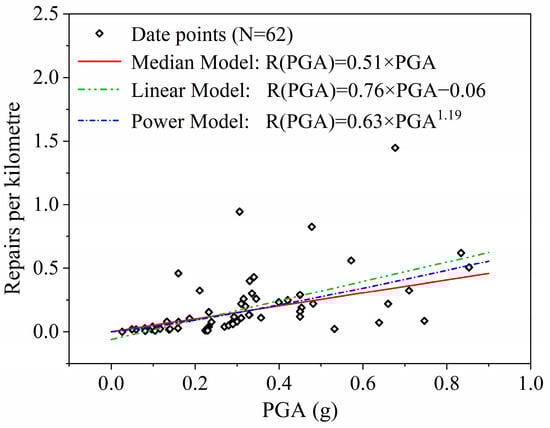
Figure 5.
Vulnerability functions.
- 1.
- Median Model:
- 2.
- Linear Model:
- 3.
- Power Model:
Examination of Figure 5 reveals that the three depicted curves exhibit a high degree of similarity. However, the linear and power models do not fit well, with coefficients of determination (R2) of 0.48 and 0.25, respectively. Two principal factors contribute to this phenomenon: First, after screening under certain conditions, the number of sample points available for fitting is relatively small. Second, other factors may interfere with the model, so subsequent studies need to comprehensively consider the effects of factors such as pipe diameter, interface, pipe age, and soil corrosivity on the seismic performance of pipelines. This suggests that relying on a single factor or a simple model may not fully reflect the actual performance of pipelines under seismic conditions.
This study refers to the method of Eidinger [16], which selects the median model to analyze the actual data distribution. Compared to the linear and power models, the median model can more accurately describe the range of pipe repair rate variation with PGA. It provides estimated regression coefficient values at different quartiles to depict its distribution.
The boundaries of the distribution were selected as the 84th and 16th percentiles. Specifically, out of the 62 sample points, 52 points fall below the upper boundary with a slope of 0.8992, and 10 points fall below the lower boundary with a slope of 0.1307, as shown in Figure 6. Meanwhile, assuming that the distribution within this range follows a lognormal distribution, the standard deviation can be calculated as β = 0.96. Based on this, the probabilistic variation of the buried pipeline repair rate with PGA is given by:
where PGA is the peak ground acceleration in g, denotes the pipe repair rate per kilometer based on the non-exceeding probability p under the action of wave propagation, denotes the average repair rate of buried pipelines under the action of wave propagation, and denotes the inverse standard normal cumulative distribution function evaluated at p.
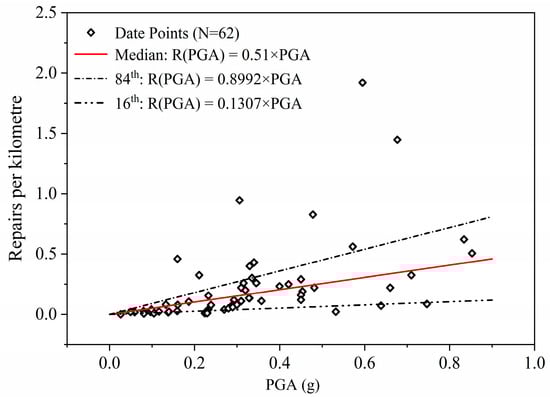
Figure 6.
Median, 84th, and 16th percentile functions.
4.2. Main Influencing Factors
Under the influence of earthquakes, the degree of damage to buried pipelines is affected not only by seismic strength but also by other factors. To construct a vulnerability function that considers multiple factors, this study selected five key factors for analysis: pipe material, diameter, joint type, pipe age, and soil corrosivity. The reasons for these selections are as follows:
- Material
Differences in pipe materials can directly lead to differences in their strength characteristics, affecting the extent of piping damage in an earthquake environment. The conventional wisdom is that brittle materials such as cast iron or asbestos cement are more susceptible to damage in earthquakes than flexible materials such as steel or ductile iron, with the repair rate for brittle pipelines generally being three times or more than that for flexible pipelines [25].
- 2.
- Diameter
Typically, larger-diameter pipes demonstrate enhanced seismic performance. The repair rate of buried pipelines of various diameters in different earthquakes has been statistically analyzed, as shown in Figure 7. From the figure, it is evident that in most cases, the repair rate of buried pipelines decreases with increasing pipe diameter.
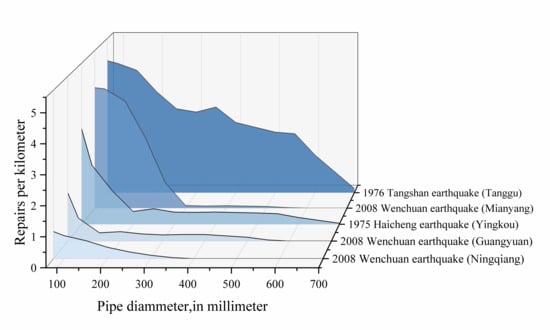
Figure 7.
The variation law of repair rate of buried pipelines with pipe diameter.
- 3.
- Joint type
According to construction practice, pipe joints are typically flexible or brittle. Flexible joints normally include rubber rings, lap-arc welded, etc.; brittle joints generally include cement mortar and screw connections. Specific joint types are listed in Table 3.
Table 3.
Classification of underground pipe joint types.
Usually, flexible joints’ seismic performance is much better than that of brittle joints. This is mainly due to the higher flexibility of the former, which can absorb more deformation, thus improving the seismic performance of the pipeline. For example, in the Haicheng earthquake, the seismic damage of flexible joints was significantly reduced relative to that of brittle joints, as shown in Table 4.
Table 4.
The repairs per kilometer for buried pipelines of different joint types.
- 4.
- Pipe age
In general, under the same seismic conditions, pipelines that have been in use for a longer time are more likely to be damaged. For example, in the 1975 Haicheng earthquake [26], the repair rate of buried pipelines in Haicheng City was significantly higher than that in other areas at the same intensity, as shown in Table 5. This was mainly due to the long service time of the pipelines in this region, which caused the protective coating of some pipelines to peel off before the earthquake occurred. This led to localized defects in these pipelines, resulting in a high repair rate in this region.
Table 5.
The repairs per kilometer for buried pipelines of different ages.
- 5.
- Soil corrosivity
Soil corrosivity refers to the ability of the soil to corrode metals and alloys. Differences in soil corrosivity in different areas result in varying levels of corrosion of existing metallic buried pipelines, which affects the seismic performance of the pipeline. Therefore, pipelines with extensive corrosion are more likely to be damaged in an earthquake.
Because of this, the study corrects the preliminary vulnerability function by introducing a correction factor K, to account for the influence of these five factors on the pipeline.
4.3. Correction Factor K
To construct a vulnerability function that considers multiple factors, the correction factor K is introduced into Equations (4) and (5). The specific functions can be written as:
where K is the correction factor.
This study used a weighted comprehensive evaluation method to determine the correction factor K. The specific expression is given by:
where i represents different influencing factors (i = 1, 2, 3,…, n), represents the weight of the i-th influencing factor, and represents the value of the i-th influencing factor.
4.3.1. Influencing Coefficient
- 1.
- Material
Eguchi [27] collected and analyzed the repair rates of pipes made from various materials under wave propagation. The results indicate that there are differences among different pipe materials. However, their response to earthquakes generally follows a similar pattern. All materials show an increase in damage with higher seismic strength.
To explore the differences between various pipe materials, this study selected sample points of different materials with pipe diameters less than or equal to 300 mm from the seismic hazard dataset. Then, separate linear fits were conducted for each type of pipe. To facilitate comparison, the intercept of the linear model is assumed to be zero. The results are presented in Figure 8, and the influence coefficients are determined by the ratio of the slope coefficients of each pipe, as shown in Table 6.
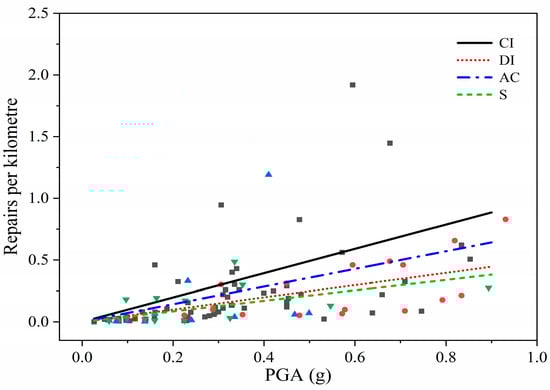
Figure 8.
Linear fits of seismic damage rates for different pipe materials (diameter ≤ 300 mm).
Table 6.
The ratio of slopes of different pipe materials.
The results show that ductile iron and steel pipes perform better than cast iron pipes, with repair rates about half as much as those under similar conditions. The difference between asbestos cement and cast iron pipes is not significant. This finding aligns with the conventional wisdom mentioned in Section 4.2. However, to account for possible sampling errors that could lead to biased results, corrections were made based on engineering experience. Additionally, the values of the influencing coefficient for reinforced concrete pipes (RC) and plastic pipes (PVC) were added. The end values of are shown in Table 7.
Table 7.
Material influence coefficient .
- 2.
- Diameter
This study selected sample points of grey cast iron pipes with different pipe diameters from the seismic hazard dataset. The data were then normalized to exclude the interference of seismic strength. Using the nonlinear curve fitting method, the relationship between the repair rate of buried pipes and pipe diameter was determined, as shown in Figure 9. The pipe diameter influence coefficient is given and shown in Table 8.
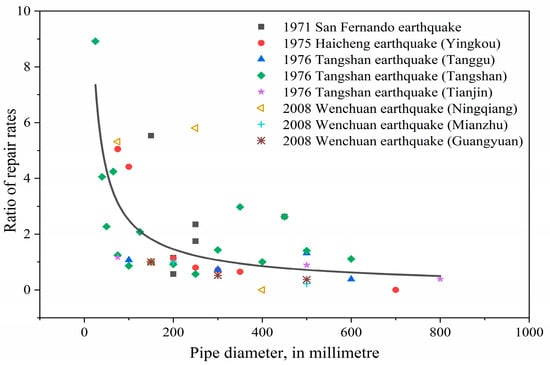
Figure 9.
Relationship between pipe diameter and repair rates.
Table 8.
Diameter influence coefficient .
- 3.
- Joint type
Data from multiple historical earthquake events and experimental studies by researchers consistently indicate that flexible joints exhibit significantly better seismic performance compared to rigid joints.
For example, in the 1975 Haicheng earthquake, asbestos cement pipes with rubber ring flexible joints (diameter: 500–600 mm) installed in Yingkou City, located in the intensity VIII zone, experienced no damage. In contrast, similar pipelines with rigid joints suffered a damage rate of 20 failures per kilometer. During the 2003 Tokachi-Oki earthquake in Japan (intensity X), 349 joint failures were observed in cast iron pipes with rigid joints, while only 3 cases of joint separation occurred in those with flexible joints [28].
In terms of experimental validation, Tsai [29] conducted laboratory cyclic loading tests on ductile iron pipes and polyvinyl chloride (PVC) pipes commonly used in the Chi-Chi area of Taiwan. The PVC pipes with rigid joints fractured during the first loading cycle, with a failure displacement of less than 0.04 mm. In contrast, the flexible joints (PVC/ductile iron) withstood 15 cycles of ±40 mm reciprocal displacement.
Based on existing evidence, the seismic performance coefficient for flexible joints was set as the reference value in this study ( = 1.0), while a higher coefficient was assigned to rigid joints ( = 1.2) to reflect their greater vulnerability under seismic loading. Although Table 3 classifies joints into two distinct categories—flexible (e.g., rubber rings, lap-arc welded) and rigid (e.g., cement mortar, screw joints)—actual engineering practices often involve joint types that do not strictly conform to this binary distinction. Examples include mechanical joints (e.g., socket connections sealed with cement caulking, asbestos cement, or lead), hybrid configurations that exhibit partial flexibility (e.g., prefabricated sleeve asbestos–cement joints), and composite-structure joints. To ensure methodological consistency and maintain a conservative safety margin, all such non-standard or intermediate joint types were uniformly assigned the coefficient for rigid joints ( = 1.2) in this study.
- 4.
- Soil Corrosivity and Pipeline Aging Effects
For buried metal pipelines, the corrosivity of the surrounding soil gradually reduces pipe wall thickness through chemical and electrochemical processes, thereby decreasing seismic performance. Based on “Corrosion of Metals and Alloys—Classification of Soil Corrosivit (GB/T 39637-2020)” [30] and the research by Wasim et al. [31], this study established a soil corrosivity evaluation system using three indicators: pH value, soil resistivity, and permeability coefficient (Table 9). The system classifies soils into three levels: Class I (non-corrosive), Class II (mildly corrosive), and Class III (strongly corrosive).
Table 9.
Evaluation scores for multiple indicators of soil corrosivity.
Based on actual soil data collected by Agbenowosi [32] (see Figure 10), it was found that soils with low resistivity and a low permeability coefficient generally exhibit higher corrosivity. Additionally, when the soil pH value falls within the range of 5 to 8, its impact on pipeline corrosion remains relatively stable. This observation further supports the scientific validity of the scoring system presented in Table 9.
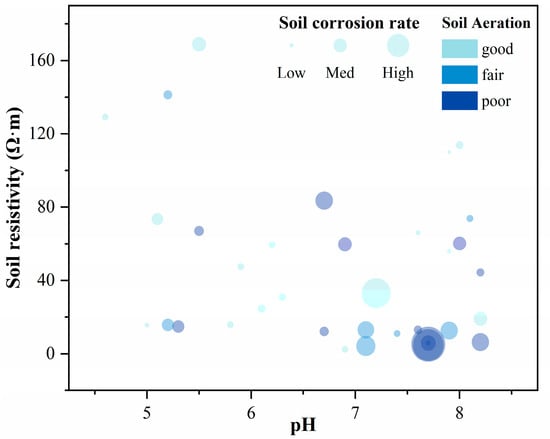
Figure 10.
Soil sample test data and pipeline corrosion measurement data.
Through further processing and analysis of the data, the average corrosion rates for soils of different corrosivity levels were calculated. The rates were found to be 0.0351 mm/year (Class I), 0.0535 mm/year (Class II), and 0.0898 mm/year (Class III), with a ratio of 0.7:1:1.7.
The impact of corrosion on pipeline seismic performance is indirectly reflected through changes in pipe wall thickness. Under seismic action, the forces acting on the pipeline include pipe stress caused by strong seismic waves, internal stress generated by the internal medium, and external pressure exerted by the soil on the pipeline. Changes in pipe wall thickness directly affect the magnitude and distribution of the latter two types of stress, thereby influencing the seismic performance of the pipeline.
Therefore, when converting the corrosion rate ratio into the influence parameter , it is necessary to adjust the values to better reflect the actual situation. After a comprehensive analysis, the initial values for Class I, Class II, and Class III soils were determined to be 0.8, 1, and 1.2, respectively.
As the service life of the pipeline increases, corrosion accumulates, leading to more severe damage in pipelines that have been in service for longer periods under the same environmental conditions. This increases the risk of pipeline failure during earthquakes. According to the research findings of Rajani [33] (Figure 11), it was observed that the corrosion rate decreases over time, and the cumulative corrosion thickness increases more slowly in the later stages of the pipeline’s life. Based on this, this study selected 30 years as a turning point and calculated the average corrosion thickness for different corrosivity levels. It was found that after 30 years, the average corrosion thickness is 1.78 times greater than before 30 years. Since the impact of pipe wall thickness on seismic performance is indirect, the ratio was adjusted accordingly. The final values for pipelines with different service times and corrosivity levels are shown in Table 10.
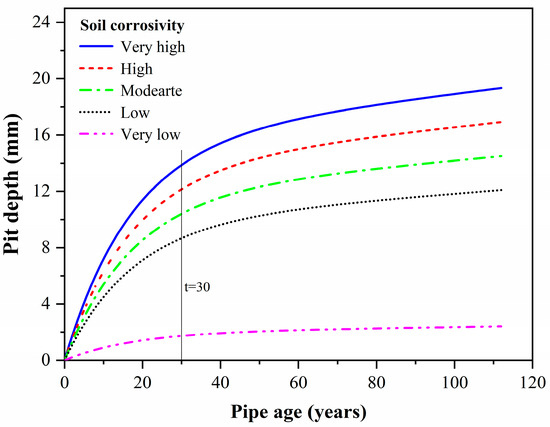
Figure 11.
Variation in pit depth over time in soils with different corrosivity.
Table 10.
Soil corrosivity and pipeline aging effects .
For buried plastic pipelines, the effects of soil corrosion are relatively minor. However, their seismic performance progressively degrades with increasing service life. This deterioration is primarily attributed to cyclic mechanical loading (including soil constraint stresses and freeze–thaw effects) and polymer aging. Due to the widespread absence of pipe age records in existing seismic damage datasets, this study adopts daily breakage rates as a proxy indicator for seismic performance, based on the premise that long-term material degradation affects both routine fracture resistance and seismic capacity.
Laven et al. [34], using decades of monitoring data from Toronto Water recorded as breaks per 100 km of pipeline per year, conducted rigorous statistical analyses and found that cast iron pipes exhibit significantly higher mean daily breakage rates than plastic pipes at equivalent service ages. Specifically, peak breakage rates reach 48 breaks/(100 km·year) for cast iron, compared to only 20 breaks/(100 km·year) for PVC pipes under similar conditions, yielding a ratio of 1:0.42.
Based on these findings, we initially established a baseline model for the seismic modification factor . The model, derived directly from the breakage rate ratio, suggests = 0.42 for pipelines <30 years old and = 0.52 for older systems. Considering the mechanistic differences between daily breakage and seismic damage, such as variations in loading rates and stress distribution adhering to engineering conservatism, the final adopted values were adjusted to = 0.60 for pipelines <30 years and = 0.70 for those >30 years. This calibrated approach preserves the observed material performance relationships while accounting for the specific demands of seismic loading scenarios.
4.3.2. Weights of Influencing Factors
The vulnerability of underground water supply pipelines to seismic damage is influenced by multiple factors, as discussed above. Accurately determining the weights () of these influencing factors is essential for constructing a reliable correction factor (). To balance expert judgment with data-driven analysis and to reduce potential biases inherent in single-method approaches, this study adopts a hybrid methodology that combines the Analytic Hierarchy Process (AHP) with Grey Relational Analysis (GRA). The initial weights derived from this combined approach are further refined through iterative optimization using historical seismic damage data.
- Initial Weight Determination Using AHP
The Analytic Hierarchy Process (AHP), a well-established multi-criteria decision-making method, effectively incorporates domain expert knowledge by structuring complex problems and enabling quantitative evaluations. This study focuses on four primary influencing factors: pipeline material (), pipe diameter (), joint type (), and the combined effects of soil corrosivity and pipeline aging (). Drawing on expert judgment, the relative importance of these factors is assessed through pairwise comparisons using the 1–9 scale method to construct a judgment matrix, as presented in Table 11.
Table 11.
Judgment matrix.
Based on the above judgment matrix, the weights of different influencing factors were calculated using the arithmetic mean method, and the results are given by:
where to correspond to the five influencing factors of pipe material, diameter, joint type, soil corrosivity, and pipeline aging effects.
- 2.
- Weight Determination Using GRA
To mitigate the influence of expert subjectivity, Grey Relational Analysis (GRA) is employed to quantify the impact of each influencing factor. GRA assesses the relative importance of factors by calculating the relational degree between each factor sequence and a reference sequence; in this study, the seismic damage rate served as the reference. This method is particularly well-suited for small-sample data analysis. Seismic damage records from 26 underground water supply pipelines affected by the Tangshan and Haicheng earthquakes were used as the basis for analysis. Due to incomplete data coverage for some factors, the dataset was divided into two groups for separate GRA calculations, and the results were subsequently integrated to derive the final weights. The analysis process and results are illustrated in Figure 12.
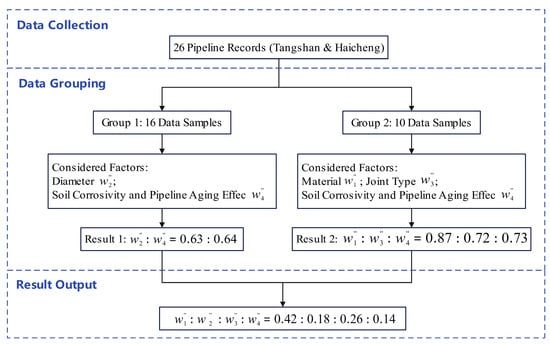
Figure 12.
Grey relational analysis process and results for influencing factor weights.
The weights obtained from the GRA analysis are as follows:
where to correspond to the five influencing factors of pipe material, diameter, joint type, soil corrosivity, and pipeline aging effects.
- 3.
- Integrated Weights of AHP and GRA
The AHP method fully reflects the systematic structure of domain expert knowledge, while GRA offers objective validation based on historical seismic damage data. Given the limitations in the coverage of influencing factors within the available seismic damage dataset, this study assigns greater weight to the AHP results (70%) and relatively less weight to the GRA results (30%) to capitalize on the strengths of both approaches. The final integrated weights were derived using a weighted average, as follows:
where to correspond to the five influencing factors of pipe material, diameter, joint type, soil corrosivity, and pipeline aging effects.
- 4.
- Weight Parameter Optimization Based on Seismic Damage Data
Although the combination of the Analytic Hierarchy Process (AHP) and Grey Relational Analysis (GRA) provides an initial estimate of the weights by integrating expert knowledge with historical data validation (Equation (12)), this estimate still requires further refinement and optimization using independent seismic damage data. This step is essential to enhance the objectivity and reliability of the model and to reduce its sensitivity to potential biases in the initial methods. To this end, 18 sample points were selected from the dataset to adjust the correction factor K. The final adjustment results are presented in Table 12.
Table 12.
Values of and .
4.4. Model Validation
To validate the reliability of the proposed multifactor model, this study analyzed pipeline damage data from the 2008 Wenchuan earthquake and conducted a comparative evaluation against the model developed by O’Rourke and Ayala [9]. The comparison results are shown in Table 13, while the correspondence between repair rate and damage level used in the evaluation is detailed in Table 1. Notably, the pipeline seismic damage assessment methodology proposed by O’Rourke and Ayala has been incorporated into the Hazus Earthquake Model Technical Manual (Hazus 4.2 SP3) issued by the U.S. Federal Emergency Management Agency (FEMA). The specific calculation formula is presented below:
where PGV is the peak ground velocity in cm/s. denotes the damage rate of buried pipelines under wave propagation, measured as the number of damaged locations per kilometer. K represents the correction coefficient. For asbestos–cement pipes, concrete pipes, and cast iron pipes, K = 1.0; For steel pipes, ductile iron pipes, and plastic pipes, K = 0.3.
Table 13.
Actual damage to pipelines in the Wenchuan earthquake and earthquake damage prediction results.
The results of the comparative analysis reveal discrepancies between the damage predictions of the O’Rourke and Ayala model and the observed outcomes from the Wenchuan earthquake, with the model generally showing a conservative bias. In contrast, the multifactor model proposed in this study, which incorporates key parameters such as pipe material properties, diameter, joint type, soil corrosiveness, and service life, demonstrates a relatively high level of predictive accuracy, with predicted and observed damage levels aligning in eight out of nine test cases. These results lend reasonable support to the reliability of the proposed model.
5. Case Study
Assume an MW 8.0 earthquake occurred at 2:00 a.m. on a workday in June 2022 at the junction of the Yumushan eastern margin and the Minle-Damaying fault in China. The epicenter was located at 100.5° E and 38.44° N. Figure 13 shows the seismic impact area of this earthquake scenario. Under this scenario, the city center of Ganzhou District falls within the VIII and IX (CSIS) intensity zones. This section evaluates the potential damage to buried water supply pipelines in the city center of Ganzhou District under this earthquake scenario.
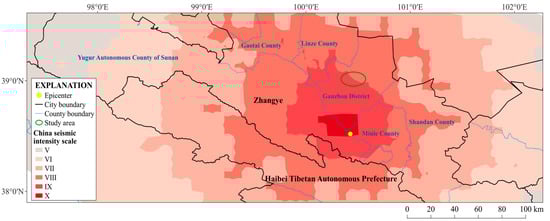
Figure 13.
Seismic impact area of the designated earthquake of MW 8.0.
5.1. Basic Characteristics of Buried Water Supply Pipelines in the Study Area
The total length of buried water supply pipes in the study area is 153.83 km. Figure 14 summarizes the distribution of pipes in the area by material and diameter. The figures indicate that ductile iron and plastic pipes are the predominant types of buried water supply pipes in the study area, while grey cast iron and steel pipes are less common. Additionally, there is a higher proportion of small-diameter pipes.
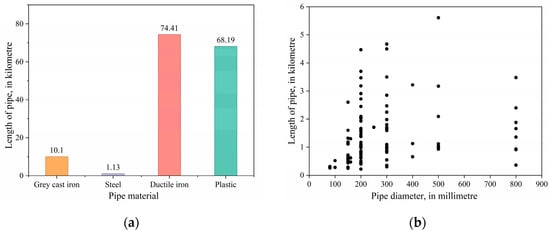
Figure 14.
Basic characteristics of buried water supply pipelines. (a) Material; (b) Diameter.
5.2. Earthquake Disaster Prediction Analysis Results of Buried Water Supply Pipelines in the Study Area
Based on the seismic input data and the buried pipeline information, the earthquake disaster prediction model proposed in this study can be used to determine the damage to buried pipelines under this seismic scenario. The specific results are shown in Figure 15 and Table 14.
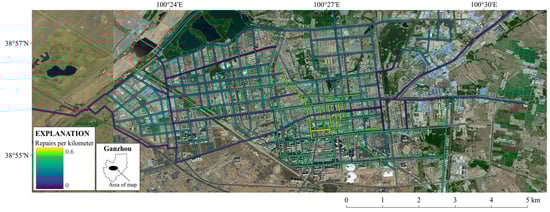
Figure 15.
Damage situation of buried pipelines in the study area.
Table 14.
Earthquake disaster prediction results of buried pipelines in the study area.
The results indicate approximately 0.25 repairs per kilometer of buried pipelines in this area, totaling around 44 breakage points, reflecting a moderate overall damage level. The higher repair rate of grey cast iron pipes is primarily attributed to their age and poor performance. Additionally, the majority of steel pipes in the region have small diameters, leading to relatively higher repair rates. However, since these two types of pipes represent a small proportion, their impact on the entire region is insignificant.
In summary, cast iron pipes generally have weaker seismic performance and are more prone to damage during earthquakes. Therefore, it is recommended that the proportion of ductile iron or plastic pipes be increased. Additionally, accelerating the replacement frequency of pipelines and replacing old pipelines can effectively improve the seismic performance of the entire city’s water supply pipelines.
6. Discussion
This study focuses on the seismic damage prediction of buried urban pipelines under the action of seismic waves and proposes a multi-factor prediction model that offers preliminary theoretical support and technical methods for seismic performance assessment. One of the key contributions of this work lies in the integration of multiple influencing factors—including pipeline material, diameter, joint type, soil corrosivity, and pipeline aging effects—into a unified analytical framework. The proposed model can assist in identifying potential weak links within pipeline systems, thereby enhancing early warning and risk management capabilities. In addition, this study proposes a simple and practical classification principle for soil corrosivity, which is specifically designed to account for the corrosive effects of surrounding soil on buried pipelines. This provides a useful basis for incorporating soil-induced corrosion into the seismic damage prediction process and enriches the range of influencing factors considered in the model.
Looking ahead, several directions can be pursued to further refine and extend this research. First, the availability of data for certain pipeline types, such as those involving special materials or small diameters, remains relatively limited. Future studies could improve the model’s accuracy by expanding the dataset through comprehensive post-earthquake investigations, integration of municipal infrastructure records, or targeted data collection initiatives. Second, although the model has been applied to the central urban area of Ganzhou District, its broader applicability has yet to be fully validated. Future studies are encouraged to test the model in regions with varying seismic intensities, geological conditions, and pipeline configurations. To support this, zoning strategies based on soil characteristics or urban infrastructure patterns could be developed, enabling region-specific calibration of influencing factors. Furthermore, future research could incorporate additional seismic hazards such as soil liquefaction and fault crossing, which are known to significantly impact pipeline performance. Integrating these factors through multi-hazard coupling analysis may offer a more comprehensive understanding of pipeline vulnerability under complex seismic scenarios. Lastly, distinguishing between different failure modes, such as leakage and rupture, could provide more nuanced insights for seismic risk assessment and emergency response planning.
In summary, this study establishes a practical and extensible framework for seismic damage prediction of buried pipelines, and future work is expected to build on this foundation to enhance its applicability and precision across diverse urban environments and seismic conditions.
Author Contributions
Conceptualization, L.Q., B.S., and N.W.; funding acquisition, B.S.; methodology, L.Q.; resources, B.S.; supervision, B.S. and N.W.; validation, B.S. and N.W.; visualization, L.Q.; writing—original draft, L.Q.; writing—review and editing, L.Q., B.S., and N.W. All authors have read and agreed to the published version of the manuscript.
Funding
This research was funded by National Natural Science Foundation of China, grant number U2239252; Key R&D Program of Heilongjiang Province, grant number GA22C001; and Institute of Engineering Mechanics, China Earthquake Administration, grant number 2021EEEVL0203.
Data Availability Statement
The data in this study have been explained in the article. For detailed data, please contact the first author or corresponding author.
Conflicts of Interest
The authors declare no conflicts of interest.
Abbreviations
The following abbreviations are used in this manuscript:
| CI | Grey Cast Iron Pipes |
| DI | Ductile Iron Pipes |
| S | Steel Pipes |
| AC | Asbestos–Cement Pipes |
| RC | Reinforced Concrete Pipes |
| PVC | Plastic Pipes |
| PGA | Peak Ground Acceleration |
| PGV | Peak Ground Velocity |
| MMI | Modified Mercalli Intensity |
| CSIS | China Seismic Intensity Scale |
References
- Todd, D.; Carino, N.; Chung, R.; Lew, H.; Taylor, A.; Walton, W. 1994 Northridge Earthquake: Performance of structures, lifelines and fire protection systems. In NIST Interagency/Internal Report (NISTIR); National Institute of Standards and Technology: Gaithersburg, MD, USA, 1994. [Google Scholar] [CrossRef]
- Apostolakis, G.; Qu, B.; Ecemis, N.; Dogruel, S. Field reconnaissance of the 2007 Niigata-Chuetsu Oki earthquake. Earthq. Eng. Eng. Vib. 2007, 6, 317–330. [Google Scholar] [CrossRef]
- Yuan, Y.F. Impact of intensity and loss assessment following the great Wenchuan Earthquake. Earthq. Eng. Eng. Vib. 2008, 7, 247–254. [Google Scholar] [CrossRef]
- Liu, S.Q.; Deng, X.M. Investigation Report on Seismic Hazards and Earthquake Relief of Urban Water Supply Systems in the Wenchuan Earthquake Substantial; Tongji University Press: Shanghai, China, 2013. [Google Scholar]
- Sun, B.T.; Li, Y. Evolution and development of earthquake disaster prediction in China. Eng. Mech. 2021, 38, 1–7. [Google Scholar]
- Qi, L.; Sun, B.; Zhang, G. Earthquake disaster prediction for urban water supply systems: A review of key technologies and a multilevel assessment framework. Nat. Hazards 2025. [Google Scholar] [CrossRef]
- Pan, H.Y.; Li, H.N.; Li, C.; Tian, L. Parametric study on seismic behaviors of a buried pipeline subjected to underground spatially correlated earthquake motions. J. Earthq. Eng. 2022, 26, 6329–6351. [Google Scholar] [CrossRef]
- Eguchi, R.T. Seismic hazard input for lifeline systems. Struct. Saf. 1991, 10, 193–198. [Google Scholar] [CrossRef]
- O’Rourke, M.; Ayala, G. Pipeline damage due to wave propagation. J. Geotech. Eng. 1993, 119, 1490–1498. [Google Scholar] [CrossRef]
- Isoyama, R.; Ishida, E.; Yune, K.; Shirozu, T. Seismic damage estimation procedure for water supply pipelines. Water Supply 2000, 18, 63–68. [Google Scholar]
- Pineda-Porras, O.; Ordaz, M. A new seismic intensity parameter to estimate damage in buried pipelines due to seismic wave propagation. J. Earthq. Eng. 2007, 11, 773–786. [Google Scholar] [CrossRef]
- Katayama, T.; Kubo, K.; Sato, N. Earthquake damage to water and gas distribution systems. In Proceedings of the U.S. National Conference on Earthquake Engineering, Ann Arbor, MI, USA, 18–20 June 1975. [Google Scholar]
- O’Rourke, T.D.; Jeon, S.S.; Toprak, S.; Cubrinovski, M.; Hughes, M.; van Ballegooy, S.; Bouziou, D. Earthquake response of underground pipeline networks in Christchurch, NZ. Earthq. Spectra 2014, 30, 183–204. [Google Scholar] [CrossRef]
- Federal Emergency Management Agency. Hazus 4.2 SP3: Hazus Earthquake Model Technical Manual; Federal Emergency Management Agency: Washington, DC, USA, 2020. [Google Scholar]
- Wang, D. Underground pipeline earthquake prediction prediction initial detection. J. Zhengzhou Univ. (Eng. Sci.) 1991, 12, 65–68. [Google Scholar]
- Eidinger, J. Seismic Fragility Formulations for Water Systems; American Lifelines Alliance: Washington, DC, USA, 2001; 96p. [Google Scholar]
- Long, L.; Yang, H.; Zheng, S.; Cai, Y. Seismic Resilience Evaluation of Urban Multi-Age Water Distribution Systems Considering Soil Corrosive Environments. Sustainability 2024, 16, 5126. [Google Scholar] [CrossRef]
- GB/T 24336-2009; Classification of Earthquake Damage to Lifeline Engineering. China Planning Press: Beijing, China, 2009.
- Ayala, A.G.; O’Rourke, M. Effects of the 1985 Michoacan Earthquake on Water Systems and Other Buried Lifelines in Mexico; Multidisciplinary Center for Earthquake Engineering Research: Buffalo, NY, USA, 1989. [Google Scholar]
- Porter, K.A. A New Model of Water-Network Resilience, with Application to the HayWired Scenario. In The HayWired Earthquake Scenario—Engineering Implications; Detweiler, S.T., Wein, A.M., Eds.; U.S. Geological Survey Scientific Investigations Report 2017–5013–I–Q; USGS: Washington, DC, USA, 2017; pp. 195–266. [Google Scholar] [CrossRef]
- Eguchi, R.; Taylor, C.; Hasselman, T. Seismic Component Vulnerability Models for Lifeline Risk Analysis; JH Wiggins: Redondo Beach, CA, USA, 1983. [Google Scholar]
- Wen, R.Z.; Ren, Y.F.; Wang, H.W.; Ji, K.; Xu, P.L. Analysis and Application of Strong Vibration Records; Seismological Press: Beijing, China, 2017. [Google Scholar]
- Wald, D.J.; Quitoriano, V.; Heaton, T.H.; Kanamori, H. Relationships between peak ground acceleration, peak ground velocity, and modified Mercalli intensity in California. Earthq. Spectra 1999, 15, 557–564. [Google Scholar] [CrossRef]
- GB/T 17742-2020; The Chinese Seismic Intensity Scale. China Planning Press: Beijing, China, 2020.
- Federal Emergency Management Agency. Earthquake Loss Estimation Methodology HAZUS 97: Technical Manual; Federal Emergency Management Agency: Washington, DC, USA, 1997. [Google Scholar]
- Wang, X.Y.; Cui, C.Q. Haicheng Earthquake Damage: Water Supply and Drainage Engineering Facilities; Seismological Press: Beijing, China, 1979. [Google Scholar]
- Eguchi, R.T. Early post-earthquake damage detection for underground lifelines. In Final Report to the National Science Foundation; Dames and Moore PC: Los Angeles, CA, USA, 1991. [Google Scholar]
- Her, S.H.; Liu, C.G. Seismic Reliability Study of Underground Pipelines; China Water & Power Press: Beijing, China, 2021. [Google Scholar]
- Tsai, J.S.; Jou, L.D.; Lin, S.H. Damage to buried water supply pipelines in the Chichi (Taiwan) earthquake and a preliminary evaluation of seismic resistance of pipe joints. J. Chin. Inst. Eng. 2000, 23, 395–408. [Google Scholar] [CrossRef]
- GB/T 39637-2020; Corrosion of Metals and Alloys—Classification of Soil Corrosivity. China Planning Press: Beijing, China, 2020.
- Wasim, M.; Shoaib, S.; Mubarak, N.M.; Inamuddin; Asiri, A.M. Factors influencing corrosion of metal pipes in soils. Environ. Chem. Lett. 2018, 16, 861–879. [Google Scholar] [CrossRef]
- Agbenowosi, N.K. A Mechanistic Analysis Based Decision Support System for Scheduling Optimal Pipeline Replacement. Ph.D. Thesis, Virginia Polytechnic Institute and State University, Blacksburg, VA, USA, 2000. [Google Scholar]
- Rajani, B.; Tesfamariam, S. Estimating time to failure of ageing cast iron water mains under uncertainties. ICE Water Manag. J. 2005, 160, 83–88. [Google Scholar]
- Laven, K.; Ge, S.; Dignum, M.; Zantingh, M.; Gill, N.; Ponnambalam, K.; Krinas, H. Age Is a Misunderstood Predictor of Pipe Failure Risk. Pipelines 2024, 73–82. [Google Scholar] [CrossRef]
Disclaimer/Publisher’s Note: The statements, opinions and data contained in all publications are solely those of the individual author(s) and contributor(s) and not of MDPI and/or the editor(s). MDPI and/or the editor(s) disclaim responsibility for any injury to people or property resulting from any ideas, methods, instructions or products referred to in the content. |
© 2025 by the authors. Licensee MDPI, Basel, Switzerland. This article is an open access article distributed under the terms and conditions of the Creative Commons Attribution (CC BY) license (https://creativecommons.org/licenses/by/4.0/).