Abstract
Natural wetlands are critical water quality regulators, especially in developing tropical countries. The Lubigi wetland is a large urban wetland in Kampala, the largest city in Uganda in Africa. We studied whether stormwater discharge and wastewater effluent from a nearby stormwater channel and a sewage treatment plant in the western part of the city were cleaned as they flowed through the wetland. Despite the significant pollution, the wetland removed ammonium-nitrogen, orthophosphate, and particulate nutrients during both seasons, achieving removal rates ranging from 50 to 60% for orthophosphate but only 20–40% for ammonium-nitrogen. Overall, seasonal differences in loads and retention rates of nutrient and organic matter inputs were minimal. Interestingly, the wetland mostly released nitrate and nitrite during water passage through the wetland, most likely due to the mineralization of organic nitrogen and agricultural run-off during rainy events in the wet season. However, the limited capacity of the sewage treatment plant and untreated stormwater discharge from the Nsooba main channel reduced the wetland’s ability to clean water. The insufficient carrying capacity of the treatment plant and the release of untreated sewage into the wetland significantly impact the self-purification capacity of the Lubigi wetland. Thus, the concept of Nature-Based Solutions is ineffective if the wetland systems are overloaded.
1. Introduction
Urban areas face enormous water pollution challenges in developing countries due to expanding urbanization, population growth, and malfunctioning infrastructure with inappropriate management regimes [1,2]. This development has led to a dramatic increase in the amount of wastewater generated, coupled with inefficient wastewater treatment due to irregular loads and intermittent flow regimes, further deteriorating the situation [3,4].
Wetlands have been proposed as Nature-Based Solutions (NBS) to address persistent water pollution, enhancing the retention and removal of contaminants [5,6]. The wetlands’ regulating and provisioning functions determine the removal of nutrient and organic inputs. These functions include physical, chemical, and biological retention mechanisms, such as microbial degradation, microbial and plant uptake, sorption, sedimentation, filtration, precipitation, and volatilization, amongst others [7,8]. Removal efficiencies of nutrient and organic matter inputs vary substantially in both space and time among wetlands due to the prevailing biotic (e.g., vegetation types, microbial communities) and abiotic (e.g., temperature, precipitation, hydrology, soil/sediment type) conditions [9].
Constructed wetlands have been increasingly used for wastewater treatment in the USA, Europe, and Asia, where wetland areas are often spatially restricted [10]. Constructed wetlands are characterized by enhanced hydraulic retention times, increased contact area, and a vegetation community, exhibiting high nutrient uptake rates to improve treatment efficiency of nutrient and organic matter inputs [10]. Determinants of treatment efficiencies are the pre-treatment of wastewater, macrophyte selection, use of siphons for better control of flow paths, and proper management of hydraulic retention times and loading rates [5]. Some studies have revealed the best performances in the reduction of Biological Oxygen Demand (BOD5), Total Suspended Solids (TSS), and Chemical Oxygen Demand (COD) in constructed wetlands with indigenous plants [5,11].
In Africa, natural wetlands are increasingly utilized as Nature-Based Solutions (NBS) for reducing water pollution due to their expansive area [12]. Inland wetlands constitute 58% of Africa’s total area, comprising 56% riverine wetlands, 23% lake wetlands, and 21% marsh wetlands, respectively [12]. Unlike constructed wetlands, natural wetlands possess unique flow regimes and vegetation shaped by climate, geology, soil conditions, and human activities [6]. Consequently, their removal efficiencies are variable and less predictable than those of constructed wetlands. Additionally, natural wetlands generally require minimal maintenance, which can lead to changes in the wetland that may facilitate or hinder further removal of nutrient and organic matter inputs. The continual introduction of stormwater discharge and wastewater effluent, for instance, influences the composition, diversity, viability, and activity of macrophyte communities and microbial biofilms, affecting the nutrient balance of the wetland [13,14].
While numerous studies have focused on temperate climate regions and constructed wetlands, more information is needed about the potential of large natural tropical wetlands to be used as NBS for nutrient mitigation [11]. Tropical areas are characterized by high air and water temperatures throughout the year, which is beneficial for biological uptake [15]. In contrast, huge hydrological differences between wet and dry seasons may drive the removal of nutrient and organic inputs [16]. Tropical wetlands are ecologically rich and hydrologically dynamic systems with immense potential for Nature-Based Solutions (NBS) to urban and peri-urban water pollution. These ecosystems facilitate critical water quality improvements without the infrastructure costs associated with centralized wastewater treatment systems [17]. In rapidly urbanizing tropical regions, where untreated stormwater discharge and wastewater effluent frequently enter the environment due to limited water infrastructure, natural wetlands represent a sustainable, adaptive approach for mitigating loads of nutrient and organic inputs. Their potential concerning the retention and removal of nutrient and organic inputs is known; however, information is scarce about the limits of natural wetlands working as NBS in the tropics [18]. The research will provide insightful information on the benefits and risks of natural wetlands receiving excess loading of untreated stormwater discharge and wastewater effluent. The findings will inform policy and practice in designing grey infrastructure (urban water systems) and green infrastructure (natural wetlands) used in polishing wastewater for improved urban river water quality as a sustainable wastewater treatment technology. Thus, our study aimed to determine the nutrient removal efficiency of a natural tropical wetland receiving both wastewater effluent and stormwater discharge from Kampala, the capital city of Uganda, during the wet and dry seasons. We conducted a field study of 30 water sampling campaigns at six sites along the wetland main channel for 15 months to establish the physico-chemical characteristics of surface water quality. We expected higher removal efficiency at higher dissolved and particulate concentrations and loadings of nutrient and organic matter inputs [8,19]; due to the dominance of wastewater effluent with the increased retention time within the wetland in the dry season than during the wet season. We also expected the removal of nutrient and organic matter inputs to vary among reaches with different vegetation types. According to the literature, P. mauritianus reaches were assumed to show high removal of solids [20], and C. papyrus vegetation had higher retention of dissolved nutrients attributed to higher biomass accumulation [21].
2. Materials and Methods
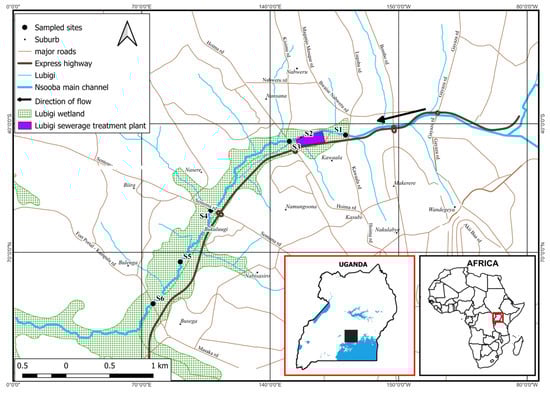
The study was conducted in the Lubigi wetland, an urban tropical wetland in the central area of Kampala, Uganda (Figure 1). The Lubigi wetland is a perennial shallow wetland mainly fed by surface water. The wetland experiences two rainy seasons, March to June and September to November, with occasional short but heavy rains even during the dry season. In 2014, upstream parts of the Lubigi wetland were drained to build a sewage treatment plant (STP), discharging its effluent into the wetland. Less than 2% of the inhabitants are connected to conventional wastewater treatment in the Greater Kampala Metropolitan area, with 56% of human waste safely managed [4]. This implies that the remaining urban dwellers rely on on-site sanitation services (OSS). The Nsooba main channel was constructed to improve flood and wastewater management. The STP treats domestic wastewater and fecal sludge from pit latrines and septic tanks with an average of 5400 m3 d−1 and a design capacity of 4000 m3 d−1 [22]. The Nsooba main channel receives untreated stormwater, municipal, and industrial wastewater from the upstream densely populated slums with a capacity of approximately 220,000 m3 d−1 [23,24].
Figure 1.
Map of the Lubigi wetland showing the Nsooba main channel, the Lubigi sewage treatment plant, and selected sampling sites S1–S6.
2.1. Sampling Scheme
Six sampling sites were selected along the Lubigi wetland based on vegetation types and distances to the pollution sources (Figure 1 and Table 1). The first two sampling points were in the Nsooba main channel upstream of the STP (S1) and at the STP (S2) outflow, with both sites dominated by V. cuspidata. Four additional sampling points were selected along the wetland downstream of the STP. S3 was located downstream of the junction of the STP outflow and the Nsooba main channel; S4 was located approximately 3 km downstream of S3 in a reach dominated by native P. mauritianus; S5 and S6 were situated approximately 1.5 and 1.3 km downstream of S4, respectively, in an area dominated by native C. papyrus.
Table 1.
Characteristics of sampling sites in the Lubigi wetland in 2022–2023.
Water samples were collected bi-weekly during the wet and dry seasons between January 2022 and May 2023 at sampling sites (S1, S2)-upstream, (S3, S4)-midstream and (S5, S6)-downstream) reaches of the Lubigi wetland (in total, 30 sampling campaigns, with 15 dates per season). Water samples were taken between 10 and 100 cm depth in the water column to avoid scum, using 500 mL clean plastic bottles. The water samples were taken and delivered to the National Water Quality Reference testing laboratory, an ISO/IEC 17025-accreditation laboratory, within 2–3 h of sampling, using a mobile laboratory van fitted with a sample fridge set between 4 and 8 °C to minimize deterioration. At the laboratory, the water analysis was conducted on the same day of delivery, and for parameters where storage was necessary, the water samples were stored in the laboratory refrigerators set, maintained, and monitored between 3 ± 5 °C. The internal quality control system of the National Water Quality Reference testing laboratory includes triplicate analysis of water samples and reporting averages, in addition to running analytical quality control samples at the start and in between samples. Dry and wet seasons were determined using climate data sets from the Uganda National Meteorological Authority in the Ministry of Water and Environment.
In situ measurements of water temperature, total dissolved solids (TDS), dissolved oxygen saturation (DO), pH, redox potential, and electrical conductivity were measured using the water probe AQUAREAD TRACE20 EUREKA 35, Eureka MANTA water probes (Austin, TX, USA). Discharge was determined at each sampling point and date using a portable flow meter HACH FH950, SIGMA (Loveland, CO, USA).
The physicochemical characteristics were determined according to the standard analytical methods for examining water and wastewater [25]. Unfiltered water samples were analyzed spectrophotometrically for Chemical Oxygen Demand (COD) and Biological Oxygen Demand (BOD5) for 5 days of incubation. The COD was determined calorimetrically using a spectrophotometer GalleryTM Plus Discrete Analyzer, Thermo Fischer SCIENTIFIC (Waltham, MA, USA). Total Suspended Solids (TSS) were determined by filtering the water samples through the 1.2 µm Whatman GFC filter paper and drying at 105 °C. Total nitrogen (TN) was analyzed via persulphate oxidation. Filtered water samples were used to analyze soluble reactive phosphorus (SRP), nitrate–nitrogen (NO3-N) and nitrite–nitrogen (NO2-N), ammonium–nitrogen (NH4-N) via the Nesslerization method, and nitrate–nitrogen via the cadmium reduction method Filtered water samples were used to analyze for soluble reactive phosphorus (SRP), nitrate-nitrogen (NO3-N) and nitrite-nitrogen (NO2-N), ammonium-nitrogen (NH4-N) via the Nesslerization method, and nitrate-nitrogen via the cadmium reduction method [25]. Nitrite–nitrogen was determined using a spectrophotometer using absorbance at 543 nm against a reagent blank. Nitrate–nitrogen was determined using the cadmium reduction method. At least one standard nitrite–nitrogen was compared to a reduced nitrate standard at the same concentration to verify reduction column efficiency [25]. Total phosphorus (TP) was determined colorimetrically by the persulphate digestion method. The SRP concentration was determined by the ascorbic acid method, and absorbance measurements were taken at 880 nm [25].
2.2. Data Analysis
Dissolved and particulate nutrient retention or release rates were calculated for each sub-reach (S3–S4, S4–S5, S5–S6; in g m−1 d−1) and the entire wetland (S3–S6; in kg d−1) by plotting the concentrations against stream length and multiplying the regression coefficient with discharge. Before doing this, nutrient changes over length were corrected by longitudinal conductivity changes to account for possible dilution effects.
Physico-chemical data were log-transformed [log(x + 1)] before analysis to meet the normality assumptions. Principal Component Analysis (PCA) was used to reduce the dimensions of factors based on PCA coordinates. Principal Components (PCs) were extracted based on eigenvalues greater than 1. PCA technique was combined with stepwise regression analysis to group the multivariate data set into fewer dimensions [26].
The effects of seasons and location (sampling sites) on physicochemical water quality factors were determined using one- and two-way ANOVA with Tukey posthoc tests. We used Pearson rank correlation coefficients to test for correlations between physicochemical parameters. R software programming version 4.3.2 was used for statistical analysis of the data.
3. Results
3.1. Spatial and Temporal Variations in Water Quality Parameters
3.1.1. Hydrology
The stormwater channel constituted the main inflow of the Lubigi wetland, showing a mean discharge that was 4–5 times larger than that of the outflow of wastewater effluent for STP (Table 2). In both seasons, the discharge decreased between S1, S2, and S3 (junction of the stormwater and the wastewater effluents) by approximately 50%, mainly due to the water withdrawals for domestic and agricultural production and increased again between S3 and S6 in the main channel due to lateral tributaries (Figure 1). Discharge was highest in the wet season, though this increase was more pronounced during the dry season.
Table 2.
Mean discharge ± standard deviation values (m3 s−1) of surface water in sampling sites from upstream, midstream, to downstream reaches of Lubigi wetland in the dry and wet seasons (n = 30).
3.1.2. Inflows of Stormwater Discharge and Wastewater Discharge
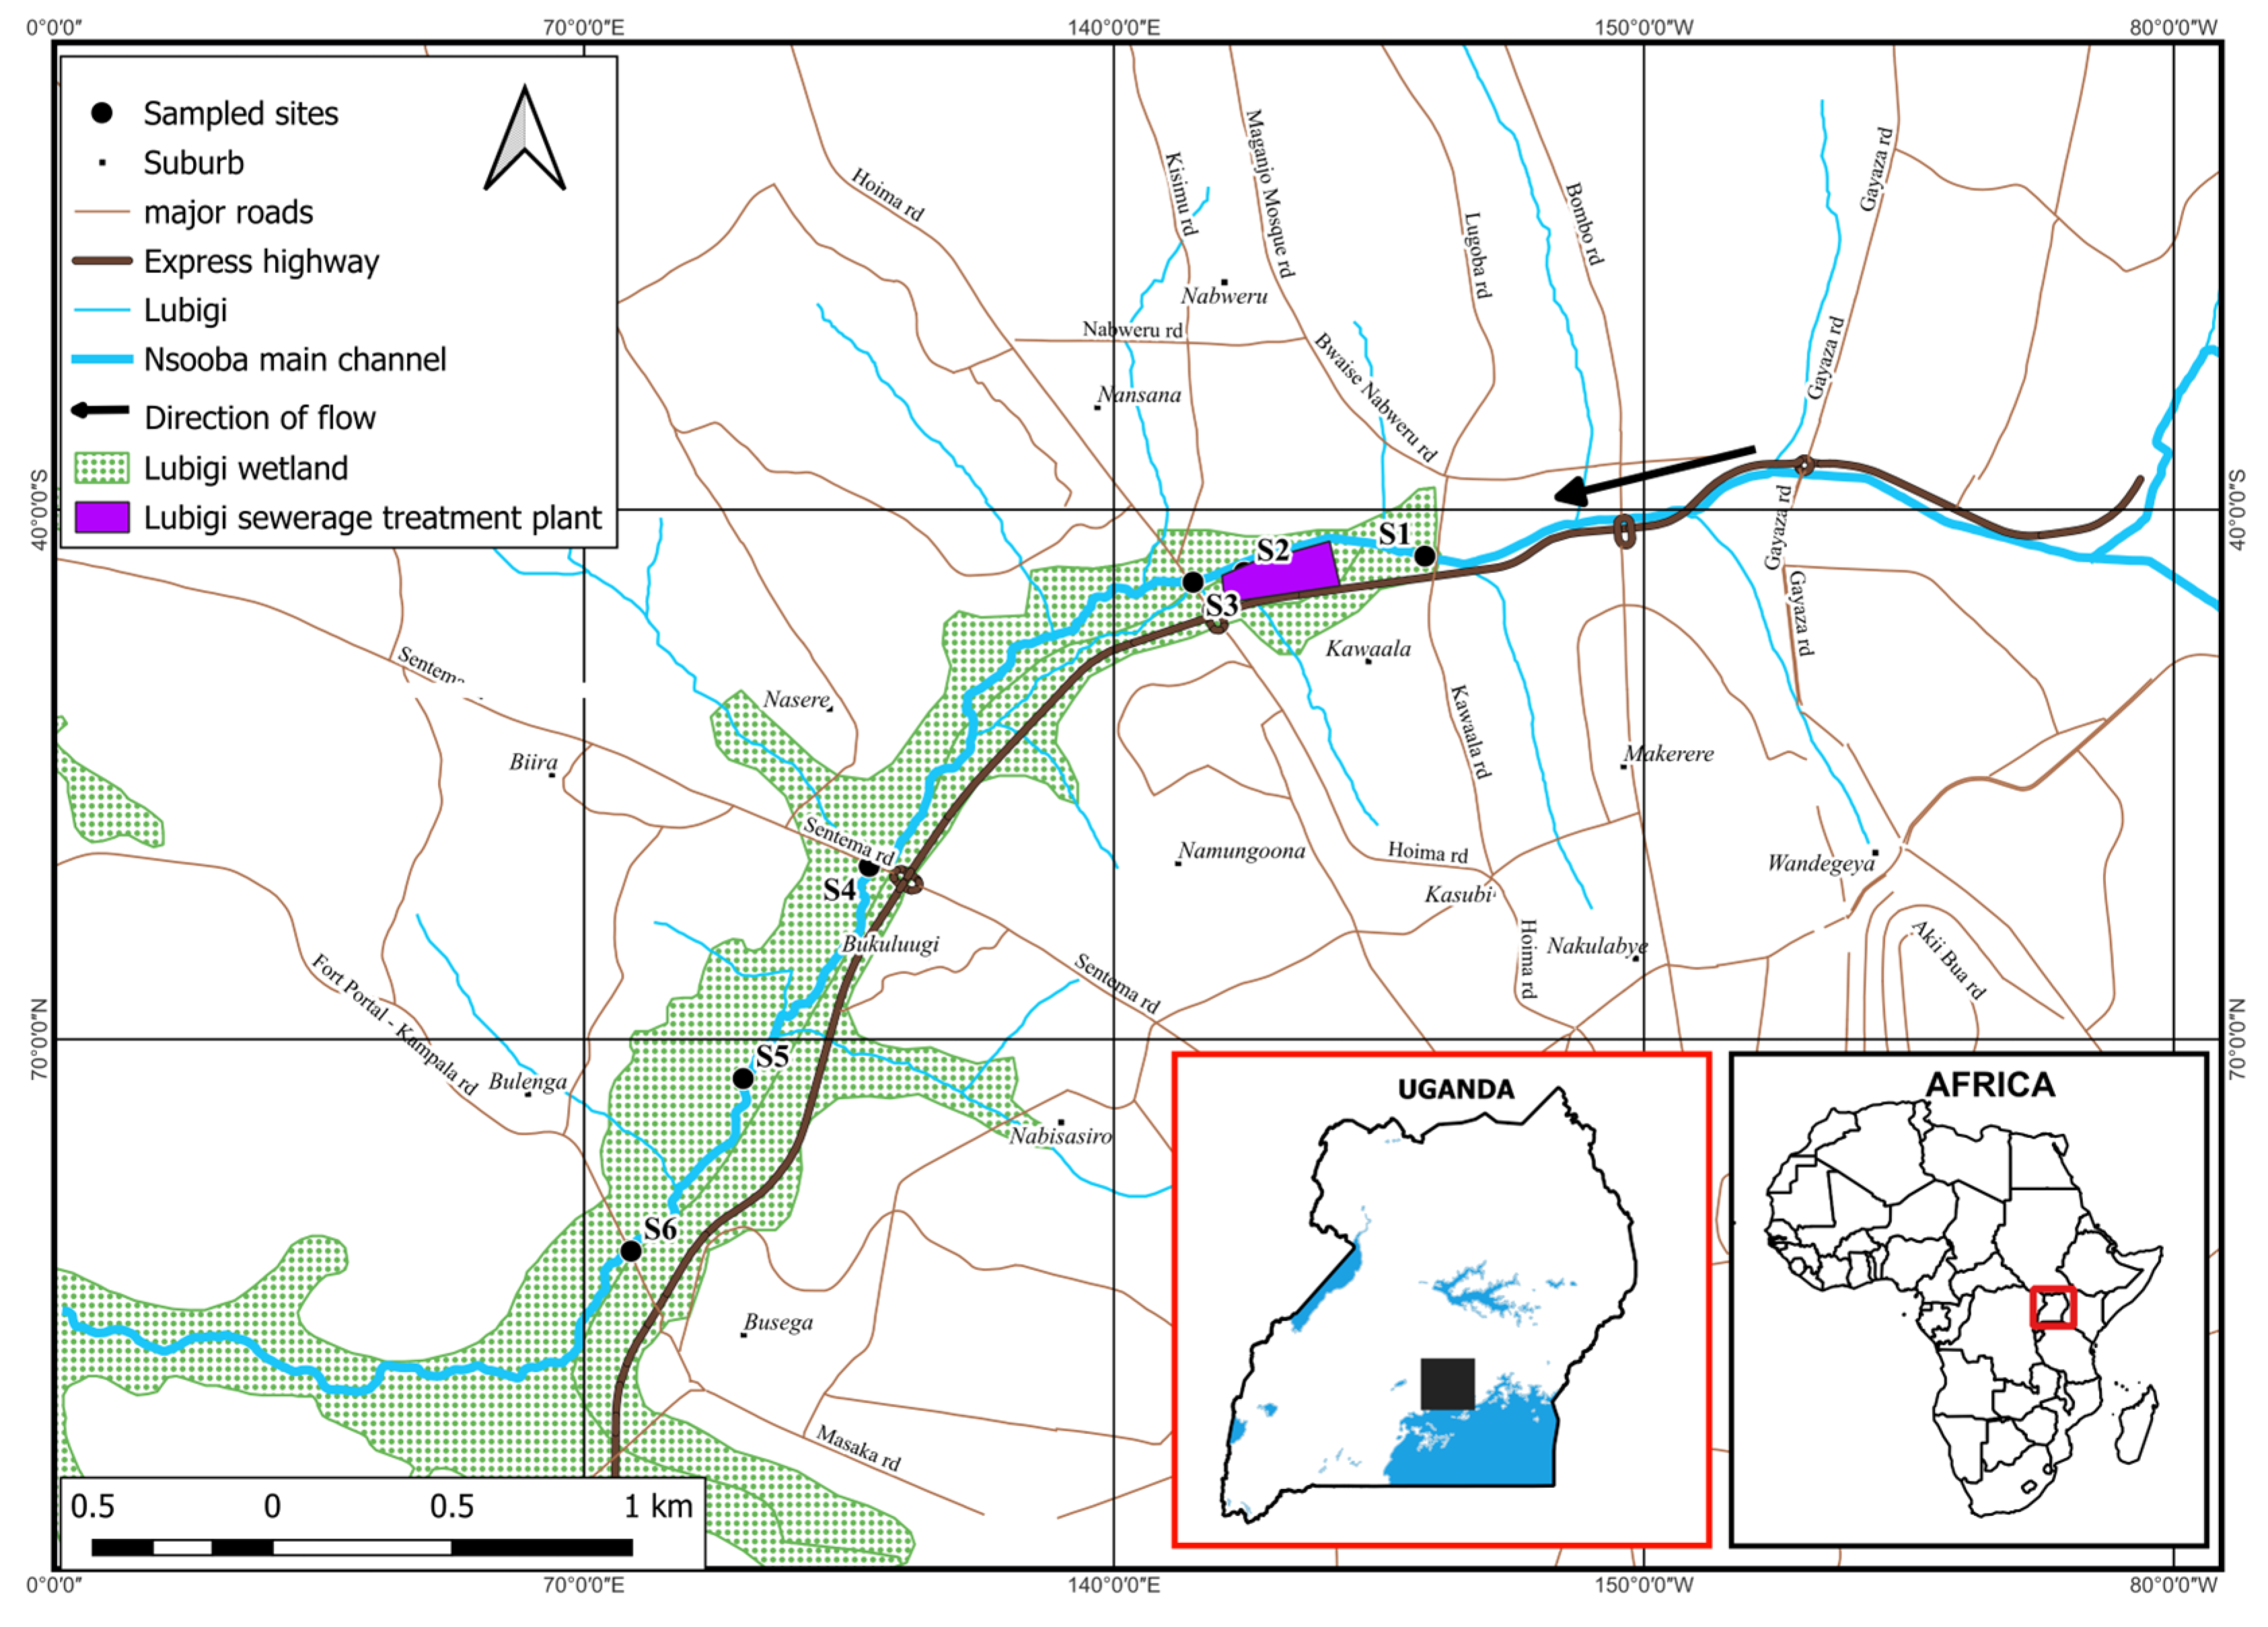
In general, nutrient concentrations and COD values were extremely high in the wetland, showing the strong influence of the highly polluted wastewater effluent and stormwater discharge throughout the year (Table 3). Component 1 of the PCA biplot explained 39.3% of the variance and separated the outflow of wastewater effluent (S2) for STP from all other sites through high conductivity, alkalinity, COD, BOD5, and PO4-P concentrations. Component 2 accounted for 14.7% of the variance and separated S3 (Junction) from the other sites by displaying high NH4-N and comparatively low NO3-N concentrations, indicating potential anoxic processes as drivers of this distinction (Figure 2).
Table 3.
Physicochemical characteristics of surface water at the sampling sites along the Lubigi wetland in the dry (D) and wet (W) seasons (means ± standard deviations, n = 144). p-values of significant effects of sites and seasons and critical thresholds for water quality (World Health Organization-WHO, National Environment Management Authority-NEMA) are shown. Bold values highlight the highest parameters.
Figure 2.
Principal component analysis biplot (Dim 1:39.3 and Dim 2:14.7 = 54%) showing score plots. The PCA biplot does not show TN and TP because they overlap with NO3-N and PO4-P.
The outflow of wastewater effluent (S2) for STP into Lubigi wetland was characterized by considerably higher concentrations of nutrient and organic matter inputs than the inflow of stormwater from the Nsooba main channel (S1) (Table 3). The wastewater effluent showed significantly higher conductivity, alkalinity, COD, and BOD values and significantly higher TSS, TN, TP, and SRP concentrations than all other sites (ANOVA, p < 0.001, n = 144). Except for BOD5, and the dissolved nitrogen species, the wastewater effluent did not meet the thresholds for water quality from the World Health Organization (WHO) and the National Environment Management Authority (NEMA) regulatory bodies, respectively.
In contrast, stormwater from the Nsooba main channel (S1) was characterized by significantly higher dissolved oxygen (ANOVA, p < 0.05, n = 144) and NH4-N concentrations (ANOVA, p < 0.001, n = 144) than all other sites. Stormwater exceeded the thresholds of WHO and NEMA in conductivity, alkalinity, COD (only during the dry season), NH4-N, and TSS (in the wet season).
From Junction (S3) onwards, the concentrations of suspended particles (TSS, TN, TP), COD, BOD5, and SRP concentrations gradually decreased along the stream course during both dry and wet seasons (Table 3), passing the WHO/NEMA thresholds for water quality. Interestingly, DO concentrations were extremely low (<2 mgL−1) at most sites except in the stormwater channel (S1) and at the sampling site (S5). High COD and BOD5 values at S5 indicated that the increase in DO was probably due to the inflow from the Nabisasiro wetland into the downstream areas of the Lubigi wetland. High BOD variability in our data was due to the inflow from Nabisasiro wetland, which is part of the Lubigi wetland system, with streams carrying wastewater and stormwater discharges from a nearby school and slums without appropriate sanitation systems in place (Figure 1). While NO3-N and NO2-N were generally high in the Lubigi wetland, NH4-N concentrations peaked, especially at the junction of the stormwater channel with the wastewater inflow (S3). The wet season was characterized by significantly higher TSS concentrations than the dry season (ANOVA, p < 0.01, n = 144). Dissolved nutrient concentrations were generally lower in the wet season (p < 0.05), while TN and TP showed no seasonal effects.
3.2. Pearson Rank Correlations of Physico-Chemical Parameters
In general, most physicochemical parameters were highly correlated (Table 4). Dissolved oxygen concentrations were negatively correlated with BOD5, COD, PO4-P, and NH4-N and positively with NO3-N (p < 0.05, n = 144). The particulate fractions TSS, TN, and TP were highly and positively correlated, probably due to the influence of the wet season (p < 0.001). TSS also correlated positively with COD and BOD5 (p < 0.001) and NO3-N (p < 0.05), but negatively with NH4-N (p < 0.001).
Table 4.
Pearson correlation test for physicochemical parameters of water quality in Lubigi wetland.
3.3. Uptake and Release of Dissolved and Particulate Nutrients in the Wetland
Dissolved and particulate nutrient changes over the entire study reach (between S3 and S6) were highly variable among sampling dates and parameters (Table 5). Thus, we used median uptake/release rates instead of arithmetic means to describe temporal and spatial patterns. We observed a general release of NO3-N and NO2-N and an uptake of NH4-N, PO4-P, TN, and TP during both seasons. Seasonal differences in average release/uptake rates were minor, although we observed slightly higher rates for dissolved nutrients and lower rates for particles during the dry season.
Table 5.
Average uptake and release rates of the Lubigi wetland during the wet and dry season (median, n = 15 per season). Positive values indicate release while negative indicate uptake between S3 (junction of the stormwater channel and wastewater inflow) and S6 (downstream end of the study reach).
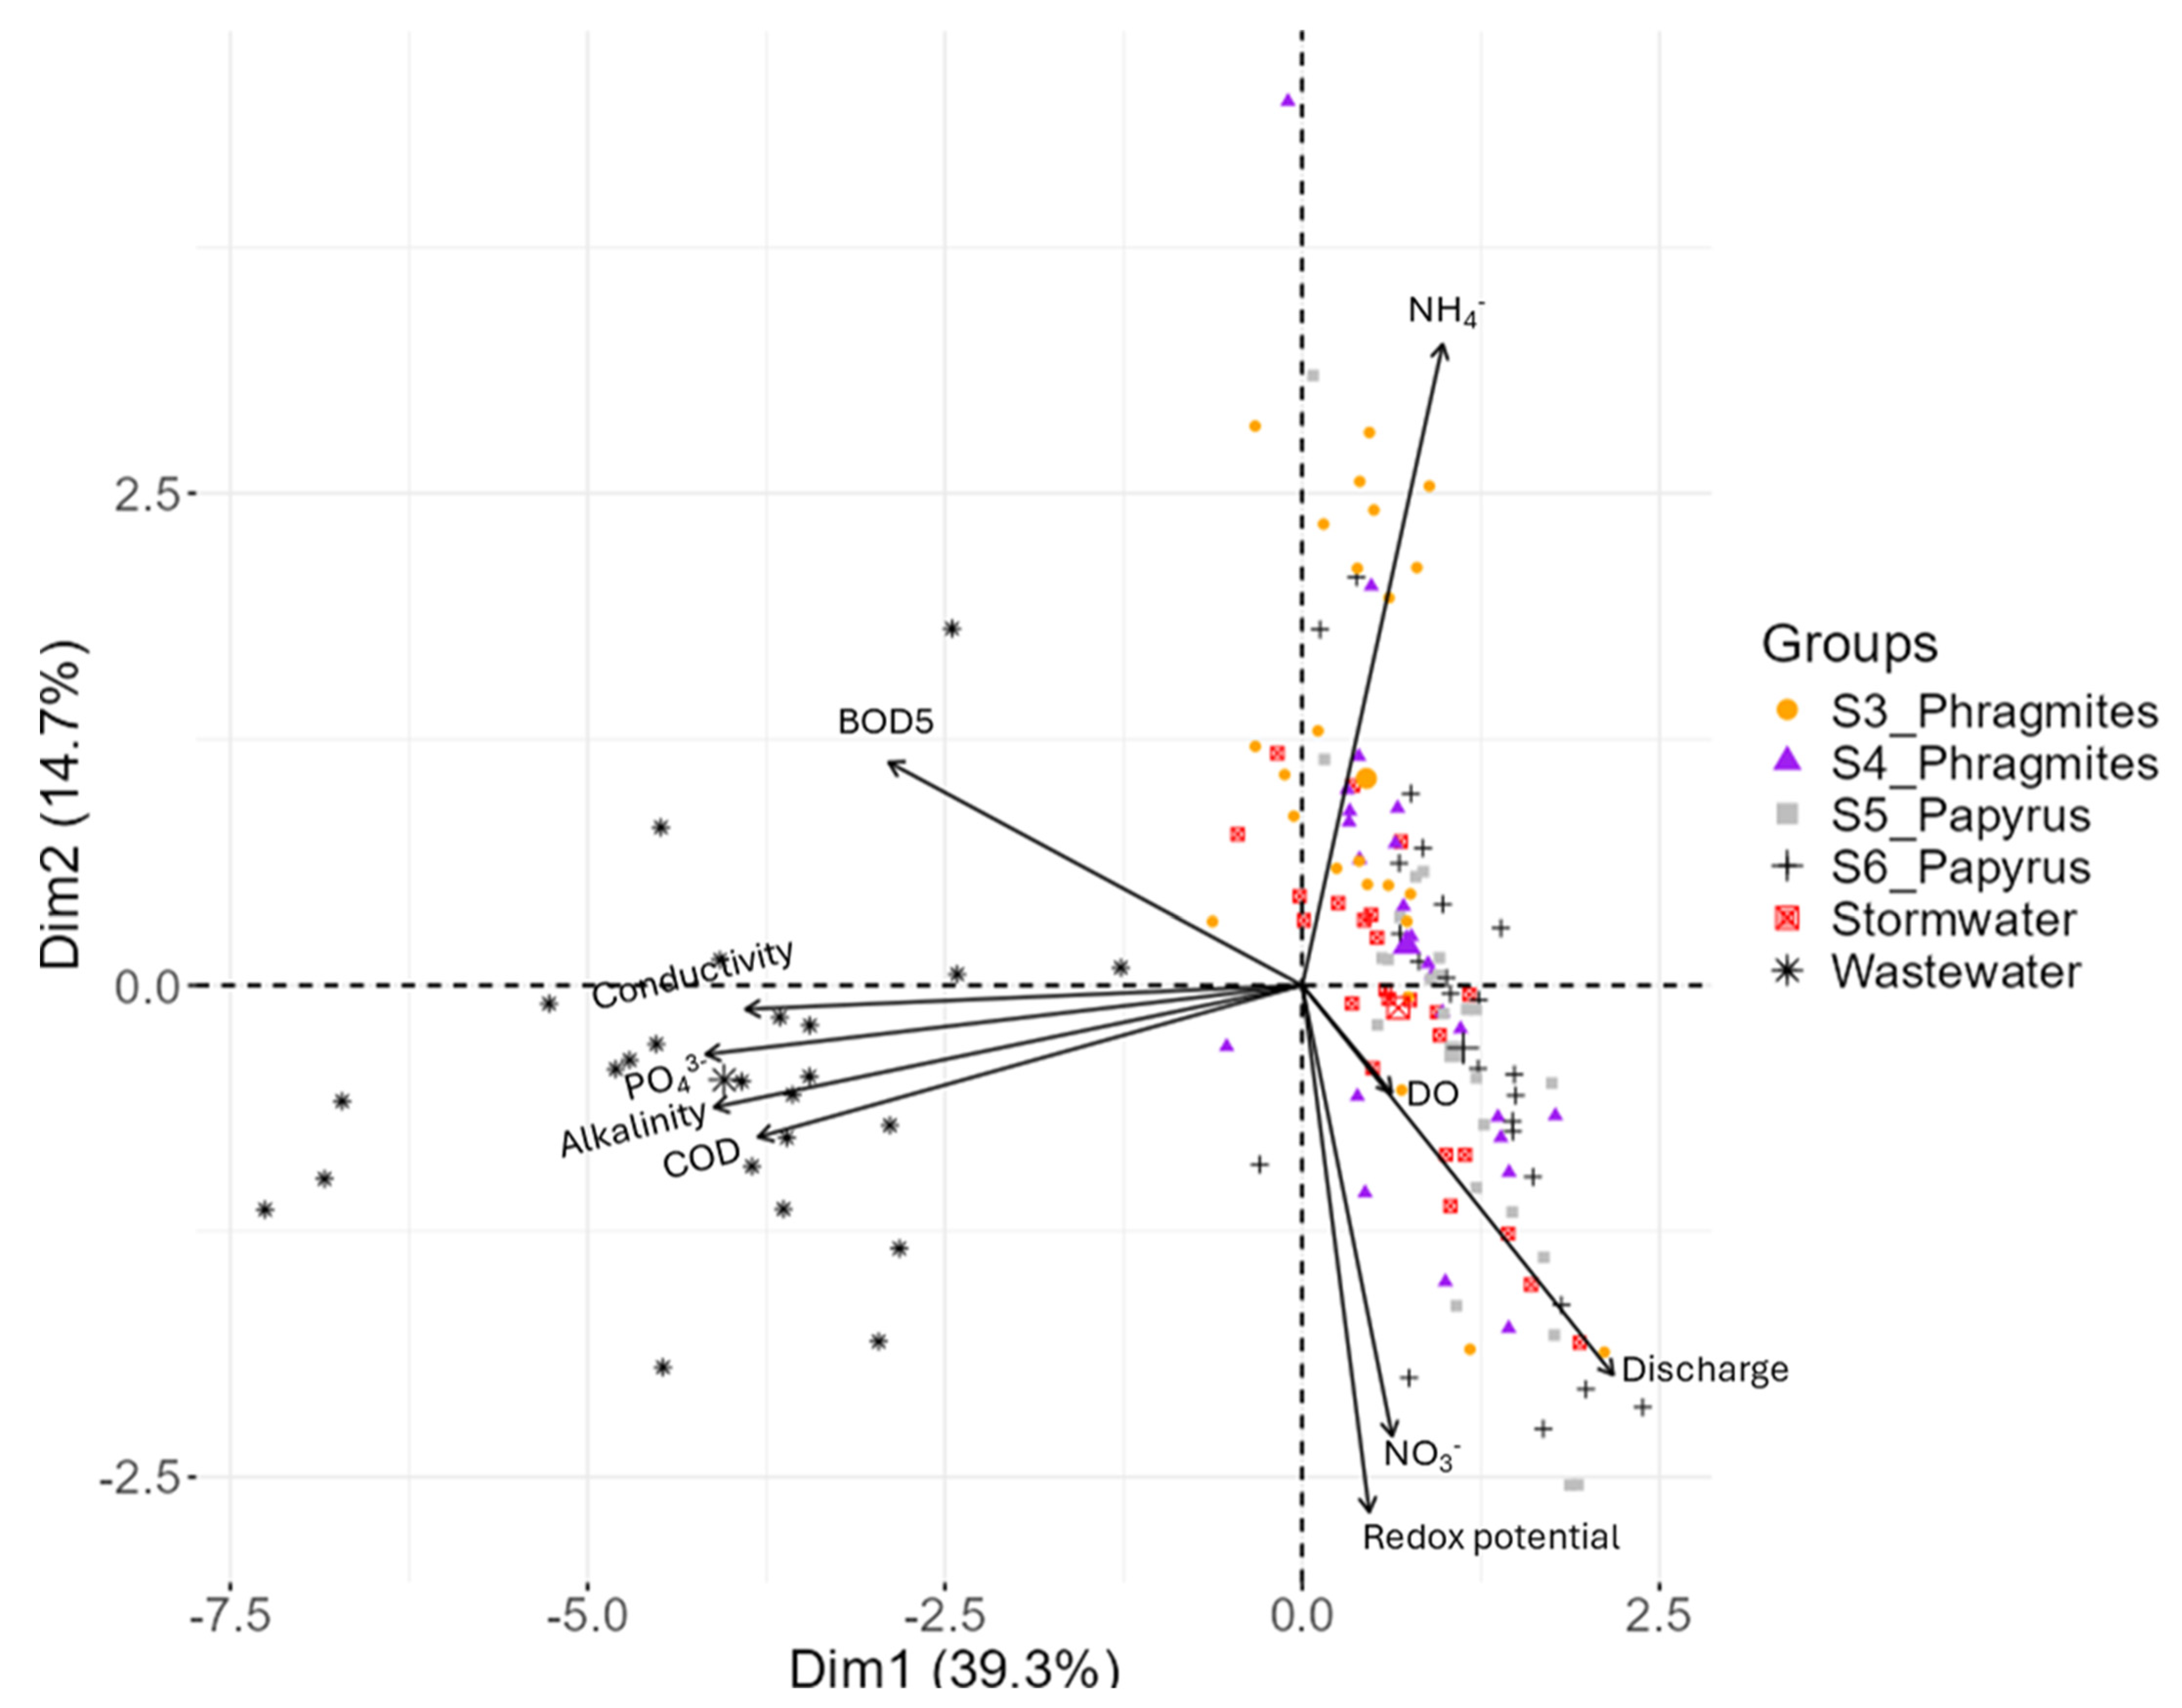
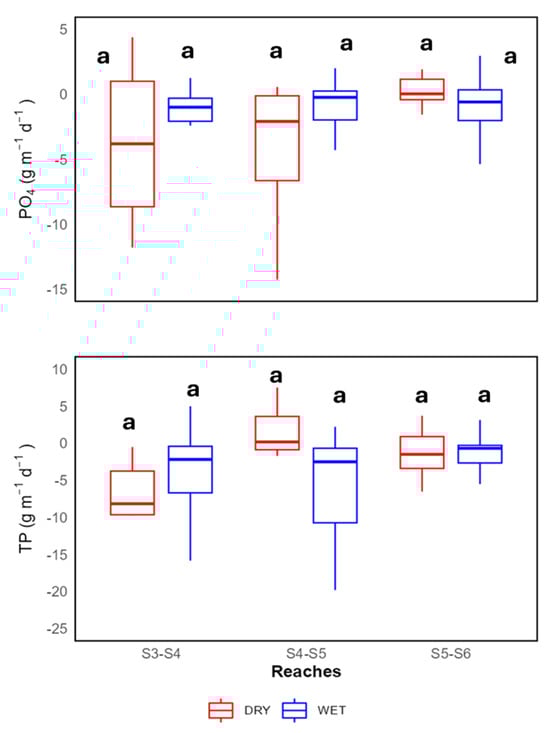
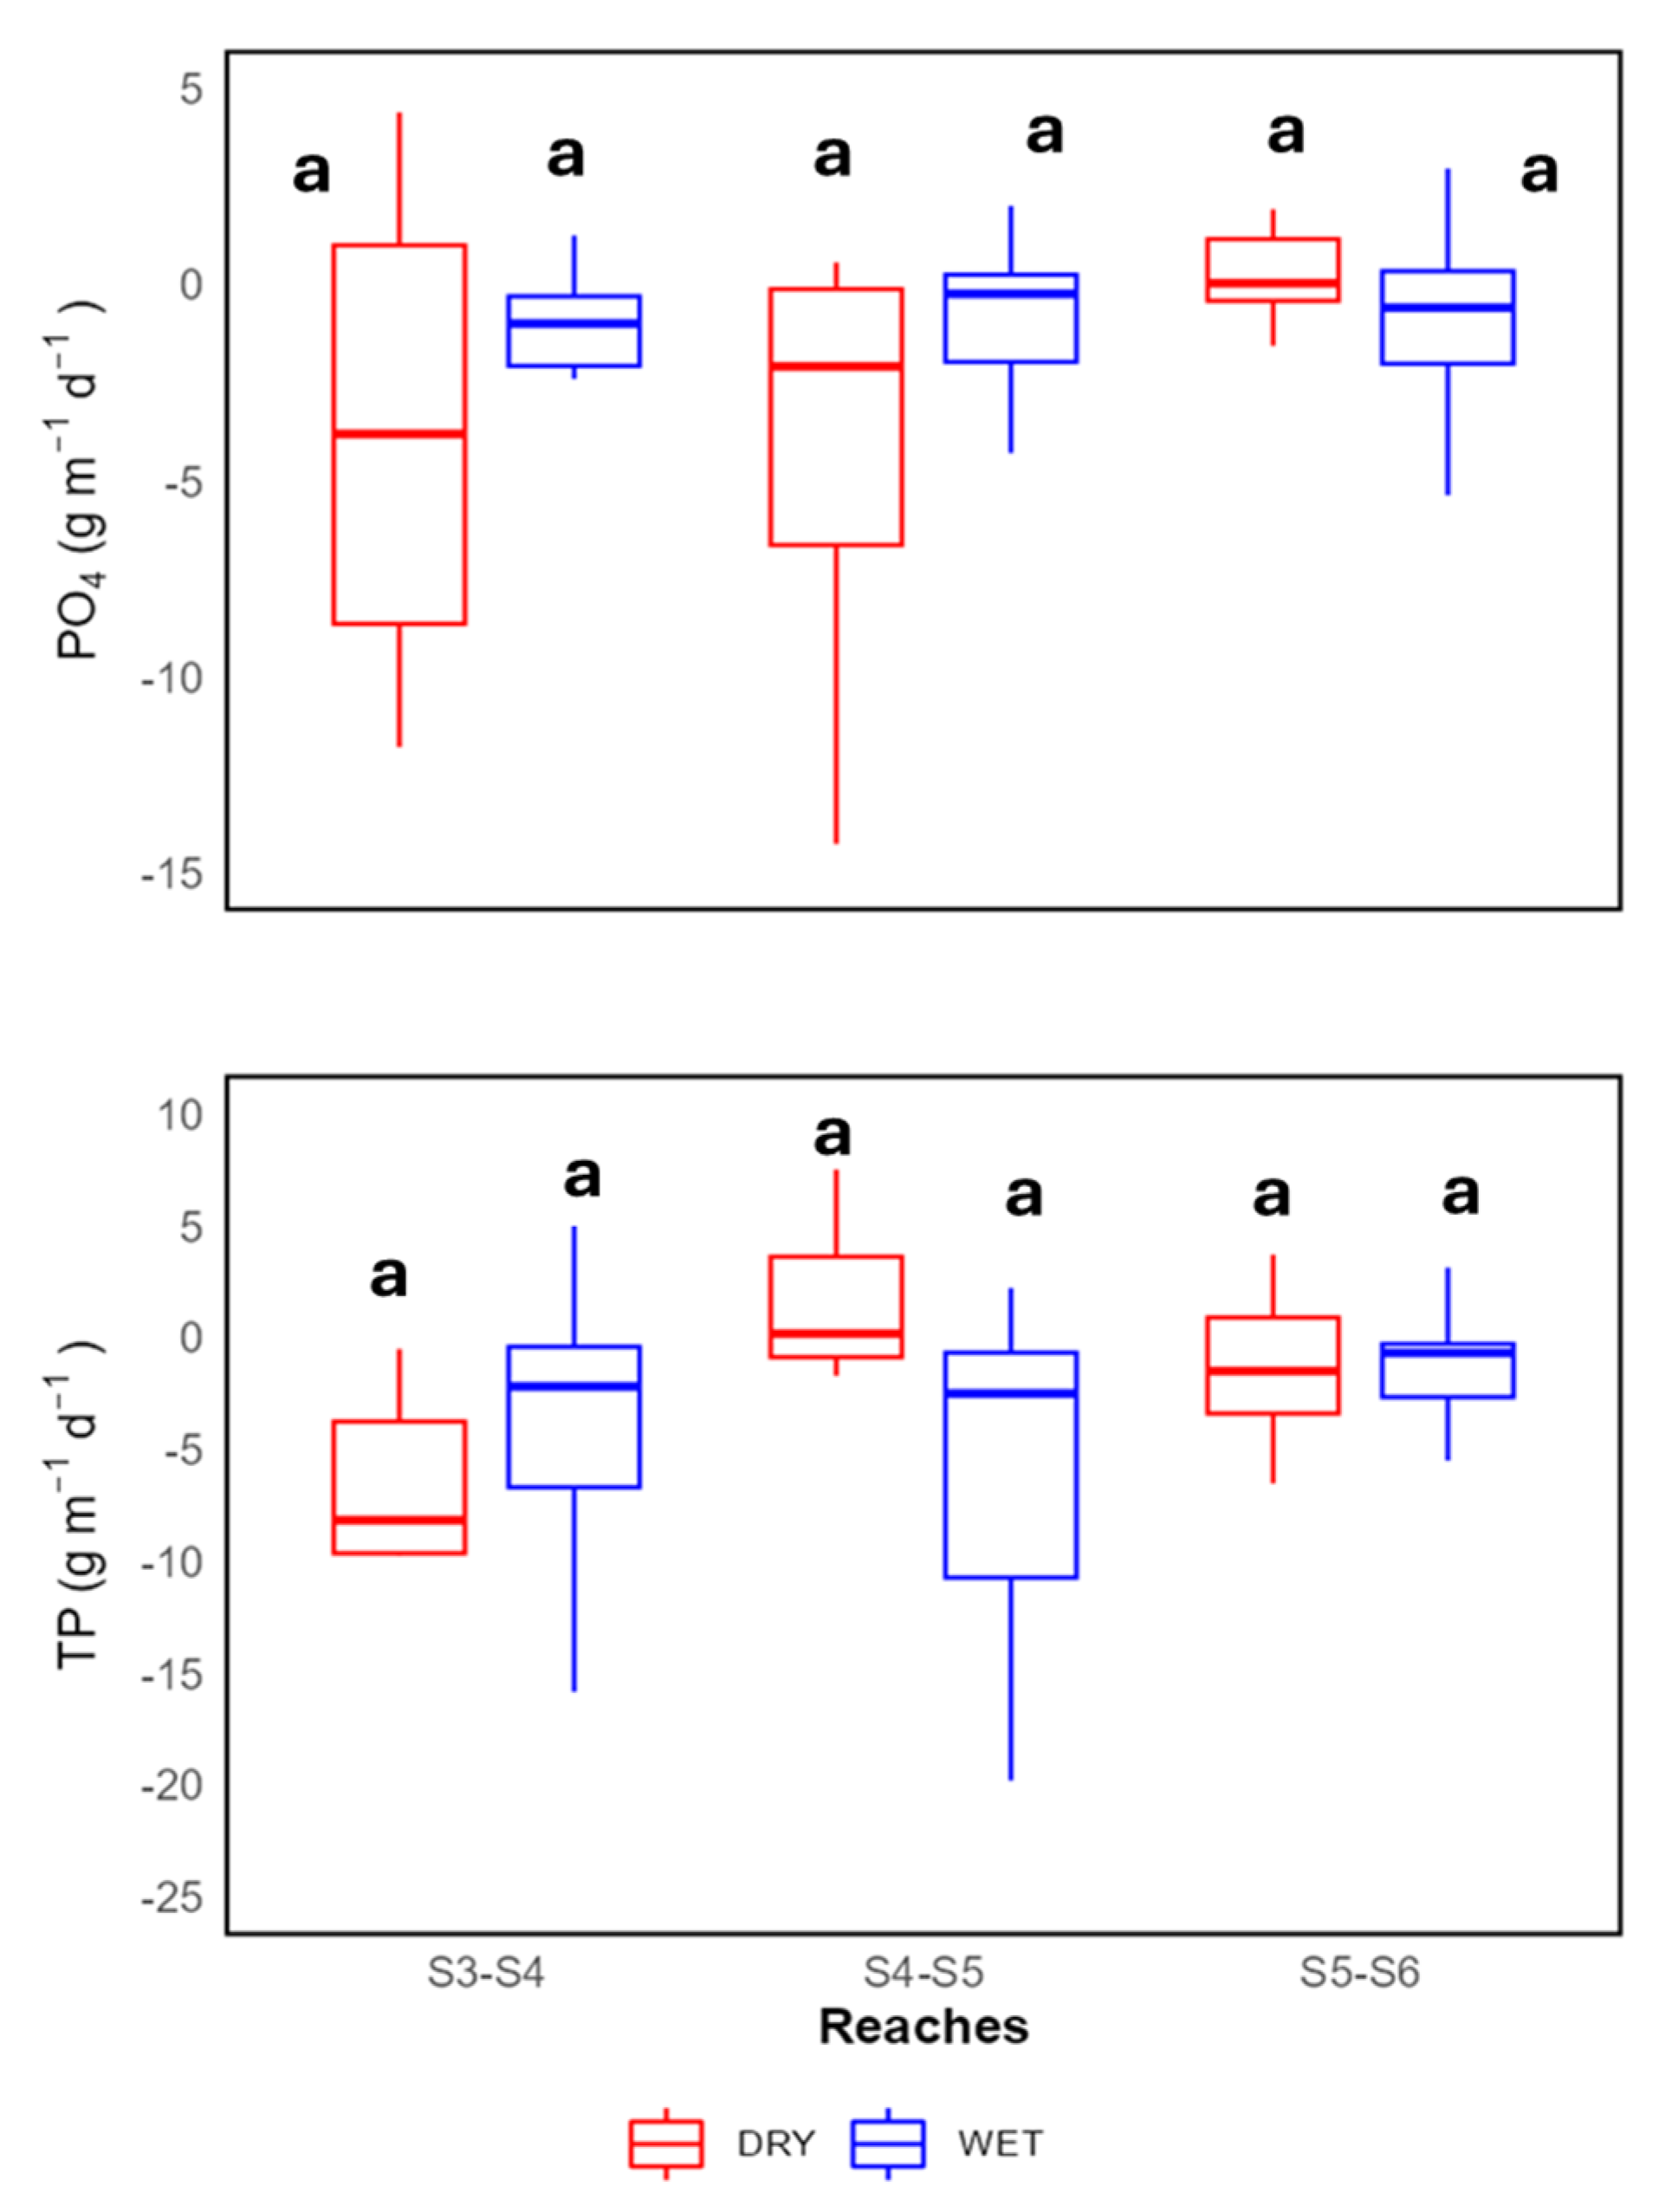
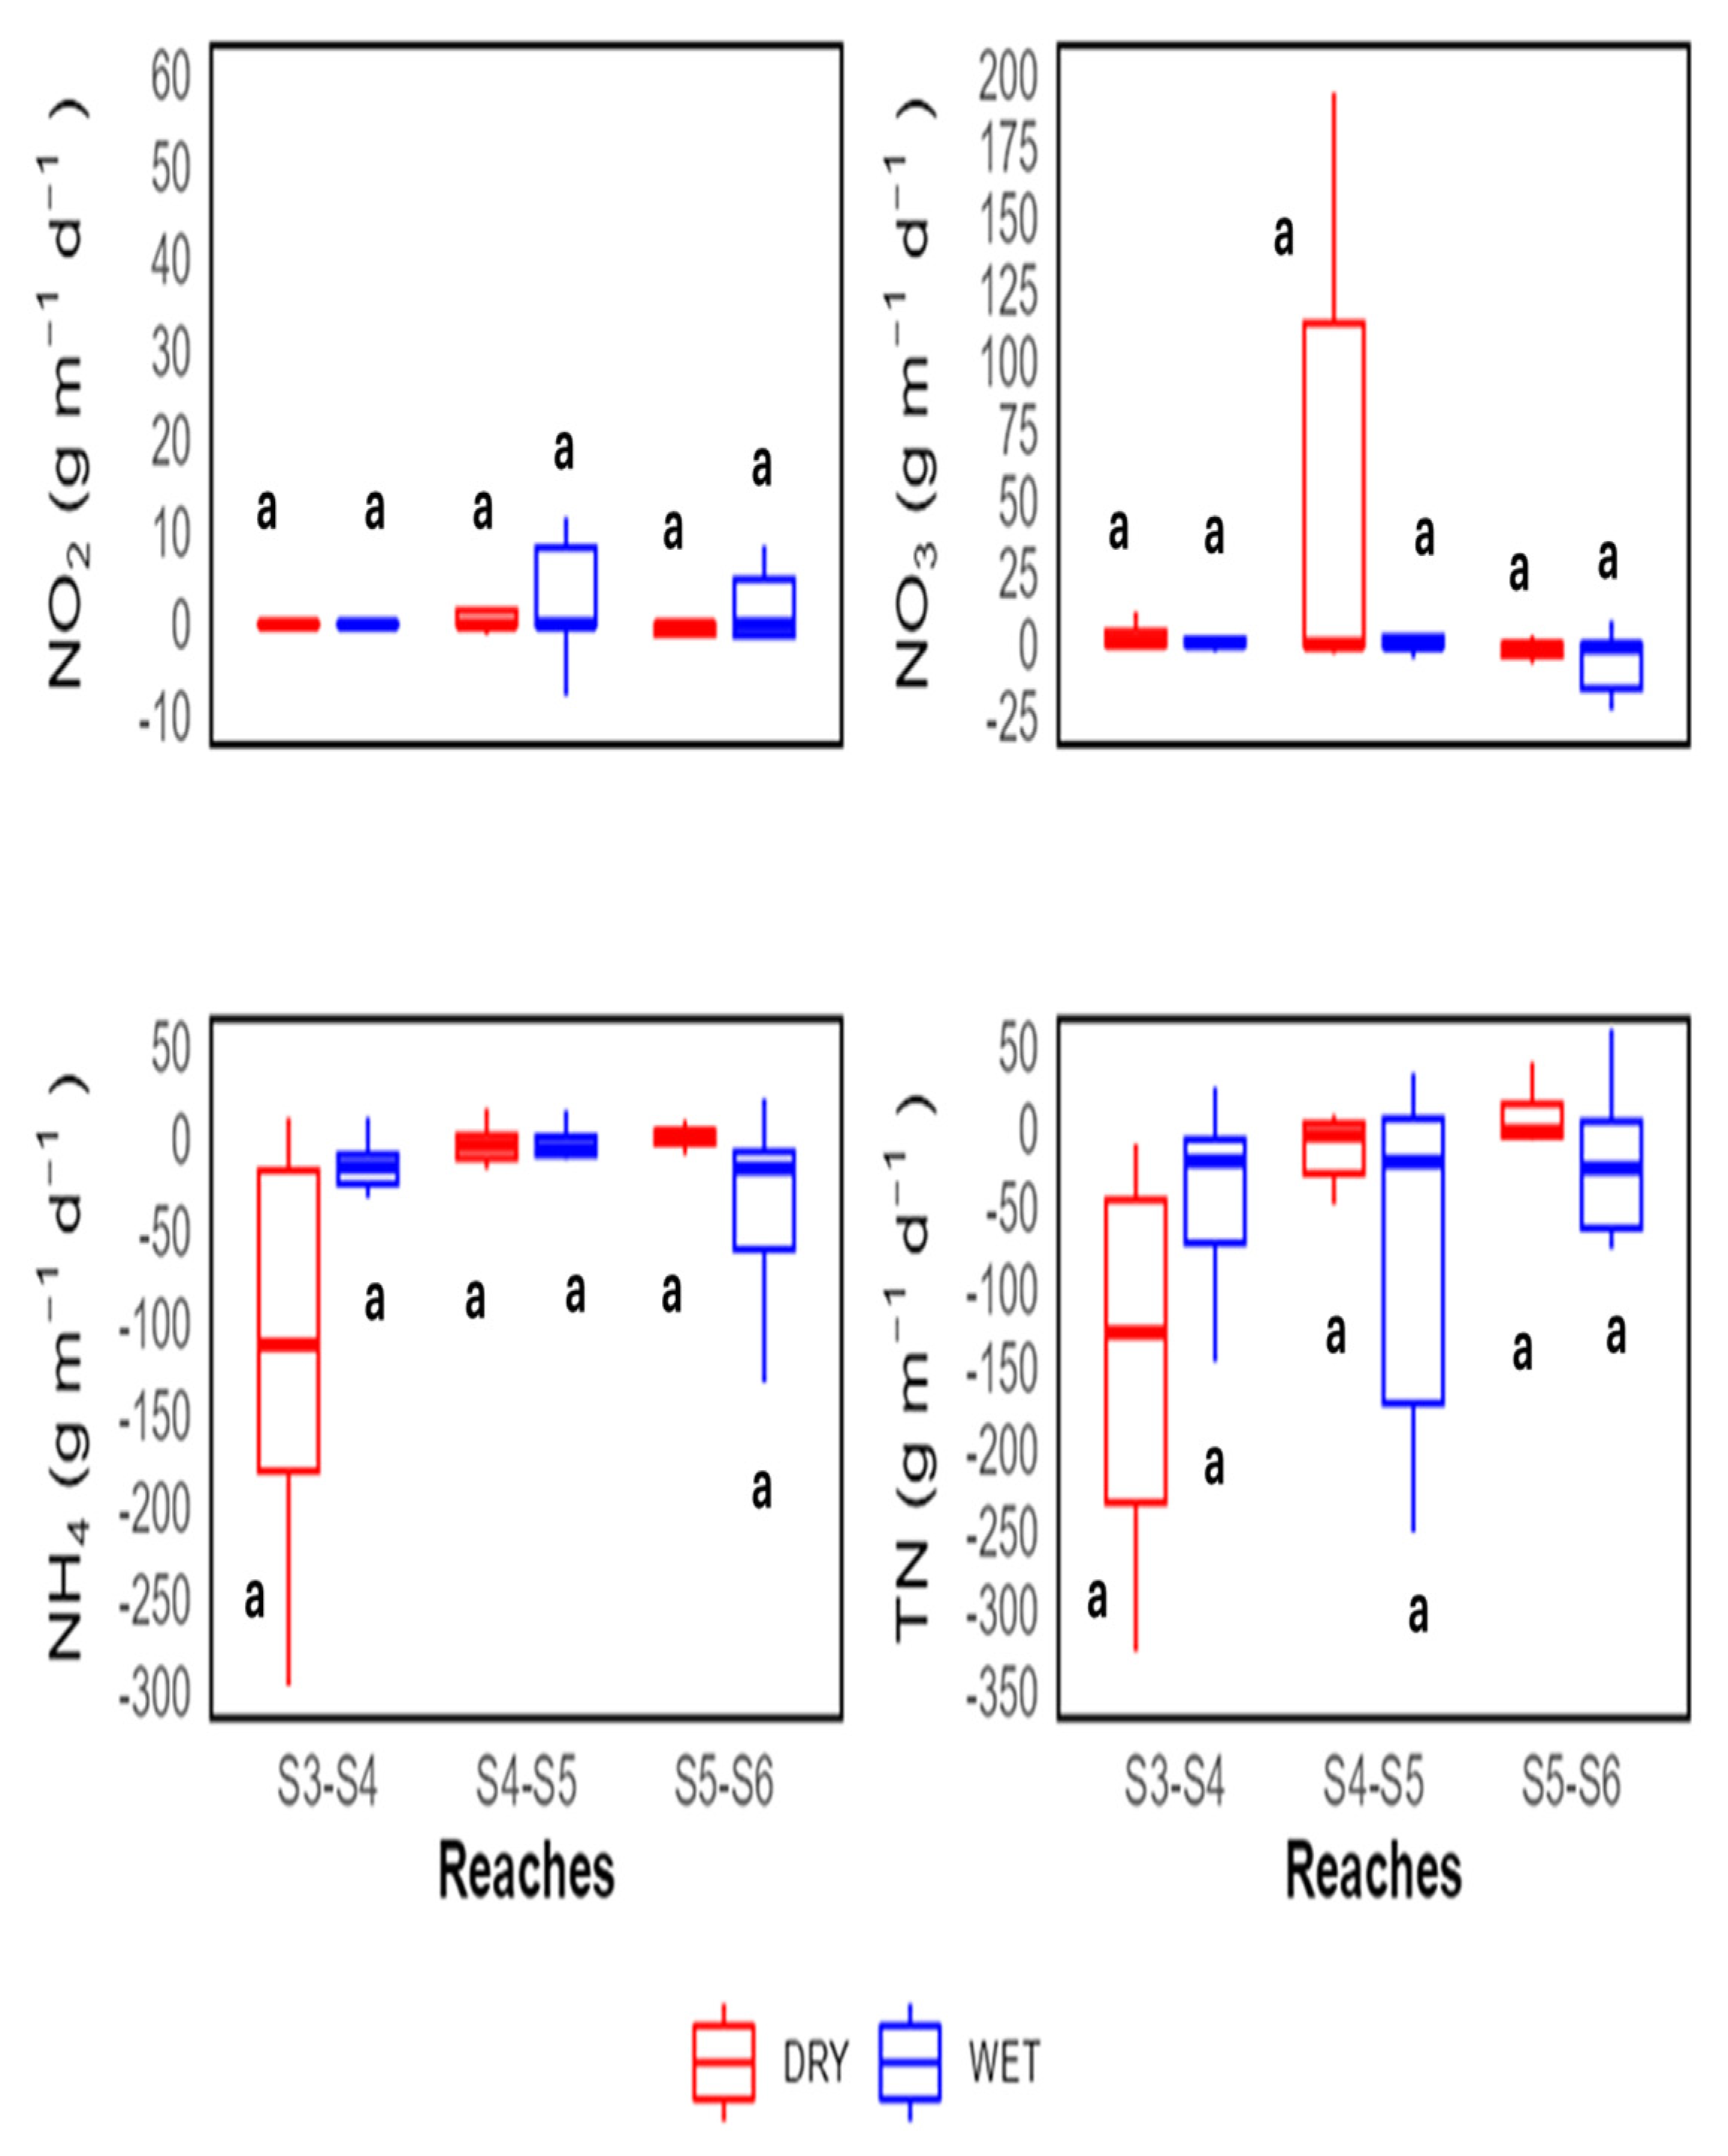
During the dry season, median uptake rates for NH4-N, PO4-P, and TN decreased from −112, −3.8, and −127.6 g m−1 d−1 in the upstream reach (S3–S4) with P. mauritianus vegetation to +3.1, +0.04, and −2.3 g m−1 d−1 in the downstream reach (S5–S6) with Cyperus papyrus vegetation, respectively (Figure 3 and Figure 4). Likewise, TP showed the highest uptake in the upstream reach with −8.1 g m−1 d−1. In contrast, low median NO3-N and NO2-N release rates at the upstream reach (0.75 and 0.001, respectively) turned into low uptake in the downstream reach (−0.7 and −0.1, respectively). The highest individual uptake rates, however, and thus the highest variability among samples were measured in the middle reach for both NO3-N and NO2-N. In the wet season, no clear spatial patterns could be observed along the wetland (Figure 3 and Figure 4 made using CSV file with nutrient data set on uptake per reach in the wetland in Supplementary Material).
Figure 3.
Uptake and release rates of phosphorus in different reaches in the dry and wet seasons. The dominant vegetation in S3–S4 is P. mauritianus, in S4–S5 a mix of C. papyrus and P. mauritianus, and in S5–S6 C. papyrus vegetation types. Box plots with the same letters are not significantly different (p > 0.05, n = 64).
Figure 4.
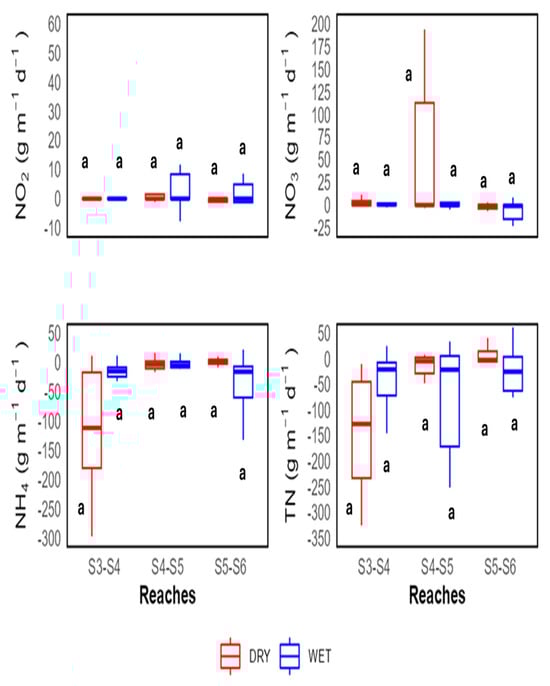
Uptake and release rates of nitrogen in different reaches in the dry and wet seasons. The dominant vegetation in S3–S4 is P. mauritianus, in S4–S5 a mix of C. papyrus and P. mauritianus, and in S5–S6 C. papyrus vegetation types. Box plots with the same letters are not significantly different (p > 0.05, n = 64).
4. Discussion
4.1. Seasonal and Spatial Variations in Water Quality Parameters
Physico-chemical parameters clearly distinguished between wastewater and untreated stormwater influence on the Lubigi wetland. Despite the lower discharge, wastewater was responsible for most of the wetland’s extremely high nutrient and particle concentrations during both seasons. Our results were consistent with previous studies on the Lubigi wetland, which showed concentrations of nutrient and organic matter inputs exceeding the threshold limits of the WHO and NEMA [27,28,29]. The relatively high PO4-P concentrations in the wastewater indicated an extremely poor P removal efficiency of the WWTP compared to nitrogen. Nitrogen concentrations, especially NH4-N, were much higher in the stormwater discharge than in the wastewater effluent. The elevated NH4-N concentrations were probably caused by wastewater from abattoirs, cesspits, and pit latrines discharging untreated sewage directly into the Nsooba main channel [27,30].
Seasonal differences in nutrient concentrations were less pronounced than expected in both water sources and the wetland. As expected, NO3-N, NO2-N, and PO4-P concentrations were usually slightly higher during the dry than during the wet season. During the dry season, high evapotranspiration rates were associated with discharge reductions, resulting in increased concentrations [31]. Our results are consistent with the high loadings of dissolved and particulate nitrogen compounds recorded during the dry season in the River Rwizi catchment in Uganda [32]. Interestingly, NH4-N showed elevated concentrations in the stormwater during the wet season. We ascribe this to the insufficient carrying capacity of the WWTP and the release of excess wastewater directly into the river and the wetland to avoid catastrophic flooding of urban water infrastructures [33]. This mismanagement also caused the high TSS concentrations observed in the Lubigi wetland during the wet season. High COD and BOD5 values and low DO concentrations indicated high organic matter pollution of the wastewater affecting the Lubigi wetland. Indeed, 65% of TN was composed of dissolved organic nitrogen in the Lubigi wetland, mainly originating from untreated wastewater [24,28]. Equally high or even higher COD values and nutrient concentrations were measured in the Oshunkaye stream, Western Nigeria, downstream of the untreated effluent from an abattoir, and in other urban wetlands in Uganda [34,35]. While oxygen concentrations and BOD5 showed no seasonal differences in the Lubigi wetland, COD increased in the wastewater and the wetland and decreased in the stormwater during the wet season. This could be attributed to high amounts of municipal and industrial effluents loaded with organic waste from human and animal feces [30,36].
In our study, we observed low BOD values of the STP probably because water samples were taken from the outflow of the STP after passing through the conventional treatment processes (pretreatment or partially treated), as wastewater effluent was discharged into the Lubigi wetland. Hence, the low BOD values are registered when much of the organic matter has been removed, like in other studies [37]. In addition, in the urban floodplain, stormwater further dilutes the organic matter, leading to low BOD values [38]. Anaerobic wastewater held for extended periods may have already undergone microbial degradation in the lagoons, thus lowering the remaining BOD values [39]. Previous studies have reported that high concentrations of chemical contaminants (disinfectants, heavy metals, surfactants, or inhibitors) can suppress microbial activity in BOD tests, resulting in artificially low values [40]. Low BOD values were observed in our research and previous studies, where the wastewater effluent was pretreated, and the stormwater discharge in the urban floodplain diluted the organic matter inputs and acted as another source of chemical contaminants, potentially suppressing microbial activities. In contrast, microbes consume more oxygen in the lagoons with wastewater that has stayed for longer periods, thus making it anaerobic, as in our STP.
In our study, there were no seasonal variations in BOD5 values. This could be attributed to the stable warm temperatures throughout the year during the dry and wet seasons [15], which support continuous microbial activity. Since BOD reflects microbial degradation of organic matter, these consistent temperatures allow for steady biodegradation rates regardless of the seasons. In contrast to tropical settings, in temperate climates with colder seasons, there is a slowdown in microbial metabolism, thus reducing BOD5 consumption. In the tropics, this thermal limitation of temperature-induced biological variability lag is absent, leading to smaller differences in biological responses in both seasons. In many tropical settings, especially urban areas, there are autochthonous and allochthonous sources of organic matter. This implies that BOD remains fairly constant across the year, regardless of the season, with minimal variations [17].
4.2. Nutrient Uptake Capacity of the Lubigi Wetland
Despite the extreme pollution, Lubigi wetland showed the capacity to remove ammonium, phosphate, and particulate nutrients in both seasons, thus purifying the wastewater from Kampala city. In one study, they reported mean removal efficiencies of 25% for ammonium and 40% for nitrate [24]. Ammonium removal rates were equally low in our study, ranging between 20 and 40%. However, in contrast, nitrate and nitrite were released during the water passage through the Nsooba main channel [24]. This is surprising as the prevailing low oxygen levels should favor nitrate reduction through denitrification [11]. One possible explanation for the net nitrate gain could be the mineralization of organic nitrogen compounds that outcompete nitrate losses via denitrification. A nitrogen model identified plant uptake and sedimentation as the main nitrate removal pathways in the Lubigi wetland, while denitrification was comparatively low [28]. It also reports strong nitrogen recycling through resuspension and decomposition of plant material. The high nitrite loading and increases in the Nsooba main channel support intense biogeochemical nitrogen cycling. In addition to internal nitrate sources, nitrate could also have been imported from agricultural fields and livestock production systems into the Nsooba main channel via secondary and tertiary tributaries during rainfall events.
Like ammonium, both dissolved and particulate phosphorus were taken up, showing moderate removal efficiencies of about 40–60%. Other studies in natural tropical wetlands report nutrient removal efficiencies of up to 90%, especially for nitrogen [36]. However, such high removal rates can usually be found only in wetlands not loaded with heavily polluted wastewater, as is the case for the Lubigi wetland. Additionally, due to the high loads of nutrient and organic matter inputs, the purification capacity of Lubigi wetland was impacted by low water retention times of a few hours during storm events [23]. Furthermore, pollution by hazardous substances such as pesticides, pharmaceuticals, heavy metals, and radionuclides may severely affect biological, microbial, and biogeochemical retention processes [41]. The release and uptake of nutrient and organic matter inputs also depend on the local factors, such as the stream morphology and macrophyte species [42]. The dominant macrophytes C. papyrus and P. mauritianus are well-known for their high nutrient removal efficiencies and are thus frequently used in constructed wetlands for treating urban wastewater [20,43]. Here, several studies report a better removal performance for COD, dissolved nitrogen, and phosphorus, and higher biomass accumulation rates of C. papyrus than P. mauritianus species [21,43]. Studies performed in Nakivubo and Kirinya wetlands in Uganda also measured higher nitrogen storage in C. papyrus than in P. mauritianus [43,44], while P. australis showed high retention of solids [20].
In the Lubigi wetland, uptake rates were considerably higher in the midstream reach with P. mauritianus than in the downstream reach vegetated by C. papyrus. However, our study design cannot reveal whether these differences were caused by different vegetation or other environmental factors such as stream morphology, hydraulic retention times, or loading. In any case, the dense vegetation communities of P. mauritianus and C. papyrus in the midstream and downstream reaches of the Lubigi wetland act as “engineers”, creating morphological heterogeneity and increasing water retention times by minimizing short-circuiting flows and dead zones. Numerous root hairs common in C. papyrus can be used for colonization by microorganism assemblages, thus increasing nutrient uptake [14,45].
5. Conclusions
5.1. Implications for the Management and Restoration of the Lubigi Wetland
Understanding the social and economic drivers of water pollution and the significance of the hydrological periods on nutrient cycling, together with high temperature and primary production throughout the year, will increase our knowledge about the role of wetlands in removing nutrient and organic inputs from urban wastewater effluent and stormwater discharge. However, although several studies demonstrate the potential of large tropical wetlands to function as Nature-Based Solutions for water purification, wetlands have been continuously degraded in Africa during the last decades. The aerial extent of the Lubigi wetland reduced from almost 100% in 1994, 96.3% in 2002, to 82.5% in 2015, and finally 80.6% in 2018 due to degradation and various competing land uses for settlements, agriculture, and water development, among others [46,47]. This has negatively affected its natural buffering capacity in both time and space. Our study determined the uncertainty of response and recovery of the Lubigi wetland ecosystem. This will support our understanding of how wetlands adapt or degrade under persistent urban stressors such as hydrological alteration, increased nutrient loads, and organic pollution. We predicted the thresholds beyond which urban tropical wetland ecosystems may collapse or fail to recover under persistent water pollution. Additionally, the insufficient carrying capacity of the STP, the release of excess wastewater into the wetland during the wet season, and the discharge of untreated sewage via the stormwater channel significantly lower the self-purification capacity of the wetland during both seasons, as our study confirmed. Thus, pollution loads need to be reduced to a large extent. This requires improving the carrying capacity of the STP and the Nsooba main channel based on the coordination of practices and policies through spatial planning of water and wetland sectors. Implementing seasonal strategies for urban water infrastructure to reduce the high wastewater effluents during the wet season is key. This can be achieved by creating new lagoons or reservoirs to mitigate elevated instream concentrations and prevent further export to downstream areas of the Lubigi wetland and Lake Kyoga during the wet season. To maximize environmental benefits, we also recommend re-planting and allowing the regeneration of native P. mauritianus and C. papyrus vegetation in degraded areas of the Lubigi wetland. Finally, raising awareness about the importance of the various ecosystem services that natural wetlands provide for the local people is vital.
5.2. Recommendations for Future Research in the Lubigi Wetland
In further studies, it is crucial to collect long-term data to assess wetland resilience in increasing urbanizing areas to:
- -
- Inform evidence-based planning in policy and management decisions, when integrating wetlands into urban infrastructure as Nature-Based Solutions (NBS). City planners, research scientists, and environmental managers will be able to assess whether wetlands can sustain their ecosystem services over decades.
- -
- Assess climate and land use synergies in cities and towns through long-term monitoring and evaluation to understand the impacts of multiple stressors on wetland resilience, such as shifts in water regimes, functioning of microbial and vegetation communities.
- -
- Capture ecological lag effects such as gradual biodiversity loss and sediment build-up, among others, and their delayed responses to disturbances, which may become evident over time. This way, we minimize the risks of underestimating long-term degradation or overestimating resilience.
- -
- Conduct mechanistic analyses to explain nutrient removal processes. While many investigations report reductions in nutrient concentrations, they often fail to elucidate the underlying biological and physicochemical pathways driving these changes. Specifically, microbial processes such as nitrification, denitrification, and phosphorus cycling, including plant-mediated mechanisms like nutrient uptake, oxygen release into the rhizosphere, and root–microbe interactions, are rarely quantified with their threshold values. This omission limits the predictive power of these aquatic systems under variable environmental conditions and hampers the ability to optimize wetland design for enhanced performance.
- -
- Furthermore, without mechanistic insight, it becomes difficult to replicate or scale successful models across different ecological contexts. For further research, incorporating microbial, plant physiological, and biogeochemical analyses is essential to move beyond descriptive assessments and toward a more process-based understanding of wetlands as nature-based solutions in ecosystem recovery and response to multiple urban stressors.
Supplementary Materials
The following supporting information can be downloaded at: https://www.mdpi.com/article/10.3390/w17121821/s1, CSV file with nutrient data set on uptake per reach in the wetland.
Author Contributions
F.B.: Conceptualization, Methodology, Investigation, Data curation, Writing—original draft, writing—review and editing, formal analysis, G.L.: Conceptualization, Methodology, Investigation, Data curation, Writing—original draft, writing—review and editing, F.K.: Conceptualization, Methodology, Investigation, Data curation, Writing—original draft, writing—review and editing. G.W.: Conceptualization, Methodology, Investigation, Data curation, Writing—original draft, R.K.: Conceptualization, Methodology, Investigation, Writing—original draft, T.H.: Conceptualization, Methodology, Investigation, Data curation, Writing—original draft, writing—review and editing, formal analysis. All authors have read and agreed to the published version of the manuscript.
Funding
We thank the Schlumberger Foundation, Faculty of the Future Fellowship, for funding this research study.
Data Availability Statement
The original contributions presented in this study are included in the article. Further inquiries can be directed to the corresponding author.
Acknowledgments
We thank the Schlumberger Foundation, Faculty of the Future Fellowship, for funding this research study. In addition, the work of Flavia Byekwaso was supported by the Doctoral School “Human River Systems in the 21st Century (HR21)” of the University of Natural Resources and Life Sciences, Vienna (BOKU University) and International Training Program in Limnology (IPGL). We appreciate the support from the Ministry of Water and Environment specifically the Climate Change Department, Water Quality Management Department, Entebbe and National Water and Sewage Corporation-Gaba Waterworks, Kampala-Uganda for the laboratory and field assistance who took part in field sampling.
Conflicts of Interest
Author Rose Kaggwa was employed by the company National Water and Sewerage Corporation. The remaining authors declare that the research was conducted in the absence of any commercial or financial relationships that could be construed as a potential conflict of interest.
References
- Edokpayi, J.; Odiyo, J.; Msagati, T.; Popoola, E. Removal Efficiency of Faecal Indicator Organisms, Nutrients and Heavy Metals from a Peri-Urban Wastewater Treatment Plant in Thohoyandou, Limpopo Province, South Africa. Int. J. Environ. Res. Public Health 2015, 12, 7300–7320. [Google Scholar] [CrossRef] [PubMed]
- Schoebitz, L.; Bischoff, F.; Lohri, C.; Niwagaba, C.; Siber, R.; Strande, L. GIS Analysis and Optimisation of Faecal Sludge Logistics at City-Wide Scale in Kampala, Uganda. Sustainability 2017, 9, 194. [Google Scholar] [CrossRef]
- Hein, T.; Auhser, A.; Byekwaso, F.; Graf, W.; Hoevel, A.; Schmid, M.; Stockinger, M.; Stumpp, C.; Tschikof, M.; Tuerk, H.; et al. Research on Coupled Socio-ecohydrological Systems—Implementing a Highly Integrative and Interdisciplinary Research Agenda in the Doctoral School “Human River Systems in the 21st Century (HR21)”. River Res. Appl. 2024, 40, 1754–1765. [Google Scholar] [CrossRef]
- McConville, J.R.; Kvarnström, E.; Maiteki, J.M.; Niwagaba, C.B. Infrastructure Investments and Operating Costs for Fecal Sludge and Sewage Treatment Systems in Kampala, Uganda. Urban Water J. 2019, 16, 584–593. [Google Scholar] [CrossRef]
- Haddis, A.; Van Der Bruggen, B.; Smets, I. Constructed Wetlands as Nature Based Solutions in Removing Organic Pollutants from Wastewater under Irregular Flow Conditions in a Tropical Climate. Ecohydrol. Hydrobiol. 2020, 20, 38–47. [Google Scholar] [CrossRef]
- Thorslund, J.; Jarsjo, J.; Jaramillo, F.; Jawitz, J.W.; Manzoni, S.; Basu, N.B.; Chalov, S.R.; Cohen, M.J.; Creed, I.F.; Goldenberg, R.; et al. Wetlands as Large-Scale Nature-Based Solutions: Status and Challenges for Research, Engineering and Management. Ecol. Eng. 2017, 108, 489–497. [Google Scholar] [CrossRef]
- Seddon, N. Harnessing the Potential of Nature-Based Solutions for Mitigating and Adapting to Climate Change. Science 2022, 376, 1410–1416. [Google Scholar] [CrossRef]
- Zhu, D.; Ryan, M.C.; Gao, H. The Role of Water and Mass Balances in Treatment Assessment of a Flooded Natural Wetland Receiving Wastewater Effluent (Frank Lake, Alberta, Canada). Ecol. Eng. 2019, 137, 34–45. [Google Scholar] [CrossRef]
- Lenart-Boroń, A.; Wolanin, A.; Jelonkiewicz, Ł.; Chmielewska-Błotnicka, D.; Żelazny, M. Spatiotemporal Variability in Microbiological Water Quality of the Białka River and Its Relation to the Selected Physicochemical Parameters of Water. Water Air Soil. Pollut. 2016, 227, 22. [Google Scholar] [CrossRef]
- Schwammberger, P.F.; Yule, C.M.; Tindale, N.W. Rapid Plant Responses Following Relocation of a Constructed Floating Wetland from a Construction Site into an Urban Stormwater Retention Pond. Sci. Total Environ. 2020, 699, 134372. [Google Scholar] [CrossRef]
- Jahangir, M.M.R.; Richards, K.G.; Healy, M.G.; Gill, L.; Müller, C.; Johnston, P.; Fenton, O. Carbon and Nitrogen Dynamics and Greenhouse Gas Emissions in Constructed Wetlands Treating Wastewater: A Review. Hydrol. Earth Syst. Sci. 2016, 20, 109–123. [Google Scholar] [CrossRef]
- Xu, T.; Weng, B.; Yan, D.; Wang, K.; Li, X.; Bi, W.; Li, M.; Cheng, X.; Liu, Y. Wetlands of International Importance: Status, Threats, and Future Protection. Int. J. Environ. Res. Public Health 2019, 16, 1818. [Google Scholar] [CrossRef] [PubMed]
- Mburu, N.; Tebitendwa, S.M.; Van Bruggen, J.J.A.; Rousseau, D.P.L.; Lens, P.N.L. Performance Comparison and Economics Analysis of Waste Stabilization Ponds and Horizontal Subsurface Flow Constructed Wetlands Treating Domestic Wastewater: A Case Study of the Juja Sewage Treatment Works. J. Environ. Manag. 2013, 128, 220–225. [Google Scholar] [CrossRef]
- Walton, C.R.; Zak, D.; Audet, J.; Petersen, R.J.; Lange, J.; Oehmke, C.; Wichtmann, W.; Kreyling, J.; Grygoruk, M.; Jabłońska, E.; et al. Wetland Buffer Zones for Nitrogen and Phosphorus Retention: Impacts of Soil Type, Hydrology and Vegetation. Sci. Total Environ. 2020, 727, 138709. [Google Scholar] [CrossRef]
- Were, D.; Kansiime, F.; Fetahi, T.; Cooper, A.; Jjuuko, C. Carbon Sequestration by Wetlands: A Critical Review of Enhancement Measures for Climate Change Mitigation. Earth Syst. Environ. 2019, 3, 327–340. [Google Scholar] [CrossRef]
- Lynch, L.M.; Sutfin, N.A.; Fegel, T.S.; Boot, C.M.; Covino, T.P.; Wallenstein, M.D. River Channel Connectivity Shifts Metabolite Composition and Dissolved Organic Matter Chemistry. Nat. Commun. 2019, 10, 459. [Google Scholar] [CrossRef]
- Stefanakis, A. The Use of Nature-Based Solutions for Circular Water Management: International Case Studies and Examples of Ecological Engineering. In Water Management and Circular Economy; Elsevier: Amsterdam, The Netherlands, 2023; pp. 67–80. [Google Scholar] [CrossRef]
- Olago, D.O.; Downing, T.A.; Githiora, Y.; Borgemeister, C.; Kamau, J.; Kuiper, G.; Koné, N.A.; Omuombo, C. Nature-Based Solutions in the Savanna Belt of Africa: Insights from a Systematic Review. Nat. Based Solut. 2024, 6, 100154. [Google Scholar] [CrossRef]
- Saeed, T.; Sun, G. The Removal of Nitrogen and Organics in Vertical Flow Wetland Reactors: Predictive Models. Bioresour. Technol. 2011, 102, 1205–1213. [Google Scholar] [CrossRef]
- García-Ávila, F.; Patiño-Chávez, J.; Zhinín-Chimbo, F.; Donoso-Moscoso, S.; Flores Del Pino, L.; Avilés-Añazco, A. Performance of Phragmites Australis and Cyperus Papyrus in the Treatment of Municipal Wastewater by Vertical Flow Subsurface Constructed Wetlands. Int. Soil. Water Conserv. Res. 2019, 7, 286–296. [Google Scholar] [CrossRef]
- Kassa, Y.; Mengistou, S. Nutrient Uptake Efficiency and Growth of Two Aquatic Macrophyte Species under Constructed Wetlands, Ethiopia. Ethiop. J. Sci. 2014, 37, 95–104. [Google Scholar]
- Africa Development Bank. Kampala Sanitation Program, Phase 1 and Supplementary Loan to Kampala Sanitation Program; Project Completion Report RDGE/AHWS/COUG; National Water and Sewerage Corporation (NSWC) and Kampala Capital City Authority: Kampala, Uganda, 2021; pp. 1–38. Available online: https://www.afdb.org/sites/default/files/documents/projects-and-operations/uganda_-_kampala_sanitation_program_phase_1_and_supplementary_loan_to_kampala_sanitation_program_-_project_completion_report.pdf (accessed on 24 January 2025).
- Kayima, J.K.; Mayo, A.W. Ecological Characteristics and Morphological Features of the Lubigi Wetland. Environ. Ecol. Res. 2018, 6, 218–228. [Google Scholar] [CrossRef]
- Kayima, J.K.; Mayo, A.W.; Nobert, J.K. The Fate of Nitrogen and Faecal Coliform in the Lubigi Wetland. Tanzan. J. Eng. Technol. 2018, 37, 137–154. [Google Scholar] [CrossRef]
- APHA. Standard Methods for the Examination of Water and Wastewater, 23rd ed.; American Public Health Association: Washington, DC, USA, 2017. [Google Scholar]
- Smith, G. Step Away from Stepwise. J. Big Data 2018, 5, 32. [Google Scholar] [CrossRef]
- Twesigye, C.K.; Igunga, K.; Nakayinga, R. Effect of Land Use Activities on Water Quality and Vegetation Cover Change in Nsooba-Lubigi Wetland System, Kampala City. East. Afr. J. Biophys. Comput. Sci. 2024, 5, 13–28. [Google Scholar] [CrossRef]
- Kayima, J.K.; Mayo, A.W. Nitrogen Removal Buffer Capacity of the Lubigi Wetland in Uganda. Phys. Chem. Earth Parts A/B/C 2020, 117, 102883. [Google Scholar] [CrossRef]
- Kibira, W.N.; Aremu, A.; Masaba, S. Assessing Wetland Health through Decomposition in Degraded and Semi-Intacted Wetlands in Uganda. East. Afr. J. Environ. Nat. Resour. 2024, 7, 17–34. [Google Scholar] [CrossRef]
- Hawumba, J.F. The Impact of Kalerwe Abattoir Wastewater Effluent on the Water Quality of the Nsooba Channel. ARTOAJ 2017, 6, 555677. [Google Scholar] [CrossRef]
- Białowiec, A.; Albuquerque, A.; Randerson, P.F. The Influence of Evapotranspiration on Vertical Flow Subsurface Constructed Wetland Performance. Ecol. Eng. 2014, 67, 89–94. [Google Scholar] [CrossRef]
- Atwebembeire, J.; Andama, M.; Yatuha, J.; Lejju, J.B.; Rugunda, G.K.; Bazira, J. The Physico-Chemical Quality of Effluents of Selected Sewage Treatment Plants Draining into River Rwizi, Mbarara Municipality, Uganda. J. Water Resour. Prot. 2019, 11, 20–36. [Google Scholar] [CrossRef]
- Arinabo, D. Understanding the Evolving Nature of Urban Flood Risks in Sub-Saharan Africa: The Case of Kampala City, Uganda. In Floods—Hydraulics and Hydrology [Working Title]; IntechOpen: London, UK, 2024. [Google Scholar] [CrossRef]
- Osibanjo, O.; Adie, G.U. Impact of Effluent from Bodija Abattoir on the Physico-Chemical Parameters of Oshunkaye Stream in Ibadan City, Nigeria. Afr. J. Biotechnol. 2007, 6, 1806–1811. [Google Scholar] [CrossRef]
- Kansiime, F.; Kateyo, E.; Oryem-Origa, H.; Mucunguzi, P. Nutrient Status and Retention in Pristine and Disturbed Wetlands in Uganda: Management Implications. Wetl. Ecol. Manag. 2007, 15, 453–467. [Google Scholar] [CrossRef]
- Semiyaga, S.; Okure, M.A.E.; Niwagaba, C.B.; Katukiza, A.Y.; Kansiime, F. Decentralized Options for Faecal Sludge Management in Urban Slum Areas of Sub-Saharan Africa: A Review of Technologies, Practices and End-Uses. Resour. Conserv. Recycl. 2015, 104, 109–119. [Google Scholar] [CrossRef]
- Krzeminski, P.; Vogelsang, C. Conventional Wastewater Treatment Methods and Their Ability to Remove EDCs. In Environmental Contaminants and Endocrine Health; Elsevier: Amsterdam, The Netherlands, 2023; pp. 309–328. [Google Scholar] [CrossRef]
- Li, J.; Li, X.; Liu, H.; Gao, L.; Wang, W.; Wang, Z.; Zhou, T.; Wang, Q. Climate Change Impacts on Wastewater Infrastructure: A Systematic Review and Typological Adaptation Strategy. Water Res. 2023, 242, 120282. [Google Scholar] [CrossRef] [PubMed]
- Tchobanoglous, G.; Stensel, D.H.; Tsuchihashi, R.; Burton, F.; Abu-Orf, M.; Bowden, G.; Pfrang, W. Metcalf & Eddy. In Wastewater Engineering: Treatment and Resource Recovery, 5th ed.; Albert Einstein College of Medicine, Ed.; McGraw-Hill Education: New York, NY, USA, 2014. [Google Scholar]
- Kujawa-Roeleveld, K.; Zeeman, G. Anaerobic Treatment in Decentralised and Source-Separation-Based Sanitation Concepts. Rev. Environ. Sci. Biotechnol. 2006, 5, 115–139. [Google Scholar] [CrossRef]
- Muhoozi, E.; Ayugi, G.; Muyimbwa, D.; Oruru, B.; Kyagulanyi, H.; Wabwile, R. Heavy Metals and Naturally Occurring Radionuclides Distribution Risk Assessment in Wetlands in Kampala, Uganda. J. Rad. Nucl. Appl. 2023, 8, 127–133. [Google Scholar] [CrossRef]
- Vymazal, J. The Use of Hybrid Constructed Wetlands for Wastewater Treatment with Special Attention to Nitrogen Removal: A Review of a Recent Development. Water Res. 2013, 47, 4795–4811. [Google Scholar] [CrossRef] [PubMed]
- Okurut, O.O.; Rijs, G.B.J.; van Bruggen, J.A. Design and Performance of Experimental Constructed Wetlands in Uganda, Planted with Cyperus Papyrus and Phragmites Mauritianus. Water Sci. Technol. 1999, 40, 265–271. [Google Scholar] [CrossRef]
- Dagne, A.; Lakew, A.; Tadesse, S.; Hailemichael, F. Comparative Nutrient Removal Efficiency of Three Cyperus Species in Vertical Flow Type of Constructed Wetlands, Sebeta, Ethiopia. J. Agri. Environ. Sci. 2024, 9, 1–10. [Google Scholar] [CrossRef]
- Chang, J.; Wu, S.; Liang, K.; Wu, Z.; Liang, W. Responses of Microbial Abundance and Enzyme Activity in Integrated Vertical-Flow Constructed Wetlands for Domestic and Secondary Wastewater. Desalination Water Treat. 2015, 56, 2082–2091. [Google Scholar] [CrossRef]
- Matovu, B.; Sarfo, I.; Bbira, Y.; Yeboah, E.; Muhoozi, Y.; Lukambagire, I. Navigating through Complexity by Profiling the Main Threats to Sustainable Tropical Wetlands Management and Governance: A Case Study of Mityana District, Uganda. Discov. Environ. 2024, 2, 18. [Google Scholar] [CrossRef]
- James Gideon, O.; Bernard, B. Effects of Human Wetland Encroachment on the Degradation of Lubigi Wetland System, Kampala City Uganda. Environ. Ecol. Res. 2018, 6, 562–570. [Google Scholar] [CrossRef]


Disclaimer/Publisher’s Note: The statements, opinions and data contained in all publications are solely those of the individual author(s) and contributor(s) and not of MDPI and/or the editor(s). MDPI and/or the editor(s) disclaim responsibility for any injury to people or property resulting from any ideas, methods, instructions or products referred to in the content. |
© 2025 by the authors. Licensee MDPI, Basel, Switzerland. This article is an open access article distributed under the terms and conditions of the Creative Commons Attribution (CC BY) license (https://creativecommons.org/licenses/by/4.0/).