Abstract
We used transient electromagnetic (TEM) to map the hydrogeological structures in the Choushui River Alluvial Fan in Yunlin County of central Taiwan. A total of 63 TEM measurements were collected using the FASTSNAP system with 50 × 50 m in-loop configurations in the middle and distal fan. The 1D model, based on prior information, was constructed from the inverted soundings. Results showed a thin, resistive shallow layer and a 40 m low-resistive (6–42 ohm-m) zone beneath it. High-resistive zones (50–170 ohm-m) were found from 50–120 m depth, and low-resistive zones were revealed below 120 m in some areas. Results were consistent with resistivity and lithology logs from nearby wells. The inverted TEM models provide reliable subsurface information when prior informations of vertical electrical sounding and TEM were considered. We interpolated resistivity at 10 m, 50 m, 100 m, and 160 m depth from the 1D model results to produce a slice map of the area, which indicated variations, trends, and depths of the sediment deposits. The TEM method successfully identified the hydrogeological structures, showing that the upper 40 m of sediment acts as a confining layer for the aquifer structure from 50 m to 120 m depth.
1. Introduction
Hydrogeological structures are critical components for identifying potential groundwater zones. The heterogeneous distribution of groundwater in space and time is linked to those structural features. It is essential to establish rules based on those features for sustainable groundwater resource management; to use the resource appropriately for the present and long term in the future [,,,,,]. Improper groundwater management leads to inappropriate groundwater utilization []. It may cause rapid groundwater depletion, where groundwater is extracted faster than it can be replenished, raising sustainability concerns and other environmental problems, i.e., land subsidence and salt intrusions, which are most common in coastal aquifers [,].
There is an increase in population in coastal areas due to their suitability for agricultural and industrial purposes. Which, along with drought, causes groundwater depletion and results in land subsidence [,] and salt intrusion [,]. The Choushui River Alluvial Fan is one of those areas, a coastal aquifer that serves as a significant groundwater source in Taiwan. Hence, the hydrogeological structures and continuity need to be well-known to use properly and sustainably. However, hydrogeological structures in coastal sediments are complex. It is due to the lithologic heterogeneities inherent in these settings []. The central geological survey of Taiwan drilled several observation wells in the Choushui River Alluvial Fan. Therefore, they construct the geological cross-section using the available drillers’ log lithology and interpret it hydrogeologically []. Nonetheless, despite its accuracy in the local case, using drillers’ log data at discrete locations has limitations in showing the continuity of hydrogeological structures in such complex settings.
Alternatively, geophysical approaches, exciting the earth on the surface with some energy at several points and measuring the responses, give rapid images of the target structures linked to the computed physical parameters. The transient electromagnetic method (TEM) is increasingly used among geophysical techniques. TEM is an electromagnetic detection method built in the time domain that uses artificial sources and is based on the principle of induction. Primary fields are transmitted underground using ungrounded loops, which excite induced currents in conductive media. Induced currents produce secondary fields on the surface that are measured and analyzed. TEM is widely used for hydrogeological studies. For instance, water-bearing formations and continuity [,,,,], groundwater susceptibility to contaminations [], salt intrusion [,], and confining unit thickness [] are to mention some of hydrogeological studies using TEM. Because of its sensitivity to conductive targets, it is preferable among electromagnetic domain methods used for hydrogeological studies.
The suitability of arrangements and focus of the induced currents beneath the loop, usually, TEM soundings are inverted for 1D models [], which are more appropriate for vertical resolution. However, 2D and 3D interpretations based on the 1D inverted data give valuable insights. Soupios et al. [] used TEM to investigate the hydrogeological geometry and salt intrusion of northwestern Chania in Greece. They inverted the individual soundings in 1D, created the 2D and 3D models from the inverted 1D data, and interpreted them using geological and structural prior information. By integrating the driller’s log and 1D inverted airborne transient electromagnetic (AEM) data, Christensen & Christiansen [] estimated the thickness of confining structures and presented them as a map. Danielsen [] mapped a low-resistivity Tertiary clay layer in Denmark by collecting using different TEM systems and combining high-quality data. Further, 2D and 3D regional hydrogeological structures are mapped based on the spatially constrained 1D inverted large volume of AEM data in the Central Valley of California [,].
In line with previous research, this study inverts the separate TEM soundings in 1D based on isotropic and horizontal layer assumptions to map the hydrogeological structures of the Choushui River Alluvial Fan in the Yunlin area. To invert the data, the Model 3.1 software developed by SIGMA-GEO for the FASTSNAP instrument [] and ZondTEM1D 5.1 software were used. In inverse theory, many models equally satisfy the observed data, the nonuniqueness problem []. Therefore, approximate models are identified by incorporating as much prior information as possible [,]. Thus, we used Vertical Electrical Sounding (VES) results as the initial model to invert the data using Model 3 software. We also used inverted 1D TEM data using ZondTEM1D 5.1 software as the initial model to check the consistency of the model. Moreover, the 1D TEM models were interpreted with the nearby observation well lithology and resistivity logs. We extracted the resistivity values at different depths and interpolated them to observe the variation in the area. The consistency of models with lithology confirms the acceptability of the models. We identified hydrogeological structures laterally and vertically based on TEM resistivity variations. Thus, using appropriate initial values for the forward model and drillers log as a guide for TEM interpretation helps to construct the most acceptable and consistent models with the variations of hydrogeological structures.
2. Principle of Time Domain Electromagnetic Method (TEM)
In TEM, a steady current is excited in an ungrounded transmitter loop. A primary magnetic field is established, curling the loop associated with the current. The current is interrupted by a fast shut-off time. Consequently, the primary magnetic field collapse, and currents are induced in the subsurface conductor materials. Hence, the induced current gets attenuated in the subsurface. The induced currents’ speed and amplitude play an important role in characterizing the subsurface. Secondary magnetic fields due to the induced currents continue while the primary field is intentionally turned off. The coil sensor on the surface measures the voltage transient produced by the secondary magnetic field, which is linked with the subsurface material’s resistivity variation [,]. Theoretically, the sensor opens its gate once the primary magnetic field is turned off. For a central loop configuration on the surface of a homogeneous half-space, the time derivative of the vertical secondary magnetic field, voltage transient is expressed as;
Equation (1) is approximated at early and late times, i.e., and , respectively, as;
where I is the current initiated in the transmitter, a is the radius, erf is the error function, t is the time, is resistivity, and μ is magnetic permeability.
Early time data is dependent on the loop size. Thus, the early time data tells us the initial strength of the response. The response that helps us characterize the subsurface is late time approximations; it has the resistivity information and its interpretation considered at a finite time length depending on the background noise level.
3. Description of the Study Area
Yunlin area is in western central Taiwan and bordered by the Taiwan Strait to the west, the Central Mountain to the east, the Choushui River to the north, and the Peikang River to the south (Figure 1). It is an agricultural area in the Choushui River Alluvial Fan. The area’s agricultural activities depend heavily on groundwater availability, especially in the Choushui River Alluvial Fan. The primary source of water is groundwater. The area has had significant land subsidence due to the overuse of groundwater for industrial and agricultural purposes. The overpumping of groundwater in Yunlin County also results in seawater intrusion. Therefore, understanding the hydrogeological structures of the region will be crucial for groundwater management and future modeling. We gathered TEM data in the Choushui River Alluvial Fans, particularly in Yunlin County.
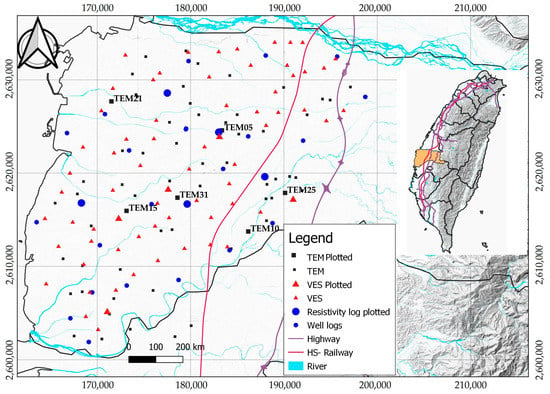
Figure 1.
Location map of the study area. Data point distribution of TEM, well logs, and VES are shown.
4. Geological and Hydrogeological Settings
As shown in Figure 2a, an alluvial fan covers the study area, and the boundary zone is covered by the terrace and alluvial fan, while the eastern part, which is part of the Central Mountain Range, is characterized by Toukoshan, Kueichulin, and Nanchang formations, which are furtherly described by Hung et al. []. Most of the alluvial sediments in the study area are deposited by the Choushui River, which flows from the Central Mountain Range to the sea. According to Central Geological Survey [], the Choushui River Alluvial Fan formed in the late Quaternary and is divided into three sections: the proximal fan, the middle fan, and the distal fan. The alluvial deposit near the mountain area, known as the proximal fan, is characterized by gravelly and sandy sediments. The middle fan is the central part of an alluvial fan with coarse to medium sand, whereas the distal fan is far from the source area with fine sand and clay sediments deposition.
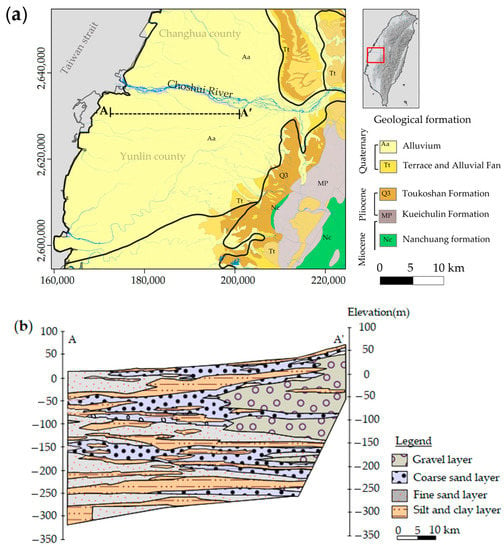
Figure 2.
(a) Geological map of Choushui River Alluvial Fan, (b) cross-section along A−A’ profile developed using lithology logs of the observation wells (Modified from []).
The Choushui River Alluvial Fan is the major groundwater system in Taiwan. The hydrogeological structures of Yunlin County are formed by interbedded clay, fine to coarse-grained sand, and gravel layers that vary in thickness across the alluvial fan []. According to other studies [,], hydrogeological structures from the surface down to a depth of around 300 m are identified based on linear interpolation of well-log information. The cross-section A−A’ (Figure 2b) shows that the proximal fan has gravel layers with some coarse and fine sand layers that serve the high groundwater potential aquifer of the study area. The middle fan, which has coarse and fine sand layers as well as some gravel sediments, is characterized by an aquifer with some confining clay and silt layers. On the other hand, the distal fan with silt, clay, and fine sand layers, including coarse sand layers, may have less groundwater potential as it is dominated by confining clay and silt layers.
5. Methods
5.1. Instrumentations
This study used a ground-based FASTSNAP system to collect TEM data. The system has a twisted copper wire transmitter loop and coil receiver that can be configured to the researcher’s preference. The earth is excited by a square waveform initiated in the transmitter loop with fast switched-off time; 1–2 μs for 25 m loop side length and 2.5–4.5 μs for 100 m side length loop. It continuously records multiple recordings at low, medium, and high modes by changing current, gain, and discretization. The system provides measurement sampling rates of up to 40 MHz with a low current to enhance early-time responses and a high current of up to 4 KHz []. The ranges of the sampling rate help to have the best possible resolution at both early and late times []. Response transients of the decay were filtered, and the best sections of the data collected using different modes were combined into one final curve for each sounding location.
5.2. Data Acquisition, Processing, and Inversion
Prior to the actual field data acquisition, we did preliminary TEM field tests near borehole sites to observe the results and calibrate the instrument with local geology responses. Parameters, such as period, shift, gain, current mode, discretization, and other settings, were defined based on the field test data analysis, as they are critical in obtaining high-quality data. From 2021 to 2022, we collected 63 TEM sounding points in the middle and distal fan (Figure 1) and 77 points in the proximal fan of the Choushui River Alluvial Fan of the Yunlin area. The proximal fan data are intended to identify artificial aquifer recharging sites, which will be our next research work that integrates electrical resistivity tomography and VES data with TEM. Although our initial TEM site selections are based on research area coverage, survey sites were assigned based on local noise conditions such as power lines, metallic fences, electric trains, and other artificial noise sources. We also injected more pulses to reduce noise interference. The TEM data are collected using 50 m × 50 m transmitter in-loop configurations.
The acquisition mode of the system is bipolar; the polarity of the current pulse varies alternatively (Figure 3a). The quality of each recorded pulse is fundamental for the final output. Therefore, quality assessment is done qualitatively on the individuals one by one (Figure 3a) or the whole recorded pulse at once (Figure 3b). The strange appearance of the pulse out of the whole indicates noise interference. Subtracting the odd (negative) from even (positive) pulses and dividing the result by two resulted in a half-difference of the signals with a positive polarity. Therefore, further processing is conducted on the half-difference signal. We applied arithmetic averaging of records for each time slot to increase the signal-to-noise ratio using TEM-processing 1.4 software (Figure 3c). As shown in Figure 3d the records at different modes were stitched, resulting in a response decay curve.
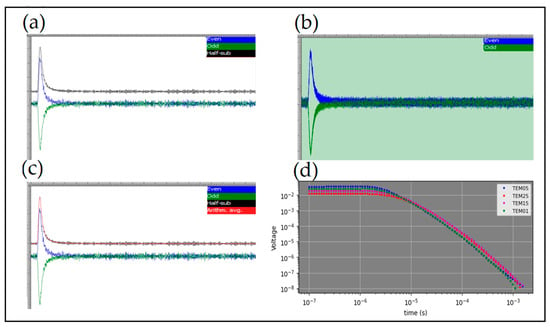
Figure 3.
(a) TEM05 raw data of a pulse response; the black is a half difference of the positive(even) and negative (odd) pulses. (b) the whole pulses of TEM05. (c) Calculated arithmetic averaging (red signal) of records along each time gate to increase the signal-to-noise ratio. (d) sample response decay curves of different soundings.
Rough interpretations of the subsurface from the response decay curve at an equivalent time depth give valuable information about the vertical resistivity variation. However, inversion of individual soundings is required to estimate the resistivity and thickness, which are the model parameters in the TEM method. Sediments and sedimentary rocks have different resistivities depending on their porosity, fluid saturation, fluid type, clay content, temperature, and other factors []. Despite this, resistivity variation optimized in a standard procedure reveals hydrogeological structures. These will be more reliable if prior information is used as a guide to estimate model parameters or is incorporated into the inversion process to obtain the approximate model.
The inversion of electromagnetic data relies on 1D models due to the focus of the induced currents beneath the transmitter loop and the high depth-to-lateral investigation ratio []. Therefore, it is more convenient to do perform the 1D inversion if the lateral rate of change of the subsurface resistivity is small. One of the challenges in TEM inversion is uniquely estimating model parameters, i.e., resistivity and thickness, simultaneously []. The inverse problem is always problematic unless care is taken in the inversion process. The limitation of gradient-based inversion, on which our inversion software is based, is its dependence on the initial model. Suppose the initial model is not close to the actual model. In that case, the iteration may get stacked in the local minima and show an acceptable discrepancy from the observed data that does not convey the precise formation response. Therefore, we used the VES and ZondTEM1D models as initial values to invert the TEM data in Model 3.1 software. This allows us to build the 1D model in agreement with the lithology of the nearby observation well.
6. Results
6.1. TEM 1D Models
Figure 4a–d shows an example 1D resistivity model of the TEM05, TEM10, TEM31, and TEM21 sites. The model revealed a relatively resistive thin layer in the upper 5–10 m with resistivity ranging from 25 to 42 Ohm-m, which is interpreted as a fine and coarse sand unit. This thin layer is hydrogeologically referred to as an unconfined aquifer unit, similar to other studies, e.g., []. However, because of some technical limitations, i.e., the input current turn-off time depends on the transmitter moment, which affects the TEM method’s minimum detection depth [,], we are not confident in interpreting this layer. The low-resistivity material 6–40 Ohm-m is found at about 10–50 m depth. It is interpreted as a clayey and muddy layer, an aquitard unit. The resistivity increases, greater than 50 Ohm-m, starting from around 50 m down to 120 m depth. The resistivity gradually increases with depth to the western side of the study area and rapidly to the eastern side, indicating the variation in the resistive materials’ thickness. This layer is the thickest fine-to-coarse sand and gravel unit, which is the major aquifer unit of Yunlin area [,,]. Resistivity relatively decreases after a depth of 120 m, except for some localities, particularly in the northeastern part of the study area (Figure 4c). This exception could be associated with the dominance of gravels to the proximal fan side. However, analyzing trends of all the 1D TEM models, this layer is interpreted as an aquitard unit of the area.
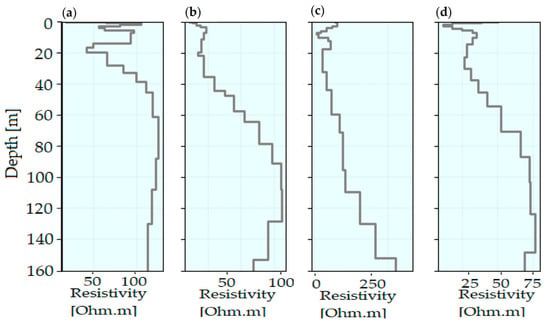
Figure 4.
Sample TEM sounding resistivity 1D models; (a) TEM05, (b) TEM15, (c) TEM25, (d) TEM31. Resistivity and thickness are estimated using VES data as an initial value.
Comparing the individual 1D models, the thickness of sediment deposits varies over the alluvial fan, being thick in some localities and thinning in others. However, the continuation of thick, relatively high resistivity is found between 50 and 120 m depth, which is mapped as regional aquifer structures in the study area’s scale. This thickness increases to the proximal fan side. Clear images of the continuation are shown in the slice map (Figure 5c). The low resistivity responses at different depths reveal clayey and muddy sediments, which are theoretically impermeable.
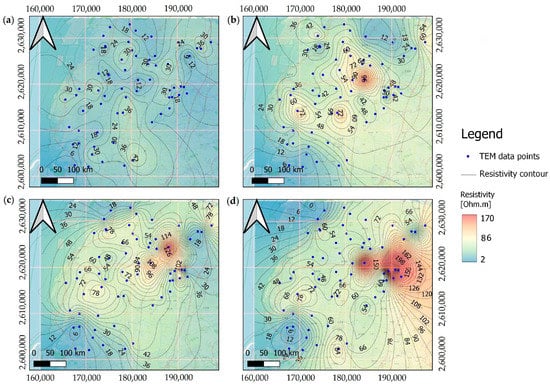
Figure 5.
Inverted resistivity slice map from a 1D TEM model: (a) at 10 m depth, (b) at 50 m depth, (c) at 100 m depth, (d) at 160 m depth.
6.2. Slice Maps
Figure 5a–d shows slice maps at 10 m, 50 m, 100 m, and 160 m depths constructed by interpolating resistivity values extracted from the 1D model in the entire alluvial system. Figure 5a shows the occurrence of low-resistivity material throughout the study area. The maximum resistivity at this depth is 42 Ohm-m, and this material signature extends to the northeast part of the area.
As evidenced by the 1D models, this material response could be the base of unconfined aquifer units of fine and coarse sand sediments. Low resistive materials (6–12 Ohm-m) are also revealed in the southern part and extend to the north, flanking relatively resistive sediment deposits. It seems to be the top feature of clay/silt deposits. The central part of the area shows resistive material responses at a 50 m depth (Figure 5b). At this depth, the site’s southern, western, and northern parts remain low resistive (6–12 Ohm-m). The slice map reveals the continuation of resistive materials up to 100 m deep. It expands in the central region and to the sea (Figure 5c). Perhaps, the relatively low resistivity western part has compared to the eastern part may indicate the grain size variations of the sediment since the layer is composed of fine-to-coarse sand deposits. Moreover, the distal fan is dominated by fine sand around this depth, which is the western extension of the major aquifer unit. Furthermore, low resistive materials appear in the northeastern sites, which are not mapped at 160 m depth (Figure 5d). The maximum resistive materials, up to 170 Ohm m, are localized in the northeast region at 160 m depth.
7. Discussions
Choushui River Alluvial Fan sediments ranged from clayey to gravel with varying resistivity. Moreover, 1D TEM models (Figure 4) and slice maps (Figure 5) show resistivity variation vertically and horizontally over the area. Significant variations were observed in the hydrogeological structure changes linked with clayey/muddy to sandy/gravel units. The stress–strain analysis of multilayer compaction well measurements [] indicates that land subsidence in the area is associated with the compaction of those clayey materials at different depths found around the same depth with 1D TEM models. In addition, Lin et al. [] concluded that a decrease in lateral pore pressure caused by a decline in groundwater level results in the compaction of the clay sediments, resulting land subsidence in the area. Thus, identifying the hydrogeological structures with large data volumes will significantly contribute to groundwater management. Lin et al. [] suggested artificial groundwater recharge to mitigate land subsidence. Hence, detailed hydrogeological characterization is needed to select the artificial recharge sites, which will be the focus of our future work.
Considering the complex sediment deposition and inherent inversion problems, we inverted the data to have an acceptable and reasonable model, considering VES and inverted data using ZondTEM1D 5.1 software as the initial input value for the forward modeling of individual TEM-sounding inversions. Moreover, the drillers’ log lithology is considered an interpretation guide, as shown in Figure 6. The assumption is that resistivity variations trace variations in depositions sediment type. Therefore, the equivalent regional hydrogeological structures are mapped by connecting the individual sounding 1D models. The intercalations of the medium to coarse sand unit and the clay/silt unit in the upper 50 m give low resistivity responses (Figure 6a). It is likely due to the dominance of clay/silt sediments. The more resistive response is found around 100 m depth, the medium to coarse sand and gravel unit. The same trend is followed in Figure 6b. Thus, as observed from Figure 6a,b, the 1D models highly correlate with the variation of sediment depositions; equivalent hydrogeological structures.
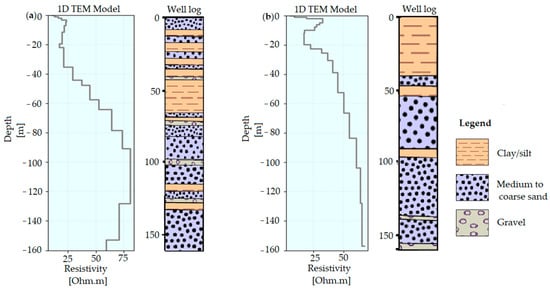
Figure 6.
Comparison of 1D TEM model with nearby well log lithology, (a) TEM15 and Mindgde well log, and (b) TEM10 and TUKU well log.
7.1. VES Data as an Initial Model
We used VES data as the initial model to resolve the mentioned problems, i.e., the solution falls fast to the acceptable model if the initial value is near to the actual value. The 1D TEM models follow the trends of the VES model and ensure that the initial model is essential in gradient-based inversion, as shown in Figure 7. Almost all 1D models follow the same trend as the VES models. However, the ZondTEM1D model of the same sounding point shows over/undershooting of resistivity following the same trend as the other two models. Perhaps this is because ZondTEM1D models are constructed based on constant half-space resistivity as the initial value for each sounding.
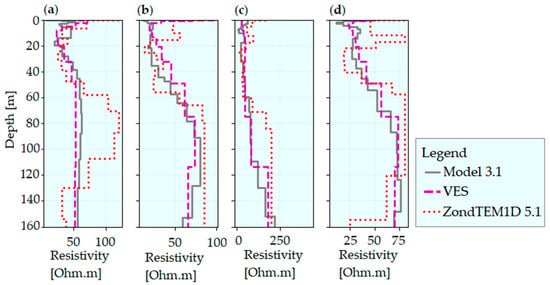
Figure 7.
Comparison of the resistivity models. The inverted models for (a) TEM05, (b) TEM15, (c) TEM25, and (d) TEM31 are obtained using Vertical Electrical Sounding (VES) as the initial model. The ZondTEM1D models are based on constant half-space resistivity initial value.
Based on the information from the nearby observation wells, the shallow low resistivity associated with the clayey/fine sandy sediments and resistive materials associated with coarse sand sediments is mapped by both models. These resistive sediments are distributed in the entire area, slightly varying in thickness. After 120 m depth, except in some localities in the eastern part of the site, relatively low resistivities were revealed.
7.2. ZondTEM1D Data as an Initial Model
To validate the consistency of the modeling software, Model 3, we also used the ZondTEM1D model as an initial model for the TEM data inversion. As shown in Figure 8a–d, the output is compared to the VES and the ZondTEM1D models. The influence of the initial model is straightforward. All 1D models for each sounding identify the same trend’s vertical resistivity and thickness variations. Though the trend is the same, resistivity seems exaggerated in the model TEM05 (Figure 8a). This could be due to the inherent problem of inversions; many models can predict the observed data with the required acceptance order of error.
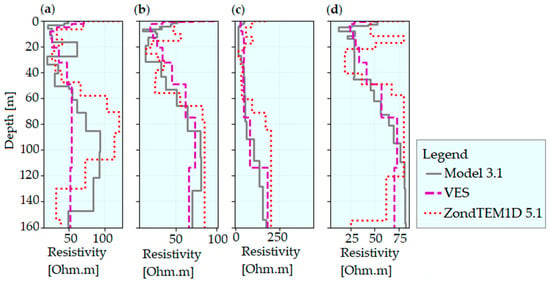
Figure 8.
Comparison of the resistivity models. The inverted models for (a) TEM05, (b) TEM15, (c) TEM25, and (d) TEM31 are obtained using ZondTEM1D models as the initial model. The ZondTEM1D models are based on constant half-space resistivity initial value.
7.3. Comparison of 1D TEM Models and Resistivity Log
The complex sediment deposition in the Choushui River Alluvial Fan has varying resistivity responses. A comparison of 1D models recovered from the TEM inversion with resistivity logs helps us to evaluate our recovered model. As shown in Figure 9a–d, the 1D model and the resistivity logs have nearly the same trend. However, 1D models do not strictly match resistivity log values. This may be due to (1) the sensitivity difference between the two geophysical data sets and (2) the over/underestimation of the initial model. TEM is sensitive to the conductive target, whereas the resistivity log is sensitive to the resistive target. On the other hand, the recovered TEM model is highly dependent on the initial model values. Consequently, though the trend is consistent, the values may not always match strictly. Thus, the resistivity value may be overestimated or underestimated [].
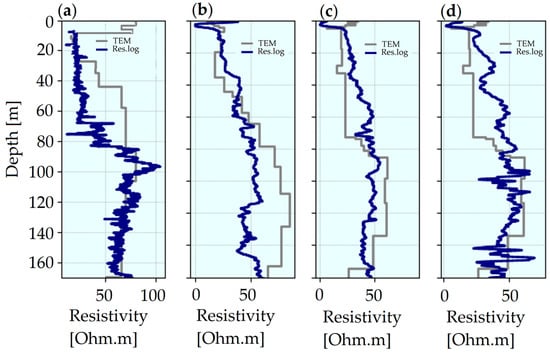
Figure 9.
Comparison of resistivity log and inverted 1D TEM model (a) TEM05 and Ma Kuang well resistivity log, (b) TEM15 and Mindgde well resistivity log, (c) TEM21 and Xinghua well resistivity log, and (d) TEM31 and YuanChang well resistivity log.
Apart from the matching, Figure 9b shows that the resistivity log has a low resistive zone around 125 m depth while it is high in the 1D TEM model. From the general trends and correlations of the nearby observation well lithology, it is a sandy/coarse sand layer at this depth. The collapse of the wall formation is a common problem in drilling wells. A large amount of drilling fluid or mud is typically injected to prevent borehole collapse while drilling, which can significantly displace the formation fluid, especially in porous and permeable media. In such cases, the log resistivity responses may represent drilling fluids rather than formation conditions or local lithology. This low resistivity response was observed in some drill logs of the sandy layers in our study area. However, this does not signify the local lithology responses. In that case, the resistivity for the 1D model is corrected and interpreted as a resistive zone like the other 1D models around the mentioned depth. On the other hand, if the mentioned thought is not valid, it could be due to the non-uniqueness problems of the 1D model.
8. Conclusions
The Choushui River Alluvial Fan is a complex depositional system and is the major groundwater source of Taiwan. We used the TEM method to map hydrogeological structures because it is a powerful geophysical method for hydrogeological studies. Consistent 1D TEM models are constructed considering VES and inverted TEM data using ZondTEM1D 5.1 software as an initial value for the forward model. The 1D TEM model shows the variation in the thickness and continuity of the hydrogeological structure over the area. An aquifer structure in the area is identified between 50 and 120 m depth with a resistivity higher than 50 Ohm-m. It is confined with clayey/muddy units of resistivity less than 42 Ohm-m; aquitard structures. We created a slice map from the 1D TEM models. The resistivity slice map is a handy way to visualize the horizontal continuity of those structures at a specific depth. A more extended resistive aquifer structure is shown clearly at approximately 100 m depth. However, local resistive and low-resistivity material deposits are also mapped. In some area localities at 100 and 160 m depth, i.e., the northeastern part, the resistivity increases to 170 Ohm-m, which could be due to the dominance of coarse grain sediments and gravel units interpreted as an aquifer structure. The interpretations of 1D TEM models with the drillers’ lithology and resistivity log confirm the acceptability of our model. Therefore, the 1D TEM models mapped the two major hydrogeological structures, i.e., aquifer and aquitards, confining the primary aquifer in the area.
Our study suggests possible zones for artificial groundwater recharge in addition to hydrogeological structural mapping. However, specific site characterization is required. The thick resistive responses to the survey site’s eastern side indicate the dominance of coarse materials, which provides insights into the proximal fan hydrogeological structures. Because the proximal fan is characterized by high porosity and permeability, gravel, and sandy sediments, selecting artificial sites for groundwater recharge in addition to precipitation recharge can significantly contribute to groundwater recharges of the study area. As the groundwater gradient of the proximal zone increases due to natural or artificial recharge, groundwater can flow to the low gradient zone (middle and distal fan), contributing to local agricultural activities. Our next work will incorporate different geophysical approaches to select specific sites for artificial groundwater recharge.
Author Contributions
Conceptualization, methodology, validation, formal analysis, investigation, L.N.K., P.-Y.C., H.-H.H. and C.-S.C.; original draft preparation, L.N.K.; supervision, P.-Y.C. and H.-H.H.; methodology and data acquisition, L.N.K. and J.-R.Z., review and editing, J.-R.Z., Y.G.D., D.-J.L., J.M.P. and H.H.A. All authors have read and agreed to the published version of the manuscript.
Funding
This research was funded by the Central Geological Survey of Taiwan under the project “Assessment of groundwater recharge potential and analysis of hydrogeological structures (2/4)” grant number: 111-5726901000-05-01.
Data Availability Statement
Data will be available upon request to the authors.
Conflicts of Interest
The authors declare no conflict of interest.
References
- Kang, S.; Knight, R.; Goebel, M. Improved Imaging of the Large-Scale Structure of a Groundwater System with Airborne Electromagnetic Data. Water Resour. Res. 2022, 58, e2021WR031439. [Google Scholar] [CrossRef]
- Pepin, K.; Knight, R.; Goebel-Szenher, M.; Kang, S. Managed aquifer recharge site assessment with electromagnetic imaging: Identification of recharge flow paths. Vadose Zone J. 2022, 21, e20192. [Google Scholar] [CrossRef]
- Knight, R.; Smith, R.; Asch, T.; Abraham, J.; Cannia, J.; Viezzoli, A.; Fogg, G. Mapping Aquifer Systems with Airborne Electromagnetics in the Central Valley of California. Groundwater 2018, 56, 893–908. [Google Scholar] [CrossRef] [PubMed]
- Hering, J.G.; Ingold, K.M. Water resources management: What should be integrated? Science 2012, 336, 1234–1235. [Google Scholar] [CrossRef] [PubMed]
- Loucks, D.P. Sustainable Water Resources Management. Water Int. 2000, 25, 3–10. [Google Scholar] [CrossRef]
- Zech, A.; Zehner, B.; Kolditz, O.; Attinger, S. Impact of heterogeneous permeability distribution on the groundwater flow systems of a small sedimentary basin. J. Hydrol. 2016, 532, 90–101. [Google Scholar] [CrossRef]
- Dou, X. A critical review of groundwater utilization and management in China’s inland water shortage areas. Water Policy 2016, 18, 1367–1383. [Google Scholar] [CrossRef]
- El-Kaliouby, H.; Abdalla, O. Application of time-domain electromagnetic method in mapping saltwater intrusion of a coastal alluvial aquifer, North Oman. J. Appl. Geophys. 2015, 115, 59–64. [Google Scholar] [CrossRef]
- Erban, L.E.; Gorelick, S.M.; Zebker, H.A. Groundwater extraction, land subsidence, and sea-level rise in the Mekong Delta, Vietnam. Environ. Res. Lett. 2014, 9, 084010. [Google Scholar] [CrossRef]
- Lin, C.-W.; Hwung, H.-H.; Hsiao, S.-C.; Yeh, C.-L.; Hsu, J.-T. Land Subsidence Caused by Groundwater Exploitation in Yunlin, Taiwan. In Proceedings of the ICHE 2016 Proceedings of the 12th International Conference on Hydroscience & Engineering, Tainan, Taiwan, 6–10 November 2016. [Google Scholar]
- Liu, C.-H.; Pan, Y.-W.; Liao, J.-J.; Huang, C.-T.; Ouyang, S. Characterization of land subsidence in the Choshui River alluvial fan, Taiwan. Environ. Geol. 2004, 45, 1154–1166. [Google Scholar] [CrossRef]
- Chen, C.-S. TEM Investigations of Aquifers in the Southwest Coast of Taiwan. Groundwater 1999, 37, 890–896. [Google Scholar] [CrossRef]
- CGS. The Investigation of Hydrogeology in the Choushui River Alluvial Fan, Taiwan; Central Geological Survey of Taiwan: Taipei, Taiwan, 1999. [Google Scholar]
- Christensen, N.B.; Sørensen, K.I. Integrated Use of Electromagnetic Methods for Hydrogeological Investigations. In Proceedings of the 7th EEGS Symposium on the Application of Geophysics to Engineering and Environmental Problems, Boston, MA, USA, 27 March–31 March 1994; European Association of Geoscientists & Engineers: Houten, The Netherlands, 1994. [Google Scholar] [CrossRef]
- Amato, F.; Pace, F.; Vergnano, A.; Comina, C. TDEM prospections for inland groundwater exploration in semiarid climate, Island of Fogo, Cape Verde. J. Appl. Geophys. 2021, 184, 104242. [Google Scholar] [CrossRef]
- Leite, D.N.; Bortolozo, C.A.; Porsani, J.L.; Couto, M.A., Jr.; Campaña, J.D.R.; dos Santos, F.A.M.; Rangel, R.C.; Hamada, L.R.; Sifontes, R.V.; de Oliveira, G.S.; et al. Geoelectrical characterization with 1D VES/TDEM joint inversion in Urupês-SP region, Paraná Basin: Applications to hydrogeology. J. Appl. Geophys. 2018, 151, 205–220. [Google Scholar] [CrossRef]
- Martínez-Moreno, F.; Monteiro-Santos, F.; Madeira, J.; Bernardo, I.; Soares, A.; Esteves, M.; Adão, F. Water prospection in volcanic islands by Time Domain Electromagnetic (TDEM) surveying: The case study of the islands of Fogo and Santo Antão in Cape Verde. J. Appl. Geophys. 2016, 134, 226–234. [Google Scholar] [CrossRef]
- Porsani, J.L.; Bortolozo, C.A.; Almeida, E.R.; Sobrinho, E.N.S.; dos Santos, T.G. TDEM survey in urban environmental for hydrogeological study at USP campus in São Paulo city, Brazil. J. Appl. Geophys. 2012, 76, 102–108. [Google Scholar] [CrossRef]
- Baawain, M.S.; Al-Futaisi, A.M.; Ebrahimi, A.; Omidvarborna, H. Characterizing leachate contamination in a landfill site using Time Domain Electromagnetic (TDEM) imaging. J. Appl. Geophys. 2018, 151, 73–81. [Google Scholar] [CrossRef]
- Abu Rajab, J.; El-Naqa, A. Mapping groundwater salinization using transient electromagnetic and direct current resistivity methods in Azraq Basin, Jordan. Geophysics 2013, 78, B89–B101. [Google Scholar] [CrossRef]
- Vest Christiansen, A.; Foged, N.; Auken, E. A concept for calculating accumulated clay thickness from borehole lithological logs and resistivity models for nitrate vulnerability assessment. J. Appl. Geophys. 2014, 108, 69–77. [Google Scholar] [CrossRef]
- Vignoli, G.; Fiandaca, G.; Vest Christiansen, A.; Kirkegaard, C.; Auken, E. Sharp spatially constrained inversion with applications to transient electromagnetic data. Geophys. Prospect. 2015, 63, 243–255. [Google Scholar] [CrossRef]
- Soupios, P.M.; Kalisperi, D.; Kanta, A.; Kouli, M.; Barsukov, P.; Vallianatos, F. Coastal aquifer assessment based on geological and geophysical survey, northwestern Crete, Greece. Environ. Earth Sci. 2010, 61, 63–77. [Google Scholar] [CrossRef]
- Christensen, N.B.; Christiansen, A.V. Using geophysical survey results in the inference of aquifer vulnerability measures. Near Surf. Geophys. 2021, 19, 505–521. [Google Scholar] [CrossRef]
- Danielsen, J.E.; Auken, E.; Jørgensen, F.; Søndergaard, V.; Sørensen, K.I. The application of the transient electromagnetic method in hydrogeophysical surveys. J. Appl. Geophys. 2003, 53, 181–198. [Google Scholar] [CrossRef]
- Sharlov, M.; Kozhevnikov, N.; Sharlov, R. Lake Baikal—A Unique Site for Testing and Calibration of Near-surface TEM Systems. In Proceedings of the 23rd European Meeting of Environmental and Engineering Geophysics, Malmö, Sweden, 3–7 September 2017. [Google Scholar] [CrossRef]
- Jupp, D.L.B.; Vozoff, K. Stable Iterative Methods for the Inversion of Geophysical Data. Geophys. J. Int. 1975, 42, 957–976. [Google Scholar] [CrossRef]
- Jackson, D.D. Interpretation of Inaccurate, Insufficient and Inconsistent Data. Geophys. J. Int. 1972, 28, 97–109. [Google Scholar] [CrossRef]
- Bleistein, N.; Cohen, J.K. Nonuniqueness in the inverse source problem in acoustics and electromagnetics. J. Math. Phys. 1977, 18, 194–201. [Google Scholar] [CrossRef]
- Verma, S.K. Diffusion of an electromagnetic pulse in a heterogeneous earth. In Deep Electromagnetic Exploration. Lecture Notes in Earth Sciences; Springer: Berlin/Heidelberg, Germany, 1998; pp. 527–565. [Google Scholar] [CrossRef]
- Hung, W.-C.; Hwang, C.; Chang, C.-P.; Yen, J.-Y.; Liu, C.-H.; Yang, W.-H. Monitoring severe aquifer-system compaction and land subsidence in Taiwan using multiple sensors: Yunlin, the southern Choushui River Alluvial Fan. Environ. Earth Sci. 2010, 59, 1535–1548. [Google Scholar] [CrossRef]
- Jang, C.-S.; Liu, C.-W.; Chia, Y.; Cheng, L.-H.; Chen, Y.-C. Changes in hydrogeological properties of the River Choushui alluvial fan aquifer due to the 1999 Chi-Chi earthquake, Taiwan. Hydrogeol. J. 2008, 16, 389–397. [Google Scholar] [CrossRef]
- Liu, C.-W.; Jang, C.-S.; Chen, S.-C. Three-dimensional spatial variability of hydraulic conductivity in the Choushui River alluvial fan, Taiwan. Environ. Geol. 2002, 43, 48–56. [Google Scholar] [CrossRef]
- Sharlov, M.; Buddo, I.; Pisarnitskiy, A.; Misurkeeva, N.; Shelohov, I. Shallow transient electromagnetic method application for groundwater exploration: Case study from Greece. ASEG Ext. Abstr. 2019, 2019, 1–5. [Google Scholar] [CrossRef]
- Spies, B.R. Depth of investigation in electromagnetic sounding methods. Geophysics 1989, 54, 872–888. [Google Scholar] [CrossRef]
- Chen, C.-H.; Wang, C.-H.; Hsu, Y.-J.; Yu, S.-B.; Kuo, L.-C. Correlation between groundwater level and altitude variations in land subsidence area of the Choshuichi Alluvial Fan, Taiwan. Eng. Geol. 2010, 115, 122–131. [Google Scholar] [CrossRef]
Disclaimer/Publisher’s Note: The statements, opinions and data contained in all publications are solely those of the individual author(s) and contributor(s) and not of MDPI and/or the editor(s). MDPI and/or the editor(s) disclaim responsibility for any injury to people or property resulting from any ideas, methods, instructions or products referred to in the content. |
© 2023 by the authors. Licensee MDPI, Basel, Switzerland. This article is an open access article distributed under the terms and conditions of the Creative Commons Attribution (CC BY) license (https://creativecommons.org/licenses/by/4.0/).