Abstract
In this study, the CuFe2O4 on rGO/halloysite material was made in an uncomplicated manner. The catalyst has a sandwich-like shape with a uniform coating of the active phase on the rGO sheets and halloysite tubes. The catalyst’s large specific surface area (130 m2/g) and small band gap energy (1.9 eV) allow it to adsorb photons and photocatalyze organic contaminants effectively. In approximately 1 h of light, the catalyst showed high performance in achieving almost complete conversion in photodegrading CIP for an initial CIP concentration of 20 ppm. A pseudo-first-order rate law was followed by the process, as revealed by the experimental results. In addition, the pH effect and the contribution of intermediate reactive radicals that emerged during the photochemical process were explored. The results indicated that hydroxyl radicals and holes had a major impact on CIP decomposition, suggesting that the addition of these radicals could enhance CIP degradation efficiency at a larger scale. This study also confirmed the superiority of catalysis and photochemical processes in environmental treatments by the neutral pH values.
1. Introduction
Antibiotics are undeniably crucial in today’s world. They have helped people overcome many major diseases, and they are also used to promote growth in animals. Numerous investigations have discovered the presence of antibiotics in aquatic organisms, animal feces, soil, sediments, and drinking water as well as in the aquatic environment (wastewater, surface water, groundwater) [1,2]. Concentrations of a few 100 mg/L or mg/kg dry weight concentrations have been recorded in several locations [3]. Antibiotic concentrations in wastewater from hospitals, industrial areas, and waste dumps have all been reported to be excessive [4,5,6]. This will have a detrimental effect on human health, increasing the risk of pollution and disease spreading in the community.
Ciprofloxacin (CIP) is a fluoroquinolone drug prescribed for the treatment of infections involving bacteria. CIP is now widely utilized not only in people but also in animals and plants. CIP concentrations ranging from 0.0018 nmol/L to 19,617 nmol/L were measured in the surface water [7].
Publications have pointed out that CIP is susceptible to direct photochemical alterations generated by direct ultraviolet irradiation as well as the inclusion of photocatalysts and hydrogen peroxide (H2O2) [8,9,10]. Photocatalysis is a highly effective, low-cost, and ecologically benign approach for treating CIP-containing water. Among the challenges of photocatalysis is to improve the efficiency and selectivity of semiconductor photocatalysts under visible-light irradiation. Conventional TiO2, which is widely used as a photocatalyst, has some limitations such as a large band gap (3.0–3.2 eV) that restricts its absorption to the ultraviolet region of the solar spectrum, and a high rate of recombination of photogenerated charge carriers that reduces its photocatalytic activity. Therefore, various strategies have been proposed to overcome these drawbacks, such as doping with metals or non-metals, coupling with other semiconductors, modifying with noble metal nanoparticles, and designing novel nanostructures [11,12]. Several photocatalysts for CIP treatment have been researched and produced, including ZnO-based photocatalysts [13], Ag-TiO2 photocatalysts [14], and Cu2O photocatalysts [15,16]. Since the photo-Fenton effect and the existence of a metal combination are present, CuFe2O4 is a new material that has a small band gap energy and exhibits high and consistent activity during reactions [17,18]. Using a support with the catalyst spread across the surface has been suggested as one way to boost the catalyst’s effectiveness. Materials that have large specific surfaces, great strength, and stability are considered supports. Typical supports include Al2O3, SiO2, SBA-15, and MIL 141. Among the disadvantages of using catalyst support in a photocatalyst is that it may reduce the photocatalytic activity of the catalyst by blocking the active sites or increasing the charge recombination rate. Another disadvantage is that it may affect the stability and recyclability of the photocatalyst by leaching or corrosion. Therefore, choosing a suitable catalyst support material is crucial for enhancing the photocatalytic performance and durability of the catalyst. Some of the factors that should be considered when selecting a catalyst support are the surface area, porosity, chemical stability, optical properties, and compatibility with the photocatalyst [19,20].
Halloysite is a natural kaolin-group mineral that comes in a variety of tubular forms ranging in size from 100 to 200 nm. Halloysite also has a specific area ranging from 50 to 150 m2/g. Furthermore, halloysite nanotubes (HNTs) are highly stable, resistant to organic solvents, and simple to reuse after the reaction. A significant number of recent research efforts have targeted on utilizing halloysite as a support material, where nanoscale metal particles are placed on the exterior of halloysite acting as the catalytic component [21,22,23].
Further, graphene’s superior adsorption capability in environmental treatment processes has been investigated and verified [24]. Several methods for making graphene-based photocatalysts have been presented in recent studies, and their effectiveness has also been evaluated. In this case, graphene acts as a center for receiving and transferring electrons, enabling the catalyst to participate in photo-excited reactions with reduced absorbed energies [25,26]. However, released studies show some difficulties with the graphene synthesis process, specifically with the re-adhesion of carbon monolayers in graphene.
Few studies have focused on the process of combining halloysite and graphene to produce nanocomposites because of the advantages of these two materials as independent entities as well as their limitations. This composite material has only been tested and orientated for use in direct adsorption or as a supercapacitor [27], building a membrane for the separation of water and oil [28], combining materials with epoxy resin to increase mechanical qualities and heat resistance [29], or utilizing materials in conjunction with metallic silver as a biocide [30]. This material has not been targeted as a catalyst since there is little information available about it, thus it is frequently used in its natural state, especially for photocatalysis. As far as we are concerned, there are no publications on the use of the nanocomposite in organic pollutant degradation.
This study describes the process of extracting halloysite from its natural ore form. Reduced graphene will next be mixed with the nanoscale halloysite tube to generate the composite material. This material will be employed as a support for copper ferrite active-phase distribution. Photocatalytic activity, kinetics, pH effect as well as the presence of reactive radicals during the reaction were also investigated and examined.
2. Experimental
2.1. Chemicals
To produce the rGO/HNT composite, graphite and raw halloysite ore were used as the starting materials. After being dried for a day at 80 °C to eliminate the water content, they were crushed and sifted The reagents used for the oxidation of graphite and the functionalization of rGO were KMnO4 (98%), H2O2 (30%), HCl, H2SO4 (98%), Na2NO3, hydrazine, isopropyl alcohol (99.7%), EDTA (99%), p-benzoquinone (99%), and DMSO (99%), all purchased from Xilong Scientific Co., Ltd., Guanzhou, China. The metal salts used for the preparation of CuFe2O4 nanoparticles were Cu(NO3)2 (>99.9%) and Fe(NO3)3 (>99.95%), obtained from Sigma Aldrich, Darmstadt, Germany. The model pollutant used for the photocatalytic degradation experiments was ciprofloxacin (99.99%), supplied by Merck, Darmstadt, Germany. All the chemicals used were of analytical grade and were used as they were, without any additional purification.
2.2. Graphene Oxide (GO) Elaboration
Graphite powder was converted into graphene oxide by the authors using the Hummers method [19]. Graphite was mixed with 98% H2SO4 at less than 5 °C for 30 min until the color changed to black. KMnO4 was introduced to the mixture and it was maintained at a temperature of 20 °C for a duration of 4 h. The mixture was gradually combined with distilled water and heated to a temperature below 50 °C for a period of three hours. H2O2 was introduced to the mixture and it was agitated for a duration of 20 min, resulting in a light brown color. Then, it was filtered and rinsed with a 0.1 M HCl solution until it reached a pH of 7, then it was dried at a temperature of 70 °C. GO was obtained after ultrasonic treatment for 30 min, following the method of Ngo et al. (2023) from a previous publication [31].
2.3. Extraction of Halloysite Nanotubes
Raw halloysite, obtained from a kaolin deposit in Vietnam, was ground and sifted to eliminate impurities. The unprocessed halloysite was dried at a temperature of 100 °C for a duration of three hours, after which 20 g of it was combined with 27.5 mL of purified water. A 98% H2SO4 solution of 1 mL was slowly added, and the mixture was agitated for two hours at 90 °C. The resulting mixture was strained and repeatedly washed with distilled water to eliminate any excess H2SO4. The dried sample was added to 750 mL of distilled water, which was then agitated for 24 h before being left to settle for 96 h. The solution was filtered, and the top was separated from the bottom residue. The obtained solid was repeatedly rinsed with water, then filtered, centrifuged, and dried to yield halloysite. The purification process was carried out according to the procedure outlined by Ngo et al. (2023) [31].
2.4. Elaboration of rGO/HNT
To make rGO/HNT composite nanomaterials, the following procedure was followed: a mixture was created by combining 100 mg of HNT with 50 mL of purified water, and it was then ultrasonically stirred for 10 min (solution 1). In addition, 200 mg of GO was dispersed in 200 mL of water, and the dispersion was then ultrasonically treated for 10 min (solution 2). The two solutions were combined, agitated for a duration of 10 min, and ultrasonically processed for 30 min at 90 °C. The next phase included adding 80% hydrazine of 2 mL gradually while stirring constantly for two hours. The residual material was filtered and dried to produce rGO/HNT material. The method of Ngo et al. (2023) was followed for the fabrication of rGO/HNT [31].
2.5. Elaboration of the CuFe2O4/Nanocomposite
The synthesis of the CuFe2O4/rGO/HNT composite was carried out as follows: first, 0.5 g of the rGO/HNT composite was mixed into 50 mL of purified water and subjected to ultrasonic processing for 15 min. After that, a solution of Fe(NO3)3 and Cu(NO3)2 at a molar ratio of 2:1 was prepared by dissolving the salts in 20 mL of 30% H2O2. This solution was gradually added to the rGO/HNT mixture while it was being subjected to ultrasonic processing for an additional 15 min. The pH level of the mixture was raised to 10 by including 25% NH4OH solution. The solid material that formed in the mixture was separated by spinning it at a high speed (5000 revolutions per minute) using a centrifuge. The solid material was then repeatedly rinsed with ethanol and water. The CuFe2O4/rGO/HNT composite was obtained by drying the solid material at 80 °C overnight and then calcining it in a N2 atmosphere at 650 °C for 1 h. The effect of the active-phase content on the catalytic activity of the composite was investigated by varying CuFe2O4 loading from 30% to 70% by weight.
2.6. Material Characterizations
A JSM-6701F (JEOL) scanning electron microscope (SEM) was used to examine the morphological characteristics of the prepared material. Prior to conducting SEM analysis, a small quantity of the material suspension was deposited onto a silicon wafer and left to dry. High-resolution transmission electron microscopy (HRTEM) images were captured by JEM2100 device (JEOL, Tokyo, Japan). The crystal composition of the material was ascertained using a D8-Bruker X-ray diffraction (XRD) instrument with Cu Kα radiation (λ = 1.5403 Å) from 5 to 80° of 2θ. Fourier-transform infrared (FTIR) spectroscopy with a Jasco FT/IR-4600 instrument enabled the investigation of the material’s functional groups and bonding features. An ESEM-XL30 apparatus was used to verify the elemental composition of the material by energy dispersive X-ray (EDX) spectroscopy. UV–vis spectroscopy with a Jasco V-750 instrument in the wavelength between 200 and 800 nm enabled the measurement of the material’s optical properties and bandgap energy. N2 adsorption-desorption isotherm technique (BET) at 77.34 K with a CHEMBET-3030 instrument allowed the determination of the material’s specific surface area and pore size distribution. Finally, The drift method was used to measure the point of zero charge (pzc) of the nanocomposite [32].
2.7. Catalytic Activity Evaluation
The following conditions were used for the photocatalytic degradation of CIP: 50 mL of 20 ppm CIP in aqueous solution with 10 mg of the nanocomposite and 0.25 mL of 30% H2O2 as an oxidant. The mixture was agitated at 400 rpm for 30 min in the dark to achieve the adsorption equilibrium and to prevent the photolysis effect. After that, the photocatalytic reaction was initiated by switching the UV light source on (4 UV lamps, 60 W each). The samples were taken 30 min after the dark adsorption and every 1 h under the illumination. The samples were filtered with filter paper to eliminate residual catalyst and UV–vis spectroscopy was used to determine the CIP concentration.
2.8. Experimental Results Calculation
The photocatalytic degradation efficiency of CIP using the CuFe2O4/rGO/HNT catalyst was evaluated by measuring the conversion of CIP under different experimental conditions, such as the addition of scavengers and the variation of pH value. The following equation enabled the calculation of the conversion of CIP:
where Co is the initial concentration of CIP in the solution and Ct is the final concentration. The concentrations were determined by UV–vis spectroscopy using the calibration curve, which was built based on the intensity of the absorbance peak at 273 nm.
3. Results and Discussion
3.1. Material Characterizations
Various physicochemical techniques were used to characterize the structural features of the prepared catalysts.
Figure 1 shows the X-ray diffraction patterns of the catalysts between 2θ of 10 and 80°. The characteristic peaks at 18.5°, 30.1°, 35.6°, 38.4°, 42.9°, 53.2°, 56.8°, and 62.2° correspond to the spinel phase of CuFe2O4 (JCPDS No. 34-0425) [33,34]. The presence of rGO in the catalysts is indicated by the peak at 26°, which is also attributed to HNT. The peak at 49° reveals the impurity of copper oxide (JCPDS 80–1268). The existence of each catalytic phase was further confirmed by Raman, FT-IR, and EDX analyses.
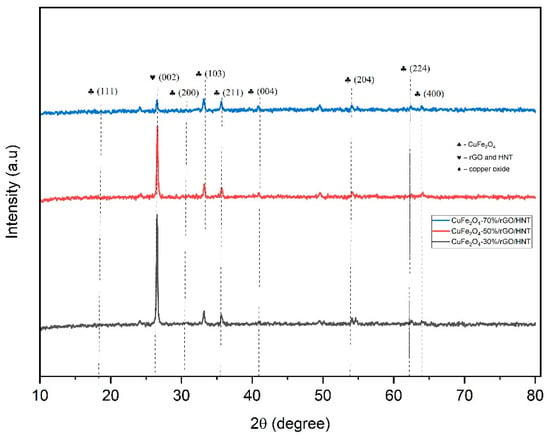
Figure 1.
XRD patterns of CuFe2O4/rGO/HNT series at diffracted planes.
Figure 2 shows the results of material characterization by Raman spectroscopy. At wavelengths of 1345.9 cm−1 and 1593.7 cm−1, respectively, the measurement data demonstrate the typical peaks of HNT and rGO [35]. The signals measured at 278 and 613 cm−1 indicate the presence of CuFe2O4 [36].
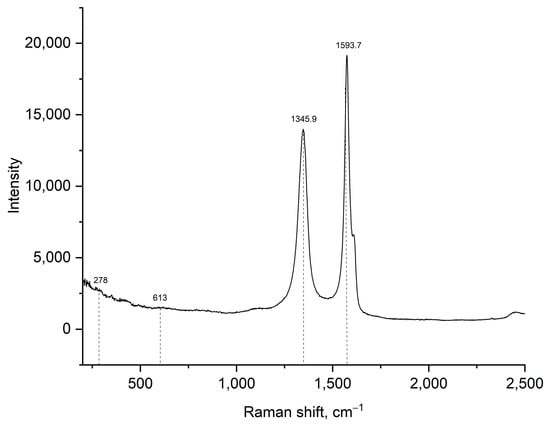
Figure 2.
Raman spectra of CuFe2O4-70%/rGO/HNT.
FT-IR spectroscopy was used to acquire more accurate information on the distinctive bonds in the materials. The material characterization results using FT-IR are shown in Figure 3. The distinctive vibrations with wave numbers at 1083 cm−1 (corresponds to Si-O), 912 cm−1 (corresponds to Al-OH), and 752 cm−1 (corresponds to Si-O-Si) demonstrate the presence of HNTs in rGO/HNT. No vibration of the carboxyl group (1714 cm−1) was observed, showing that elaboration of rGO/HNT involved the reduction of GO to rGO. The C=C and C=O groups of rGO have stretching vibrations that cause peaks at 1633 cm−1 and 1086 cm−1 [37,38]. A weak vibration at the wavenumber of 2360 cm−1 is characteristic of the C=O bond, indicating that a small portion of graphene oxide has not been completely reduced. In addition, vibrations at wavenumbers of 1383 cm−1 and 3445 cm−1 indicate the presence of OH groups in the halloysite nanotube composition, in rGO and adsorbed water in the synthesized catalyst. The existence of CuFe2O4 bonding with rGO/HNT is shown by the 530 cm−1 characteristic vibrations [39,40].
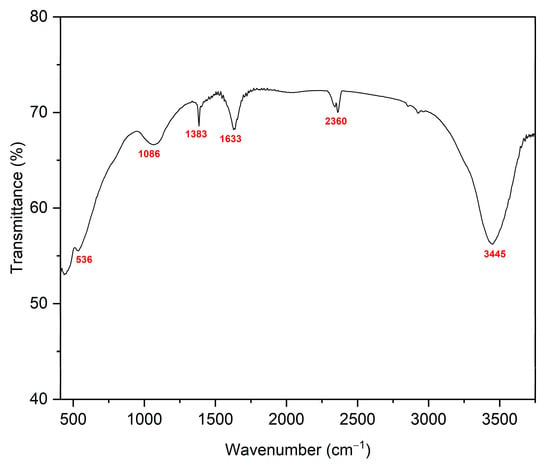
Figure 3.
FT-IR spectra of CuFe2O4-70%/rGO/HNT.
The surface morphology of the materials was investigated by scanning electron microscopy (SEM) and high-resolution transmission electron microscopy (HRTEM). Additionally, the photocatalyst’s specific surface area, pore volume, and pore diameter were measured by N2 adsorption isotherm technique at 77.3 K using BET method. Figure 4A,B presents the SEM results while Figure 4C,D indicate the results obtained by HRTEM. The findings revealed by BET are illustrated in Figure 5a,b.
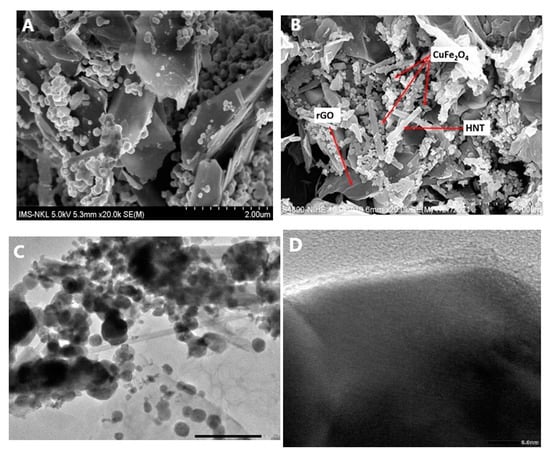
Figure 4.
SEM (A,B) and HRTEM images (C,D) of CuFe2O4-70%/rGO/HNT.
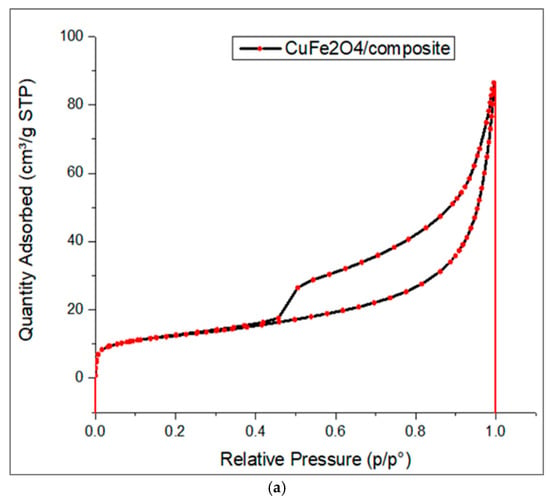
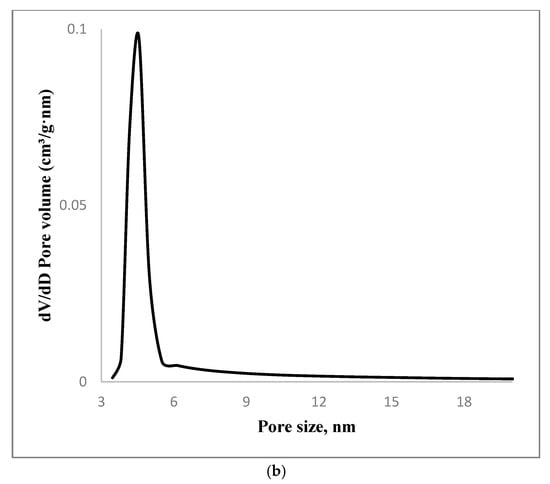
Figure 5.
(a) N2 adsorption–desorption isotherm of CuFe2O4-70%/rGO/HNT. (b) Pore size distribution of CuFe2O4-70%/rGO/HNT.
Accordingly, rGO sheets are prevented from adhering to each other by the insertion of nanoscale halloysite tubes between them. Additionally, SEM images reveal the CuFe2O4 particles deposited on rGO sheets and halloysite tubes. The catalyst particle size is approximately 100 nm according to SEM scans. HRTEM images reveal that halloysite nanotube tubes are inserted between layers of rGO, with the active phase being distributed on both the tube walls and the surface of rGO. Furthermore, the crystal structure of the catalyst material that has been synthesized is also shown in HRTEM images.
With the use of the BET data, it was determined that the catalyst material’s specific surface area is approximately 130 m2/g with the average pore diameter is approximately 5 nm. Additionally, the N2 adsorption-desorption hysteresis of the material has a type IV shape according to IUPAC, which confirms the mesoporous material. The synthesized catalyst has a mesoporous system and a large specific surface area, which are ideal for the removal of organic pollutants using the adsorption–catalysis process.
Then, the presence and proportion of elements in the photocatalyst are verified by using the EDX technique. The findings are introduced in Figure 6.
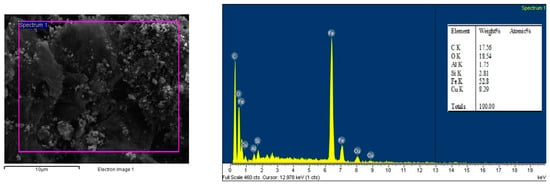
Figure 6.
EDX results of CuFe2O4-70%/rGO/HNT.
All the elements that make up the composite are present, according to the results. Active-phase of CuFe2O4 has a percentage composition of 64%, which is comparable to the initial calculation made while synthesizing (the sample contains 70% active phase by mass).
The bandgap energy of the catalyst material was identified by UV–vis diffuse reflectance spectroscopy. The relation between [F(R)hv]2 and hν can be used to determine the band gap energies of the materials.
The Wood–Tauc equation is used to determine the band gap energy of the materials:
(α·hν)1/n = A(hν − Eg)
In this equation: α is the optical absorbance; hν is the photon energy; A and n are constant (n = 2); Eg is the band gap energy; n is a constant and n = 2. Figure 7 reveals the results.
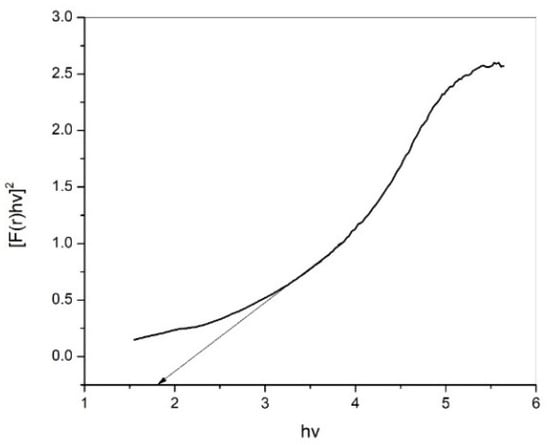
Figure 7.
Energy bandgap of the CuFe2O4-70%/rGO/HNT catalyst.
The Eg value of the CuFe2O4/rGO/HNT composite is 1.9 eV, as can be observed. A smaller bandgap demonstrates that the material could have better photocatalytic activity and makes it able to operate in the visible light spectrum.
3.2. Impact of Active-Phase Loading
The material’s photocatalytic activity was assessed in the CIP photodecomposition process. A comparison of the catalyst sample activities with various active-phase contents is summarized in Figure 8.
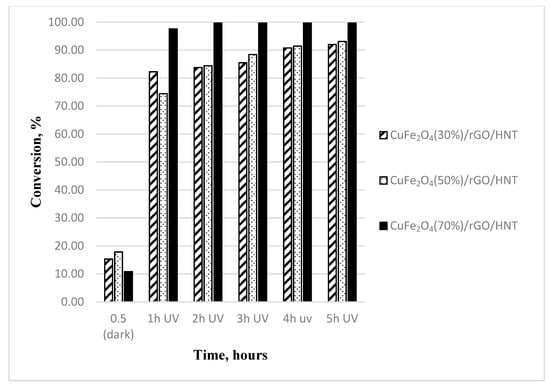
Figure 8.
CIP conversion with CuFe2O4/rGO/HNT series.
The CIP conversion with the involvement of CuFe2O4-70%/rGO/HNT after 2 h of UV is 99%, which is higher than the value reported by Tamaddon et al. [18], who used the similar active phase with an initial CIP concentration of only 3 ppm. The results also showed better efficiency compared to values in previous publications [41,42]. This value is greater than that of samples with 30% and 50% wt. of active phase, which are at 85% and 86% correspondingly. In addition, an efficiency over 90% can be observed in all cases after 5 h of UV irradiation. This demonstrates that CuFe2O4-70%/rGO/HNT catalytic activity is superior to that of the catalysts with 30% wt. and 50% wt. of active phase. Due to the higher content of copper and iron, catalysts could react with H2O2 and water to produce more •OH radicals. The stability of the ferrite system is maintained during the decomposition process and •OH agents and then radicals are continually created with continuous conversion from Fe3+ to Fe2+ and Cu2+ to Cu+. This •OH radical could interact with CIP to create CO2 and water, following the reactions:
Cu2+ + H2O + hv (h+, e−) → •OH + Cu+ + H+
H2O2 + Cu+ + hv (h+, e−) → HO− + •OH + Cu2+
Fe3+ + H2O + hv (h+, e−) → •OH + Fe2+ + H+
H2O2 + Fe2+ + hv (h+, e−) → HO− + •OH + Fe3+
•OH + H+ + CIP → CO2 + H2O + other simple products
To ensure accuracy and clearly evaluate the influence of scavengers, the material with 30% wt. of active phase was selected to perform the related experiments.
3.3. Photodegradation Kinetics of CIP
Experiments for investigating the kinetics of the reaction were conducted under the conditions: 50 mL of 20 ppm CIP solution, 0.25 mL of H2O2 and catalyst loading of 2.5 mg, 5 mg and 7.5 mg, respectively. The system was irradiated under UV light, and the lamps emitted light continuously within the range of 340–410 nm. The conversion of CIP is presented in Figure 9.
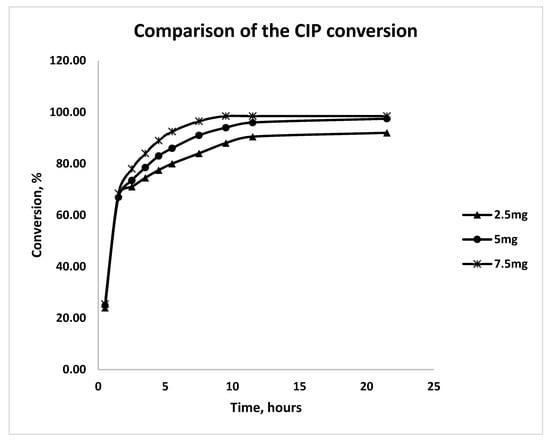
Figure 9.
CIP conversion with different loading of CuFe2O4-70%/rGO/HNT.
The effect of increasing the catalyst mass on the conversion rate of the reaction is shown in Figure 9. As the catalyst mass grows, more adsorption surface is available; and as the number of ions (Fe2+, Cu2+) rises, more free radicals (•OH, h+, •O2−, e−) are produced. As a result, CIP photochemically degrades more quickly.
The following graphs in Figure 10a,b are plotted using experimental data from the equations of the pseudo-first- and second-order kinetic models. The photodegradation of CIP utilizing the catalyst CuFe2O4/rGO/HNT followed the pseudo-first-order rate law, which has a remarkably high R2 coefficient, as shown in Figure 10a. The kinetic data of the reaction are illustrated more clearly in Table 1.
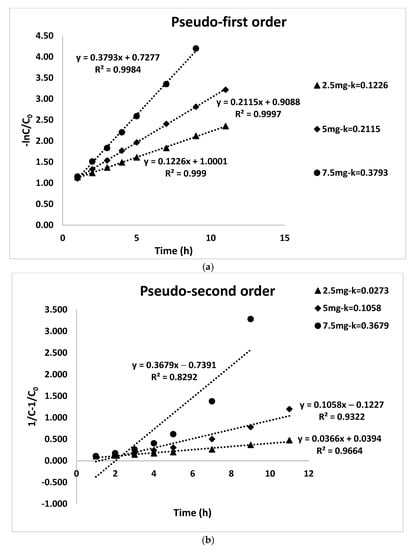
Figure 10.
(a) Pseudo-first-order kinetic model. (b) Pseudo-second-order kinetic model.

Table 1.
CIP degradation kinetic model with the involvement of CuFe2O4/rGO/HNT.
Table 1 reveals that as the catalyst volume rises, the reaction rate constant increases as well, resulting in a greater conversion. However, in some cases, using too much catalyst might result in a reduction in the effectiveness of the reaction. This behavior can be attributed to less effective light penetration into the reaction mixture that contains more catalyst. In other words, the amount of light scattering induced by catalyst particles increases with the amount of catalyst loading. This is in accordance with previous studies in the literature [43,44,45].
3.4. Impact of Solution pH
3.4.1. CuFe2O4/rGO/HNT Point of Zero Charge (pHpzc) Determination
The pHpzc value of CuFe2O4/rGO/HNT can be obtained using the drift method. The results are shown in Table 2 and Figure 11.

Table 2.
Drift method experimental results.
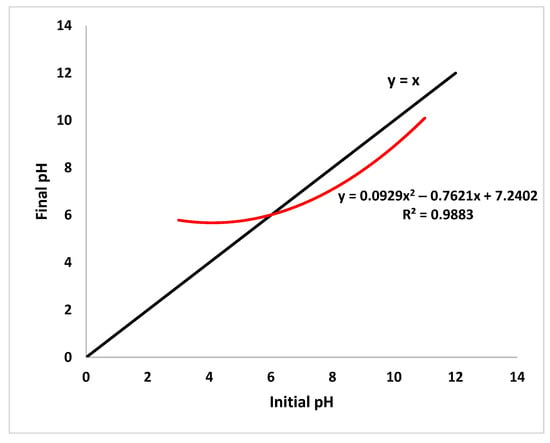
Figure 11.
CuFe2O4/rGO/HNT point of zero charge (pHPZC).
The pHpzc value of CuFe2O4/rGO/HNT is approximately 6 (the intersection of the graphs y = x and y = 0.0929x2 − 0.7621x + 7.2402). The adsorbent’s surface has a neutral charge at pH = pHpzc. Depending on whether the pH is below or above the pHpzc value, the surface of the adsorbent has a positive or negative charge. This improves its ability to adsorb anions or cations, respectively.
3.4.2. Influence of pH
Depending on the pH of the solution, CIP can exist in three forms because it is an ampholytic molecule with a carboxylic group and a nitrogen on the piperazinyl ring that has pKa values of 5.9 and 8.89, respectively. The three forms are: the cationic form at pH values under 5.9, the zwitterionic form at pH values between 6.9 and 8.89, and the anionic form at pH values over 8.89 [7].
Thus, the removal of CIP by CuFe2O4/rGO/HNT was tested at three pH values of 4, 7, and 10 to determine how pH influences the efficiency. The experiments used a fixed condition of 50 mL of CIP 20 ppm solution, 2.5 mL of H2O2 and 7.5 mg CuFe2O4/rGO/HNT. The results are introduced in Figure 12.
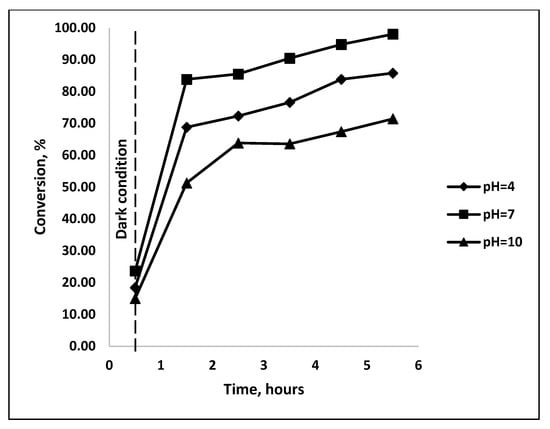
Figure 12.
Impact of pH on CIP conversion rate.
According to the data, removal of CIP increases as pH is adjusted from acidic to neutral, and it starts to fall at pH 10. The conversion of CIP at pH = 4, 7, and 10 after 5 h of UV irradiation was 86%, 98.00%, and 71%, respectively. Some inferences might be drawn from the findings found above:
The catalyst has a point of zero charge (pHpzc) of 6.02. When the pH is lower than pHpzc, the adsorbent’s surface area will have a positive charge and attract anions, and the opposite will happen when the pH is higher than pHpzc.
At pH = 4, the degradation rate decreases and electrostatic repulsion occurs because the photocatalyst surface and the CIP molecule are both positively charged. In addition, least conversion was observed at pH = 10; the hydroxyl anions were more attracted to it, which lowers the creation of hydroxyl radicals. The system has less free hydroxyl ions, which limits the formation of hydroxyl radicals [46].
At pH = 7, the zwitterionic form or isoelectric point of ciprofloxacin is at pH 7.4. Photocatalytic degradation of ciprofloxacin was most effective at a pH close to this value. Because the CIP zwitterionic form and the material surface had a strong electrostatic interaction due to its slightly negative charge, the conversion was the highest at pH = 7 [16].
At pH = 10, electrostatic repulsion occurs and CIP degradation decreases because the photocatalyst and CIP molecule are both negatively charged. Additionally, the photocatalyst blocks UV light and lowers removal efficiency because of the considerable amount of hydroxide ions per unit volume. In a solution with a high pH, CO2 transforms into HCO3− and CO32−. These substances can eliminate hydroxyl radicals. The rate of oxidation decreases when bicarbonates convert into carbonate ions and reduce OH radical [47].
In conclusion, pH = 7 conditions are optimal for the photochemical breakdown of CIP utilizing CuFe2O4/rGO/HNT (specifically, pH between 6 and 9). According to certain studies, hospital wastewater has a pH value of 6 to 9 [48], making the use of CuFe2O4/rGO/HNT to remove antibiotic residues at normal temperature and pressure totally appropriate and superior.
3.5. The Scavengers Test
To pinpoint the active species causing the photodegradation of ciprofloxacin, experiments with scavengers were conducted. Different scavengers are employed to identify the respective active species (•O2− radical), holes (h+), hydroxyl radicals (•OH), and electrons (e−), including p-benzoquinone (p-BQ), disodium ethylenediaminetetraacetate (2Na-EDTA), isopropyl alcohol (IPA), and dimethyl sulfoxide (DMSO), respectively. In these experiments, CuFe2O4-30%/rGO/HNT was used, and the samples were taken after 5 h of irradiation. The CuFe2O4-30%/rGO/HNT catalyst was chosen for this experiment to enable tracking of CIP conversion changes over time. Catalysts with a higher amount of active phase can rapidly achieve full conversion, making it imprecise to assess the influence of scavengers on active intermediate radicals. The other conditions were kept intact as those applied in photocatalytic activity tests.
The involvement of different reactive radicals in the photodecompostion of CIP antibiotic is depicted in Figure 13.
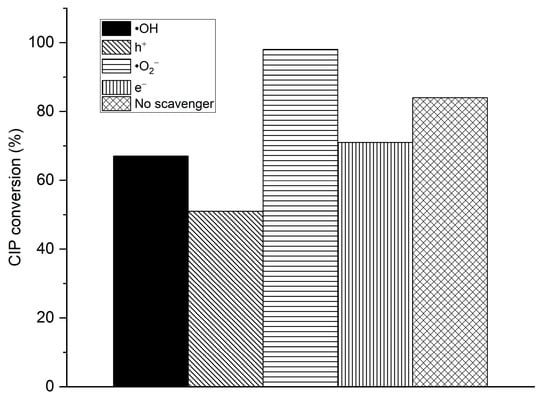
Figure 13.
CIP conversion with the involvement of different scavengers.
As can be observed, the reaction system’s CIP degradation efficiency drastically decreased once traps were included. In particular, the efficiency of the process with the addition of 2Na-EDTA (h+ trap), IPA (•OH trap), and DMSO (e− trap) reduced from 84% to 51%, 67%, and 71%, respectively. This demonstrates how active species such as holes (denoted as h+), hydroxyl radicals (denoted as •OH), and electrons (denoted as e−) are crucial to the CIP degradation process. The reaction efficiency rises from 84% to 98% using the p-BQ trap (also known as the “•O2−”), and this phenomenon is caused by the trap’s mechanism. The response is as follows [49]:
p-BQ not only interacts with •O2−, but also with H+, causing a reduction in the quantity of H+, as can be observed from the reactions.
Along with that, the catalyst’s photodegradation process results in:
Cu2+ + H2O + hv → •OH + Cu+ + H+ (1),
H2O2 + Cu+ + hv → HO− + •OH + Cu2+ (2),
Fe3+ + H2O + hv → •OH + Fe2+ + H+ (3), and
H2O2 + Fe2+ + hv → HO− + •OH + Fe3+ (4).
Reactions (1) and (3) will change in a way that produces more H+ ions while also producing a lot of •OH as the amount of h+ drops. The sample with the 1,4-BQ trap has a greater conversion than the sample without the trap because of the abundant •OH generated during the reaction process. •O2− hence plays a small role in the conversion of CIP. This implies that the active radicals participated in the decomposition of CIP as follows: h+ > •OH > e− > •O2−.
3.6. The CIP Photodegradation Mechanism with CuFe2O4/rGO/HNT
3.6.1. Calculation of the Conduction Band and Valence Band Energy (ECB, EVB)
The following empirical equations are used to determine the components’ conduction band (CB) and valence band (VB) energy [50].
where
EVB: valence band energy.
ECB: conduction band energy.
Ee represents the free electrons’ energy in comparison to hydrogen, which is 4.5 eV.
Eg denotes the semiconductor’s bandgap.
χ is the semiconductor electronegativity. Equation (3) is often used to identify this value:
Additionally, each component’s electronegativity value used in Equation (3) is shown in Table 3 below.

Table 3.
Value of electronegativity of each component.
From the UV–vis DRS results presented previously, the bandgap energy Eg value of CuFe2O4 is 1.95 eV. Additionally, from the data in Table 3, the value of χ is 5.853. The values of ECB = 0.378 eV and EVB = 2.328 eV are calculated by exchanging the values of χ and Eg in Equations (1) and (2). Oxidizing species including •OH, h+, and •O2− have significant contributions to the destruction of organic contaminants. However, from the scavengers test results, it can be seen that •O2− plays a very minor role in the CIP degradation process.
Theoretically, the electrons in the CuFe2O4 conduction band might readily produce •O2− from O2, since the material’s conduction band energy (ECB = 0.378 eV) is less positive than the energy required for the formation of •O2− radicals (O2/•O2− = 0.64 eV) [51]. However, •O2− only plays a very minor role in the oxidation of CIP. This implies that the reaction between the generated •O2− and the proton creates H2O2 and leads to the subsequent formation of •OH.
In comparison to the hole’s potential on the CuFe2O4 valence band (EVB = 2.328 eV), the OH/•OH oxidation–reduction reaction is less positive (1.99 eV). Therefore, direct production of •OH is conceivable. In addition, •O2− can be used to form •OH. On the contrary, the surface holes of CuFe2O4 also participate in photocatalytic activity. The degradation of CIP over the CuFe2O4/rGO/HNT catalyst is most likely a localized surface reaction because h+ can interact with organic pollutants when they are deposited on the catalytic surface.
3.6.2. The CIP Photochemical Degradation Mechanism with CuFe2O4/rGO/HNT
From the presented investigations, the CIP photochemical degradation mechanism using CuFe2O4/rGO/HNT could be suggested as follows:
Step 1: When the catalyst surface absorbs the energy from UV light, the electrons are stimulated and generate e−cb, h+υb.
CuFe2O4 + hυ → CuFe2O4 + (e−cb +h+υb)
Step 2: •OH radicals are formed. Holes would be left in the valence band of the semiconductor. These holes can oxidize donor molecules and react with water to produce hydroxyl radicals that have a high oxidizing ability and are essential for contaminant destruction.
Cu2+ + H2O + hν (h+, e−) → •OH + Cu+ + H+,
H2O2 + Cu+ + hν (h+, e−) → HO− + •OH + Cu2+,
Fe3+ + H2O + hν (h+, e−) → •OH + Fe2+ + H+, and
H2O2 + Fe2+ + hν (h+, e−) → HO− + •OH + Fe3+.
Step 3: Transformation of oxygen adsorbed to the surface into superoxide radical. Superoxide ions are formed when electrons in the conduction band combine with dissolved oxygen species.
e−cb + O2 → •O2−
Step 4: From scavenger tests and considering the ECB, EVB, ˙O2− formed could react with proton produces H2O2 and subsequently ˙OH is formed according to the following reactions:
•O2− + H+ → •HO2, and
2•HO2 → H2O2 + O2.
Along with the participation in a direct reaction with ions on the catalyst surface, hydrogen peroxide can function as an electron sink, resulting in the enhancement the charge separation. Moreover, it can generate more hydroxyl radicals through the following reactions:
H2O2 + e− → OH− + •OH
H2O2 + O2 → OH− + •OH + O2
Step 5: The following scheme illustrates the degradation of CIP by radicals.
•OH, h+, e− + ciprofloxacin → CO2 + H2O + simpler molecules
3.6.3. Total Organic Carbon Measurement
Total organic carbon (TOC) is an important parameter for assessing the quality of drinking water, wastewater, and natural water sources. High levels of TOC can indicate contamination, disinfection by-product formation, biological growth, and fouling potential. In our study, TOC was measured to determine the presence of intermediate organic compounds that were generated but not fully mineralized. Through this, we will be able to evaluate the final effectiveness of the fabricated photocatalytic material. The results are shown in Figure 14.
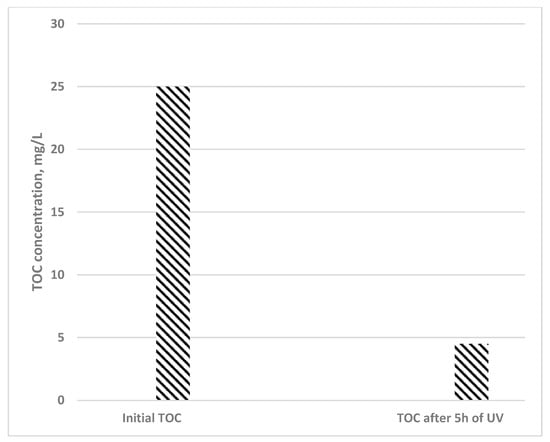
Figure 14.
TOC values before the reaction and after 5 h of illumination with the involvement of CuFe2O4-70%/rGO/HNT.
Analysis of Figure 14 reveals a reduction in TOC levels from 25 mg/L to approximately 4.5 mg/L following a 5 h reaction period with the CuFe2O4-70%/rGO/HNT catalyst, corresponding to a mineralization rate exceeding 80%. The data indicate that the catalyst exhibits a high conversion rate for the target antibiotic CIP. Despite the test’s antibiotic concentration being significantly higher than real-world measurements [52,53], the catalyst demonstrated remarkable efficacy. It can be inferred that at lower CIP concentrations, the catalyst possesses the ability to fully mineralize this waterborne pollutant.
3.7. Reusability of the Photocatalyst
Among the important factors for evaluating the performance of a photocatalyst is its reusability, which reflects its stability and durability under repeated cycles of illumination conditions. A photocatalyst that can maintain its activity and structure after multiple uses is desirable for practical applications. Figure 15 reveals the results after five cycles of catalyst regeneration.
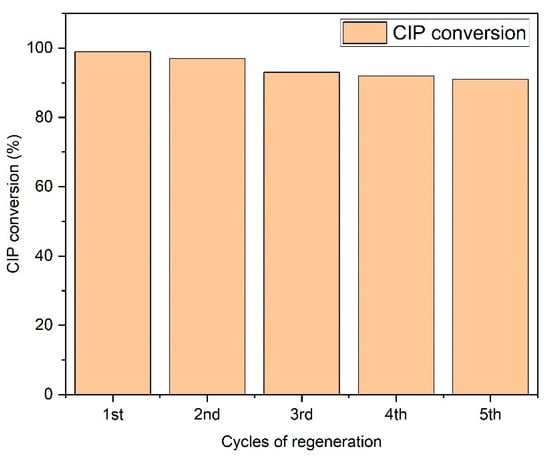
Figure 15.
CIP conversion after five cycles of regeneration (catalyst: CuFe2O4-70%/rGO/HNT; reaction time: 5 h).
Following five cycles of reaction and regeneration of the catalyst, a minor reduction in CIP conversion was noted. The initial use of the catalyst yielded a CIP conversion rate of 99%, while after five cycles of regeneration, the rate decreased to approximately 91%. The CuFe2O4 material demonstrated stable catalytic activity and chemical durability, with minimal loss or contamination of the active center. XRD spectra (Figure 16) and SEM images (Figure 17) taken after four regeneration cycles further confirmed this stability, with no significant changes observed in the crystal structure or surface morphology of the material.
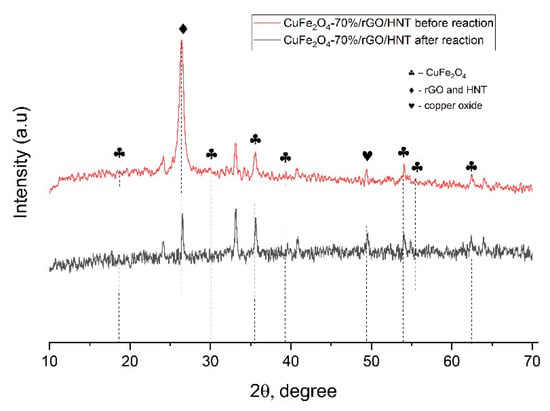
Figure 16.
XRD spectra of CuFe2O4-70%/rGO/HNT before and after five cycles of regeneration.
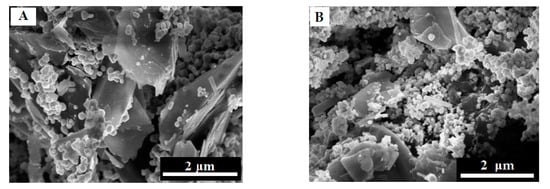
Figure 17.
SEM images of CuFe2O4-70%/rGO/HNT before (A) and after (B) five cycles of regeneration.
4. Conclusions
Important properties of CuFe2O4/rGO/HNT catalytic materials were explored in this work. The XRD, Raman, FTIR, BET, HRTEM and SEM results show that the synthesized CuFe2O4/rGO/HNT catalyst has exceptional qualities such as a large specific surface area (130 m2/g) and mesopore size which of approximately 5 nm. In addition, its interstitial structure may generate greater space efficiency than the original rGO. These characterizations with low bandgap energy, which is approximately 1.9 eV, make the material extremely efficient in photocatalytic applications. Indeed, when the catalyst was used, the antibiotic CIP at a concentration of 20 ppm was entirely transformed after 1 h of photocatalytic activity. Additionally, investigation on the reaction kinetics revealed photodegradation of CIP by CuFe2O4/rGO/HNT followed pseudo-first-order rate law.
Further, the experimental results with scavengers indicate that the radicals involved in CIP photodegradation with the CuFe2O4/rGO/HNT catalyst have the following order of importance: h+ > ●OH > e− > ●O2−. The point of zero charge (pHpzc) of CuFe2O4/rGO/HNT was determined experimentally to be 6.02. The findings of pH effects at three values of 4, 7, and 10 lead to the conclusion that the most efficient photodegradation of CIP with CuFe2O4/rGO/HNT is reached at pH values ranging from 6 to 9, under ambient temperature and atmospheric pressure. The catalyst material has shown a high ability to mineralize CIP, with a mineralization rate exceeding 80% after a 5 h reaction. The material can be regenerated and reused, maintaining its activity and structural stability even after five regeneration cycles. Notably, when the catalyst material is regenerated five times, the conversion rate of CIP remains above 90%. This shows the wide-ranging potential of the material for the advanced removal of antibiotic residues from wastewater.
Author Contributions
N.-T.T., data curation and investigation. H.-C.L., data curation and formal analysis. T.-L.N.: supervision, resources, methodology and writing—original draft. H.-S.N.: formal analysis, supervision, writing—review and editing and validation. All authors have read and agreed to the published version of the manuscript.
Funding
This research received funding from the Vietnam Ministry of Education and Training [grant number B2021-MDA-02].
Data Availability Statement
Figures, tables, and references in this article contain the data that are presented in this study.
Acknowledgments
Our gratitude goes to Hanoi University of Mining and Geology for providing us with the laboratory facilities used in this work and to the Vietnam Ministry of Education and Training for supporting this study with the grant (B2021-MDA-02).
Conflicts of Interest
The authors state that none of their known personal or financial conflicts could have been expected to have affected the research reported in this publication.
References
- Bilal, M.; Mehmood, S.; Rasheed, T.; Iqbal, H.M.N. Antibiotics Traces in the Aquatic Environment: Persistence and Adverse Environmental Impact. Curr. Opin. Environ. Sci. Health 2020, 13, 68–74. [Google Scholar] [CrossRef]
- Okeke, E.S.; Chukwudozie, K.I.; Nyaruaba, R.; Ita, R.E.; Oladipo, A.; Ejeromedoghene, O.; Atakpa, E.O.; Agu, C.V.; Okoye, C.O. Antibiotic Resistance in Aquaculture and Aquatic Organisms: A Review of Current Nanotechnology Applications for Sustainable Management. Environ. Sci. Pollut. Res. 2022, 29, 69241–69274. [Google Scholar] [CrossRef]
- Carvalho, I.T.; Santos, L. Antibiotics in the Aquatic Environments: A Review of the European Scenario. Environ. Int. 2016, 94, 736–757. [Google Scholar] [CrossRef] [PubMed]
- Zhang, S.; Huang, J.; Zhao, Z.; Cao, Y.; Li, B. Hospital Wastewater as a Reservoir for Antibiotic Resistance Genes: A Meta-Analysis. Front. Public Health 2020, 8, 574968. [Google Scholar] [CrossRef] [PubMed]
- Rodriguez-Mozaz, S.; Vaz-Moreira, I.; Varela Della Giustina, S.; Llorca, M.; Barceló, D.; Schubert, S.; Berendonk, T.U.; Michael-Kordatou, I.; Fatta-Kassinos, D.; Martinez, J.L.; et al. Antibiotic Residues in Final Effluents of European Wastewater Treatment Plants and Their Impact on the Aquatic Environment. Environ. Int. 2020, 140, 105733. [Google Scholar] [CrossRef]
- Akhil, D.; Lakshmi, D.; Senthil Kumar, P.; Vo, D.-V.N.; Kartik, A. Occurrence and Removal of Antibiotics from Industrial Wastewater. Environ. Chem. Lett. 2021, 19, 1477–1507. [Google Scholar] [CrossRef]
- Igwegbe, C.A.; Oba, S.N.; Aniagor, C.O.; Adeniyi, A.G.; Ighalo, J.O. Adsorption of Ciprofloxacin from Water: A Comprehensive Review. J. Ind. Eng. Chem. 2021, 93, 57–77. [Google Scholar] [CrossRef]
- Yuan, C.; Tebes-Stevens, C.; Weber, E.J. Reaction Library to Predict Direct Photochemical Transformation Products of Environmental Organic Contaminants in Sunlit Aquatic Systems. Environ. Sci. Technol. 2020, 54, 7271–7279. [Google Scholar] [CrossRef]
- Paul, T.; Dodd, M.C.; Strathmann, T.J. Photolytic and Photocatalytic Decomposition of Aqueous Ciprofloxacin: Transformation Products and Residual Antibacterial Activity. Water Res. 2010, 44, 3121–3132. [Google Scholar] [CrossRef]
- Guo, H.-G.; Gao, N.-Y.; Chu, W.-H.; Li, L.; Zhang, Y.-J.; Gu, J.-S.; Gu, Y.-L. Photochemical Degradation of Ciprofloxacin in UV and UV/H2O2 Process: Kinetics, Parameters, and Products. Environ. Sci. Pollut. Res. 2013, 20, 3202–3213. [Google Scholar] [CrossRef]
- Nakata, K.; Fujishima, A. TiO2 Photocatalysis: Design and Applications. J. Photochem. Photobiol. C Photochem. Rev. 2012, 13, 169–189. [Google Scholar] [CrossRef]
- Malato, S.; Fernández-Ibáñez, P.; Maldonado, M.I.; Blanco, J.; Gernjak, W. Decontamination and Disinfection of Water by Solar Photocatalysis: Recent Overview and Trends. Catal. Today 2009, 147, 1–59. [Google Scholar] [CrossRef]
- El-Kemary, M.; El-Shamy, H.; El-Mehasseb, I. Photocatalytic Degradation of Ciprofloxacin Drug in Water Using ZnO Nanoparticles. J. Lumin. 2010, 130, 2327–2331. [Google Scholar] [CrossRef]
- Machín, A.; Fontánez, K.; García, D.; Sampayo, P.; Colón-Cruz, C.; Claudio-Serrano, G.J.; Soto-Vázquez, L.; Resto, E.; Petrescu, F.I.; Morant, C.; et al. Hydrogen Production and Degradation of Ciprofloxacin by Ag@TiO2-MoS2 Photocatalysts. Catalysts 2022, 12, 267. [Google Scholar] [CrossRef]
- Beshkar, F.; Salavati-Niasari, M.; Amiri, O. Facile One-Pot In Situ Synthesis and Characterization of a Cu2O/Cu2(PO4)(OH) Binary Heterojunction Nanocomposite for the Efficient Photocatalytic Degradation of Ciprofloxacin from Aqueous Solution under Direct Sunlight Irradiation. Ind. Eng. Chem. Res. 2021, 60, 9578–9591. [Google Scholar] [CrossRef]
- Nhi, L.T.T.; Thuan, L.V.; Uyen, D.M.; Nguyen, M.H.; Thu, V.T.; Khieu, D.Q.; Sinh, L.H. Facile Fabrication of Highly Flexible and Floatable Cu2O/RGO on Vietnamese Traditional Paper toward High-Performance Solar-Light-Driven Photocatalytic Degradation of Ciprofloxacin Antibiotic. RSC Adv. 2020, 10, 16330–16338. [Google Scholar] [CrossRef]
- Noroozi, R.; Gholami, M.; Farzadkia, M.; Jonidi Jafari, A. Degradation of Ciprofloxacin by CuFe2O4/GO Activated PMS Process in Aqueous Solution: Performance, Mechanism and Degradation Pathway. Int. J. Environ. Anal. Chem. 2022, 102, 174–195. [Google Scholar] [CrossRef]
- Tamaddon, F.; Nasiri, A.; Yazdanpanah, G. Photocatalytic Degradation of Ciprofloxacin Using CuFe2O4@methyl Cellulose Based Magnetic Nanobiocomposite. MethodsX 2019, 7, 74–81. [Google Scholar] [CrossRef]
- A Critical Review on Surface-Modified Nano-Catalyst Application for the Photocatalytic Degradation of Volatile Organic Compounds—Environmental Science: Nano (RSC Publishing). Available online: https://pubs.rsc.org/en/content/articlelanding/2022/en/d1en00955a (accessed on 29 March 2023).
- Gupta, J.; Hassan, P.A.; Barick, K.C. 12—Defects in Nanomaterials for Visible Light Photocatalysis. In Nanostructured Materials for Visible Light Photocatalysis; Nayak, A.K., Sahu, N.K., Eds.; Micro and Nano Technologies; Elsevier: Amsterdam, The Netherlands, 2022; pp. 319–350. ISBN 978-0-12-823018-3. [Google Scholar]
- Zhang, Y.; He, X.; Ouyang, J.; Yang, H. Palladium Nanoparticles Deposited on Silanized Halloysite Nanotubes: Synthesis, Characterization and Enhanced Catalytic Property. Sci. Rep. 2013, 3, 2948. [Google Scholar] [CrossRef]
- Li, X.; Yao, C.; Lu, X.; Hu, Z.; Yin, Y.; Ni, C. Halloysite–CeO2–AgBr Nanocomposite for Solar Light Photodegradation of Methyl Orange. Appl. Clay Sci. 2015, 104, 74–80. [Google Scholar] [CrossRef]
- Li, X.; Zhu, W.; Yan, X.; Lu, X.; Yao, C.; Ni, C. Hierarchical La0.7Ce0.3FeO3/Halloysite Nanocomposite for Photocatalytic Degradation of Antibiotics. Appl. Phys. A 2016, 122, 723. [Google Scholar] [CrossRef]
- Dayana Priyadharshini, S.; Manikandan, S.; Kiruthiga, R.; Rednam, U.; Babu, P.S.; Subbaiya, R.; Karmegam, N.; Kim, W.; Govarthanan, M. Graphene Oxide-Based Nanomaterials for the Treatment of Pollutants in the Aquatic Environment: Recent Trends and Perspectives—A Review. Environ. Pollut. 2022, 306, 119377. [Google Scholar] [CrossRef] [PubMed]
- Liu, S.; Sun, H.; Suvorova, A.; Wang, S. One-Pot Hydrothermal Synthesis of ZnO-Reduced Graphene Oxide Composites Using Zn Powders for Enhanced Photocatalysis. Chem. Eng. J. 2013, 229, 533–539. [Google Scholar] [CrossRef]
- Zhang, J.; Xiong, Z.; Zhao, X.S. Graphene–Metal–Oxide Composites for the Degradation of Dyes under Visible Light Irradiation. J. Mater. Chem. 2011, 21, 3634–3640. [Google Scholar] [CrossRef]
- Liu, Y.; Jiang, X.; Li, B.; Zhang, X.; Liu, T.; Yan, X.; Ding, J.; Cai, Q.; Zhang, J. Halloysite Nanotubes@reduced Graphene Oxide Composite for Removal of Dyes from Water and as Supercapacitors. J. Mater. Chem. A 2014, 2, 4264–4269. [Google Scholar] [CrossRef]
- Zeng, G.; He, Y.; Ye, Z.; Yang, X.; Chen, X.; Ma, J.; Li, F. Novel Halloysite Nanotubes Intercalated Graphene Oxide Based Composite Membranes for Multifunctional Applications: Oil/Water Separation and Dyes Removal. Ind. Eng. Chem. Res. 2017, 56, 10472–10481. [Google Scholar] [CrossRef]
- Xiao, J.; Xie, S.; Jing, Y.; Yao, Y.; Wang, X.; Jia, Y. Preparation of Halloysite@graphene Oxide Composite and Its Application for High-Efficient Decontamination of U(VI) from Aqueous Solution. J. Mol. Liq. 2016, 220, 304–310. [Google Scholar] [CrossRef]
- Yu, L.; Zhang, Y.; Zhang, B.; Liu, J. Enhanced Antibacterial Activity of Silver Nanoparticles/Halloysite Nanotubes/Graphene Nanocomposites with Sandwich-Like Structure. Sci. Rep. 2014, 4, 4551. [Google Scholar] [CrossRef]
- Ngo, H.-S.; Nguyen, T.-L.; Tran, N.-T.; Le, H.-C. Experimental Study on Kinetics and Mechanism of Ciprofloxacin Degradation in Aqueous Phase Using Ag-TiO2/RGO/Halloysite Photocatalyst. Catalysts 2023, 13, 225. [Google Scholar] [CrossRef]
- Dadban Shahamat, Y.; Sadeghi, M.; Shahryari, A.; Okhovat, N.; Bahrami Asl, F.; Baneshi, M.M. Heterogeneous Catalytic Ozonation of 2, 4-Dinitrophenol in Aqueous Solution by Magnetic Carbonaceous Nanocomposite: Catalytic Activity and Mechanism. Desalination Water Treat. 2016, 57, 20447–20456. [Google Scholar] [CrossRef]
- Dhanda, R.; Kidwai, M. Magnetically Separable CuFe2O4/Reduced Graphene Oxide Nanocomposites: As a Highly Active Catalyst for Solvent Free Oxidative Coupling of Amines to Imines. RSC Adv. 2016, 6, 53430–53437. [Google Scholar] [CrossRef]
- Ali, K.; Bahadur, A.; Jabbar, A.; Iqbal, S.; Ahmad, I.; Bashir, M.I. Synthesis, Structural, Dielectric and Magnetic Properties of CuFe2O4/MnO2 Nanocomposites. J. Magn. Magn. Mater. 2017, 434, 30–36. [Google Scholar] [CrossRef]
- Mi, X.; Zhong, L.; Wei, F.; Zeng, L.; Zhang, J.; Zhang, D.; Xu, T. Fabrication of Halloysite Nanotubes/Reduced Graphene Oxide Hybrids for Epoxy Composites with Improved Thermal and Mechanical Properties. Polym. Test. 2019, 76, 473–480. [Google Scholar] [CrossRef]
- Ding, G.; Chen, C.; Tai, H.; Tang, Z.; Wang, Z.; Cheng, G.; Wan, X. Structural Characterization and Microwave Absorbing Performance of CuFe2O4/RGO Composites. J. Solid State Chem. 2021, 297, 122051. [Google Scholar] [CrossRef]
- Gao, C.; Li, B.; Chen, N.; Ding, J.; Cai, Q.; Zhang, J.; Liu, Y. Novel Fe3O4/HNT@rGO Composite via a Facile Co-Precipitation Method for the Removal of Contaminants from Aqueous System. RSC Adv. 2016, 6, 49228–49235. [Google Scholar] [CrossRef]
- Muthu, R.N.; Rajashabala, S.; Kannan, R. Facile Synthesis and Characterization of a Reduced Graphene Oxide/Halloysite Nanotubes/Hexagonal Boron Nitride (RGO/HNT/h-BN) Hybrid Nanocomposite and Its Potential Application in Hydrogen Storage. RSC Adv. 2016, 6, 79072–79084. [Google Scholar] [CrossRef]
- Dey, C.; De, D.; Nandi, M.; Goswami, M.M. A High Performance Recyclable Magnetic CuFe2O4 Nanocatalyst for Facile Reduction of 4-Nitrophenol. Mater. Chem. Phys. 2020, 242, 122237. [Google Scholar] [CrossRef]
- Zhang, X.; Feng, M.; Qu, R.; Liu, H.; Wang, L.; Wang, Z. Catalytic Degradation of Diethyl Phthalate in Aqueous Solution by Persulfate Activated with Nano-Scaled Magnetic CuFe2O4/MWCNTs. Chem. Eng. J. 2016, 301, 1–11. [Google Scholar] [CrossRef]
- Song, S.Y.; Chen, H.D.; Li, C.X.; Shi, D.S.; Ying, Y.; Han, Y.B.; Xu, J.C.; Hong, B.; Jin, H.X.; Jin, D.F.; et al. Magnetic Bi2WO6 Nanocomposites: Synthesis, Magnetic Response and Their Visible-Light-Driven Photocatalytic Performance for Ciprofloxacin. Chem. Phys. 2020, 530, 110614. [Google Scholar] [CrossRef]
- Li, C.; Chen, G.; Sun, J.; Rao, J.; Han, Z.; Hu, Y.; Xing, W.; Zhang, C. Doping Effect of Phosphate in Bi2WO6 and Universal Improved Photocatalytic Activity for Removing Various Pollutants in Water. Appl. Catal. B Environ. 2016, 188, 39–47. [Google Scholar] [CrossRef]
- Kočí, K.; Obalová, L.; Matějová, L.; Plachá, D.; Lacný, Z.; Jirkovský, J.; Šolcová, O. Effect of TiO2 Particle Size on the Photocatalytic Reduction of CO2. Appl. Catal. B Environ. 2009, 89, 494–502. [Google Scholar] [CrossRef]
- Chakrabarti, S.; Dutta, B.K. Photocatalytic Degradation of Model Textile Dyes in Wastewater Using ZnO as Semiconductor Catalyst. J. Hazard. Mater. 2004, 112, 269–278. [Google Scholar] [CrossRef] [PubMed]
- Zhang, D.; Lv, S.; Luo, Z. A Study on the Photocatalytic Degradation Performance of a [KNbO3]0.9-[BaNi0.5Nb0.5O3−δ]0.1 Perovskite. RSC Adv. 2020, 10, 1275–1280. [Google Scholar] [CrossRef] [PubMed]
- Das, S.; Ghosh, S.; Misra, A.J.; Tamhankar, A.J.; Mishra, A.; Lundborg, C.S.; Tripathy, S.K. Sunlight Assisted Photocatalytic Degradation of Ciprofloxacin in Water Using Fe Doped ZnO Nanoparticles for Potential Public Health Applications. Int. J. Environ. Res. Public Health 2018, 15, 2440. [Google Scholar] [CrossRef] [PubMed]
- Nasiri, A.; Tamaddon, F.; Mosslemin, M.H.; Amiri Gharaghani, M.; Asadipour, A. Magnetic Nano-Biocomposite CuFe2O4@methylcellulose (MC) Prepared as a New Nano-Photocatalyst for Degradation of Ciprofloxacin from Aqueous Solution. Environ. Health Eng. Manag. J. 2019, 6, 41–51. [Google Scholar] [CrossRef]
- Anjana Anand, A.S.; Adish Kumar, S.; Rajesh Banu, J.; Ginni, G. The Performance of Fluidized Bed Solar Photo Fenton Oxidation in the Removal of COD from Hospital Wastewaters. Desalination Water Treat. 2016, 57, 8236–8242. [Google Scholar] [CrossRef]
- Zhu, M.; Lu, J.; Hu, Y.; Liu, Y.; Hu, S.; Zhu, C. Photochemical Reactions between 1,4-Benzoquinone and O2•. Environ. Sci. Pollut. Res. Int. 2020, 27, 31289–31299. [Google Scholar] [CrossRef]
- Mejia-Bernal, J.R.; Mumanga, T.J.; Diaz-Torres, L.A.; Vallejo-Hernández, M.Á.; Gómez -Solís, C. Synthesis and Evaluation of MSiO3 (M = Ba, Sr, Mg) for Photocatalytic Hydrogen Generation under UV Irradiation. Mater. Lett. 2021, 295, 129851. [Google Scholar] [CrossRef]
- Koppenol, W.H.; Stanbury, D.M.; Bounds, P.L. Electrode Potentials of Partially Reduced Oxygen Species, from Dioxygen to Water. Free Radic. Biol. Med. 2010, 49, 317–322. [Google Scholar] [CrossRef]
- Monteoliva-García, A.; Martín-Pascual, J.; Muñío, M.M.; Poyatos, J.M. Removal of Carbamazepine, Ciprofloxacin and Ibuprofen in Real Urban Wastewater by Using Light-Driven Advanced Oxidation Processes. Int. J. Environ. Sci. Technol. 2019, 16, 6005–6018. [Google Scholar] [CrossRef]
- Liu, X.; Zhang, G.; Liu, Y.; Lu, S.; Qin, P.; Guo, X.; Bi, B.; Wang, L.; Xi, B.; Wu, F.; et al. Occurrence and Fate of Antibiotics and Antibiotic Resistance Genes in Typical Urban Water of Beijing, China. Environ. Pollut. 2019, 246, 163–173. [Google Scholar] [CrossRef] [PubMed]
Disclaimer/Publisher’s Note: The statements, opinions and data contained in all publications are solely those of the individual author(s) and contributor(s) and not of MDPI and/or the editor(s). MDPI and/or the editor(s) disclaim responsibility for any injury to people or property resulting from any ideas, methods, instructions or products referred to in the content. |
© 2023 by the authors. Licensee MDPI, Basel, Switzerland. This article is an open access article distributed under the terms and conditions of the Creative Commons Attribution (CC BY) license (https://creativecommons.org/licenses/by/4.0/).