1. Introduction
Rising bubbles have been a topic of active research due to their rich physics and various applications in different domains of science and engineering. Bubble behavior has a significant impact on the flow properties and heat and mass transfer effects in gas–liquid two-phase flows encountered in industry and many natural phenomena. The application domain of bubbles is very wide, ranging from heat exchangers and bubble column reactors to targeted drug delivery and laser histotripsy.
The non-linearity and the number of parameters involved make the dynamics of rising bubbles quite complex. The dynamics of a single bubble rising due to buoyancy in an infinite liquid pool has been the focus of many experimental [
1,
2,
3,
4,
5,
6] and numerical studies [
7,
8,
9,
10,
11,
12,
13,
14] in the past. A bubble can show different shapes and rising trajectories depending on the interplay between surface tension, viscosity and inertia forces. The contamination of the bubble surface can alter its dynamics in a significant manner [
4].
In clean water, small bubbles follow a straight vertical path maintaining a spherical shape. There are no vortices behind the bubble making the flow axisymmetric. As the bubble size increases, it rises following a plane zigzag or a three-dimensional helical path. The fascinating phenomenon of path instability of a rising bubble has been the focus of many experimental, numerical [
8] and analytical studies [
15]. The transition from the rectilinear to the oscillatory regime takes place when the streamwise vorticity accumulated on the bubble surface exceeds a critical value [
5,
16], resulting in an asymmetry in the vortical structures in the wake. The wake structures and vortical activity for the different path regimes have been extensively researched and documented [
3,
8,
17]. Moreover, the bubbles also show significant shape deformations resulting in ellipsoidal, oblate ellipsoidal or cap shapes [
4]. The shape deformations and wake instability have been considered responsible for the bubble path instability [
12,
18].
Gumulya et al. [
19] and Senapati et al. [
20] performed numerical simulations to investigate the effect of the bubble wake on a trailing bubble. They found that the leading bubble is unaffected by the proximity of the trailing bubble. The trailing bubble interacts with the wake of the leading bubble and accelerates. The path of the trailing bubble is also affected by the vorticity in the wake and the path deviation depends on the Reynolds and Eotvos numbers. Ghosh et al. [
11] numerically modeled the shape distortion of one bubble due to the influence of the other and their merging.
In many industrial applications, bubbles encounter walls, and the interactions between the bubbles and the wall have a significant impact on flow physics. A single bubble rising near a vertical wall has been experimentally observed to follow a “bouncing” trajectory. Tsao and Koch [
21] made observations for a single bubble rising very close to a wall at different inclination angles. They were the first to report that the bubble shows a steady bouncing behavior as it rises along the wall. After a certain critical angle, the bubble just slides along the wall. They linked this behavior to the bubble deformation dynamics. De Vries et al. [
3] conducted experiments for a bubble rising very close to a vertical wall in still water. They observed that the bubble showed different behaviors such as sliding away, bouncing with constant amplitude or bouncing with increasing amplitude as the bubble size increases. Other researchers have explained this phenomenon based on the wall-induced lift force [
22,
23]. Podvin et al. [
24] attempted to mathematically model the phenomenon using lubrication theory to model the wall-induced force. However, their model could not capture the bouncing process. Jeong and Park [
25] carried out experimental studies for a high Re bubble rising at different distances from a vertical wall made of different materials. Lee and Park [
26] suggested that the presence of the wall surface induces vortex shedding. Barbosa et al. [
27] conducted experiments for a wide range of Reynolds and Weber numbers for bubbles rising near inclined walls. Using a force balance approach correlated with their experimental data, they formulated a condition for the critical angle for the transition from bouncing to sliding behavior.
The physics of this phenomenon is quite complex, and the mechanism of bouncing depends on several parameters. The problem of a rising bubble depends on four non-dimensional parameters:
Eotvos number-ratio of gravitational force to surface tension force Eo = (ρl gd2)/σ
Galilei number-ratio of inertial force to viscous force Ga = (ρl g1/2d3/2)/µl
Density ratio = ρl/ρg
Viscosity ratio = µl/µg
Here, ρ, µ, σ, d and g represent the density, dynamic viscosity, surface tension coefficient, bubble diameter and gravitational acceleration, respectively. The subscripts l and g denote the liquid and gas properties, respectively.
In an experimental setting, it is tough to independently vary the different parameters governing the phenomenon. Numerical simulations come in handy to explore physics incorporating a wider parameter space. Sugioka and Tsukada [
28] investigated the drag and lift forces acting on an inviscid bubble moving near a plane wall using 3D direct numerical simulations. They found that, due to the presence of the wall, the drag force increases, and the direction of the lift force depends on the Reynolds number and the bubble–wall distance. Zhang et al. [
29] simulated bubbles in the presence of a vertical wall and found that the amplitude and frequency of oscillatory bubble motion decrease with decreasing Galilei number. They also noted that the wall-normal dimensionless force, amplitude and frequency are almost independent of the wall-bubble initial distance. They predicted a critical Galilei number for the transition from a steady to an oscillating regime, and it is found to be less than that for the unbounded condition. However, due to high
Eo (=16), the bubble does not experience any attractive motion, and thus, bouncing motion and collision are not observed. Zhang et al. [
30] performed 2D simulations for large deformable bubbles rising at different distances from the wall. They found that the bubble rises in a
Z-shape and as the distance from the wall increases, the swing amplitude of the bubble gradually decreases, while the swing frequency of the bubble increases. Yan et al. [
31] carried out VOF-based 3D simulations to investigate the bubble rising behavior near a vertical wall and observed the bubble bouncing motion. They found that as the Galileo number increases, the asymmetrical shedding of vortex structures is exacerbated by the presence of the wall. They predicted a critical Galilei number for the transition from rectilinear to spiral motion. The closer the bubble is to the wall, the earlier the transition occurs. Moreover, at low Galileo numbers, the bubble terminal velocity decreases due to the presence of the wall. Hasan and Hasan [
32] studied the migration dynamics of an initially spherical bubble near a corner formed by two vertical walls and identified five regimes based on the bubble’s migrating trajectory. Recently, Khodadadi et al. [
33] performed numerical simulations over a wide range of Bond and Morton numbers for a single bubble rising near inclined walls. They identified three different bubble–wall interaction regimes—sliding, intermittent and non-contact—and plotted the regime map over the range of parameters considered.
The goal of this research is to explore the physics of bubble–wall interactions and gain insight into the bubble bouncing behavior as well as the parameters governing this phenomenon. The presence of a wall acts as a perturbation in the flow domain which can strongly affect the trajectory of the rising bubble and trigger the path instability of the bubble. For gas–liquid two-phase systems, a precise knowledge of the bubble trajectory is essential to estimate the gas-phase residence time through which the contact time for interfacial transport can be calculated. The bubble trajectory can be indirectly linked to the efficient design of gas–liquid two-phase systems. Moreover, knowledge of the parameters controlling the bubble trajectory can help us control the flow physics and heat transfer characteristics of many types of industrial equipment. Thus, a detailed investigation of the wall effect on the bubble dynamics is very much needed. This work focuses on the canonical case of a single bubble rising near a vertical wall which serves as the first step towards understanding multi-bubble systems encountered in industry.
Except for a few recent computational studies [
28,
30,
31], the phenomenon of bouncing bubbles due to wall proximity has been studied in the past only through experiments. Experimental studies have their own constraints, and to delve deeper into the physics of any natural phenomenon, we need to look from the perspective of a wider parameter space. There is a need for a robust and well-established numerical model to capture this phenomenon. Moreover, there are still a lot of unanswered questions on bouncing bubbles, such as (1) which force plays the dominant role in governing the dynamics of bouncing; (2) how far into the liquid domain can the wall affect the bubble; (3) what is the role of the transport properties of both the fluids; (4) what are the kinematic and dynamic characteristics of the bouncing motion of the bubble, when observed in a wider parameter space; (5) a force balance model which can predict such dynamics.
To answer some of these questions, we use numerical simulations to analyze the effect of wall proximity and surface tension on the motion of a single bubble rising close to a vertical wall. In
Section 2.2 we compare the parameter ranges covered in this work with the recent literature. Previous studies [
25,
29,
30,
31] have explored the effect of wall proximity on the dynamics of large bubbles with a higher Eotvos number. In this work, we study the effect of the initial bubble–wall distance on the dynamics of smaller bubbles with
Eo and
Ga corresponding to the air–water system. The bubble size is chosen such that the bubble lies in the rectilinear regime.
Tagawa et al. [
34] explored the effect of surfactant concentration on the path instability of a bubble rising in a helical trajectory. For the case of bubbles rising near a vertical wall, previous works [
29,
31] have studied the effect of the Galilei number keeping the Eotvos number fixed at values greater than 1. They predicted the critical
Ga number for the transition from one regime to another. However, the authors have not come across any previous work studying the effect of the Eotvos number on bubbles rising near a vertical wall. Most of the previous research has focused on only discrete values of the
Eo. In this work, by varying the surface tension, we systematically vary the Eotvos number over a large range (0.1–10) and find its critical value for the bubbles to start bouncing on the wall.
2. Computational Model
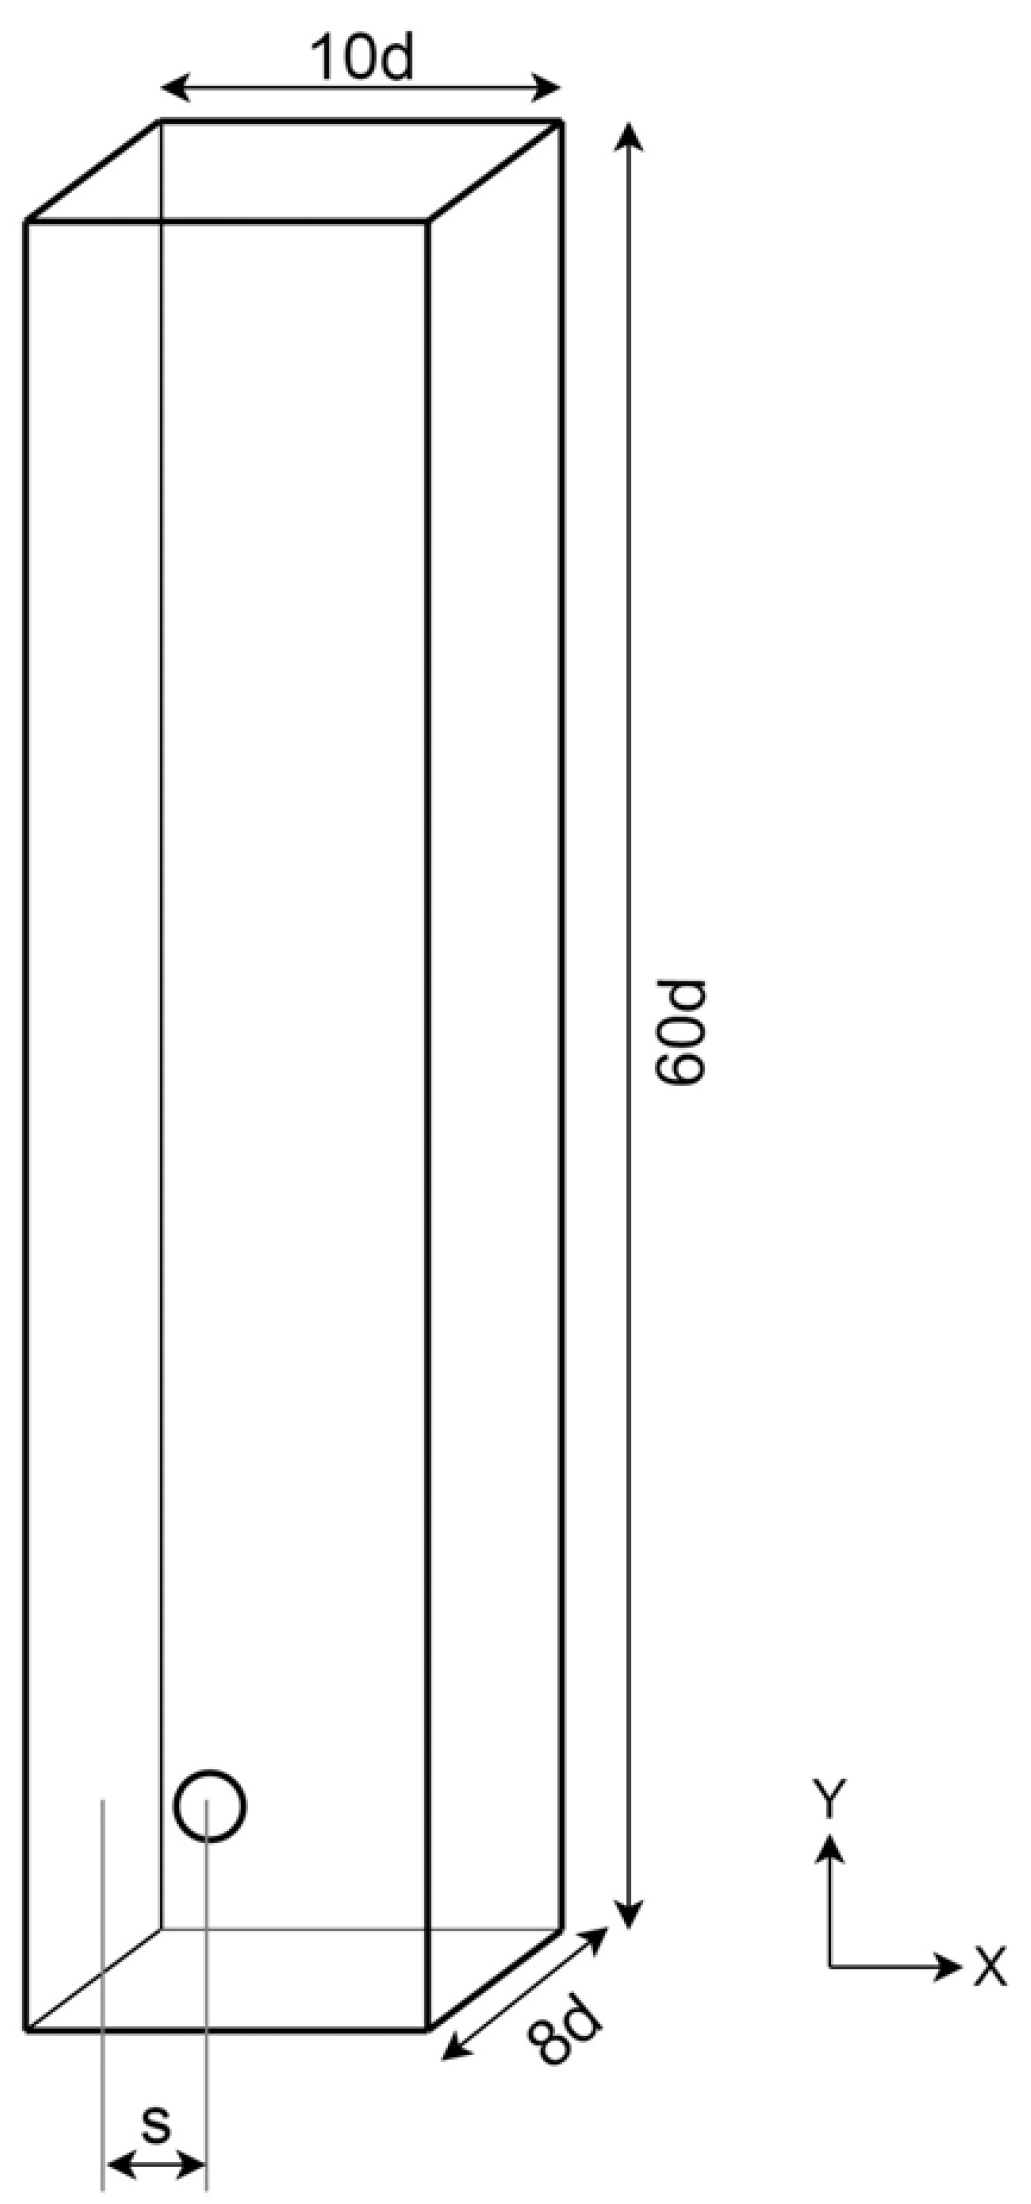
To study the wall effect on the rising motion of an initially spherical bubble, we initialize an air bubble of diameter
d in a water tank of dimensions (10
d × 60
d × 8
d) (see
Figure 1). The dimensions of the computational domain have been chosen as the bubble bouncing phenomenon while keeping the computational costs and time as low as possible.
The height of the domain was taken as 60
d so as to capture at least three bubble bounce events. Previous numerical studies [
35] have shown that if the walls are at least 6
d away from the bubble, then the computational domain can be treated as an unbounded fluid medium. The length and breadth have been taken as 10
d and 8
d, respectively, so that there is no effect of the right wall, the front and back walls on the bubble motion. Since, the parameter range is chosen such that the bubble falls either in the rectilinear regime or the planar zigzagging regime and the bubble is going to bounce on the left wall (i.e., along the length of the domain) with negligible motion along the breadth of the domain, the length is kept greater than the breadth.
To avoid the influence of the right, bottom, back and front walls the initial co-ordinates of the bubble are set to (
s, 4
d, 4
d), where
s is the normalized initial distance of the bubble centroid from the left wall. Thus, only the left wall would affect the dynamics of the bubble [
35,
36]. The initial bubble–wall distance has been normalized with respect to the bubble diameter.
The 3D computational simulation is performed with the interFoam solver in CFD code OpenFOAM, where the VOF model, is used to reconstruct the gas–liquid interface. Open- FOAM is a very robust open source CFD library and has been validated and used for the study of bubble dynamics by many researchers [
37,
38,
39]. The VOF method has been proven to be quite accurate to capture the physics of bubble–wall interactions [
40,
41].
2.1. Governing Equations and Numerical Model
The VOF model uses the phase fraction α to locate the phase interface. The grid cell is filled with the liquid phase when α = 1, and when α = 0, it is filled with the gas phase. The interface can be located as the region where α lies between 0 and 1.
The conventional VOF method involves the simultaneous solution of the continuity and momentum equations along with the solution of the transport equation for the phase fraction.
The incompressible continuity equation can be written as:
The two phases share a common set of momentum equations, which can be represented as:
where
u represents the velocity vector shared by the two fluids throughout the flow domain.
t and
p denote the time and static pressure, respectively.
Fσ represents the surface tension force. In a single pressure system, the normal component of the pressure gradient at a stationary non-vertical solid wall with a no-slip condition must be different for each phase due to the hydrostatic component
ρg when the phases are separated at the wall. In order to simplify the definition of boundary conditions, a modified pressure is defined as:
where
x represents the position vector of the fluid element.
Using Equation (3) in (2) yields the modified momentum equation as follows:
Body forces due to pressure gradient and gravity are implicitly accounted for by the first two terms on the right-hand side of Equation (4).
In addition, the density
ρ and viscosity
µ are weighted by the phase fraction parameter as follows:
where α indicates the liquid phase fraction parameter. Subscripts l and g denote the liquid and gas phases, respectively.
The continuum surface force (CSF) model is used for surface tension. The surface tension force is calculated as follows:
where
σ represents the surface tension coefficient and
κ represents the local curvature at the interface which can be approximated as follows:
In order to know where the interface between the two fluids is, an additional equation for
α has to be solved:
In the interFoam solver, a two-fluid Eulerian formulation is used in which the phase fraction equation is solved separately for each individual phase [
37].
The velocity is modeled in terms of the weighted average of the corresponding liquid and gas velocities as shown below:
Equations (10)–(12) can be combined [
37] to obtain:
With this formulation, a sharper interface resolution is achieved. The phase fraction transport Equation (13) contains an extra convective term that is referred to as the compression term, which is used to keep the sharpness of the phase interface. In Equation (13),
uc is called the compression velocity, which is, in essence, the relative velocity between the two phases. Since only a single velocity for both fluids is considered in the whole domain, the compression velocity needs to be modeled [
37,
38] as:
where
c is the compression factor with the value of 1. Equation (14) closes the system of governing equations.
OpenFOAM solves the coupled system of Equations (1), (4) and (13) based on the finite volume method. The details of the used discretization schemes are given in
Table 1. A predicted velocity field is constructed and then corrected repeatedly by using the pressure implicit with splitting of operators (PISO) iteration procedure. Details of the solution procedure followed by the solver can be found in this paper [
38].
All the walls were assigned a no-slip boundary condition for velocity and a zero gradient boundary condition for pressure. A static contact angle boundary [
40] condition was imposed on the left wall. Both the velocity and pressure fields were initialized as a uniform field with a value of zero.
The convergence tolerance was set to 1 × 10⁻⁶ for all the governing equations. The adjustable time step setting was turned on to ensure time step convergence.
The computations were performed on a supercomputing cluster using at least 128 cores in Intel Xeon SKL G-6148 processors running in parallel. Each solution needed at least 5 days of runtime.
2.2. Parameter Space
The density and viscosity ratios have been chosen to represent an air–water gas–liquid system. For the air–water system, taking ρ = 1000 kg m−3, μ = 0.001 Pa s, g = 9.81 m s−2 and d = 0.001 m, we obtain Ga = 99. The case of Ga = 99 and Eo = 0.14 represent a 1 mm air bubble rising near a wall in pure water. Fixing the Ga and bubble diameter and varying the Eo from 0.1 to 10 allows us to study the effect of surface tension on the near-wall bubble behavior. In practical situations, we can control the surface tension of the air–water interface by using surfactants. These Eo values range can be considered as the value of Eo for a 1 mm air bubble rising in water having different surfactant concentrations. The knowledge of the effect of surface tension on the bubble behavior in water can be leveraged in practical situations to control the flow properties by using surfactants.
Table 2 shows a comparison between the parameters considered in previous research and this work. It is quite clear that we are exploring a parameter space that has been unexplored as of yet.
3. Results
To investigate the effect of a nearby vertical wall on the hydrodynamic behavior of a bubble, we divide this work into three parts. First, we compare the dynamics of a wall-bounded bubble with a free-rising bubble, then, we investigate the bubble dynamics at different initial wall distances. Finally, we study the effect of surface tension on the bubble behavior.
3.1. Grid Independence and Validation
We performed our simulations on a uniform mesh so as to obtain the same level of accuracy throughout the domain. To validate our model, we first chose a very coarse mesh with only 10 cells (see
Figure 2a) across the bubble diameter. We then refined the mesh to obtain different meshes with 15 cells (see
Figure 2b), 20 cells (see
Figure 2c) and 25 cells across the bubble diameter. Simulations for an air bubble (
d = 1 mm) rising in pure water were performed using these meshes and the trend of rising velocity achieved by each mesh has been plotted in
Figure 3. The results for terminal velocity for each mesh have been tabulated in
Table 3.
Figure 2d shows the mesh in the region between the bubble and the wall.
For simulating the phenomenon, a good resolution of the bubble surface is essential. It is quite clear from
Figure 2a that Mesh 1 cannot resolve the bubble surface.
From
Figure 3, we can see that the bubble velocity converges to a stable terminal velocity only for Mesh 3.
Mesh 4 (25 cells per bubble diameter) was also tested and there was not much difference in the results from Mesh 3. However, there was a considerable increase in the simulation time. Mesh 3 was thus the optimum choice for carrying out the simulations and the results from Mesh 3 can be considered to be grid independent.
The bubble terminal velocity for the same bubble size and fluid properties was calculated using the correlation of Jamialahmadi [
42]. As can be seen from
Table 4, the numerical results are in excellent agreement with the experimental correlation. The drag coefficient of the bubble is evaluated by balancing the buoyancy force and drag force at terminal conditions. The experimental drag coefficient for the same conditions has been obtained using Moore’s correlation [
4]. Both the numerical and experimental drag coefficients are shown in
Table 4 below. The error between the experimental correlation and the numerical result is around 8%.
Thus, we can say that results from Mesh 3 are in agreement with experimental findings validating our model.
3.2. Near-Wall Rising Behaviour
For bubbles rising due to buoyancy, the near-wall bubble motion is very distinct from the motion of an unbounded bubble.
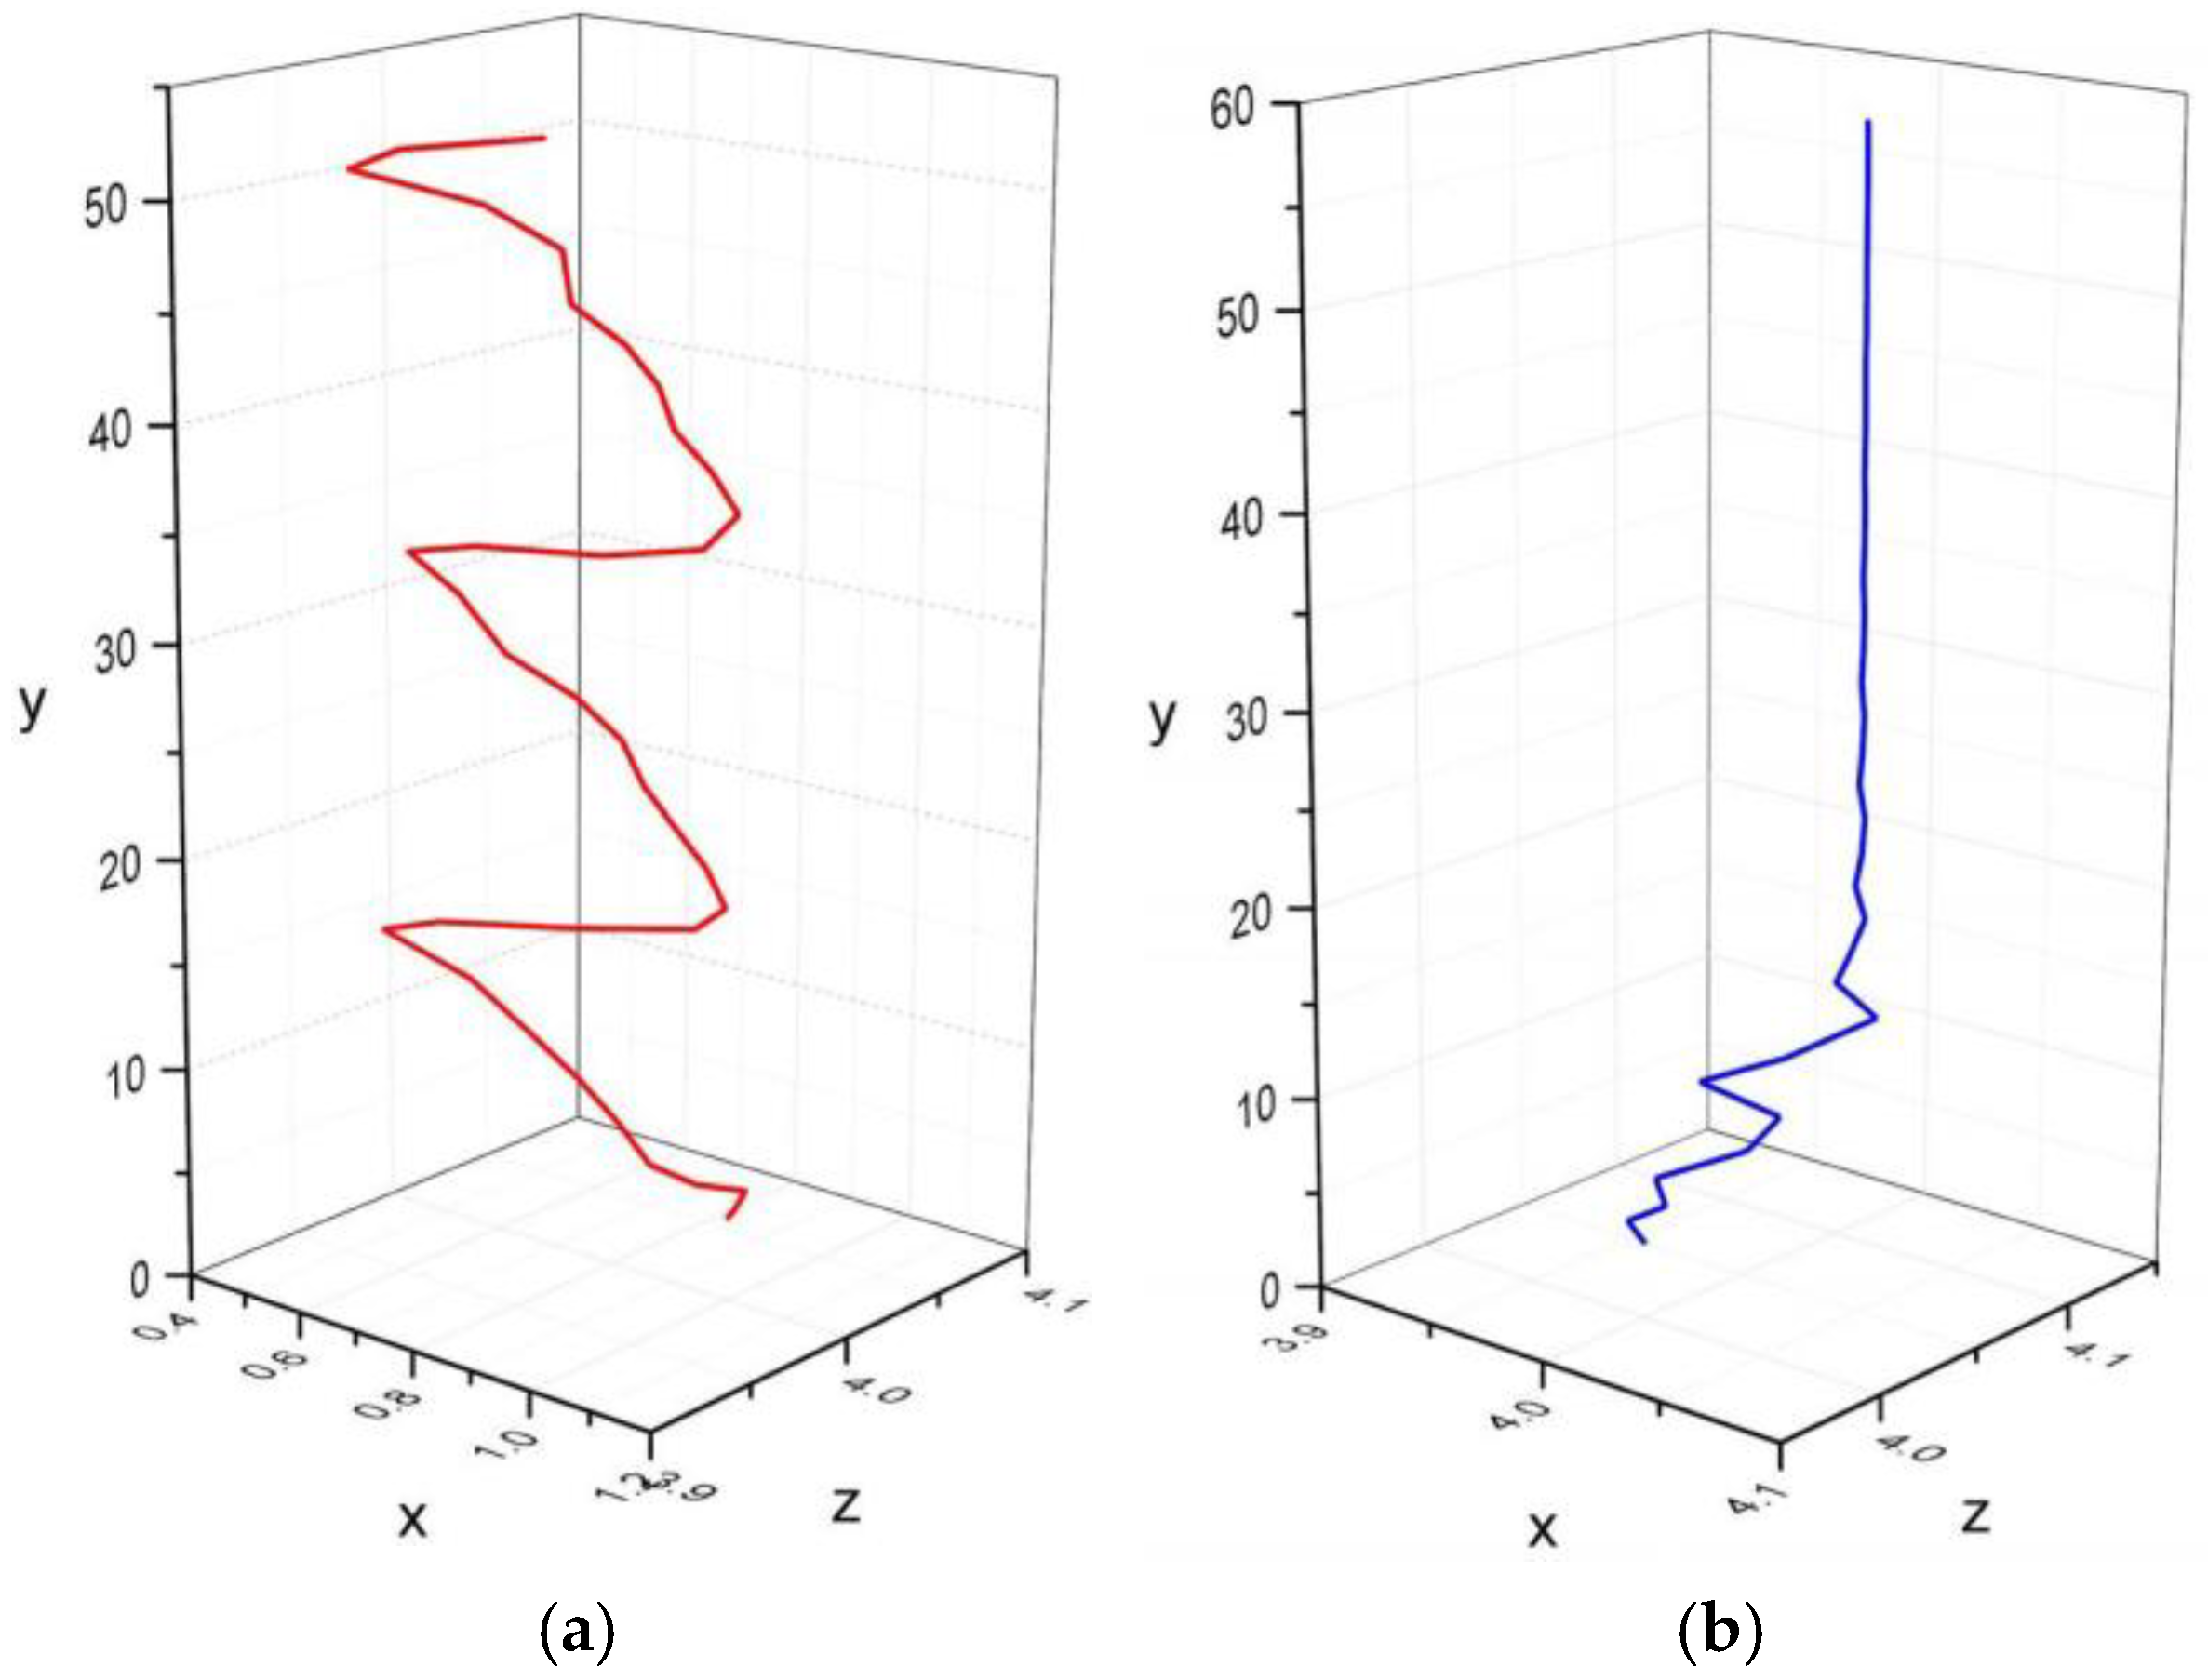
Figure 4 shows the trajectory of a bubble (
d = 1 mm,
Eo = 0.14,
Ga = 99) released at a distance of
s = 1, 4 from the left wall. The bubble released at
s = 4 shows a straight rising trajectory (
Figure 4b) while the one released at
s = 1 shows an almost two-dimensional zigzagging trajectory (
Figure 4a). Since at
s = 4 the rising trajectory is not affected by the wall, it can be considered an unbounded bubble.
It can be observed from
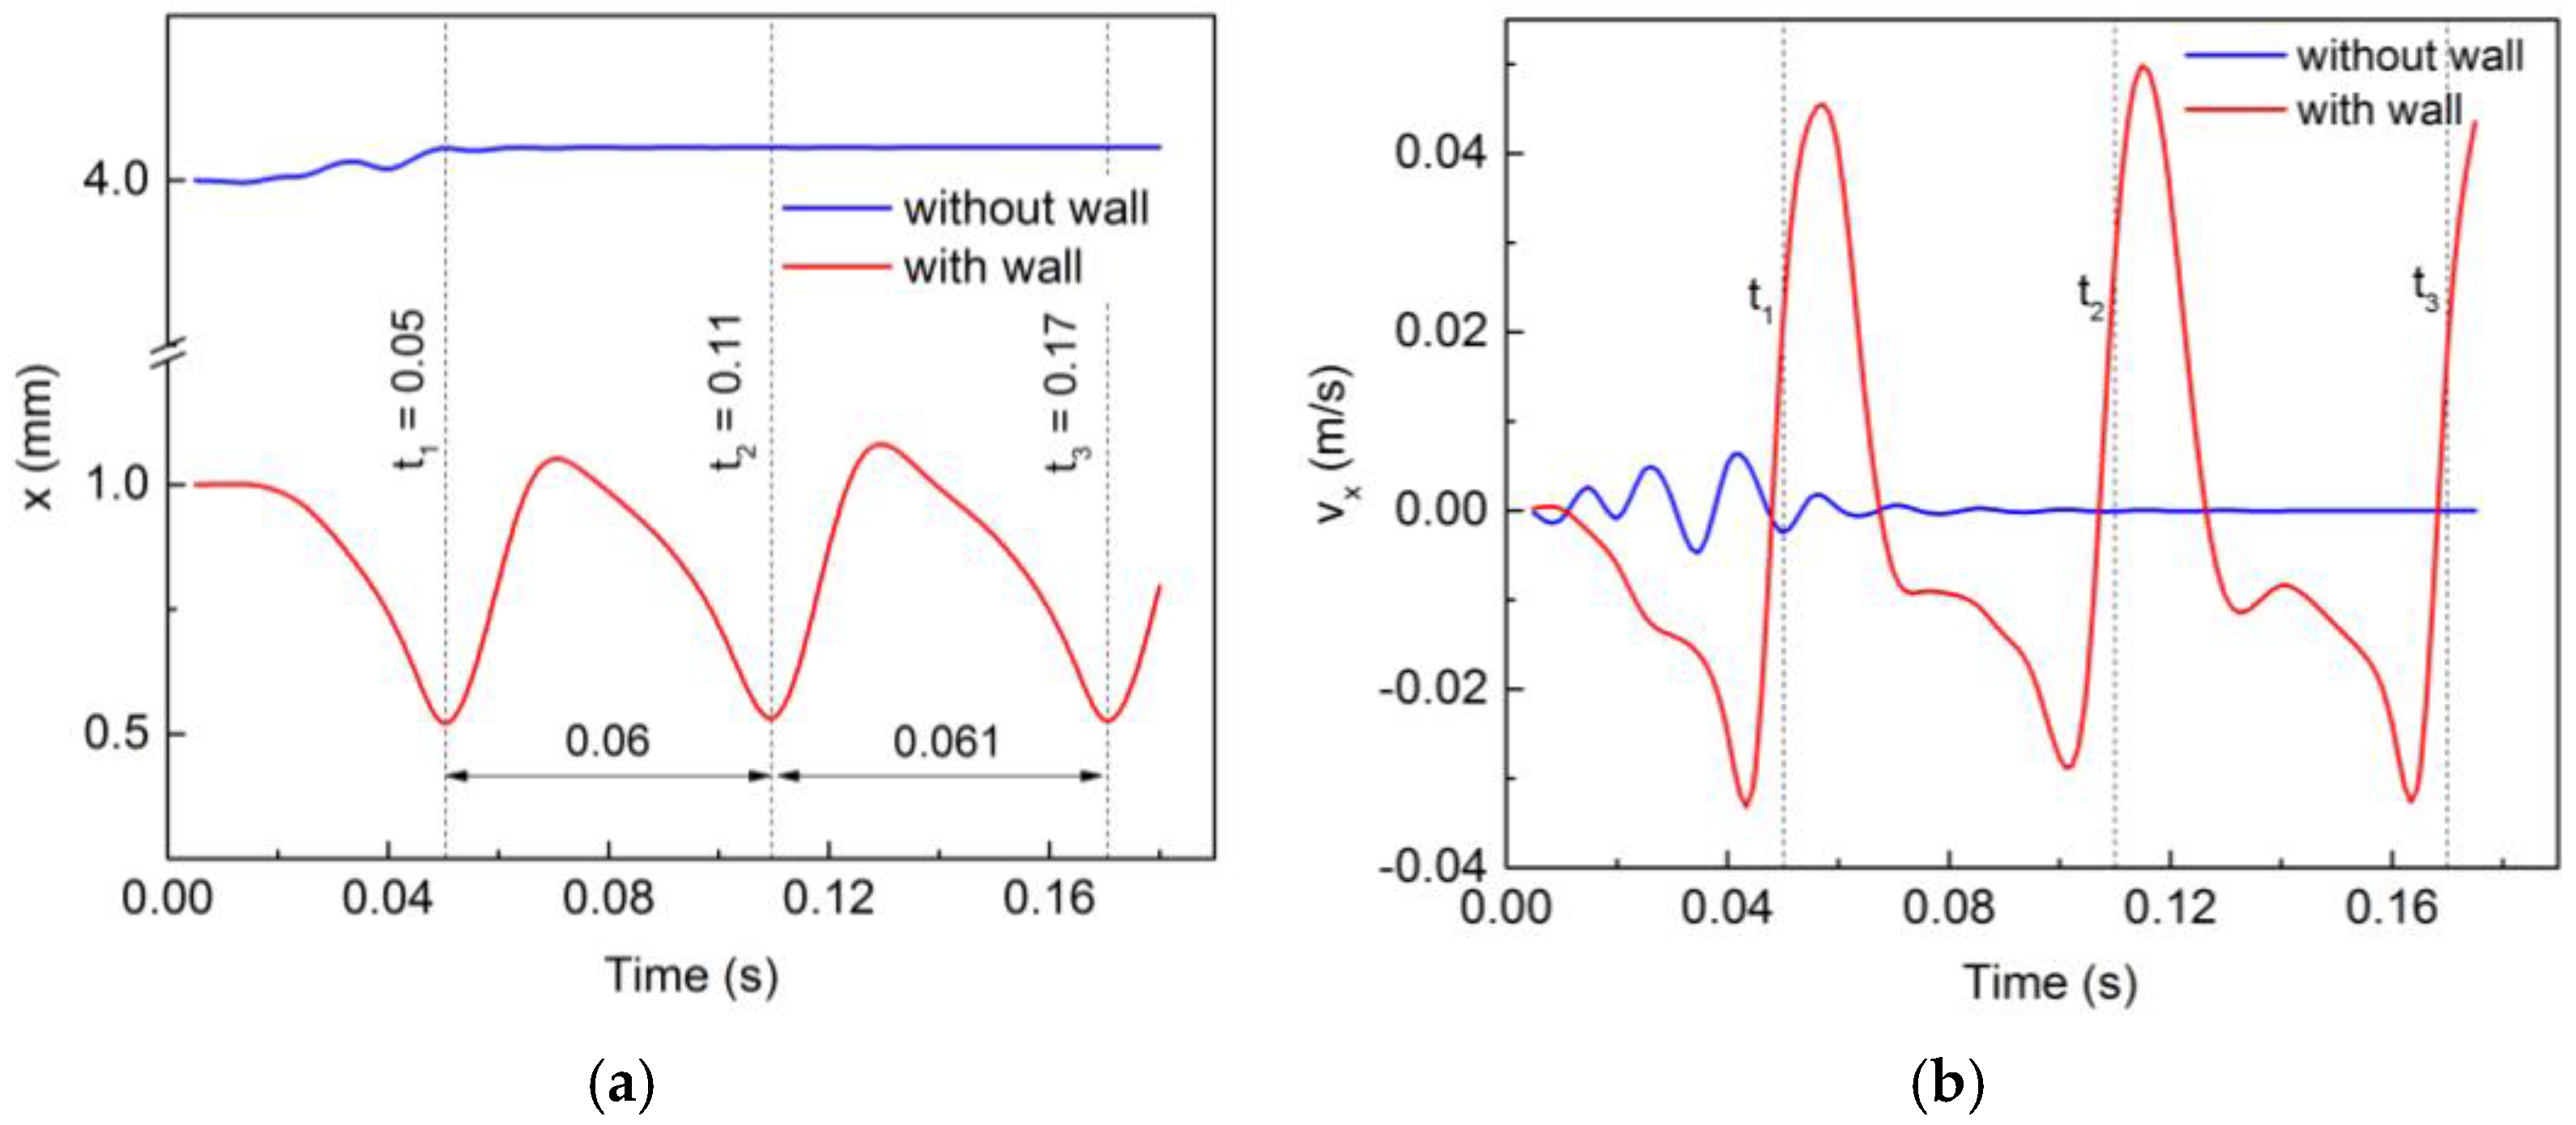
Figure 5a that the unbounded bubble has no motion along the
x-direction. However, the wall-bounded bubble shows a sinusoidal variation of its
x-position with time, referred to as bouncing motion in the literature [
3,
21,
25].
Figure 5b shows the variation of the wall-normal velocity for the wall-bounded and unbounded bubbles. After an initial transition state, the wall-normal velocity for the unbounded bubble converges to a steady value of zero, whereas the wall-normal velocity for the near-wall bubble shows a sinusoidal variation.
The effect of the wall on the rising motion of the bubble is shown in
Figure 6. The
y-position of the bubble is monotonically increasing for both cases, but the slope for the bounded bubble is lesser than that for the unbounded bubble. The rise velocity of the wall-bounded bubble is fluctuating, and its terminal velocity is lower than that of the unbounded bubble.
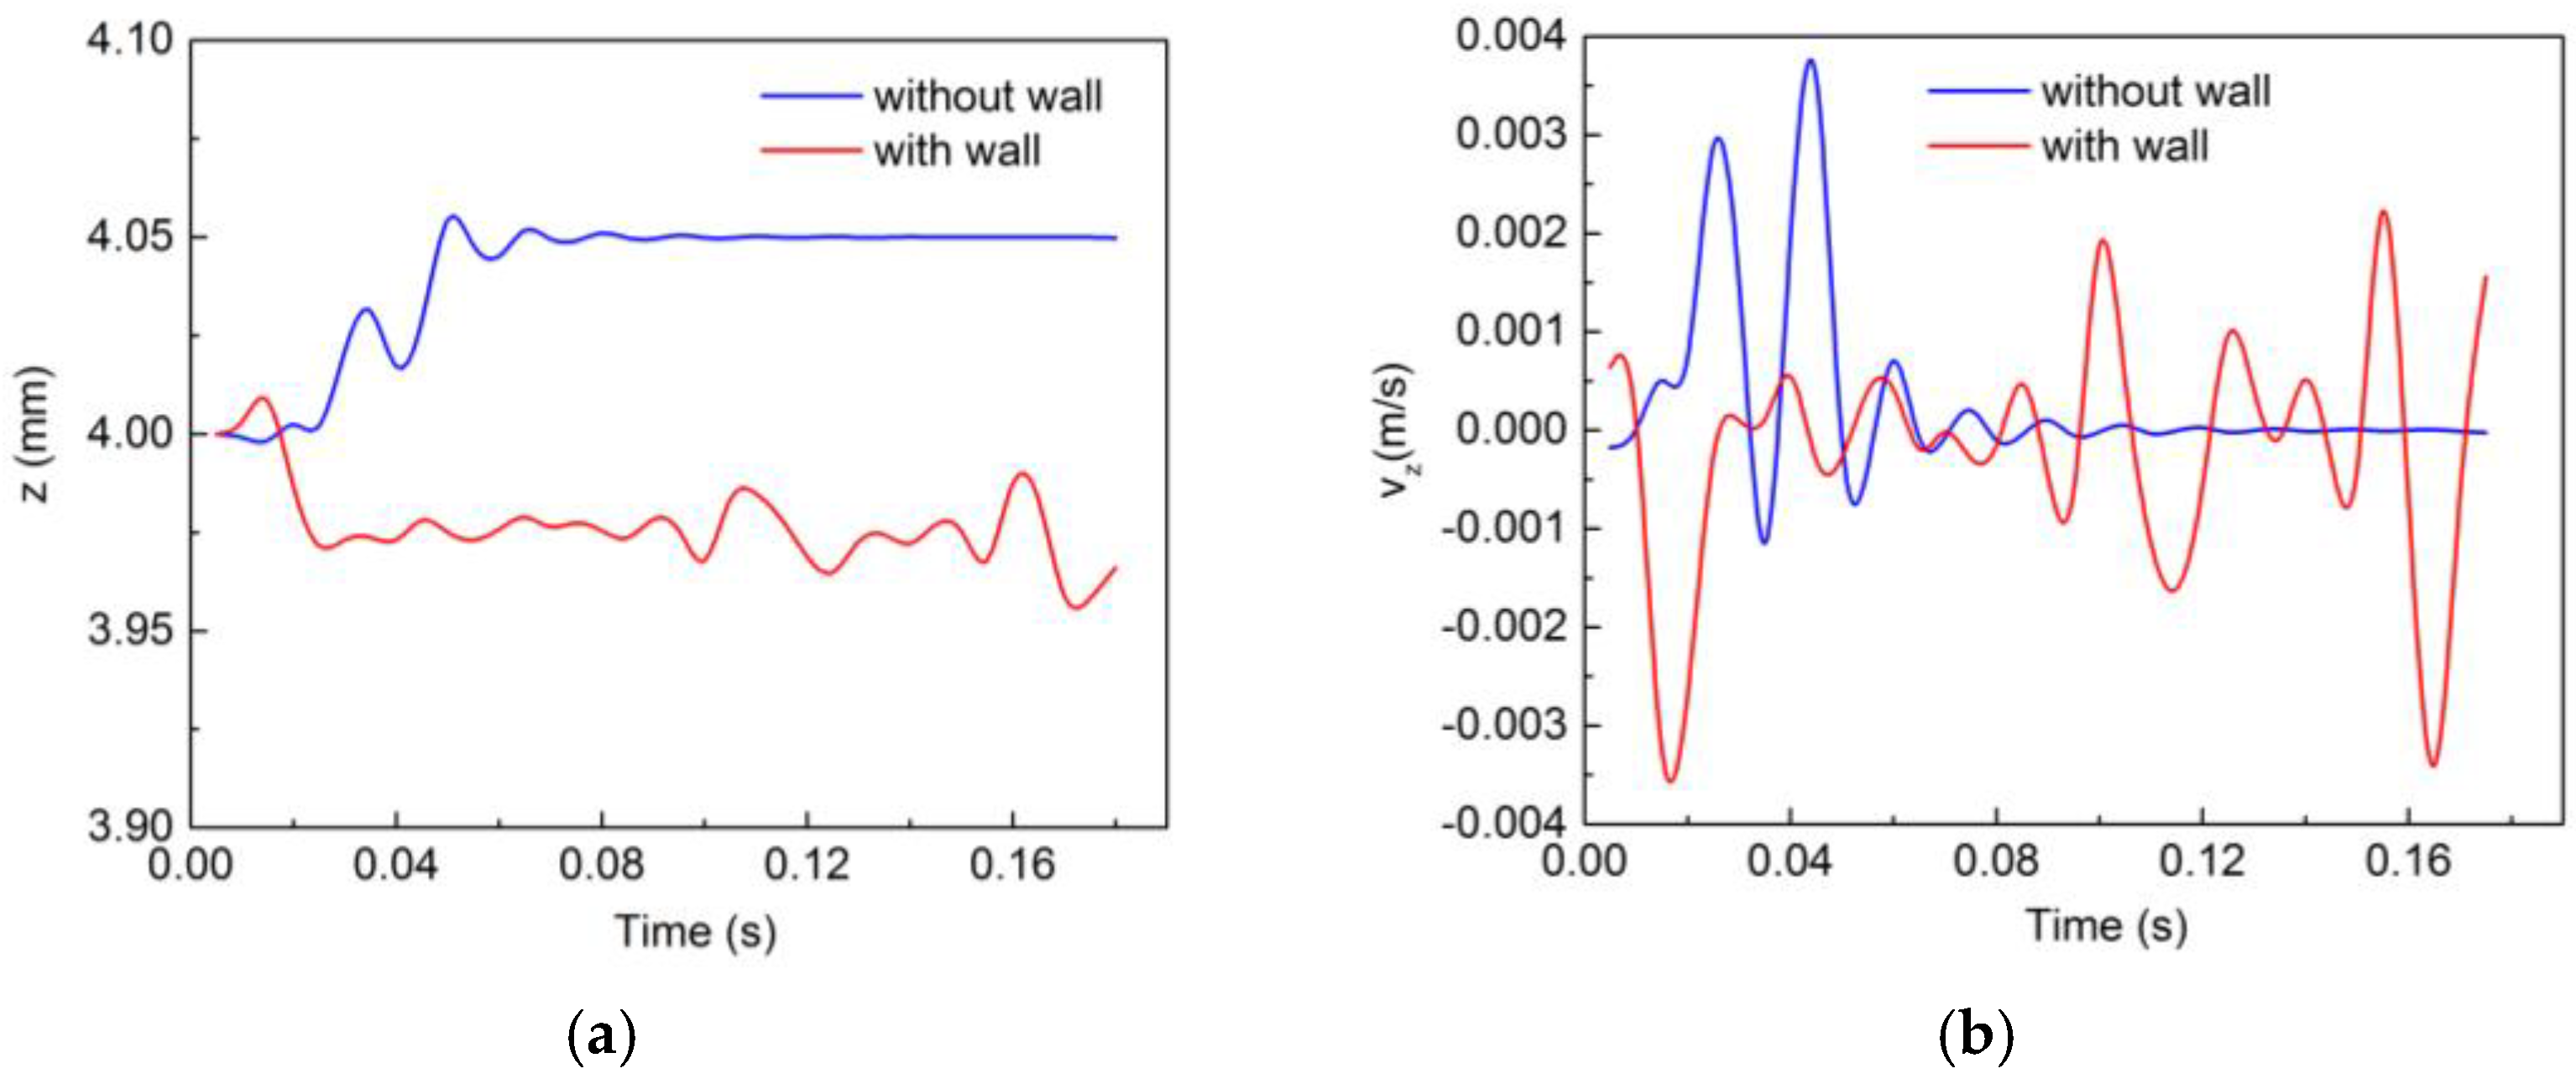
Now, if we look at the motion of the bubble in the spanwise direction (shown in
Figure 7a,b) it is quite clear that the variations are of negligible magnitude compared to the variations in the other directions. For the unbounded bubble, after an initial transition state, the motion in the
z-direction ceases and the
z-position of the bubble gets fixed at
z = 4.05 mm and
z-velocity becomes zero. For the bounded bubble, random fluctuations in both the position and velocity in the
z-direction are observed. However, the magnitude of these changes is very small.
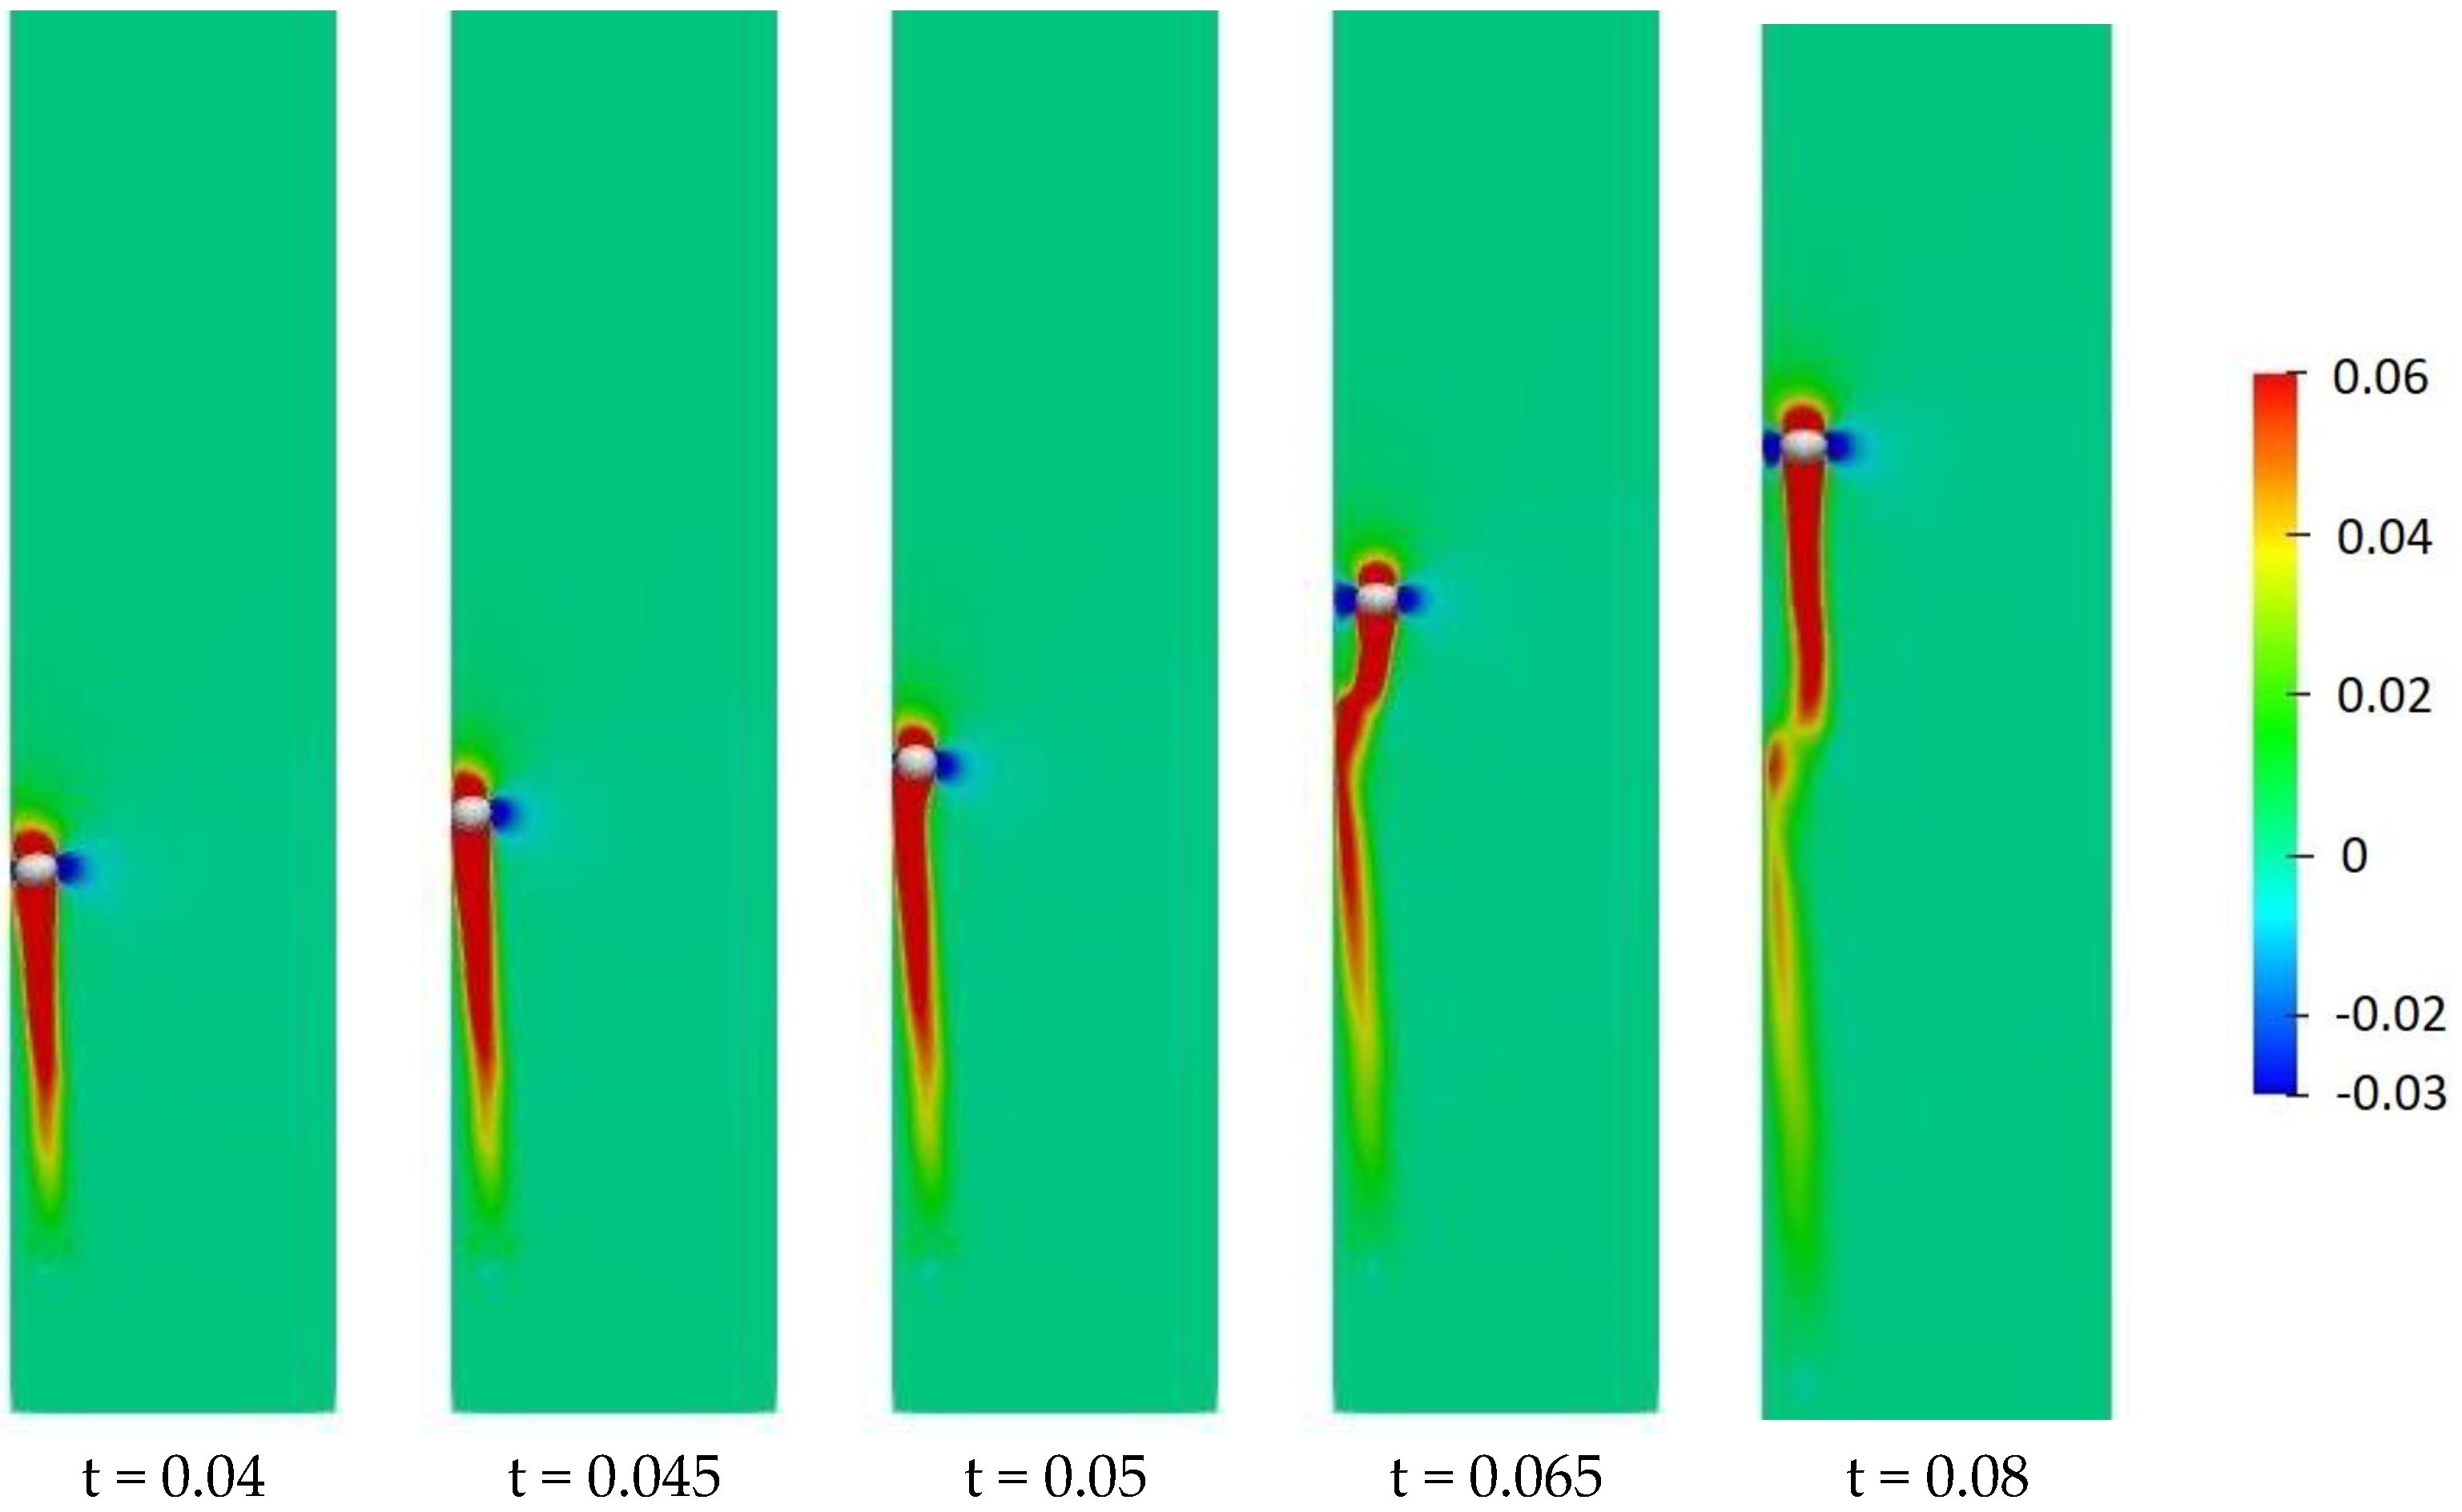
Figure 8 and
Figure 9 show the X and Y velocity contours, respectively, during a bounce event. It can be observed that just after the bubble–wall collision, both the x-velocity and the y-velocity in the region surrounding the bubble drop to significantly low values, thus breaking the continuity of the liquid flow around the bubble. This can be considered as the separation of the flow behind the bubble. It appears that the flow separation occurs after the bubble has bounced. This might have an effect on the wake region behind the bubble.
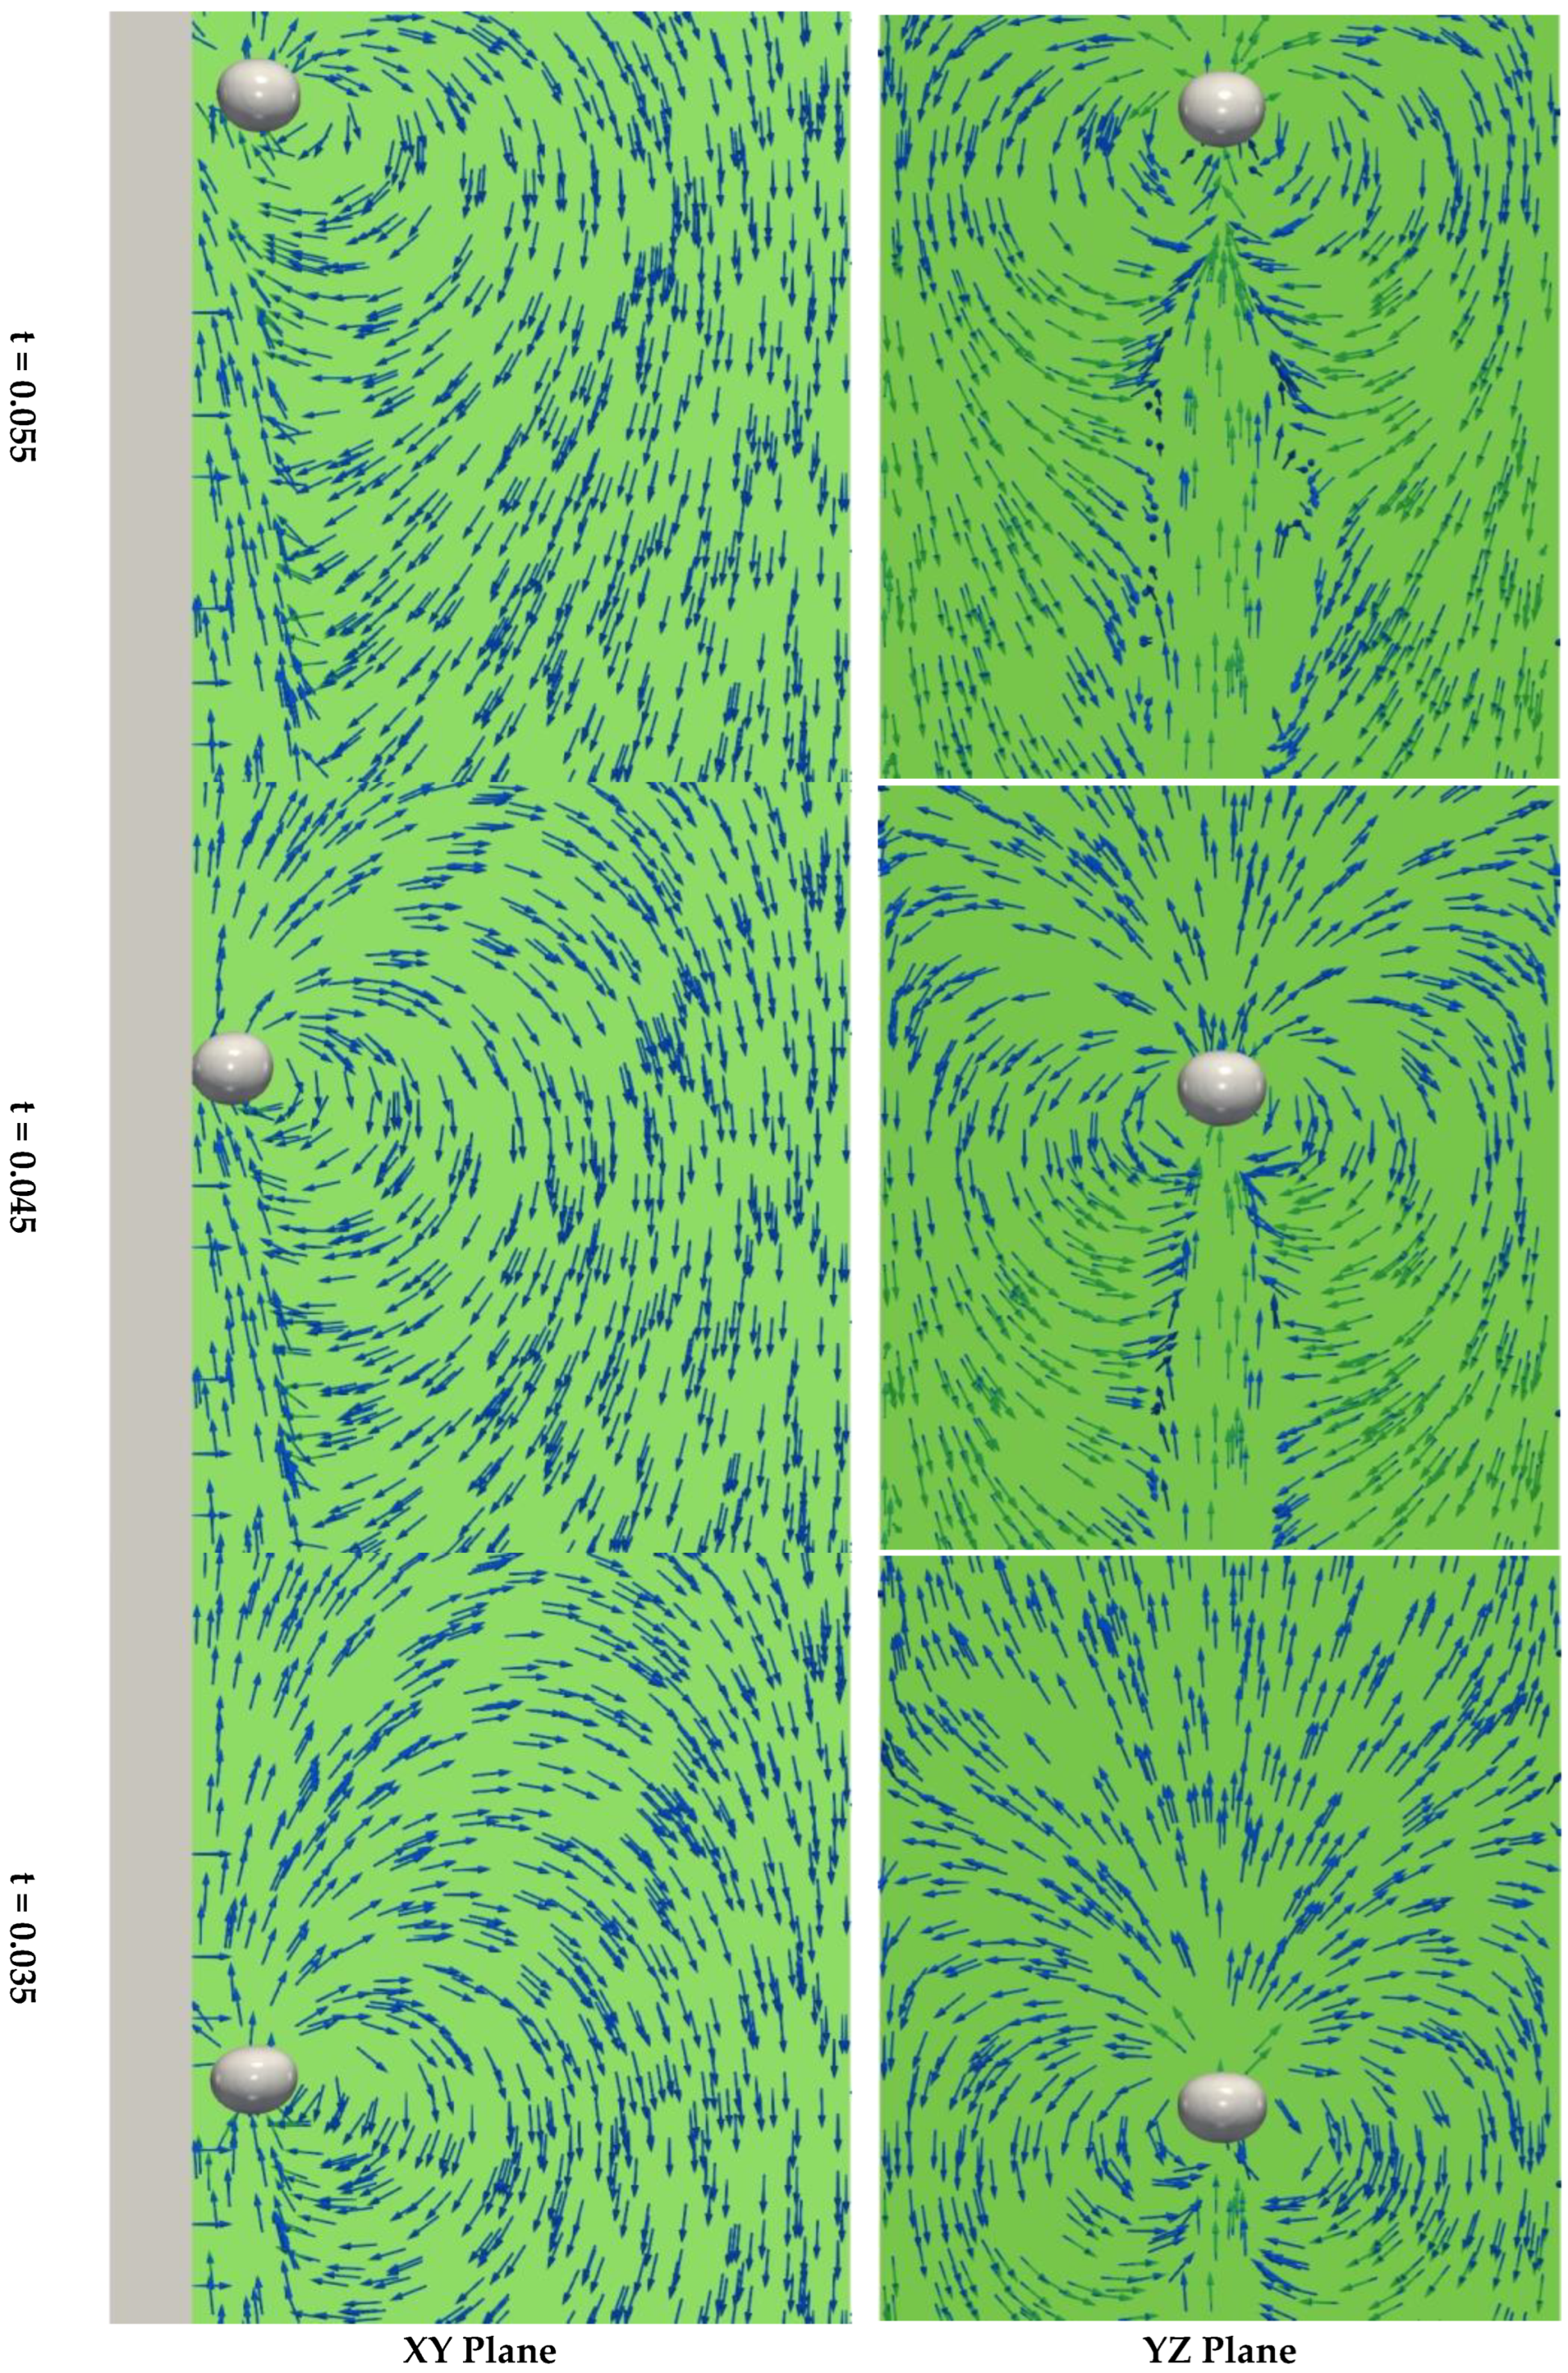
Figure 10 and
Figure 11 show the velocity vector plots around the wall-bounded and free bubble, respectively. It is clear that the wall provides a symmetry-breaking perturbation to the vortices in the flow field. As per Kelvin’s circulation theorem, vortices in the flow domain can generate lateral forces. From
Figure 10, we can see that in the YZ plane, there are two symmetrical vortices in the wake of the bubble. The lateral force generated due to the two vortices on the bubble cancels out, and thus, the resultant force on the bubble is zero, resulting in no motion in the spanwise direction.
However, due to the presence of the wall, the flow structures in the XY plane become unsymmetrical. The vortex structures in the wake of the bubble are asymmetrical resulting in a net lateral force that attracts the bubble towards the wall. Thus, the asymmetry in the flow structures provides a qualitative explanation for the attractive lift force experienced by the bubble due to the presence of the wall. The bouncing phenomenon is just a consequence of this lift force. As the bubble rises near the wall, it is attracted towards the wall due to the lift force. When it becomes sufficiently close to the wall, the pressure in the thin liquid film between the bubble and the wall exerts a force that repels the bubble away from the wall. The bubble now moves away from the wall as it rises upwards. The lift force again attracts the bubble towards the wall while the pressure in the liquid film repels it. The amplitude of the bouncing motion, i.e., the maximum wall-normal distance reached by the bubble thus depends on the balance of these two forces. Moreover, the wavelength of the bouncing motion depends on the bubble rise velocity and the response time required for these two forces to balance out.
Now, for the case of a bubble rising away from the wall, the wake structures are symmetrical in both planes (
Figure 11) and thus there is no net lateral force acting on the bubble and the bubble rises straight upwards following a rectilinear trajectory.
3.3. Effect of Initial Wall Distance
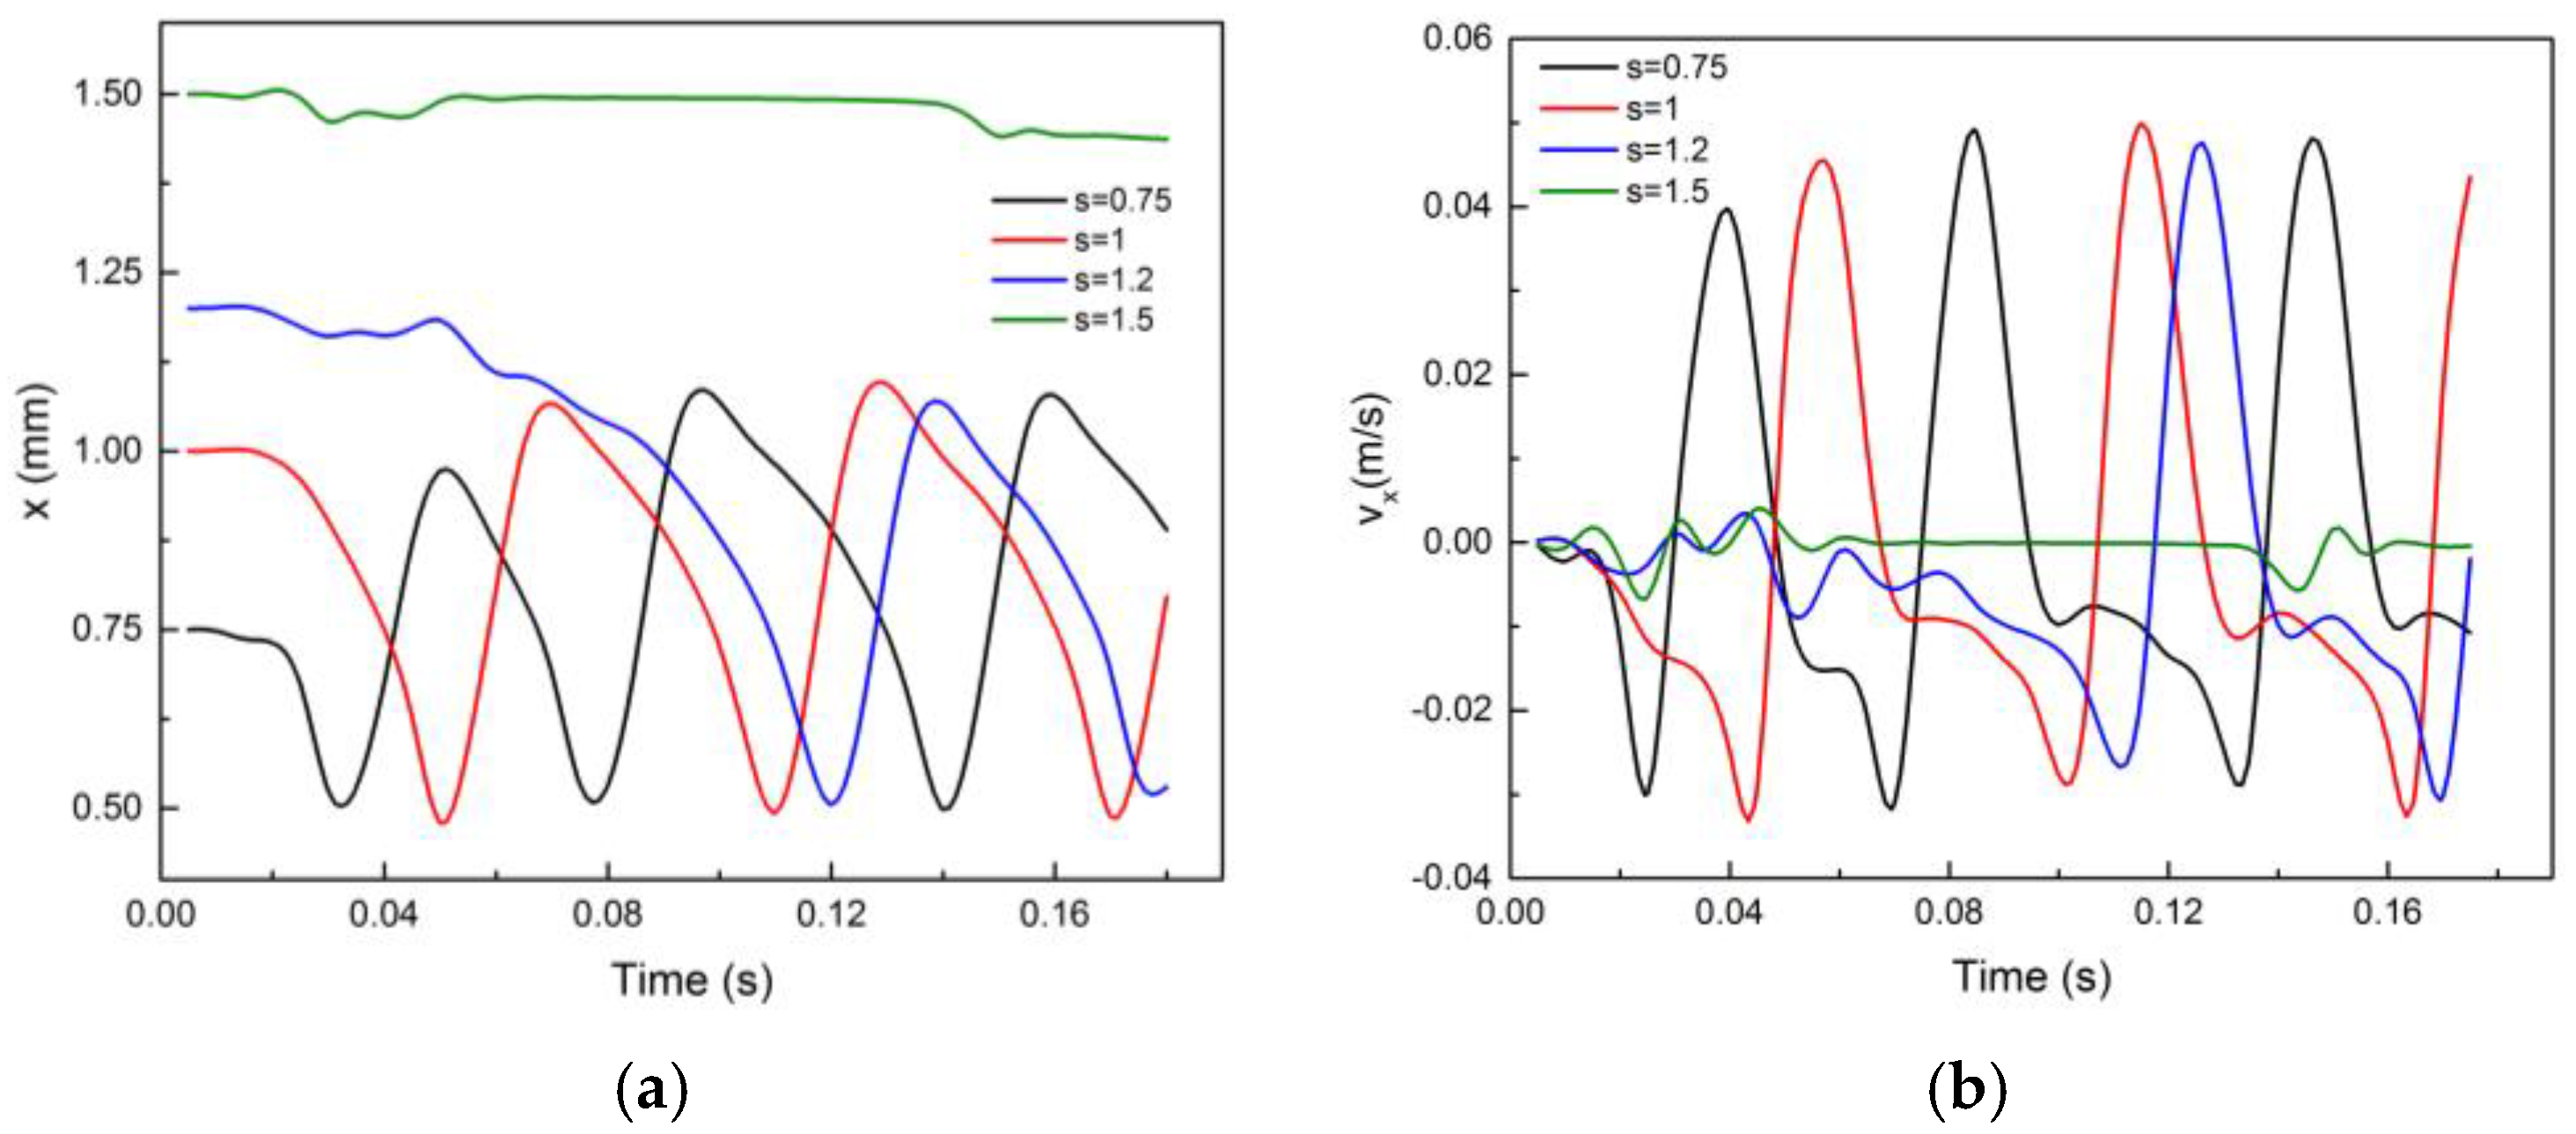
To study the effect of the bubble–wall distance on the bubble rising behavior, we release the bubble at different distances from the wall. Keeping all other parameters fixed, we vary s as s = 0.75, 1, 1.2, 1.5. It is quite intuitive to expect the effect of the wall to decrease as the initial distance increases. This study will help us to analyze how far into the flow field the effect of the wall creeps in.
From
Figure 12, we can see that as the bubble–wall initial distance increases, the bubble trajectory changes from bouncing to straight rising. The bubble shows a bouncing trajectory for
s of less than 1.5.
Figure 13a,b shows the effect of the wall distance on the wall-normal motion of the bubble. The characteristics of the bouncing motion for different
s are listed in
Table 5. It is noted that for the
s values for which the bubble shows a bouncing motion, the bouncing trajectory has almost similar characteristics. This implies that the initial wall distance does not impact the bouncing motion; however, there is just a phase difference of the bouncing trajectories (
Figure 13a) for different
s. In other words, as the distance from the wall increases, the time of onset of these instabilities also increases as we can observe for the cases of
s = 0.75, 1, 1.2. After
s = 1.2, the bubble does not show bouncing in the considered domain.
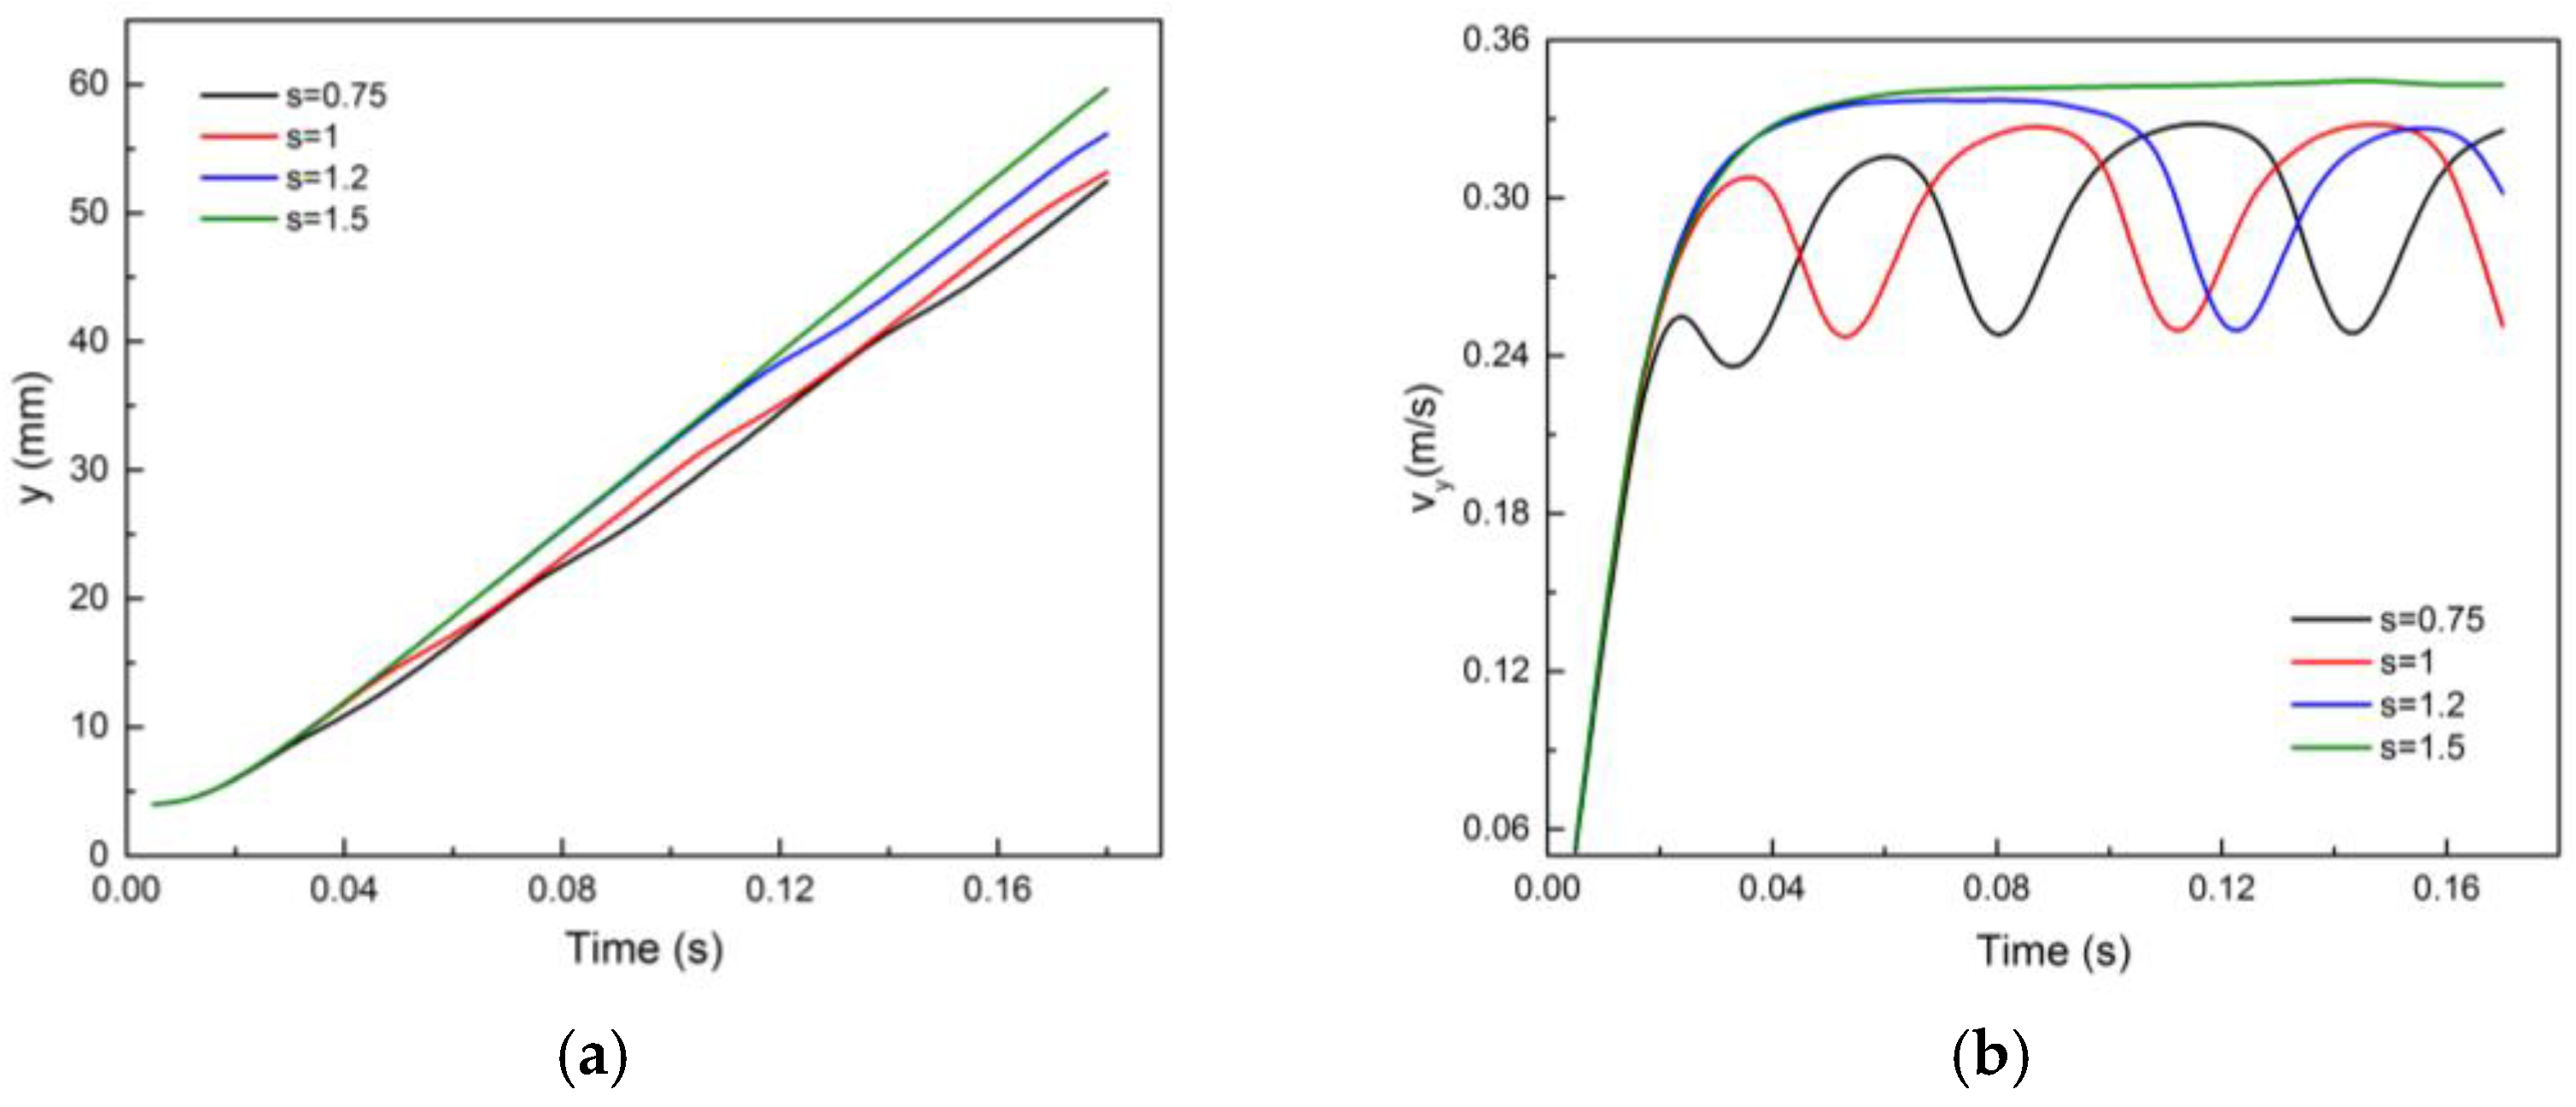
Figure 14a,b show the effect of the wall distance on the rising motion of the bubble. The rising velocity shows a fluctuating trend for
s less than 1.5 and the terminal rise velocity decreases as
s decreases.
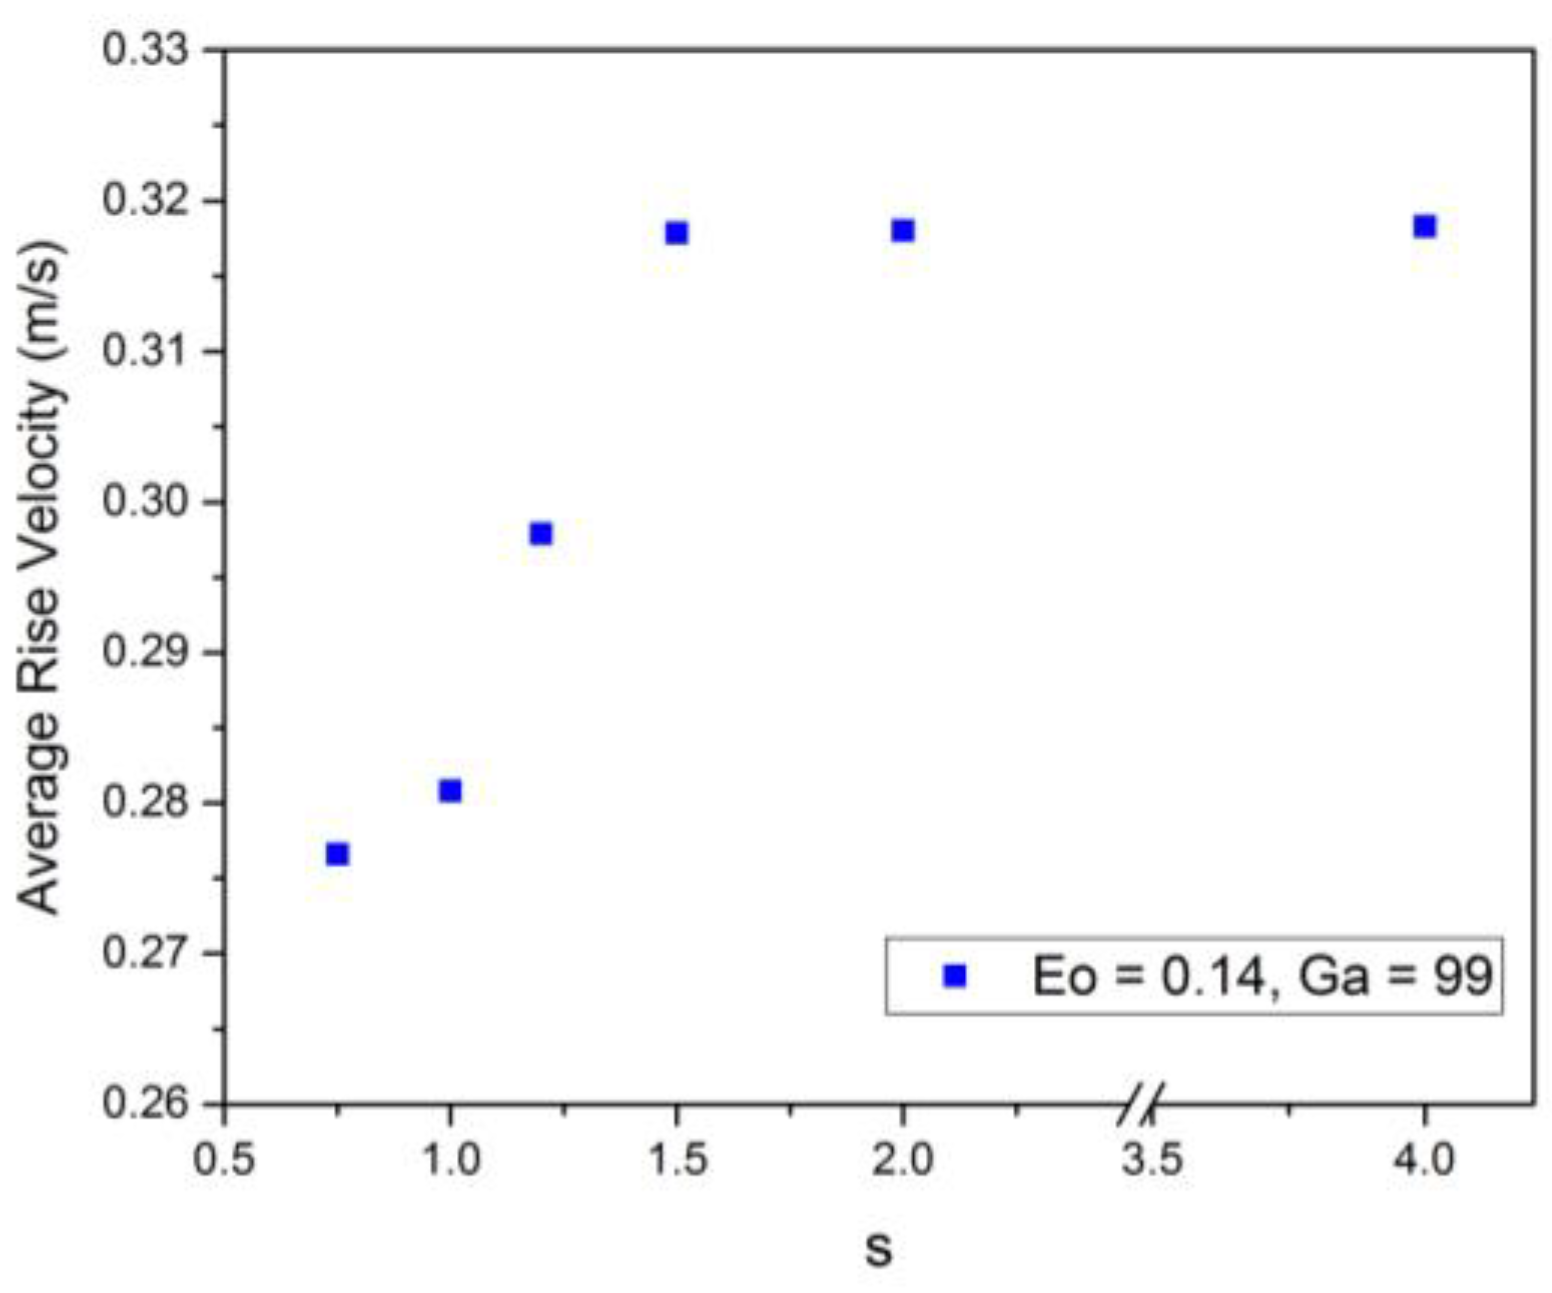
Figure 15 below shows the variation of the average rise velocity of the bubble with the initial bubble–wall distance. As the wall proximity increases, the drag force on the bubble increases, and thus, the average rise velocity decreases. In terms of the drag force, s = 1.5 can be considered as the critical distance beyond which the wall has a negligible effect on the bubble motion.
As can be seen from
Figure 16, the spanwise motion of the bubble is quite randomized.
However, the fluctuations in the z-component of velocity decrease as the distance from the wall increases. Moreover, the magnitude of the position variation and the velocity in spanwise direction is very small compared to the other two directions.
3.4. Effect of Surface Tension
Keeping the bubble size (
d = 1 mm) and distance from the wall (
s = 1) constant, we now vary the surface tension of the liquid–air interface. The different values of
σ and the corresponding
Eo are shown below (see
Table 6):
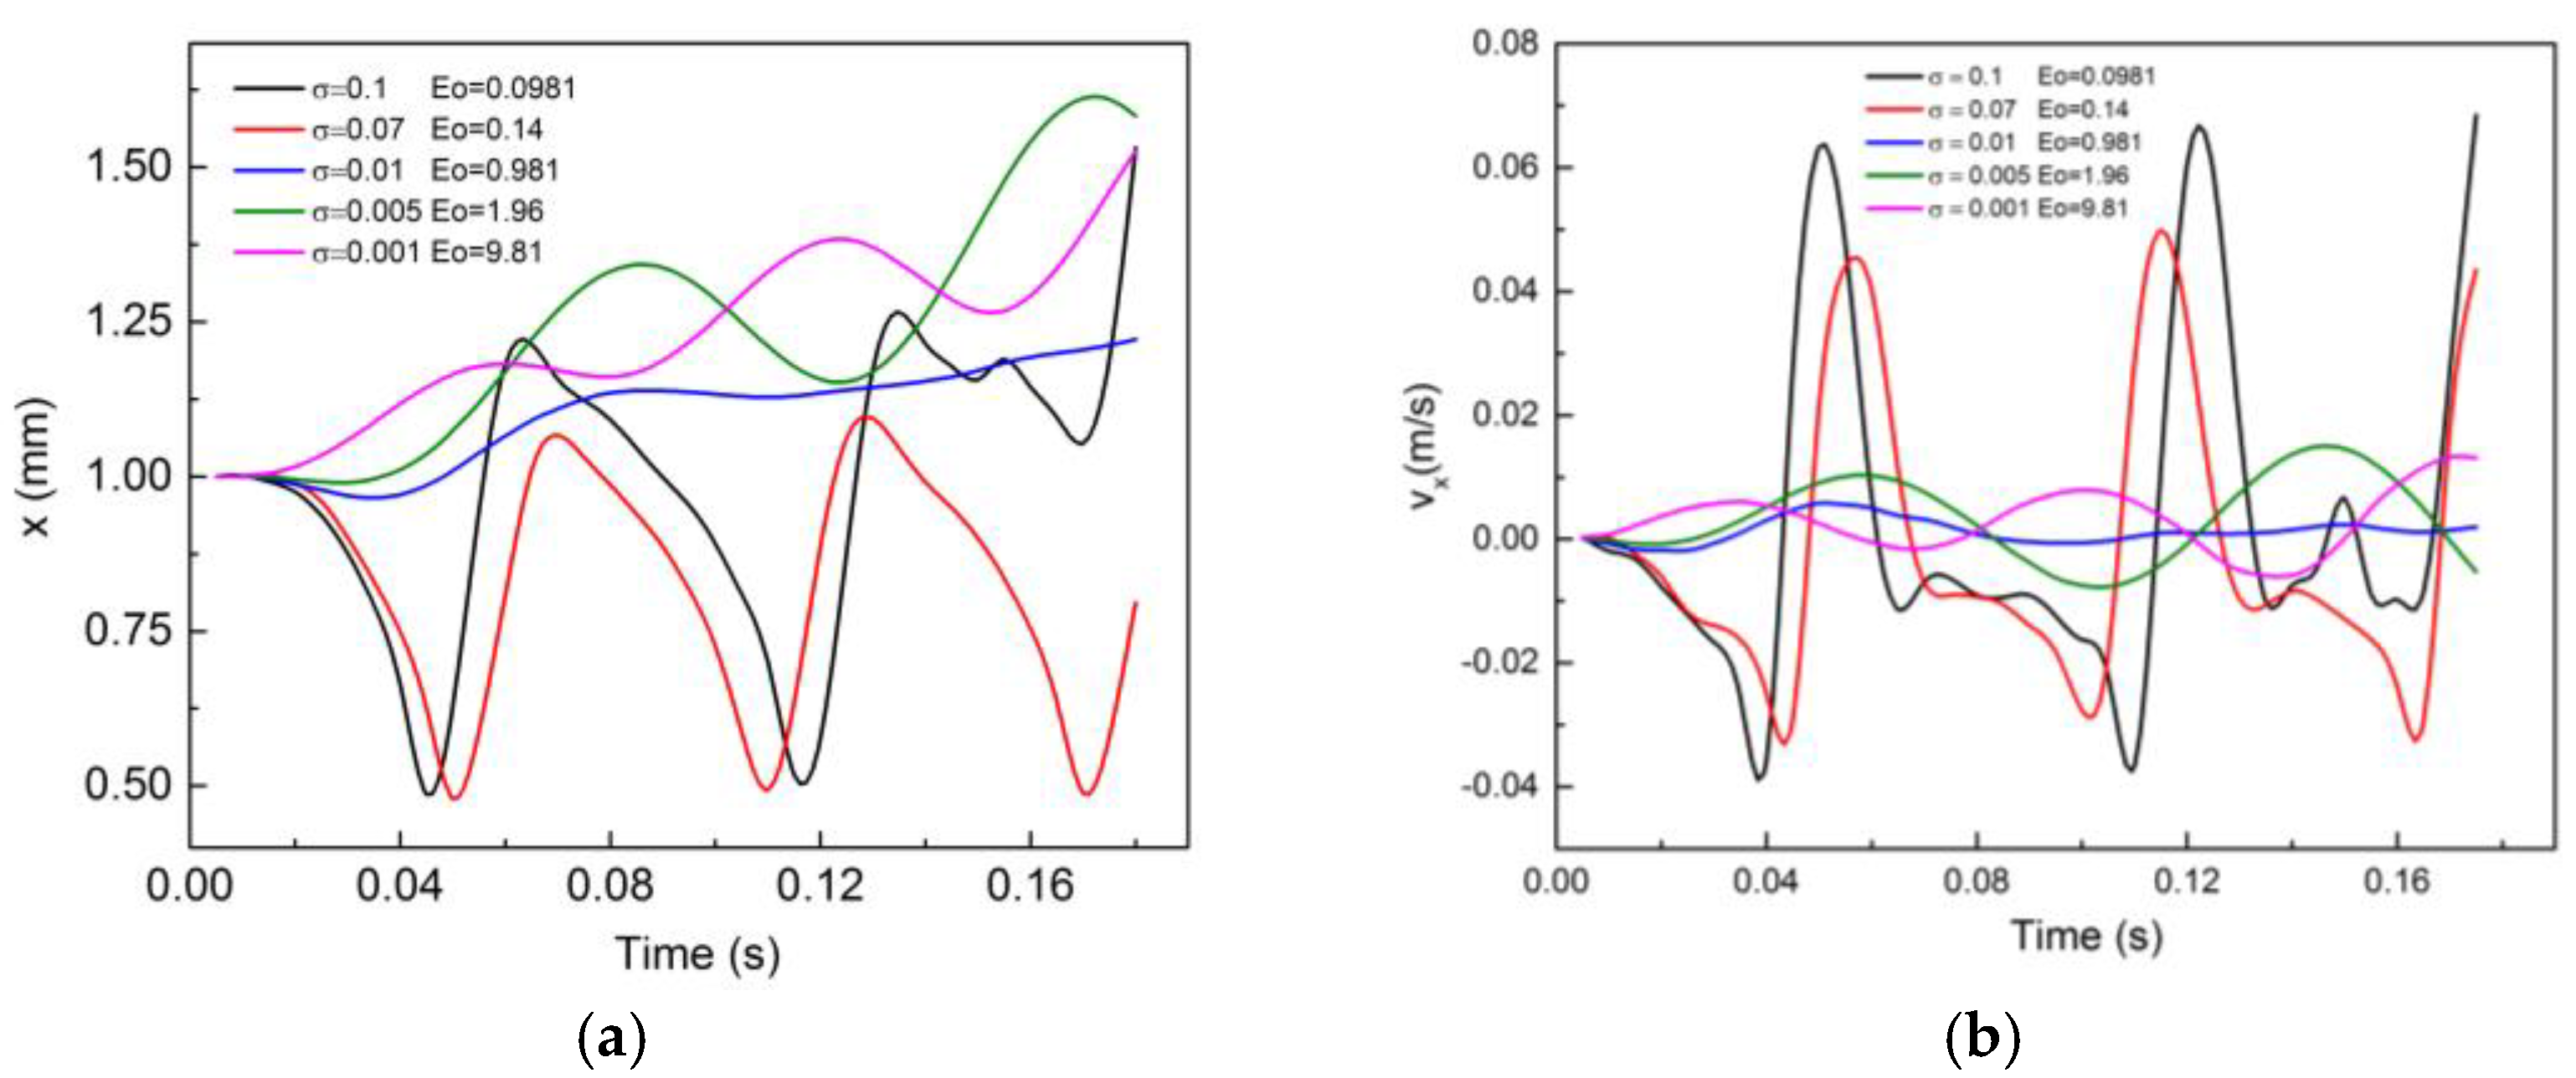
Figure 17 shows how the bubble rising trajectory changes at different values of surface tension. After
Eo = 1, the bubble shows a zigzagging trajectory while moving away from the wall.
The effect of surface tension on the wall-normal motion, rising motion and spanwise motion is shown in
Figure 18,
Figure 19,
Figure 20 and
Figure 21, respectively. It is evident from these figures that the wall effect on the bubble dynamics is dependent on the surface tension value. A detailed discussion of these results is performed in the following section.
From
Table 7, we can see that for the values of surface tension for which the bubble shows a bouncing trajectory (
Figure 18a), as the Eotvos number increases, the amplitude, time period and wavelength of the bouncing motion decreases.
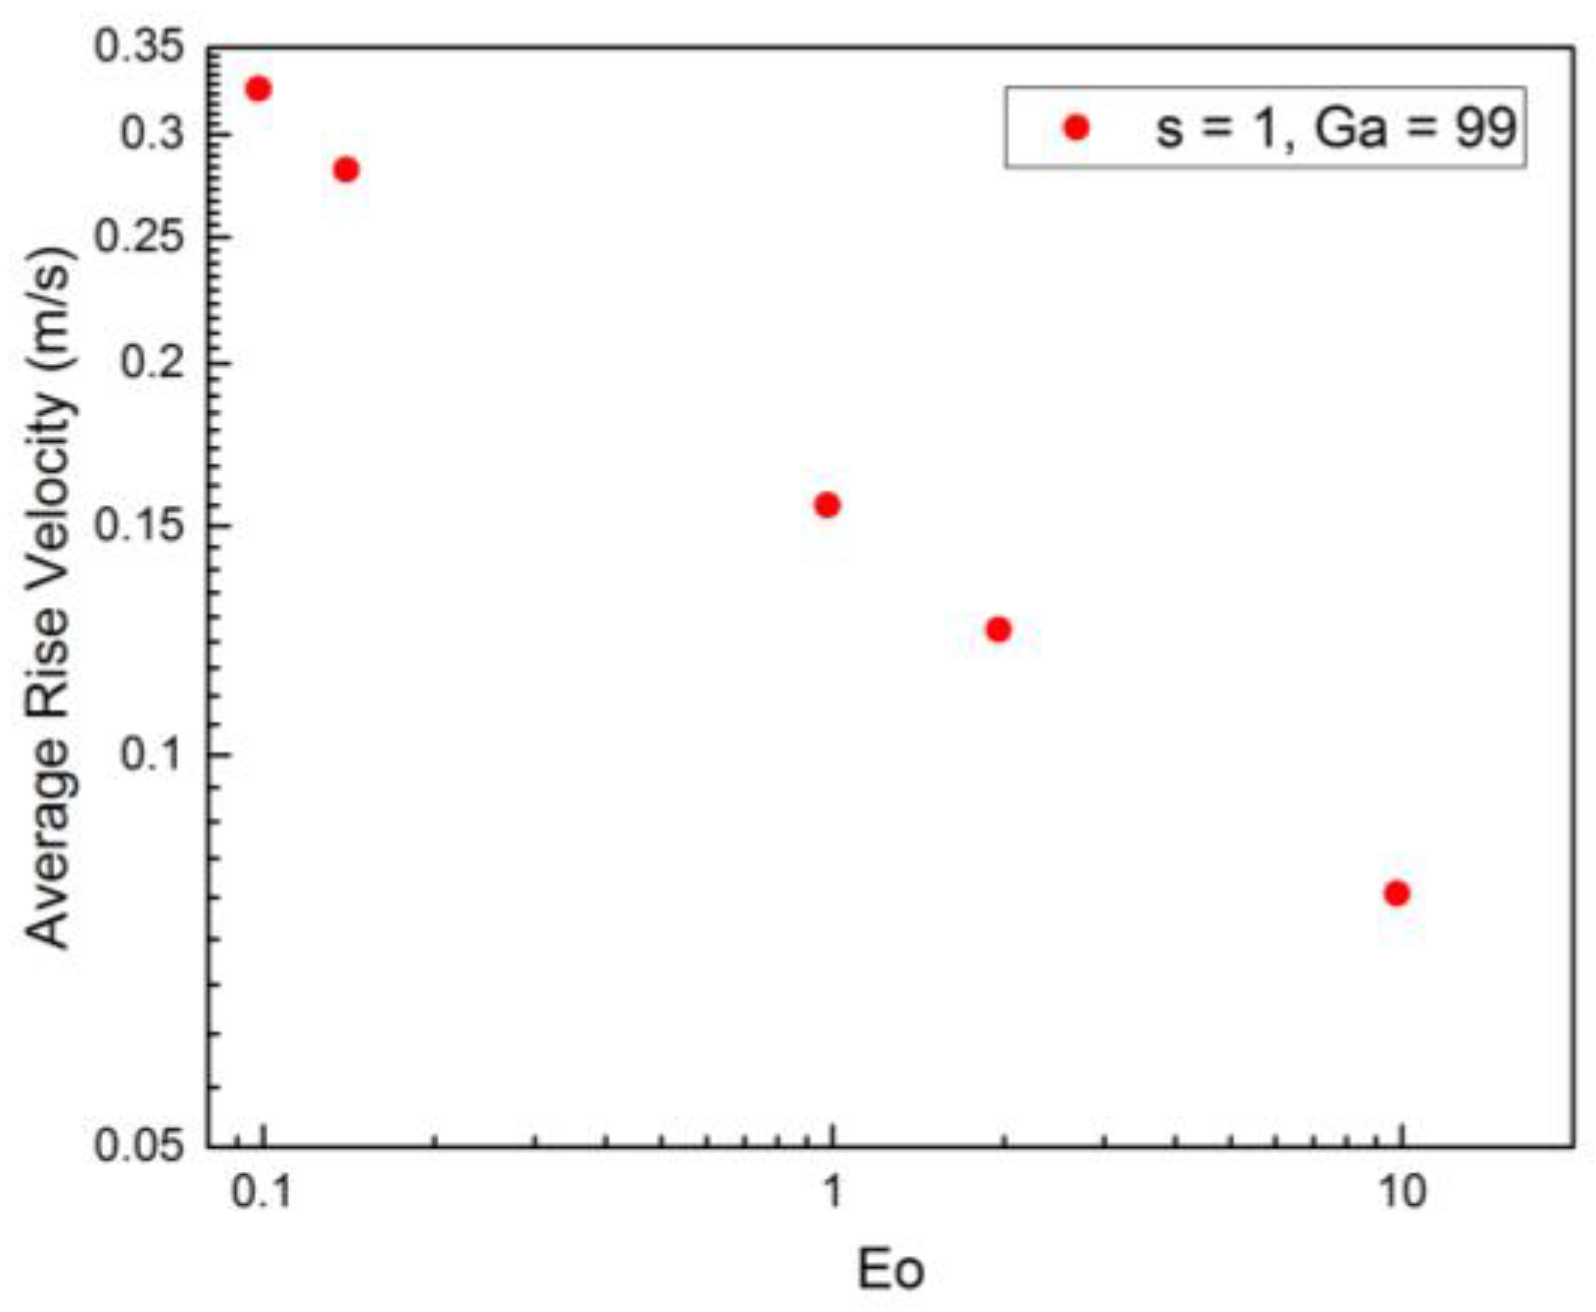
Figure 20 given below shows the variation of the average rise velocity of the bubble with the Eotvos number plotted on the log scale. It is evident from the plot that with increasing
Eo, the rise velocity decreases. This implies that the decrease in surface tension indirectly increases the drag force.
From the above figure, we can observe that at lower surface tension values the bubble assumes a flat shape.
Figure 22a,b shows the deformation in the bubble shape at the time of bouncing.
4. Discussion
According to phase diagram of Cano-Lozano et al. [
13], a rising bubble with
Ga = 99 and
Eo = 0.14 lies in the rectilinear regime. From
Figure 4b, it is seen that the trajectory of the bubble far from the wall is straight rising. The wall proximity induces an early transition from the rectilinear to the planar zigzagging regime as shown in
Figure 4a. This zigzagging motion on the wall is referred to as bouncing motion in the literature [
21,
25] as the bubble keeps on colliding with the wall, and thus, seems to bounce off the wall repeatedly.
From
Figure 5, we can observe that the amplitude of this bouncing motion is constant. The bubble collides with the wall at t
1, t
2 and t
3. The time between two collisions is highlighted in the figure and is almost constant, i.e., the bouncing frequency is constant. The rising motion of the bounded and unbounded bubbles have the same nature (
Figure 6).
Figure 6 shows the vertical distance traveled by the wall-bounded bubble between two collisions (t
1, t
2) and (t
2, t
3) and it is almost constant. Thus, the bouncing motion is very uniform with constant amplitude, frequency and rise distance in every bouncing cycle.
On analyzing the
x-component of the bubble velocity (
Figure 5b), it is seen that the
x- motion of the unbounded bubble has an initial transition state in which the
x-velocity oscillates about the mean value of zero. After reaching the steady state, the
x-motion ceases, i.e.,
x-velocity becomes zero. For the bounded bubble, the
x-velocity shows a fluctuating trend. As expected, the velocity starts to rise at the time of the bubble–wall collision. From
Figure 6a, it is evident that due to the presence of the wall, the drag force increases, and thus, the average rise velocity of the bounded bubble is lesser than that for the unbounded case.
As expected, the unbounded bubble reaches a terminal state with v
y = 0.34 m/s. However, the y-motion of the bounded bubble cannot achieve a steady state terminal velocity. After the buoyancy and drag forces are balanced, the bubble reaches a maximum v
y = 0.32 m/s. From
Figure 5b and
Figure 6b, we can observe that at the time of the collision, the
x-velocity starts increasing, and consequently, the y-velocity drops from its maximum value. As the bubble completes its bouncing cycle, the x-velocity decreases and the y-velocity starts rising and it again reaches its maximum value and stays there for some time after which the bubble is again attracted to the wall and the rising velocity drops again.
The spanwise motion (
Figure 7a,b) is very negligible compared to those in the wall-normal and wall-parallel directions. However, compared to the unbounded bubble, there is some randomized motion in the spanwise direction for the bubble rising near the wall.
4.1. Effect of Wall Proximity
From
Figure 12,
Figure 13,
Figure 14 and
Figure 15, it is evident that as
s increases, the effect of the wall on the bubble decreases. For
s = 0.75 and 1, the frequency and amplitude of bouncing are almost equal and constant (
Table 5). However, there is a phase lag between them. For
s = 0.75, the bubble is attracted towards the wall quite early as expected. As the distance from the wall increases, it takes more time for the bubble to be attracted towards the wall. For
s = 1.2, initially, the bubble rises straight upwards with negligible motion in the wall-normal direction. After
t = 0.15, the bubble is attracted to the wall, and then after colliding with the wall, it shows a bouncing trajectory with almost the same amplitude and frequency as the previous cases. For
s = 1.5, the bubble experiences negligible attraction towards the wall and its x-position decreases very slowly with time. At this distance, we can say that there is no effect of the wall, and hence, there is no bouncing motion. The wall-normal velocity shows a sinusoidal variation of constant amplitude and frequency, as expected for the bouncing motion. For
s = 1.2 and 1.5, the velocity shows small variations about zero, this is quite obvious as the bubble has no considerable motion in the x-direction.
The
y-position of the bubble increases monotonically with an almost constant slope for all
s. The slope of the line increases as
s increases as observed in
Figure 14a. As we can see from
Figure 14b, the maximum y-velocity reached by the bubble increases as
s increases. As the distance from the wall (
s) increases, the drag force decreases, and thus, the average rise velocity increases. As explained in the previous section, the
y-velocity magnitude shows a fluctuating pattern due to the bouncing motion. With increasing
s, the bouncing motion dies out and so do the fluctuations in the
y-velocity. As
s increases, the maximum y-velocity achieved by the bubble increases. This is expected because, with increasing distance from the wall, the effect of the wall decreases, and thus, the effect of the wall on the rising velocity decreases. For
s = 1.5, there are no fluctuations, and the rising velocity reaches a terminal state with v
y ≈ 1. This implies that the terminal velocity is slightly lesser compared to the terminal velocity of the free-rising bubble. At
s = 1.5, the wall effect is not strong enough to bring an effect in the wall-normal direction and induce a bouncing motion but it increases the drag, thus decreasing the
y-velocity of the bubble.
4.2. Effect of Eotvos Number
Let us now analyze the effect of the variation of
Eo on the bubble behavior. As the surface tension decreases and the
Eo increases, the drag experienced by the bubble increases. This can be deduced from
Figure 19. The
y-position and the maximum rising velocity achieved decrease with increasing
Eo number. This increase in drag can be attributed to the flattening of the bubble surface with decreasing surface tension.
At
Ga = 99, the transition from rectilinear rising regime to planar zigzagging regime occurs at
Eo ⪆ 1.5 [
13]. In the presence of the wall, the bubble shows zigzagging motion (18a) for the entire range of
Eo considered in this study, i.e., from
Eo = 0.098–9.8, except for
Eo = 1. It is observed that for
Eo < 1, the bubble bounces on the wall. Meanwhile, for
Eo > 1, the bubble slowly moves away from the wall following a zigzagging trajectory. At
Eo = 1, after an initial transition state, the bubble gradually slides away from the wall. Thus, at
Ga = 99,
Eo = 1 represents the critical value of
Eo for which the wall force transitions from attractive to repulsive, thus changing the bubble motion from bouncing to sliding away.
For
Eo < 1, with increasing surface tension and decreasing
Eo, both the amplitude and the frequency of the bouncing motion increase (
Figure 18a). The maximum wall-normal velocity achieved after the bubble–wall collision is also higher for lower
Eo (
Figure 18b). With regards to the motion in the spanwise direction, for the bouncing regime (
Eo < 1) the oscillations of velocity in the
z-direction increase with decreasing
Eo, whereas for the sliding away regime (
Eo > 1), the
z-velocity magnitude is highest for the highest
Eo. However, no particular trend can be fitted for the
z-motion for any value of
Eo and the order of magnitude of the velocity and displacement is negligible compared to those in the other two spatial directions.
