Article

Does Methane Contribute to Growth of Invertebrate Communities in Drinking Water?

by
Sarah C. B. Christensen
*,
Laure Lopato
,
Sonsoles Quinzanos
and
Mathilde J. Hedegaard
HOFOR A/S, 2300 Copenhagen, Denmark
*
Author to whom correspondence should be addressed.
Water 2023, 15(6), 1044; https://doi.org/10.3390/w15061044
Submission received: 11 February 2023 / Revised: 6 March 2023 / Accepted: 7 March 2023 / Published: 9 March 2023
(This article belongs to the Special Issue Evaluation of Invertebrates in Drinking Water Networks)

Abstract

:
Methane is a potential source of carbon in drinking water. Typically, it is removed at waterworks during an initial treatment step such as aeration or stripping. Remaining methane may be converted by methane-oxidizing bacteria to organic carbon, which is then available for heterotrophic growth and may ultimately contribute to invertebrate growth. We investigated the presence of invertebrates at a waterworks with incomplete methane removal and at a waterworks without methane. Microscopy and analyses of 16S and 18S ribosomal genes were conducted on filter sand from full-scale biological rapid sand filters. Primary filters with methane were dominated by methane- and ammonia-oxidizing bacteria. Upper layers of secondary filters were dominated by heterotrophic bacteria, while the deepest layer contained 92% eukaryote DNA. Rotifers, nematodes, platyhelminths and annelids constituted 22% of the DNA in the secondary filters. Filters with methane contained higher shares of invertebrates (13%) than the filter without methane (7%). Furthermore, pilot studies were conducted to estimate suitable levels of methane when implementing methane removal technologies. Methane concentrations of 0.24 mg/L caused rapid visible growth. Vacuum stripping and nitrogen addition removed methane to 0.018–0.03 mg/L and prevented growth of methane-oxidizing bacteria.

1. Introduction

Drinking water systems are low-nutrient environments with the presence of naturally occurring organisms [1,2]. Many of these organisms are crucial to maintain good drinking water quality in waterworks as well as in distribution systems. Danish drinking water is based on groundwater, which typically undergoes only aeration and biological rapid sand filtration before being distributed without a disinfection step [3]. Biological processes in rapid sand filters are crucial to remove substances such as ammonia and nitrite [4] and can also contribute to the removal of iron [5] and degradation of pesticides [3]. Furthermore, stable biofilm in pipes of non-chlorinated systems has been found to improve the water quality [6]. However, maintaining a stable system requires control of the nutrients in the system to obtain biostable water [1,7,8] and prevent excessive growth. Biostable water has been defined as water containing assimilable carbon (AOC) below 10 µg/L in non-chlorinated water [9]. Drinking water with high levels of available carbon may cause challenges such as high levels of heterotrophic bacteria, protists and invertebrates [10,11], triggering problems such as clogging of systems, high levels of visible invertebrates and bad odour and taste due to, e.g., low oxygen levels. Overall, this impedes the quality and aesthetics of the drinking water and causes consumer complaints [11,12,13]. Furthermore, some species within the group of coliform bacteria such as Serratia fonticola grow at low temperatures (confirmed from 4–10 °C) in water with high concentrations of available carbon [14,15].
The parametric value in the Danish drinking water regulation [16] of non-volatile organic carbon (NVOC) is 4 mg/L. AOC measurements are only rarely performed but available data [17] report levels below 10 µg/L in six investigated waterworks and concentrations of 20–40 µg/L in the remaining four investigated waterworks in Zealand, Denmark. Despite the generally high level of biological stability in Danish drinking water, cases of excessive invertebrate growth at waterworks and especially occurrence of worms up to 10 cm have been reported several times [18]. Common factors of the affected utilities were the presence of methane in the groundwater resource. However, investigations of the relationship between groundwater containing methane, different methane removal strategies and biological growth in drinking water lack.
Methane concentrations in the groundwater of 14 waterworks in Denmark have previously been reported to be up to 20.6 mg/L [19]. The aim of this study was to investigate whether relatively low methane concentrations of 0.25 mg/L on average in groundwater contributed to unwanted biological growth at an existing waterworks. Analyses at a waterworks without methane, which has previously been classified as having climax sand filters with top predators present [20], was performed and included as a reference. Furthermore, pilot studies with various degrees of methane removal were conducted to determine methane influence on bacterial growth in drinking water.
The studies confirmed that the reference waterworks contained annelids, which are top predators in sand filters. Furthermore, the study showed that the waterworks with methane in the groundwater maintained even higher shares of invertebrates (13%) than the reference waterworks (7%). Investigations of methane removal showed that concentrations of only 0.24 mg methane/L may cause rapid bacterial growth, whereas concentrations of 0.018–0.03 mg/L did not contribute to visible growth nor the presence of genetic material from methane-oxidizing bacteria.

2. Materials and Methods

2.1. Full-Scale Waterworks

Two of the thirteen waterworks in HOFOR, Greater Copenhagen Utility, were investigated. One was chosen for having the highest concentration of methane in the groundwater and the other for being an old waterworks without methane, previously classified as a climax sand filter [20]. Slangerup waterworks treats approximately 7.3 mill. m3 groundwater/year, which is abstracted from four well fields. Three of the well fields contain minor concentrations of methane ≤0.5 mg/L, whereas one contains up to maximum 9 mg/L with an average of 3.5 mg/L. The water from this well field is stripped in vacuum stripping columns to reach a methane concentration of 0.5 mg/L before it is treated at the waterworks. The mixed groundwater with an average methane concentration of 0.25 mg/L is aerated in closed aeration cassettes and is subsequently treated in primary (empty bed contact time, EBCT: 22 min) and secondary rapid sand filters (EBCT: 25 min) after which it is stored in a clean water tank until distribution to consumers. Slangerup waterworks was renovated in 2007 and thus the age of the filter sand was 12 years at the point of sampling.
Hvidovre waterworks, the reference waterworks, treats approximately 0.2 mill. m3 groundwater per year. The methane concentration in the groundwater is generally < 0.005 mg/L with few samples during the previous 10 years containing maximum 0.013 mg methane/L before aeration. The water is aerated by a stair aerator and is subsequently filtered by a single rapid biological filtration step (EBCT: 72 min). The exact age of the filter is unknown but is > 40 years. Subsequently, the water is treated by GAC filtration and UV disinfection before the water is stored in a clean water tank and distributed to consumers.
Chlorine is not applied at any of the waterworks neither during treatment nor distribution.
Water and filter sand samples were collected from Hvidovre waterworks during 29–30 October 2019 and Slangerup waterworks on 10 December 2019.

2.1.1. Filter Sand Sampling

Immediately before sampling, all equipment was washed in Pripan soap, disinfected with 1% hypochlorite and rinsed with water. Due to renovation, the primary filters at Slangerup waterworks were taken out of operation seven days before sampling, whereas other investigated filters were taken out of operation immediately before sampling. All filters were filled with water at all times.
Core samples (0 to 40 cm depth) of the filter sand were collected from three randomly distributed spots in the investigated sand filters by using an acrylic tube (length: 50 cm; inner diameter: 26 mm). The core samples were subdivided into four 10 cm fractions (0–10 cm; 10–20 cm; 20–30 cm and 30–40 cm) and fractions from the three sampling points were transferred to disinfected plastic buckets in which they were mixed into a composite sample. For Hvidovre waterworks it was only possible to gather filter sand from the top 20 cm due to densely packed sand in the deep layers.
The filter sand samples were covered with water from the top of the sand filters. They were transported to the laboratory in the plastic buckets, while kept at 4 °C. After arrival at the laboratory a subsample was immediately transferred to a 50 mL centrifuge tube and stored at −18 °C until it was sent for DNA extractions and analysis. Another fraction of the samples was used for light microscopy.

2.1.2. Water Sampling

At Slangerup waterworks, water samples were collected throughout the treatment steps: before aeration of the methane containing groundwater, from the reaction chamber after aeration, after primary filters and at the outlet of the waterworks. The water samples were collected after flushing the bottles with three volumes of water. Water samples were collected from taps except for the reaction chamber, where the water sample was collected by a bucket on an extendable shaft, through a lid in the chamber. Before use, the equipment was washed in Pripan soap, disinfected with 1% hypochlorite and rinsed with water. Samples were kept at 4 °C until analysis. As for the sand samples a subsample of the water from the reaction chamber was immediately transferred to a 50 mL centrifuge tube upon arrival at the laboratory and stored at −18 °C until it was sent for DNA extractions and analysis.
At Hvidovre waterworks, water samples were collected the day after sand sampling. Samples were collected at a sampling point before activated carbon filtration and at the outlet of the clean water tank. Microbiological samples were collected in single-use sterile bottles while samples for chemical analyses were collected in pre-cleaned glass bottles. Samples were kept at 4 °C until analysis.

2.2. Pilot Columns

Pilot studies were conducted with various degrees of methane removal at Slangerup waterworks to investigate the methane levels that would prevent unwanted growth in the system. One setup used drinking water from Slangerup waterworks with <0.01 mg methane/L. The remaining setups used anaerobic groundwater from two of the well fields from Slangerup waterworks with a methane concentration varying between 0.16 and 0.48 mg/L.

2.2.1. Columns without Methane Removal (Setup and Sampling)

A first set of pilot studies were conducted in a pellet softening reactor due to implementation of water softening at the waterworks. The reactor was made of transparent PE and had an inner diameter of 9.9 cm and a height of 6.7 m. The reactor was operated with a water flowrate of 0.6 m3/h, which corresponds to an upwards velocity of 76 m/h. Sodium hydroxide (NaOH) 27% was dosed at the bottom of the reactor. The NaOH dosage varied from 90 to 120 mg/L depending on the inlet water quality; the effluent pH was approximately 9. The reactor was filled until 1.5 m with quartz sand (0.35–0.5 mm diameter), which served as seeding material. Over time, calcium carbonate (CaCO3) precipitated onto the seeding material, forming pellets. Pellets were removed and more quartz sand was added at regular intervals to keep a stable fluid bed height in the reactor. From the top of the reactor a small part of the softened water flowed through a polytetrafluoroethylene (PTFE) hose (10 mm diameter) to a water control panel. The pilot plant was operated for four months from mid-March to mid-July 2019. The first three months was with anaerobic groundwater and the last month with drinking water.
A water sample from the top of the pellet reactor containing visible bacterial growth was collected two days after the onset of the pilot tests with anaerobic groundwater. A sample with visible bacterial growth from the PTFE hose was collected after three months of tests with anaerobic groundwater. All samples were stored at −18 °C until they were sent for DNA extractions and analysis.

2.2.2. Columns with Methane Removal (Setup and Sampling)

Another set of pilot studies were conducted in a vacuum stripping column from February to March 2022. Two experiments were carried out: one without nitrogen dosing and another with a nitrogen dosing of 0.8 g/h N2. Each experiment ran for one month.
The vacuum column was made of stainless steel and had an inner diameter of 26 cm, a height of 4 m and was filled with stainless steel packing material until 2 m. It was operated with an absolute vacuum of 35 mbar and a water flowrate of 0.6 m3/h, which corresponds to a downward velocity of 11 m/h. The pilot plant has the option to dose nitrogen gas at the bottom of the vacuum column to improve efficiency of the stripping process. After leaving the vacuum column the water was fully aerated with a small pump, and a small part of the aerated water flowed through a 6 m PTFE hose (10 mm diameter). The hose was changed after each experiment.
Water samples were collected at the inlet and outlet of the vacuum stripping column.

2.3. Microscopy

Core samples of filter sand were hand shaken with water collected in the core samples. Microscopy of the water was conducted with a Zeiss Axio Lab.A1 microscope mounted with an Axiocam 305 Color camera and Zen 2.5 software, Carl Zeiss Microscopy GmbH, Jena, Germany.

2.4. Analyses of Specific Water Quality Parameters

The samples were analysed for methane, nitrate, total nitrogen, total phosphorous, orthophosphate, sulphate, sulphide and NVOC at Eurofins accredited laboratory, as well as for standard water quality parameters (temperature, pH, conductivity, oxygen, hardness, calcium, magnesium, potassium, sodium, iron, manganese, ammonium, nitrite, alkalinity, hydrogen carbonate, carbon dioxide and nickel) at the accredited laboratory at HOFOR, Greater Copenhagen Utility. Water quality data are presented in Figure S4 and Tables S1 and S2. Assimilable organic carbon (AOC) was analysed at the Danish research and technology Institute DHI Water Environment Health. The applied method was The AOC manual by van der Kooij and Veenendall, Kiwa [21] modified as DHI internal method M 19.1, SOP 818.
Samples of biofilm mixed with loose deposits in the PTFE hoses were collected at the end of each experiment after a month of operation. PTFE hoses were removed and stored at −18 °C until analysis.

2.5. Molecular Analyses

DNA extraction and analysis as well as data analysis were performed at Statens Serum Institut, Copenhagen, Denmark. DNA was extracted by a modified version of the previously described methods [22]. For filter sand 500 µL wet filter sand material and 1.4 mm Zirconium beads were used. For eukaryote analysis, the 18S ribosomal RNA gene was targeted with three different primer sets. The G3-1 and G6-1 primers target the hyper variable regions V3–V4 of the 18S rRNA gene, while the G4-3 primers target V3–V5. For prokaryotes the 16S rRNA gene was targeted using a modified version of the published universal prokaryotic primers 341F/806R, amplifying the V3–V4 hyper variable region [23]. DNA was amplified using a 2-step nested PCR and amplicons were sequenced on a desktop sequencer (MiSeq; Illumina, Inc., San Diego, CA, USA). Sequence data are available at the European Nucleotide Archive (Table S3). Sequences were mapped using BION software previously described by Ring et al. [24]. Query sequences were compared against amplicon extracts from Silva, version 123, with improved taxonomy for eukaryotes [24]. For 16S sequences the RDP database was applied. Results are semiquantitative and used to estimate relative fractions of organisms in each sample. A cut off value of 500 gene copies was applied.

3. Results

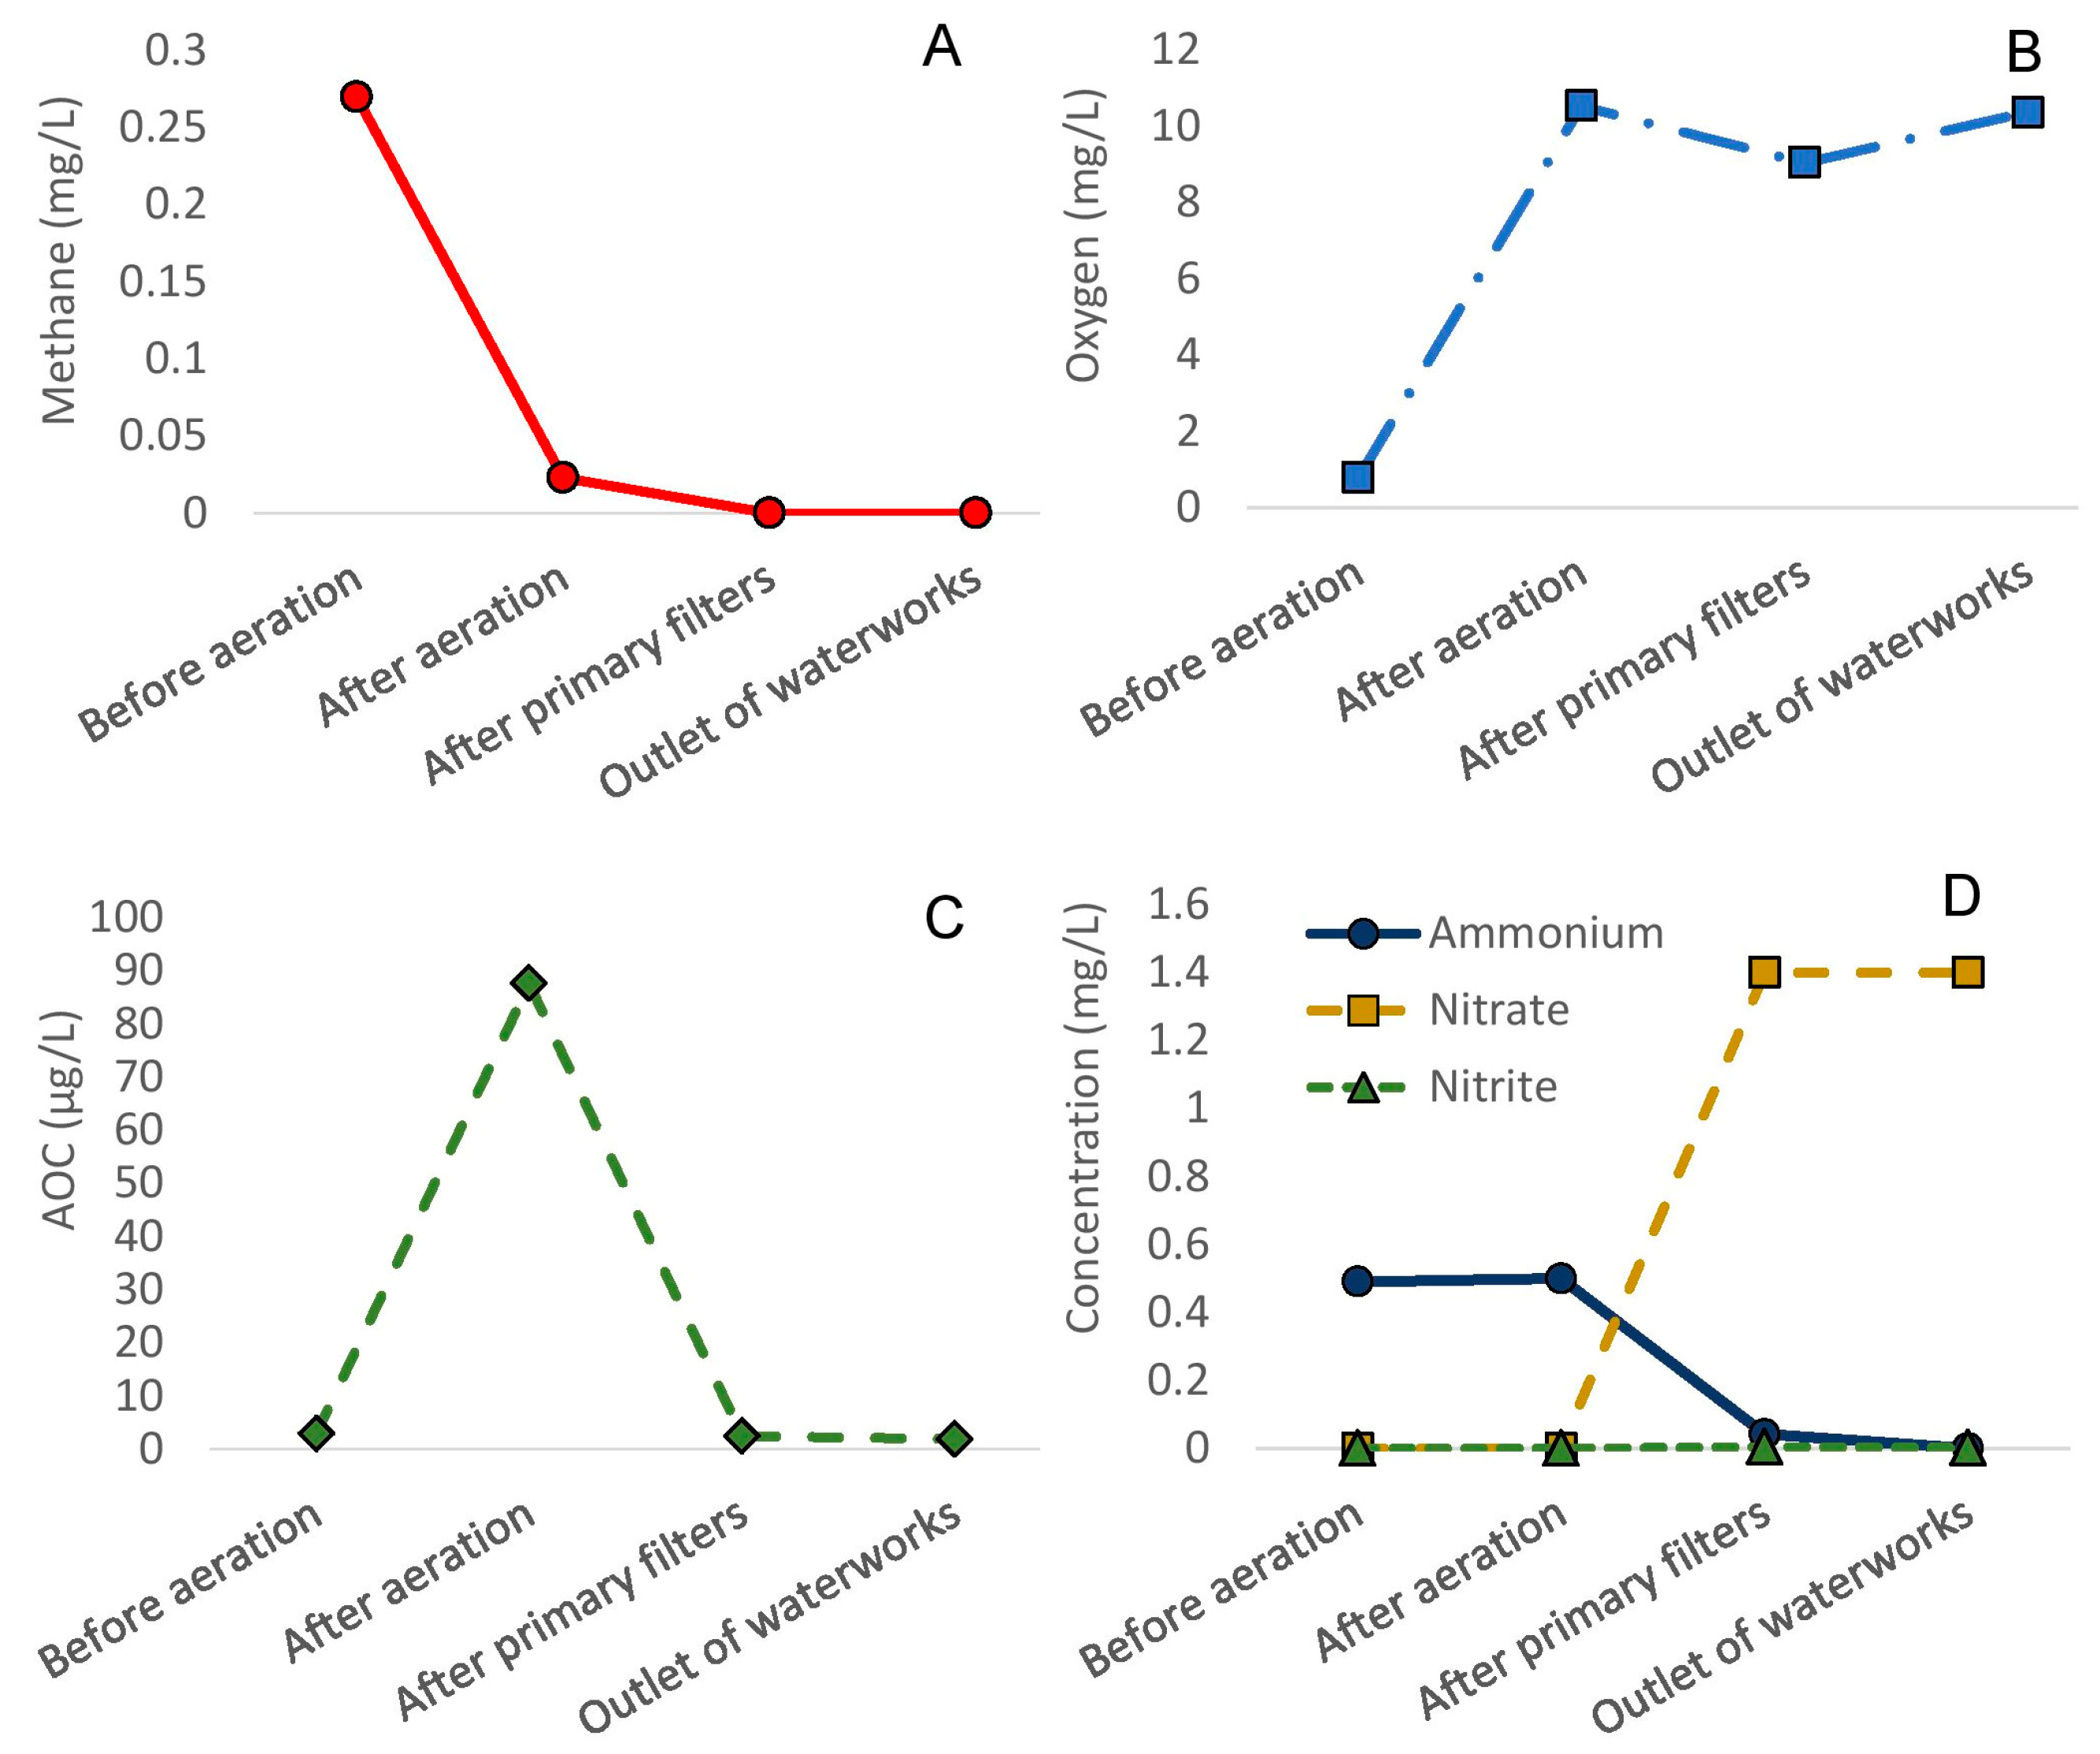
3.1. Efficiency of Full-Scale Water Treatment

To investigate whether Slangerup waterworks removed all unwanted substances as expected, water samples were collected throughout the treatment processes. Unexpectedly, all monitored parameters fulfilled Danish drinking water criteria [16] already after prefiltration. The inlet to the secondary filters contained low levels of methane (0.023 mg/L) and ammonia (0.042 mg/L) (Figure 1), and accordingly, the secondary filter only contained a low fraction of ammonia- and methane-oxidizing bacteria (8 and 5%, respectively) (Figure 2). AOC concentrations were below 3 µg/L at all treatment steps except from the reaction chamber with an AOC concentration of 88 µg/L (Figure 1).
At Hvidovre waterworks, water quality fulfilled the requirements of the investigated parameters after aeration and sand filtration at the time of sampling. In general, methane concentrations before aeration ranged between 0.010–0.013 mg/L, and methane was removed to below detection (0.01 mg/L) during aeration. Ammonia concentrations in the groundwater were 0.5 mg/litre and after sand filtration below detection (<0.005 mg/L), as was nitrite (<0.001 mg/L) at the time of sampling.

3.2. Organisms in Rapid Sand Filters

3.2.1. Microscopy

Water from stirred sand samples from four depth profiles (0–10 cm, 10–20 cm, 20–30 cm and 30–40 cm) were examined by light microscopy. All samples contained inorganic particles and bacteria. Few samples contained protists and few multicellular eukaryotes (fungi and micro invertebrates) (Figure S1). Some structures resembled faecal pellets from invertebrates and remains from diatoms. Samples from primary filters contained higher concentrations of particles than samples from secondary filters (Figures S2 and S3), which is in accordance with iron precipitation occurring mainly in the primary filters. Generally, only few invertebrates were detected in filter sand samples.

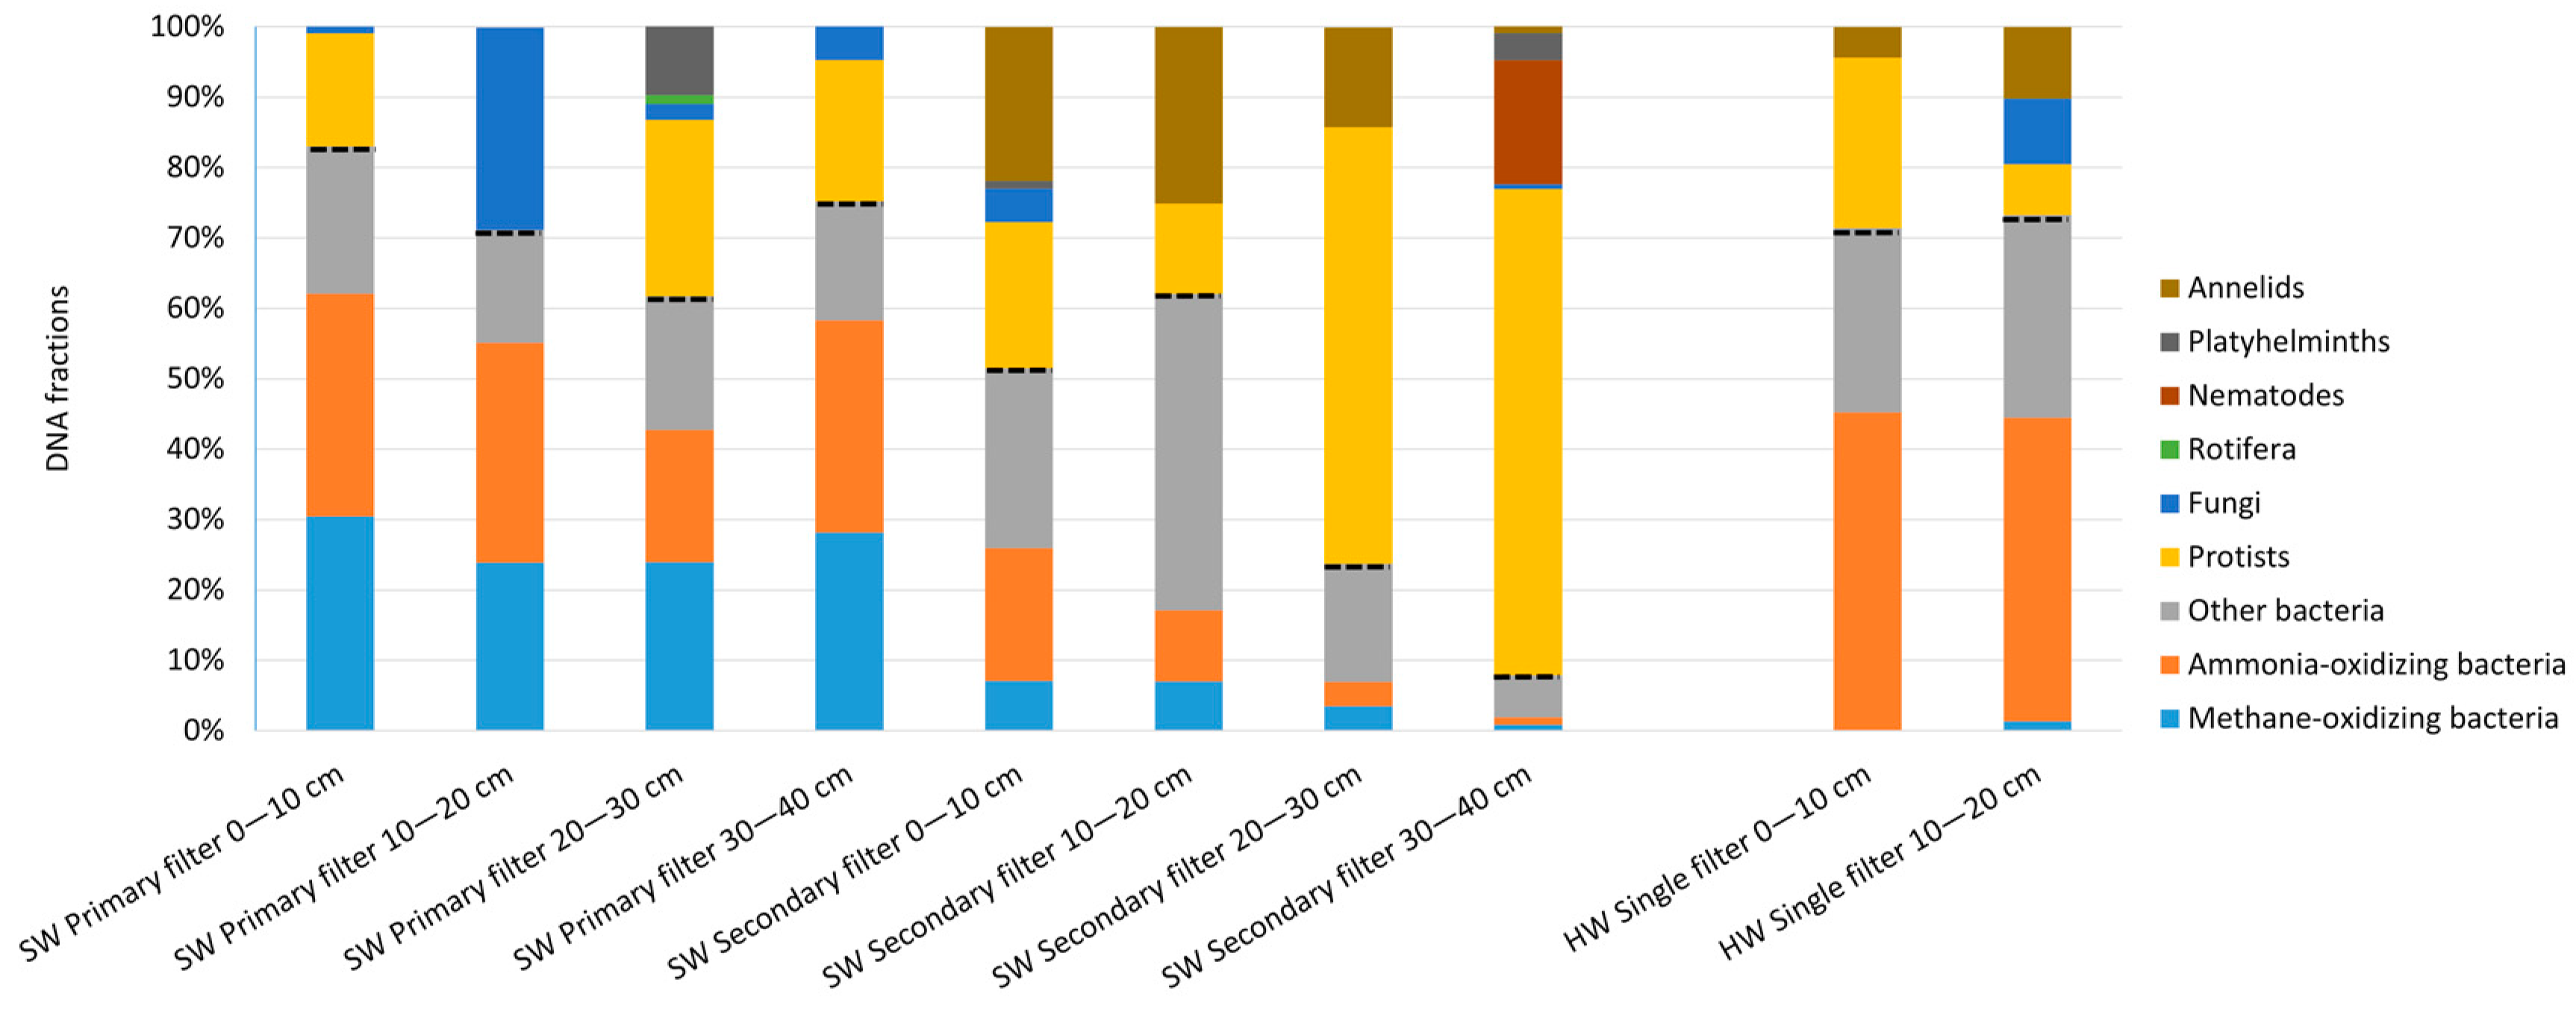
3.2.2. Molecular Analyses

Primary filters at Slangerup waterworks were dominated by bacteria (Figure 2).
Figure 2. Fractions of DNA from organisms in filter sand samples from Slangerup waterworks (SW) and Hvidovre waterworks (HW). Samples were collected at different depths, starting with 0 cm at the top of the sand. Dashed lines separate prokaryotes from eukaryotes.
Water 15 01044 g002
The dominating bacteria were ammonia-oxidizing bacteria (28% of total DNA in the primary filters) and methane-oxidizing bacteria (27%). In the secondary filters these bacteria constituted a smaller fraction (8% ammonia-oxidizing and 5% methane-oxidizing bacteria), whereas the share of other bacteria increased from 18 to 23%. The top layers of the secondary filters (0–10 cm and 10–20 cm) contained up to 39% “other bacteria”, mainly heterotrophic bacteria and a higher share of eukaryotes than the prefilters. In the deepest layer of the secondary filter (30–40 cm), 92% of the DNA was eukaryotic. Invertebrates were most abundant in secondary filters, where they constituted an average 22% of the DNA throughout the filter. In the primary filters, only 3% was invertebrate DNA, resulting in an average of 13% of the DNA in the filter samples’ origination from invertebrates.
Rotifers and platyhelminths were present in the primary filters, whereas nematodes, platyhelminths and annelids were present the secondary filters. In total, 28% of the DNA in the primary filters was eukaryotic and 64% in the secondary filters was eukaryotic.
In the water sample collected at the surface of the reaction chamber after aeration at Slangerup waterworks, 36% was bacteria DNA, mainly sulphur oxidizing, methane oxidizing and iron oxidizing. Eukaryote DNA dominated with 44% protists and 20% gastrotrichs (Chaetonotus spp.) (data not shown, accession number in Table S3).
At the reference waterworks without methane, ammonia-oxidizing bacteria dominated the filter, followed by heterotrophic bacteria, protists and invertebrates. In total, 27% of the DNA was eukaryotic, 7% from invertebrates, which was all identified as annelid DNA (Figure 2).
Fungi were present in all investigated filters, accounting for 2–9% of the DNA (Figure 2).

3.3. Estimation of Suitable Methane Levels

Pilot studies were conducted to investigate the degree of methane removal that would prevent unwanted growth in the system. The stripping columns reduced methane from an average of 0.36 to 0.03 mg/L without nitrogen dosing (93% removal) and to 0.018 mg/L when dosing nitrogen (95% removal).

3.3.1. Inspection of Visible Growth

No visible growth occurred in the studies with aerobic drinking water with methane concentrations <0.01 mg/L. On the contrary, clogging of hoses (Figure 3B) and visible clumps (Figure 3A) occurred already after two days in studies with anaerobic groundwater with average methane concentrations of 0.24 mg/L. The bacterial growth took place in the top of the reactor (Figure 3A), where a low degree of oxygenation occurred. A thick layer of biofilm quickly settled at the top of the reactor and in the hoses after the reactor (Figure 3B).
No visible growth occurred in the pilot studies with vacuum stripping with average methane concentrations of 0.03 and 0.018 mg/L. However, precipitation of iron occurred in the hoses installed after the aeration step (Figure 3C).

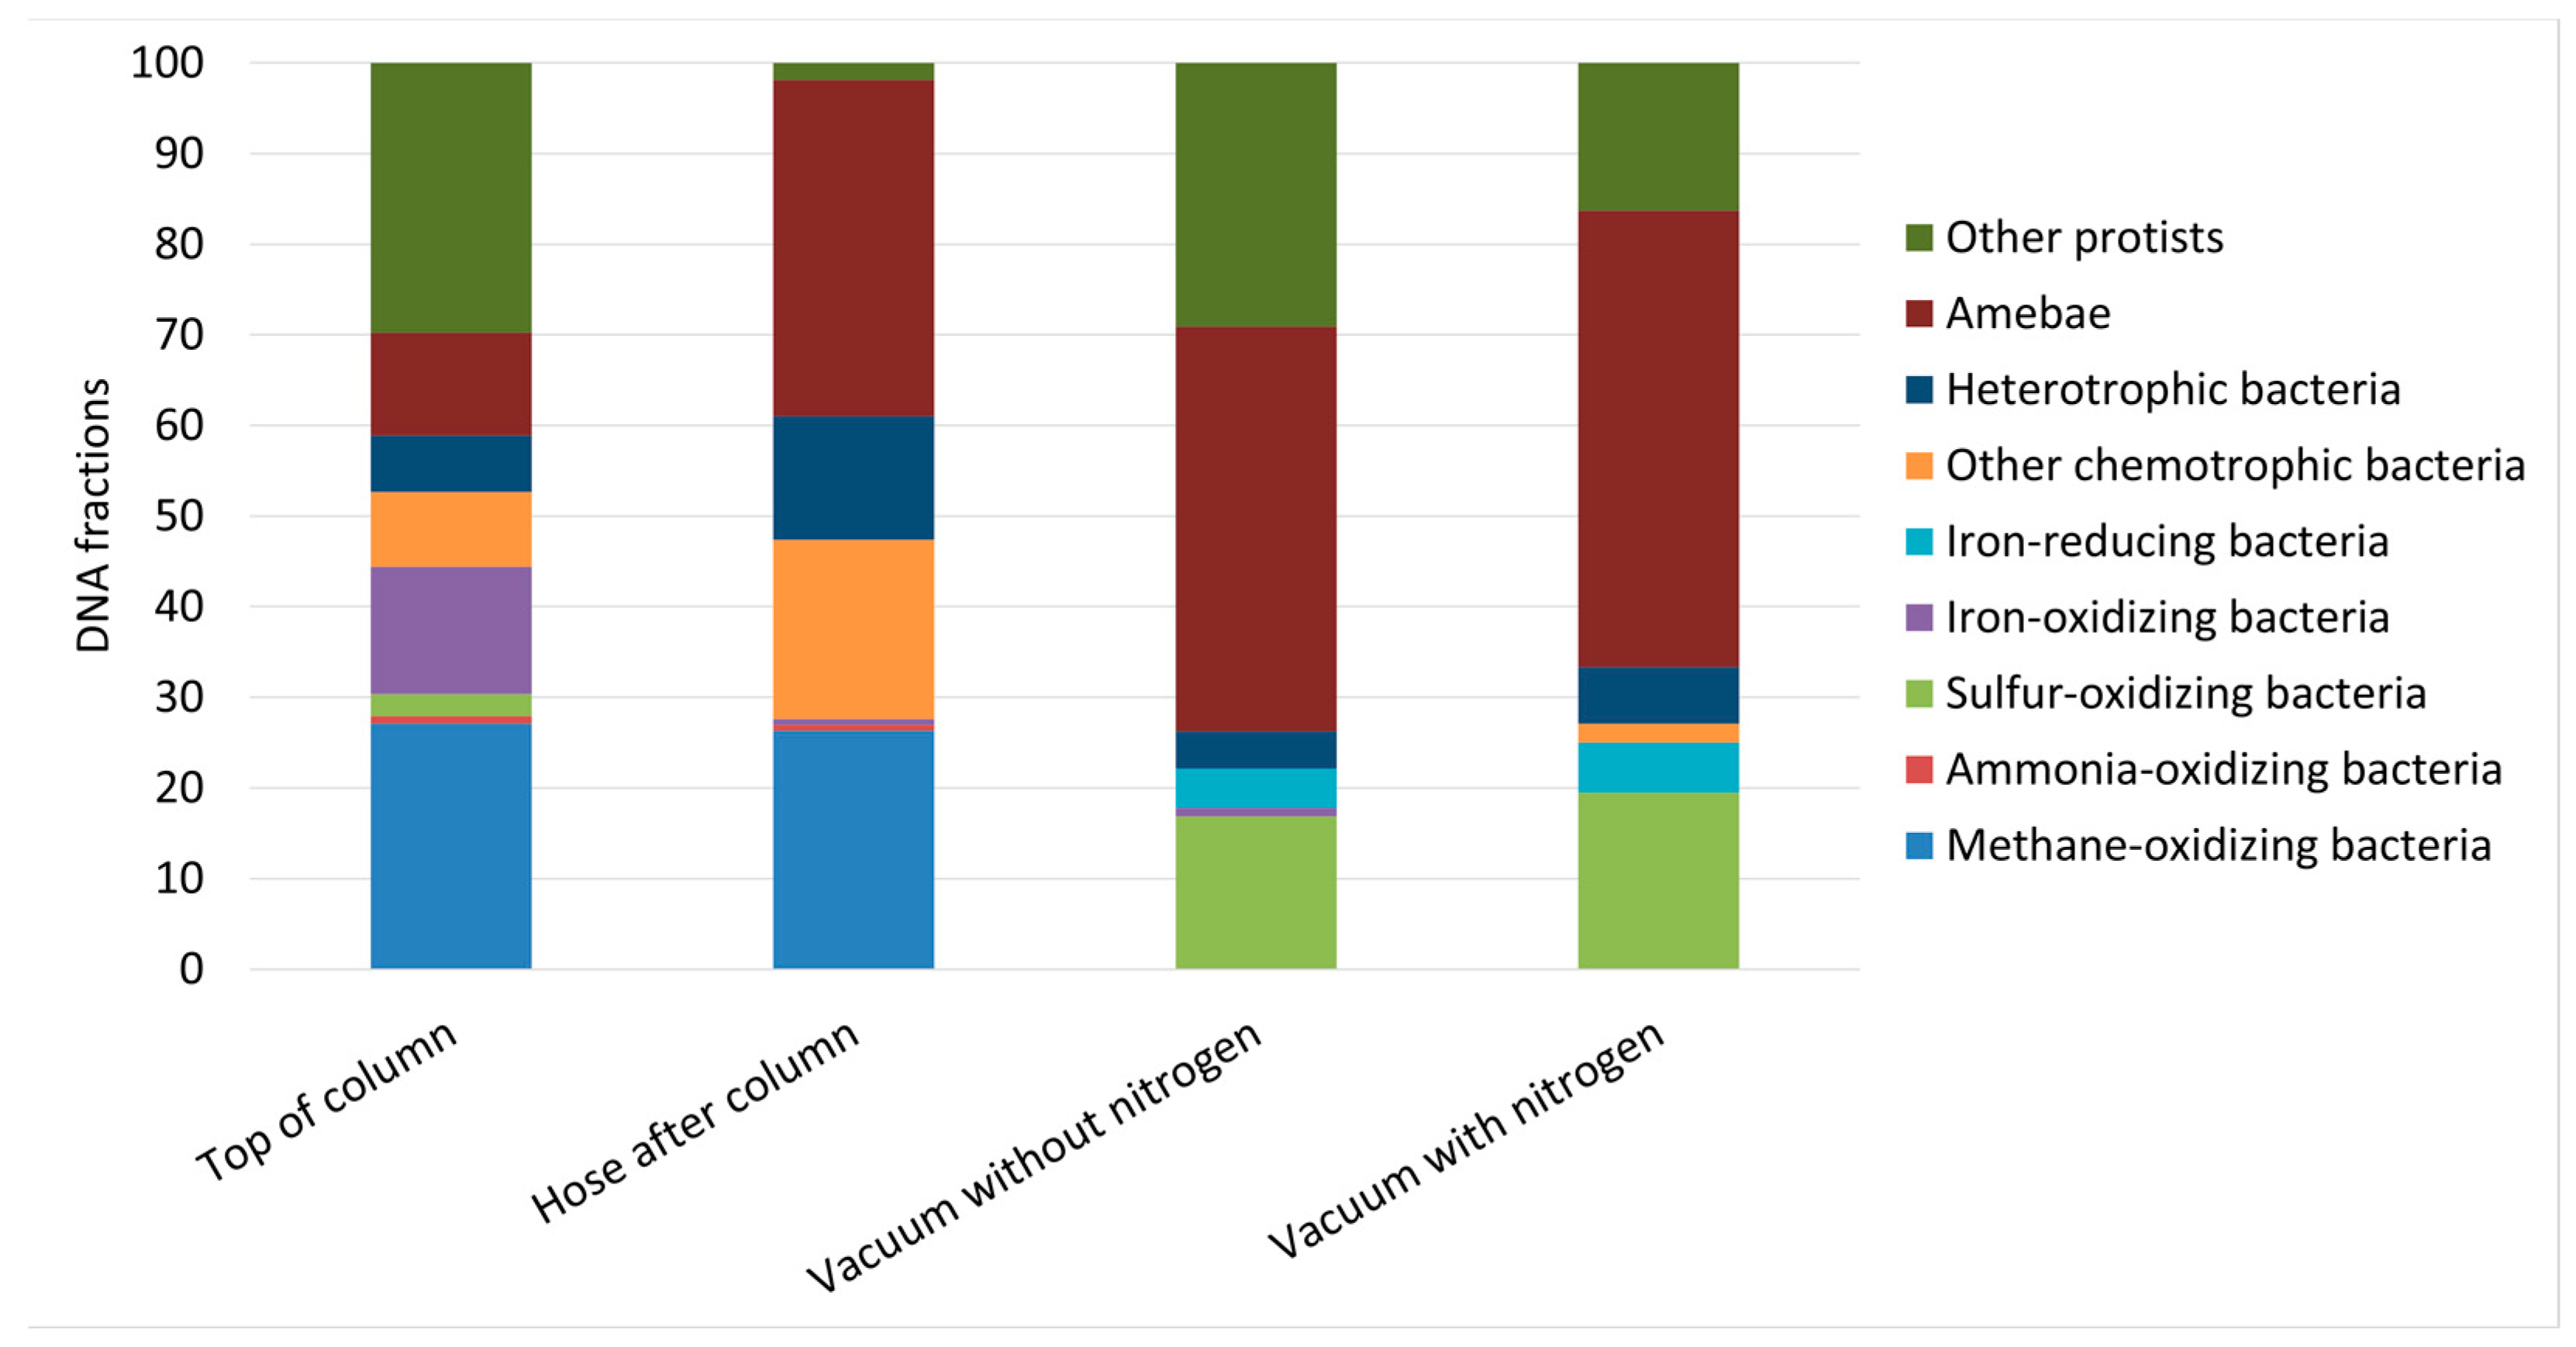
3.3.2. Molecular Analyses of Prokaryotes and Eukaryotes

Ribosomal 16S (prokaryotes) and 18S (eukaryotes) genes were analysed in samples from three of the four pilot studies (columns with no methane removal as well columns with vacuum stripping) (Figure 4). None of the samples contained DNA from invertebrates.
In the column with visible growth, 26–27% of the DNA originated from methane-oxidizing bacteria both at the top of the reactor and in the PTFE hose (Figure 4). At the top of the reactor, iron- and sulphur-oxidizing bacteria were present. In the PTFE hose only 1% of the bacteria was iron-oxidizing bacteria and none were sulphur oxidizing, whereas “other chemotrophic bacteria” constituted 32% of the bacteria. The two genera constituting of the group “other chemotrophic bacteria” were Hydrogenophaga sp. (hydrogen oxidizer) and Methylotenera sp. (methylotroph). Methylotenera may utilize single carbon compounds from converted methane and thereby contribute to the food web. Protist DNA constituted 30–40% of the DNA both at the top of the reactor and in the PTFE hose.
In the studies with vacuum removal of methane, the bacteria in all samples of loose deposits from the PTFE hoses were mainly sulphur oxidizing (58–64% of the bacteria). Amoebae and other protists constituted up to 74% of the total DNA (Figure 4). There was no significant difference between samples from the top and bottom of the hose (results not shown), nor between samples taken from experiments with and without nitrogen dosing (Figure 4).
The columns for vacuum stripping of methane were each operated for one month, hence slowly developing microbiological communities may not have been established yet. Methane-oxidizing bacteria were below the cut off value of 500 gene copies in all samples after methane removal. However, during vacuum stripping without nitrogen there was a low abundance (close to the cut off value) of Methylotenera versatilis, which is able to oxidize methanol. In contrast, this bacterium was not present in samples when nitrogen was applied in the stripping process (0.018 mg methane/L), which may mean that it grows slowly in the columns when nitrogen is omitted from the stripping process (0.03 mg methane/L), but this growth is avoided by nitrogen dosing resulting in lower methane concentrations.

3.3.3. AOC Analyses

Results from AOC measurements in water samples from the vacuum stripping column indicated that the water was biologically stable both in the inlet and outlet of the column (Table 1), as the AOC was lower than the 10 μg/L that characterizes biostable drinking water [9].
The results also indicate that vacuum stripping does not lead to increased AOC concentrations, as concentrations remained stable throughout the vacuum column. Since methane-oxidizing bacteria convert methane to bacterial biomass, it is not a simple transformation into AOC. Some methane-oxidizing bacteria may be eaten by eukaryotes, while others grow or decay. The unchanged AOC content in the water may therefore be due to both the effective methane removal and the fact that any remaining methane is not converted to AOC until oxygen is available.

4. Discussion

4.1. Effect of Methane on Invertebrate Populations

Invertebrate DNA was present at Slangerup waterworks (Figure 2), while microscopy did not reveal excessive growth, as seen in other investigated systems [12,25,26,27,28,29]. This corresponds with the generally low carbon content as measured by AOC concentrations (<3 µg AOC/L before aeration, after primary filters and at the outlet of the waterworks and 89 µg AOC/L after aeration) (Figure 1) as well as relatively low methane concentrations (average of 0.25 mg/L before aeration). Drinking water systems with heavy infestations are known from, e.g., water treatment with biological activated carbon [27] and waterworks with methane [18], as well as in distribution systems [12,29]. The primary filters contained rotifers and platyhelminths (3% of total primary filter DNA), while annelids and nematodes dominated in secondary filters (20% of total secondary filter DNA) with low platyhelminth levels (1%). The succession of organisms was shown throughout the filters (Figure 2). The primary filter was dominated by primary producers (methane- and ammonia-oxidizing bacteria), while the share of heterotrophic bacteria and eukaryotes increased in the upper layers of the secondary filter. The lower layers of the secondary filter were highly eukaryotic, with 85% of the DNA at 20–40 cm depth being eukaryotic. Invertebrates were not limited to specific depths of the secondary filter but found from top to bottom.
Hvidovre waterworks was unique in having top predators (turbellarians) in the food web in a previous study of 11 Danish waterworks [20]. This was attributed to age, since the study found that age was the strongest of the investigated correlating parameters to eukaryotic OUT (operational taxonomic unit) richness. The study suggested that Hvidovre waterworks with an age of 40 years and five defined levels of the food web represented (ranging from primary producers to omnivorous metazoans) should be considered as close to a climax ecosystem as can be expected for sand filters. Our results from Hvidovre waterworks confirmed the results by Harder et al. [20] by having high concentration of annelids (7% of total DNA), which are top predators in sand filter food webs. This illustrates the complexity of investigating food availability in drinking water systems with multiple factors of importance. The conclusion of Harder et al. [20] of age being the main parameter for invertebrate occurrence in sand filters correlates with building a complex food web over time. However, it is remarkable that Hvidovre waterworks with the largest eukaryote diversity in a cross-country study had a lower eukaryote diversity than Slangerup waterworks (sand filter age of 12 years) in our study. In addition to age, our study suggests that the additional available carbon supplied by methane oxidation contributed even further to invertebrate growth at Slangerup waterworks. Slangerup waterworks has an even larger share of invertebrates (13%) compared to Hvidovre waterworks (7%). In comparison with other raw water resources in Denmark [19], Slangerup waterworks is in the relatively low range of methane concentrations. Still, a previous study of four Danish waterworks, including Slangerup waterworks, estimated that the amount of eukaryote DNA was 3–30 times higher at Slangerup waterworks than found at the other sampled waterworks [30].
The water sample collected in the reaction chamber between the aeration step and primary filter at Slangerup waterworks showed to be a separate niche. Sulphur-oxidizing, methane-oxidizing and iron-oxidizing bacteria constituted 33% of the DNA in the sample, while eukaryote DNA dominated with 44% protists and 20% gastrotrichs (Chaetonotus spp.). Reaction chambers contain stagnant water and hence sedimentation as well as contents of sulphur and methane if not removed completely. Regular drainage of sediment from reaction chambers will contribute to lower concentrations of organic material at waterworks.
Fungi, which are also able to enhance the availability of carbon to other organisms, were present at both waterworks. There was no distinct pattern in their location neither regarding depth nor filter stage (Figure 2). Fungi is not further discussed in this paper, but 74 genera of fungi isolated from drinking water are described in a recent review [31].

4.2. Which Methane Concentration to Aim for?

To add an applicable approach to the knowledge of increased biological growth due to methane, we investigated to what extent methane should be removed to avoid excessive growth.
In full-scale measurements at Slangerup waterworks, the methane concentration was measured as 0.023 mg/L after aeration. At this concentration, a large proportion of methane-oxidizing bacteria was identified in the primary filters (Figure 2), which indicated that even a low content of methane can cause unwanted growth. At a Dutch utility, Wessels [32] also found that methane concentration after treatment should be below 0.01 mg/L to supply biostable water when accounting for the background level of AOC present in the water. Wessels [32] estimated that 1 µg CH4 corresponds to 0.4 µg AOC.
In the samples with anaerobic groundwater from the top of the pellet reactor (0.24 mg methane/L) there was a large proportion of methane-oxidizing bacteria and high amounts of visible biomass after only two days. In the following study with methane-free drinking water (<0.01 mg/L) in the same reactor there was no visible growth.
In the first study with vacuum stripping, the methane concentration without nitrogen dosing was 0.03 mg/L after stripping, so it could be expected that growth of methane-oxidizing bacteria would occur as at Slangerup waterworks. The explanation for the lack of growth may be the duration of the study of one month compared to 12 years of growth at Slangerup waterworks or the difference in methane removal methods (stripping versus aeration) (Table 2).
At Slangerup waterworks, the methane concentration in the groundwater is reduced from approximately 0.25 mg/L to approximately 0.023 mg/L using aeration in closed aeration cassettes. Inside the system, both methane and oxygen are present at the same time, which can cause growth of methane-oxidizing bacteria. It is known from waterworks with methane that the methane-oxidizing bacteria can grow where the aeration takes place, for example, within the aeration steps [18]. In the vacuum stripping experiment, methane concentration in groundwater was reduced from approximately 0.36 mg/L to below ≤0.03 mg/L with aeration afterwards. With vacuum stripping, the methane is pulled out of the system before oxygen enters the water. Vacuum stripping therefore has the added advantage compared to aeration that no oxygen is available to the bacteria until the methane is out of the system.
Methane removal by vacuum stripping down to ≤0.03 mg/L before aeration seems to prevent unwanted microbiological growth at the waterworks and could help achieve biostable water with good drinking water quality. To monitor unwanted microbiological growth during distribution, where carbon from methane has become available for heterotrophic growth, a good indicator organism may be Serratia fonticola. Contrary to most coliform bacteria, Serratia fonticola may grow in nutrient-rich drinking water systems, and is easily monitored compared to, e.g., sampling of invertebrates.
It is still unexplored why methane-oxidizing bacteria were not registered after a one-month pilot study with 0.03 mg methane/L as in the full-scale waterworks. Whether this was due to the relatively short time period of the pilot studies of one month or the applied method of stripping methane from the system down to ≤0.03 mg/L before air was available for bacterial growth would be of great interest for future designs of water treatment plants.
As methane is not only a potential source of carbon in drinking water, but also a powerful greenhouse gas, the global warming potential of methane is estimated to 27–30 over 100 years [33]. At Slangerup waterworks, 1.8 tons of methane can potentially be released to the atmosphere per year, corresponding to approximately 49 tons CO2-eq. HOFOR, Greater Copenhagen Utility, is investigating the possibility of using catalytic oxidation to convert the stripped methane into carbon dioxide.

Supplementary Materials

The following supporting information can be downloaded at: https://www.mdpi.com/article/10.3390/w15061044/s1, Figure S1: Light microscopy photos of drainage water from filter sand samples collected in primary filter at Slangerup waterworks; Figure S2: Light microscopy photos of drainage water from filter sand samples collected in secondary filter at Slangerup waterworks; Figure S3: Light microscopy photos of drainage water from filter sand samples collected in single filter at Hvidovre waterworks; Figure S4: Photos from Slangerup waterworks of sample and sampling; Figure S5: Water quality parameters throughout the treatment steps at Slangerup waterworks; Table S1: Water quality parameters from four pilot columns situated at Slangerup waterworks; Table S2: Water quality parameters after all treatment steps at Hvidovre waterworks. Table S3: DNA sequencing data generated in this study with accession numbers from the European Nucleotide Archive (ENA).

Author Contributions

Conceptualization, S.C.B.C., S.Q., L.L. and M.J.H.; methodology, S.C.B.C., S.Q., L.L. and M.J.H.; investigation, S.C.B.C., S.Q., L.L. and M.J.H.; data curation, S.C.B.C., S.Q., L.L. and M.J.H.; writing—original draft preparation, S.C.B.C., S.Q., L.L. and M.J.H.; writing—review and editing, S.C.B.C., S.Q., L.L. and M.J.H.; visualization, M.J.H., S.C.B.C. and L.L. All authors have read and agreed to the published version of the manuscript.

Funding

This research received no external funding.

Data Availability Statement

The water quality data presented in this study are available in the Supplementary Material.

Acknowledgments

The authors wish to thank Henrik V. Nielsen and Lee O’Brien Andersen (Statens Serum Institut), all laboratory technicians at the HOFOR Water Quality Laboratory as well as Ann-Katrin Pedersen (HOFOR Water Quality Section).

Conflicts of Interest

The authors declare no conflict of interest.

References

  1. Prest, E.; Hammes, F.; van Loosdrecht, M.; Vrouwenvelder, J.S. Biological Stability of Drinking Water: Controlling Factors, Methods, and Challenges. Front. Microbiol. 2016, 7, 1–24. [Google Scholar] [CrossRef] [PubMed] [Green Version]
  2. El-Chakhtoura, J.; Prest, E.I.; Saikaly, P.E.; van Loosdrecht, M.C.M.; Hammes, F.; Vrouwenvelder, J.S. Dynamics of bacterial communities before and after distribution in a full-scale drinking water network. Water Res. 2015, 74, 180–190. [Google Scholar] [CrossRef] [PubMed]
  3. Hedegaard, M.J.; Arvin, E.; Corfitzen, C.B.; Albrechtsen, H.-J. Mecoprop (MCPP) removal in full-scale rapid sand filters at a groundwater-based waterworks. Sci. Total Environ. 2014, 499, 257–264. [Google Scholar] [CrossRef] [PubMed] [Green Version]
  4. Lee, C.O.; Boe-Hansen, R.; Musovic, S.; Smets, B.F.; Albrechtsen, H.-J.; Binning, P.J. Effects of dynamic operating conditions on nitrification in biological rapid sand filters for drinking water treatment. Water Res. 2014, 64, 226–236. [Google Scholar] [CrossRef] [Green Version]
  5. Gülay, A.; Musovic, S.; Albrechtsen, H.-J.; Smets, B.F. Neutrophilic iron-oxidizing bacteria: Occurrence and relevance in biological drinking water treatment. Water Sci. Technol. Water Supply. 2013, 13, 1295–1301. [Google Scholar] [CrossRef]
  6. Skovhus, T.L.; Søborg, D.A.; Braga, F.; Højris, B.; Kristensen, K.B.; Hansen, K.L. Effects of early biofilm formation on water quality during commissioning of new polyethylene pipes. Env. Sci. Water Res. Tech. 2022, 8, 1992–2005. [Google Scholar] [CrossRef]
  7. Favere, J.; Barbosa, R.G.; Sleutels, T.; Verstraete, W.; De Gusseme, B.; Boon, N. Safeguarding the microbial water quality from source to tap. NPJ Clean Water. 2021, 4, 28. [Google Scholar] [CrossRef]
  8. Bucheli-Witschel, M.; Kötzsch, S.D.; Widler, R.; Egli, T. A new method to assess the influence of migration from polymeric materials on the biostability of drinking water. Water Res. 2012, 46, 4246–4260. [Google Scholar] [CrossRef]
  9. van der Kooij, D. Assimilable Organic Carbon as an Indicator of Bacterial Regrowth. J. Am. Water Works Ass. 1992, 84, 57–65. [Google Scholar] [CrossRef]
  10. Prest, E.I.; Martijn, B.J.; Rietveld, M.; Lin, Y.; Schaap, P.G. (Micro)Biological Sediment Formation in a Non-Chlorinated Drinking Water Distribution System. Water 2023, 15, 214. [Google Scholar] [CrossRef]
  11. Christensen, S.C.B.; Nissen, E.; Arvin, E.; Albrechtsen, H.-J. Distribution of Asellus aquaticus and microinvertebrates in a non-chlorinated drinking water supply system, effects of pipe material and sedimentation. Water Res. 2011, 45, 3215–3224. [Google Scholar] [CrossRef] [PubMed] [Green Version]
  12. Christopher, S.; Michels, U.; Gunkel, G. Paratanytarsus grimmii (Chironomidae) Larvae in Drinking Water Distribution Systems: Impairment or disaster? Water 2023, 15, 377. [Google Scholar] [CrossRef]
  13. Walker, A.P. The microscopy of consumer complaints. J. Inst. Water Eng. Sci. 1983, 37, 200–214. [Google Scholar]
  14. Grimont, F.; Grimont. The Genus Serratia. In P.A.D. Prokaryotes, 3rd ed.; Dworkin, M., Falkow, S., Rosenberg, E., Schleifer, K.H., Stackebrandt, E., Eds.; Springer: New York, NY, USA, 2006; pp. 219–244. [Google Scholar]
  15. Christensen, S.C.B.; Albrechtsen, H.-J. Overlevelse af coliforme bakterier i drikkevand (Survival of Coliform Bacteria in Drinking Water); DTU Environment, Technical University of Denmark: Kongens Lyngby, Denmark, 2015. (In Danish) [Google Scholar]
  16. Danish Drinking Water Act. BEK Number 1383 of 03/10/2022. Miljømin., j.nr. 2022—9820, Lovtidende A, Danish EPA, Copenhagen, Denmark, 2022. Available online: https://www.retsinformation.dk/eli/lta/2022/1383 (accessed on 1 February 2023). (In Danish).
  17. Jørgensen, C.; Albrechtsen, H.-J.; Arvin, E.; Corfitzen, C.B. Undersøgelse af bakterieantal og eftervækstpotentiale i Vandværksvand; No. 719; Miljøstyrelsen: Copenhagen, Denmark, 2002. (In Danish) [Google Scholar]
  18. Christensen, S.C.B.; Larsen, S.L.; Asmussen, O.W.; Boe-Hansen, R.; Nava, S.B.; Afshar, S.V.; Albrechtsen, H.-J. Ormebekæmpelse i vandværksfiltre—Forekomst og Bekæmpelsesteknologi; Naturstyrelsen: Copenhagen, Denmark, 2015. (In Danish) [Google Scholar]
  19. Hedegaard, M.J.; Schliemann-Haug, M.A.M.; Milanovic, N.; Lee, C.O.; Boe-Hansen, R.; Albrechtsen, H.-J. Importance of Methane oxidation for Microbial Degradation of the Herbicide Bentazone in Drinking Water Production. Front. Environ. Sci. 2020, 8, 79. [Google Scholar] [CrossRef]
  20. Harder, C.B.; Albers, C.N.; Rosendahl, S.; Aamand, J.; Ellegaard-Jensen, L.; Ekelund, F. Successional trophic complexity and biogeographical structure of eukaryotic communities in waterworks’ rapid sand filters. FEMS Microbiol. Ecol. 2019, 95, 11. [Google Scholar]
  21. van der Kooij, D.; Veenendaal, H.R. Determination of the concentration of easily assimilable organic carbon in drinking water with growth measurements using pure bacterial cultures. In The AOC Manual; SWE 95.022; Kiwa: Nieuwegein, Holland, 1995. [Google Scholar]
  22. Andersen, L.O.B.; Röser, D.; Nejsum, P.; Nielsen, H.V.; Stensvold, C.R. Is supplementary bead beating for DNA extraction from nematode eggs by use of the nuclisens easymag protocol necessary. J. Clin. Microbiol. 2013, 51, 1345–1347. [Google Scholar] [CrossRef] [PubMed] [Green Version]
  23. Krogsgaard, L.R.; Andersen, L.O.; Johannesen, T.B.; Engsbro, A.L.; Stensvold, C.R.; Nielsen, H.V.; Bytzer, P. Characteristics of the bacterial microbiome in association with common intestinal parasites in irritable bowel syndrome. Clin. Transl. Gastroenterol. 2018, 19, 161. [Google Scholar] [CrossRef]
  24. Ring, H.C.; Thorsen, J.; Saunte, D.M.; Lilje, B.; Bay, L.; Riis, P.T.; Larsen, N.; Andersen, L.O.; Nielsen, H.V.; Miller, I.M.; et al. The follicular skin microbiome in patients with hidradenitis suppurativa and healthy controls. JAMA Dermatol. 2017, 153, 897–905. [Google Scholar] [CrossRef]
  25. Castaldelli, G.; Mantovani, S.; Benvenuti, M.R.; Rossi, R.; Fano, E.A. Invertebrate colonisation of GAC filters in a potabilization plant treating groundwater. J. Water Supply Res. Technol.-Aqua 2005, 54, 561–568. [Google Scholar] [CrossRef]
  26. Schreiber, H.; Schoenen, D.; Traunspurger, W. Invertebrate colonization of granular activated carbon filters. Water Res. 1997, 31, 743–748. [Google Scholar] [CrossRef]
  27. Li, X.; Yang, Y.; Liu, L.; Zhang, J.; Wang, Q. Invertebrate community characteristics in biologically active carbon filter. J. Environ. Sci. 2010, 22, 648–655. [Google Scholar] [CrossRef]
  28. van Lieverloo, J.H.M.; van Buuren, R.; Veenendaal, G.; van der Kooij, D. Controlling invertebrates in distribution systems with zero or low disinfectant residual. Water Suppl. 1998, 16, 199–204. [Google Scholar]
  29. Gunkel, G.; Michels, U.; Scheideler, M. Climate Change: Water Temperature and Invertebrate Propagation in Drinking-Water Distribution Systems, Effects, and Risk Assessment. Water 2022, 14, 1246. [Google Scholar] [CrossRef]
  30. Mrkajic, N.S.; Hama, J.R.; Strobel, B.W.; Hansen, H.C.B.; Rasmussen, L.H.; Pedersen, A.-K.; Christensen, S.C.B.; Hedegaard, M.J. Removal of phytotoxins in filter sand used for drinking water treatment. Water Res. 2021, 205, 117610. [Google Scholar] [CrossRef]
  31. Zhao, H.-X.; Zhang, T.-Y.; Wang, H.; Hu, C.-Y.; Tang, Y.-L.; Xu, B. Occurrence of fungal spores in drinking water: A review of pathogenicity, odor, chlorine resistance and control strategies. Sci. Tot. Environ. 2022, 853, 158626. [Google Scholar] [CrossRef] [PubMed]
  32. Wessels, P.H. A Novel Approach to Anaerobic Groundwater Treatment: Mitigating the Effect of Methane on the Biological Stability of Drinking Water. Master’s Thesis, TU Delft, Delft University of Technology, Delft, The Netherlands, 2014. [Google Scholar]
  33. Masson-Delmotte, V.; Zhai, P.; Pirani, A.; Connors, S.L.; Péan, C.; Berger, S.; Caud, N.; Chen, Y.; Goldfarb, L.; Gomis, M.I.; et al. IPCC, 2021: Climate Change 2021: The Physical Science Basi; Contribution of Working Group I to the Sixth Assessment Report of the Intergovernmental Panel on Climate Change; Cambridge University Press: Cambridge, UK; New York, NY, USA, 2021; 2391p. [Google Scholar]
Figure 1. Water quality parameters before aeration, after aeration (reaction chamber), after primary sand filters and at the outlet of Slangerup waterworks. Concentration of (A) methane (mg/L), (B) oxygen (mg/L), (C) AOC (µg/L) and (D) ammonium, nitrite and nitrate (mg/L).
Water 15 01044 g001
Figure 3. Pilot studies conducted at Slangerup waterworks. (A) Visible growth at the top of pilot column with anaerobic groundwater with methane. (B) Hoses in control panel which clogged due to growth in study with anaerobic groundwater. (C) Hose with iron precipitation in study with vacuum stripping.
Water 15 01044 g003
Figure 4. Fractions of DNA from organisms in samples from three pilot studies. Eukaryotes consist of amebae and other protists while prokaryotes are bacteria categorized on the basis of their metabolism. “Top of column” is a sample of water with visible growth. “Hose after column” is biomass from clogged hose. Both samples were collected in the study with groundwater with methane. “Vacuum without nitrogen” was analysed in loose deposits in a hose after 1 month study. “Vacuum with nitrogen” was analysed in loose deposits in a hose after 1 month study.
Water 15 01044 g004
Table 1. Concentrations of assimilable organic carbon (AOC) in water sampled in pilot studies with different methane concentrations.
ParameterVacuum Stripping without N2 DosingVacuum Stripping with
0.8 g/h N2 Dosing
InletOutletInletOutlet
Methane (average) (mg/L)0.360.030.360.018
AOC (µg/L)5.75.28.46.7
Table 2. Summary of effect of methane concentration and removal on bacterial growth in the different setups.
Average Inlet Conc.
(mg CH4/L)
Average Conc. after CH4 Removal
(mg CH4/L)
Water SourceBacterial Growth
Hvidovre waterworks with stair aerator<0.01<0.01Anaerobic groundwaterNo visible growth
Slangerup waterworks with aeration in closed cassettes0.250.023Anaerobic groundwaterMethane-oxidizing bacteria
Column without methane removal<0.01 <0.01Aerobic drinking waterNo visible growth
Column without methane removal0.240.22Anaerobic groundwaterRapid visible growth
Column with vacuum stripping0.360.03Anaerobic groundwaterNo visible growth and no methane-oxidizing bacteria
Column with vacuum stripping and N2 dosing0.360.018Anaerobic groundwaterNo visible growth and no methane-oxidizing bacteria
Disclaimer/Publisher’s Note: The statements, opinions and data contained in all publications are solely those of the individual author(s) and contributor(s) and not of MDPI and/or the editor(s). MDPI and/or the editor(s) disclaim responsibility for any injury to people or property resulting from any ideas, methods, instructions or products referred to in the content.

