Article

Wave Effects on the Initial Dilution of Untreated Wastewater Discharge for Santa Marta’s Submarine Outfall (Colombia)

by
Francisco-Fernando García-Rentería
1,*,
Gustavo Ariel Chang Nieto
2 and
Gustavo Hernández Cortés
2
1
Gestión Evaluación y Monitoreo Ambiental (GEMA), Santa Marta 470004, Colombia
2
Department of Civil Engineering, Magdalena University, Santa Marta 470004, Colombia
*
Author to whom correspondence should be addressed.
Water 2023, 15(5), 919; https://doi.org/10.3390/w15050919
Submission received: 20 January 2023 / Revised: 22 February 2023 / Accepted: 24 February 2023 / Published: 27 February 2023

Abstract

:
The initial dilution generated by the final disposal of untreated wastewater through a submarine outfall in Santa Marta was examined with a near-field dilution model. Northward and eastward seawater velocity, salinity, and temperature profiles from a 3D hydrodynamic model were used to provide the oceanic conditions to calculate the dilution. The upwelling phenomenon occurs two times a year at the wastewater discharge site, the major from December to March and the minor in July, eliminating the stratification condition of seawater. The results of the dilution model showed that in these periods the plume reaches the water surface, achieving dilutions greater than 100. In addition, the external wave effect on the initial dilution of submarine outfall discharge in Santa Marta was determined. Surface waves increase dilution during the dry period of the year, when trade winds increase the surge and start the upwelling phenomenon. The dilution with/without waves factor is up to 1.90 for the center of the plume on the water column.

1. Introduction

The main advantage of submarine outfalls compared to other alternatives for final sewage disposal is their low cost, making them a very popular option in coastal cities [1,2]. The discharge of wastewater through submarine outfalls contributes to pollution in the marine environment, which has generated greater scientific interest [3,4,5,6]. Due to the momentum and difference in densities between seawater and wastewater discharge, a plume rises to the surface and is diluted by surrounding seawater, a process known as near-field dilution or initial dilution [7]. The discharge from the sewage will either reach the surface of the seawater or float at a level where its buoyancy is neutral, depending on whether or not the water body is stratified [7,8]. Factors such as discharge conditions, diffuser lengths, ocean currents, and stratification all significantly influence near-field dilution [8,9]. Submarine outfalls are designed to maximize dilution and minimize impacts on marine ecosystems. The effects on marine ecosystems can be greatly reduced if a submarine outfall with a high level of initial dilution is used for wastewater discharge [10,11].
To study the effects of submarine outfalls and their dilution process, two regions have been established as follows: the near-field and the far field. The near-field is dominated by the conditions of the wastewater discharge through the diffusers of the submarine outfall, while the far field is dominated by hydrodynamic marine factors. Some authors have proposed a third zone, the transitional field, between both [12]. The near-field dilution process has been extensively studied through laboratory experiments [13,14,15]. Early investigations were based solely on differences in density, treating the discharge as a buoyant jet that decreases in density as it rises through the seawater column [16]. However, subsequent studies, such as that conducted by Chin [17], have considered other processes, such as the inclusion of wave effects [18,19,20,21,22,23,24,25].
Waves can impact the dilution of effluent discharge from submarine outfalls [23,24]. During stratification events in which a thermocline is well developed, the buoyant plume remains submerged. Several researchers [19,23,25] have studied the phenomenon of waves inducing the ascent of a buoyant plume to the surface. To study the effect of waves on initial dilution, Tate [23] proposed that the buoyancy frequency varies with both time and depth in the water column. This allows the incorporation of wave effects by defining small time intervals, which determine small changes in the plume’s position as it rises. This hypothesis was supported through the combination of laboratory and field data. The buoyancy frequency, along with other environmental variables, was calculated at each time step using the fourth-order Runge–Kutta method. This method ensures stability in the solution of equations, enabling consideration of wave-induced changes in water density [23,24]. There is a need for more research on the impact of waves on the dilution of effluent discharge from submarine outfalls. A lack of understanding about the effects of wave period and height on the buoyant jet plume has been noted by Xu [26]. Studies by various authors confirm that it is necessary to consider the effects of surface waves on wastewater discharge into the sea environment [23,26,27,28]. Anghan [11] conducted a comprehensive review of the literature and discussed the dilution process under marine waves. The review recommends increased computational efforts in future studies to determine the impact of waves on the dilution of buoyant jets.
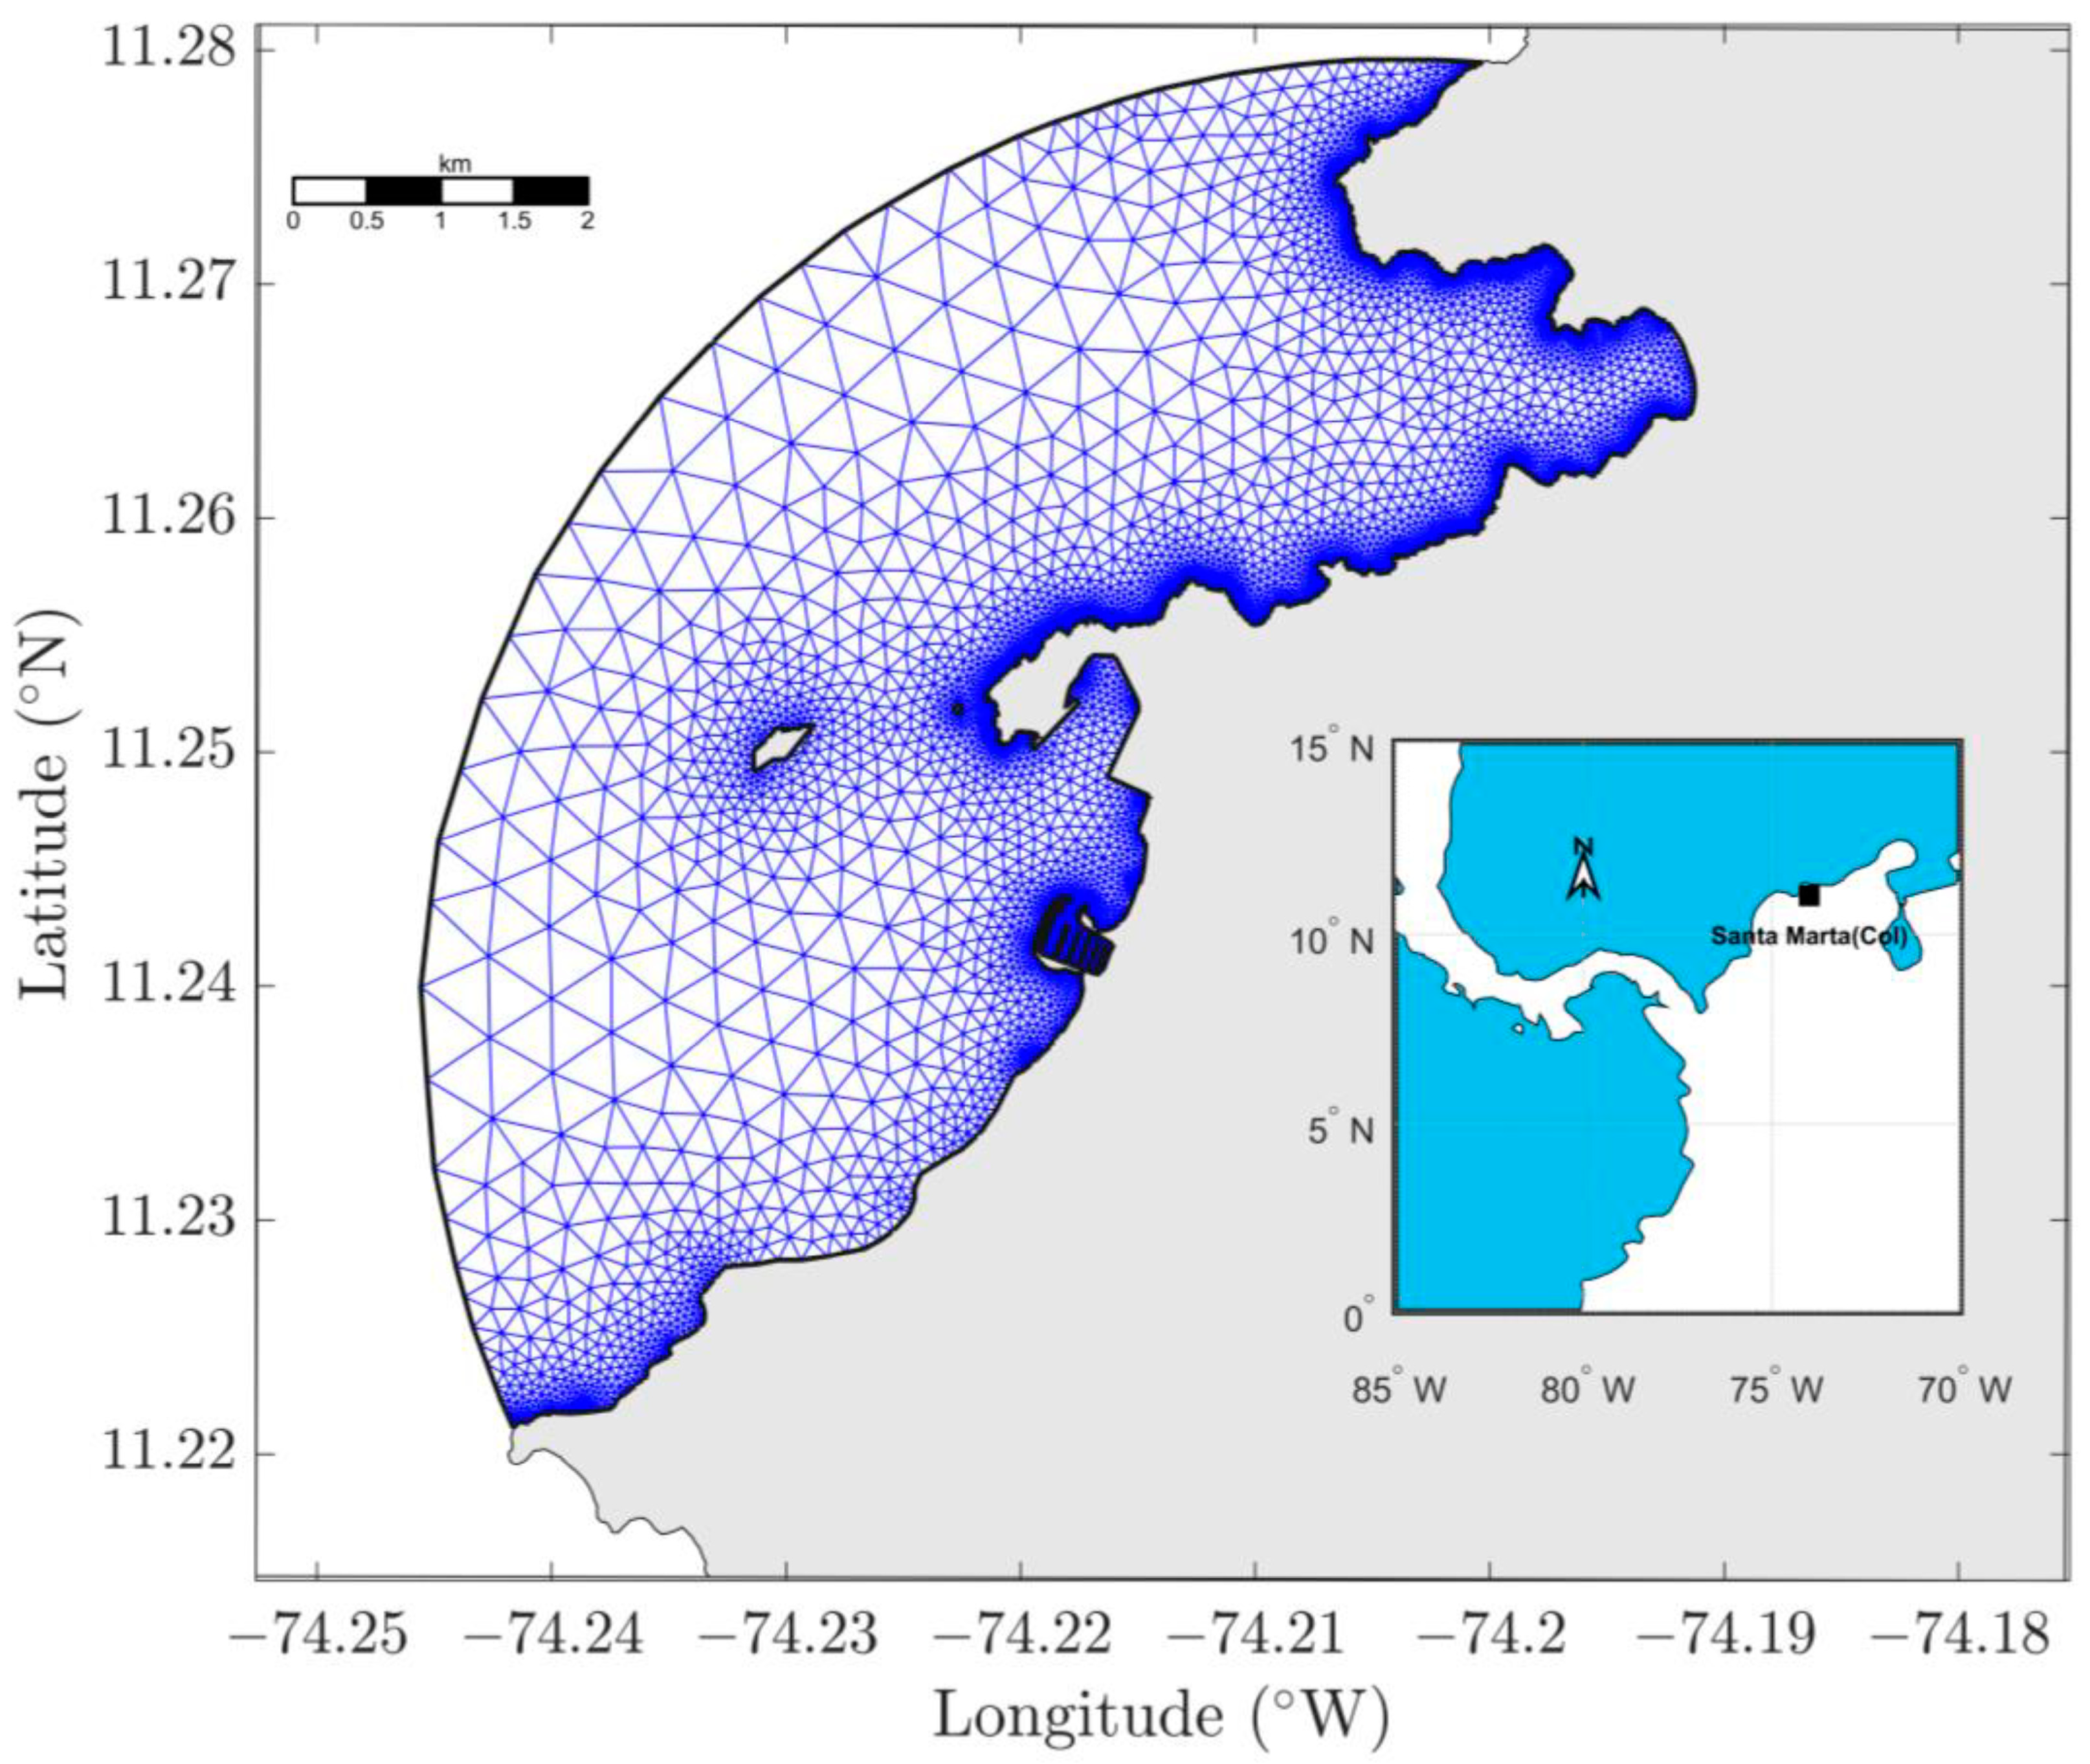
The Santa Marta Coastal Area (SMCA), located in northern Colombia (Figure 1), is a complex and unique environment that has a variety of uses for marine waters, including recreation, basic sanitation, industrial, and port activities. Furthermore, the SMCA is a popular tourist destination because of its stunning scenery and the natural beauty of its beaches. However, this intense use of the area has resulted in significant human-generated impacts, causing environmental pollution problems. Recent water quality studies in the SMCA have revealed high levels of fecal and total coliforms in recreational waters, indicating contamination [29,30]. The changes in bacteriological water quality are typically attributed to the final disposal of wastewater through a submarine discharge that currently releases 1000 L/s. However, there is a lack of scientific evidence to confirm or disprove this hypothesis.
The aim of the present study was to model the near-field dilution of pollutants generated by the untreated wastewater discharge from the Santa Marta submarine outfall (Figure 1), considering the influence of coastal waves. The formulations proposed by Chin [27] and Hwung et al. [25], which have been validated by Niu [24], were incorporated into this analysis to assess the impact of waves on the dilution of the wastewater discharge. The results are presented in this paper.

Effects of External Waves

The rate of dilution of a jet discharge affected by wave motion is a function of the parameters controlling the buoyancy and propagation of surface waves. Some of the variables characterizing the kinematic and dynamic behavior of a buoyant jet are as follows: M = Q V o   f low   momentum , B = Q g o (buoyancy), and g o = g Δ ρ 0 / ρ 0 (effective gravity), where Q = π / 4 D 2 V 0 (volumetric flow), V o (discharge velocity), D (diameter orifices), and H (discharge depth). The term Δ ρ o corresponds to the initial difference of density between the discharge and receiving flow, while ρ o represents the initial density of the effluent. The group of parameters describing the motion of surface waves consists of h (depth in the water column), α (wave amplitude), T (period), and g (gravity). Moreover, there are two additional variables that spatially relate the buoyant plume with surface waves: discharge angle with respect to the current direction (x–axis), ( θ 1 ) and discharge angle with respect to the wave propagation direction ( θ 2 ). With these control parameters, the dilution S of a buoyant jet immersed in a non-stratified environment is described by Equation (1) [24]:
S = f M , B , Q , H , h , α , T , g , θ 1 , θ 2 ,
According to Chin [17], the predominant mechanisms that influence the effluent dilution of submarine outfalls can be easily characterized through the dimensional formulation of variables in terms of length scales. Fischer et al. [8] introduced length scale concepts, as referenced by the following equations:
L q = Q M 0.5 = A 0.5
L m = M 3 4 B 0.5
Z m = M 1 2 U m a x
where L m is the length scale at which buoyancy is dominated by the discharge flow, Z m is the length scale used to measure the distance required so that the jet momentum can be affected by waves, L q is the length scale of the discharge, A is the cross-section area of the diffuser nozzles, and U m a x is the maximum horizontal velocity of the wave. For small wave amplitude, U m a x is defined by Equation (5).
U m a x = α g k σ c o s h k h ;   σ = 2 π T ; k = 2 π L
where σ and k are the angular frequency and wave number, respectively.
From laboratory experiments, Chin [17] established a final equation that relates the effect of dilution (S) given the presence of surface waves (Equation (6)):
S     w a v e s S n o   w a v e s = 1 + C s L q Z m
The coefficient C s is an empirical parameter that has been assigned different values by various researchers. Chin [17] used a value of 6.15, and Hwung et al. [25] found different values for different flow directions: 4.21 for flow in the direction of wave motion, 4.16 for flow in the opposite direction, and 5.55 for orthogonal discharges. Hwang et al. [31] suggested values in the range of 1.4–8.66, while Chyan et al. [32] found values between 2.9 and 14.5 for discharge angles between 0 and 180 degrees with respect to the horizontal plane [24].
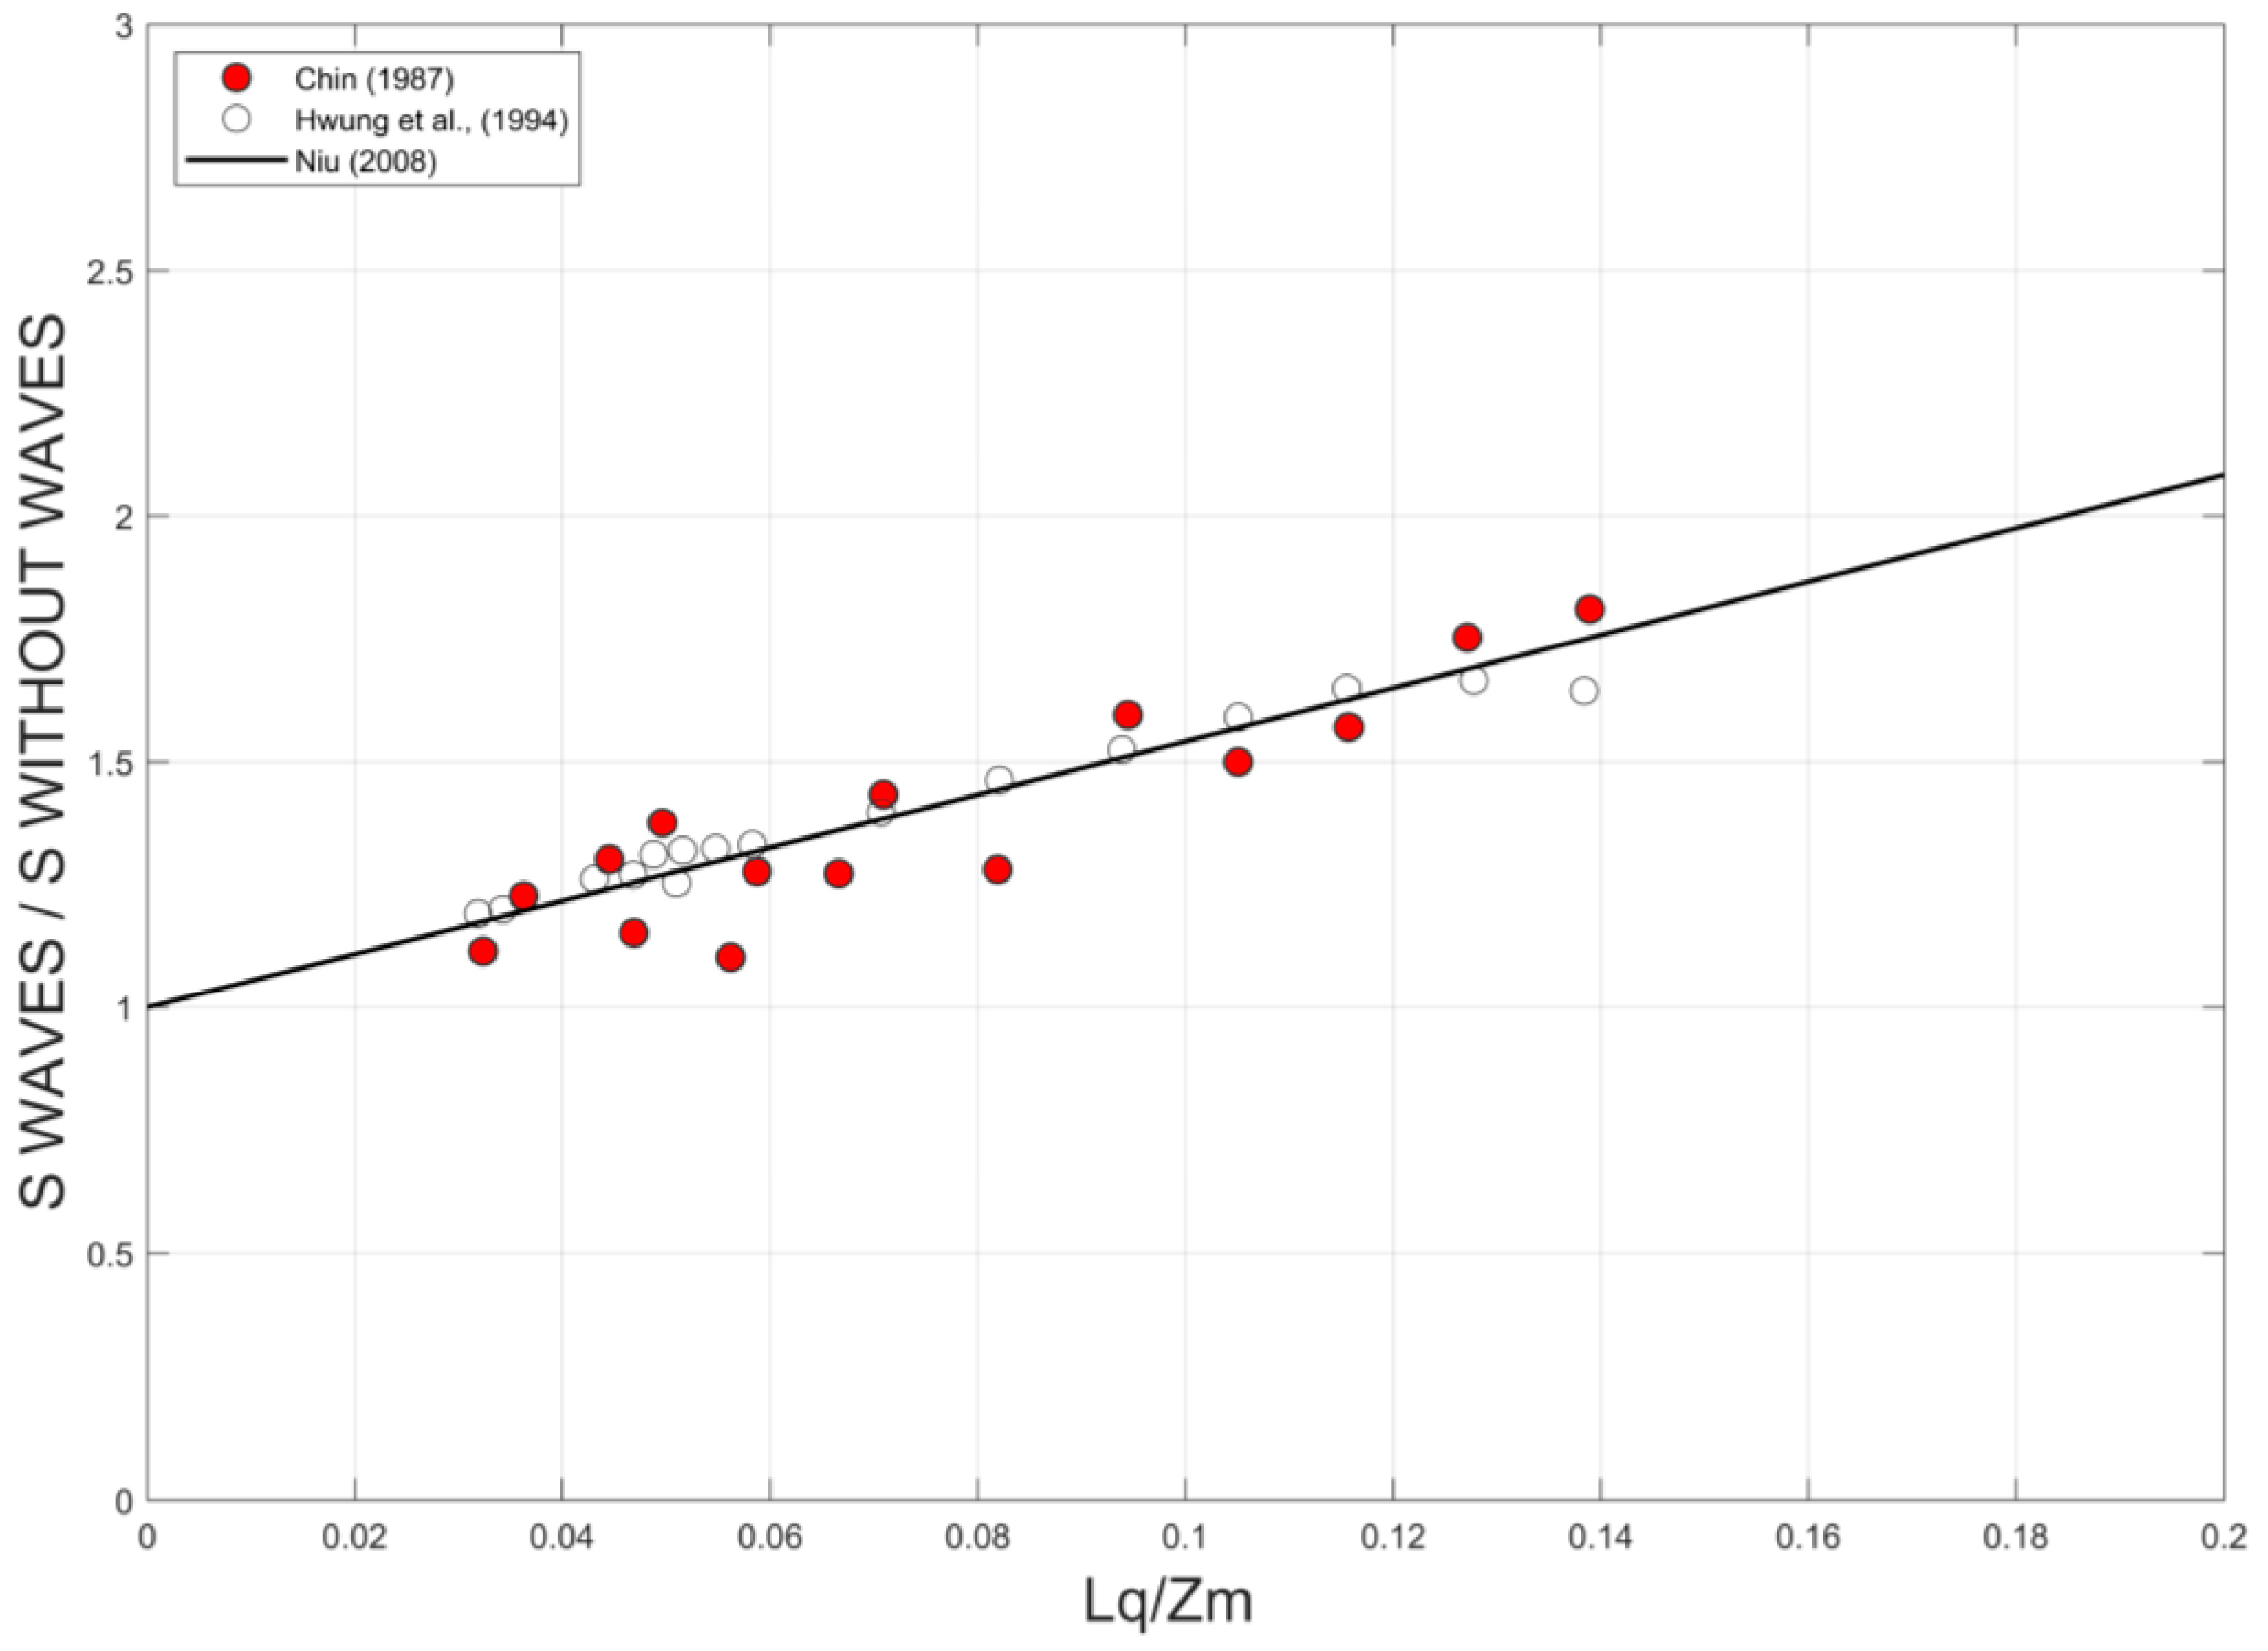
Niu [24] proposed a new formulation that was validated using experimental data from Chin [17] and Hwung et al. [31]. The new expression takes into account the effects in deep waters (H/ L m > 9.03) as well as those in shallow water, and includes the densimetric Froude number ( F r ). Equation (7) shows the expression for deep waters. The results of this investigation indicated a good fit between the reported data and the results obtained from Equation (7). This suggests that Equation (7) is a reliable method for predicting the dimensionless dilution relationship in fluid dynamics. Figure 2 shows the agreement between the results of Niu’s equation (Equation (7)) and the experimental results of Chin [17] and Hwung et al. [31].
S   w a v e s S n o   w a v e s = 1 + 0.4574 F r 0.8818 L q Z m

2. Materials and Methods

2.1. Study Area

Santa Marta’s submarine outfall is located at the coordinates 11.23° N latitude, 74.22° W longitude, in the Caribbean Sea (Figure 1). This wastewater disposal system consists of a pipeline with a 1 m diameter and a length of 442 m, with 32 diffusers (8 inches diameter) located at regular intervals throughout the last 100 m. Through this system, an average of 1 m3/s wastewater is discharged. SMCA is in the Intertropical Convergence Zone (ITCZ), and for this reason its weather is strongly influenced by the trade winds from the north [33,34]. In the dry period (December–March and June), local upwelling phenomenon occurs, the surface water temperatures decrease until 20 °C and increases the salinity up to 38 PSU [35]. From April to June and August to November, upwelling disappears, the surface water temperature increases up to 29 °C, and salinity has values near 34 PSU [35]. Arroyave et al. [34] confirmed the existence of two distinct water masses distinguished by their salinity and temperature properties, which determine the occurrence of upwelling (December–March and June) and non-upwelling (April–June and August–November) conditions. During non-upwelling, stratification occurs and a thermocline of up to 12 m of thickness may be present; this study found that during the non-upwelling season, there were significant decreases in the concentrations of ammonium (NH4+), phosphate (PO43−), and dissolved oxygen (DO), with average reductions of 460%, 3%, and 7%, respectively. Conversely, the concentrations of nitrate and nitrite (NOx) and total phosphorous (TP) were found to increase by 25% and 14%, respectively, during this season. Furthermore, the average concentration of chlorophyll–a (Chl–a) near the discharge plume was found to decrease by 59% between the two seasons, with higher values observed during the non-upwelling season [34].
The Lagrangian formulation is employed in the modeling of submarine outfall discharge to capture the behavior of buoyant fluid discharge. This approach tracks fluid parcels and enables the examination of different forms of discharge, including continuous jets and the release of a finite amount of fluid in both stratified and unstratified environments, with flowing and stationary conditions. The modeling process using the Lagrangian formulation begins with selecting the source shape and the initial conditions, such as the outfall configuration, discharge fluid density, flow rate through the outlet, and outlet size. Subsequently, the velocity and density of the ambient fluid at the discharge depth are determined. Frequently, the entrainment function is calculated from the variables associated with the ambient and buoyant fluids, and the system of differential equations is solved at each time step using the fourth-order Runge–Kutta algorithm. The results are progressively integrated from the source until the buoyant fluid reaches its level of neutral buoyancy, which may be the surface of the ambient fluid [23].
By utilizing the Boussinesq approximation, the vertical momentum and buoyancy fluxes are determined through the z–momentum and buoyancy conservation equations, independent of the buoyant fluid shape and entrainment. The results provide estimates of the rise, thickness, and dilution of the buoyant fluid at each time step and at the level of neutral buoyancy [24]. The PLUME3 model formulated by Tate [23] was used; its source code was rewritten in MATLAB (2020a MathWorks, USA) and coupled to a 3D hydrodynamic model for accepting sea current fields, temperature, and salinity in the water column. The coupling between these two models was unidirectional and did not include any feedback mechanism. The RMA10 model was run first, and its results were used to prepare an input file to feed the PLUME3 model that reads these inputs and calculates the entrainment function and plume characteristics. An interface in MATLAB was used for this purpose. For this, it uses an internal time step t = 0.5 s. For each of them, it verifies whether the buoyant fluid has moved to the upper layer. H increases progressively until a neutral buoyancy level is found or until the plume rises to the surface. When this happens, new environmental condition data are obtained from the results of the RMA10 model, and the process is repeated. The discharge conditions (flow, density, number of diffusers, type of discharge, length occupied by the diffusers, depth, and discharge velocity) can also vary over time. It was found necessary to include a subroutine that verifies if the time (seconds) that the PLUME3 model takes to simulate the plume conditions is less than the temporal rate of the results of the RMA10 model (300 s), in which case it allows the PLUME3 model to take the next set of environmental information. If the plume takes more than 300 s to reach its neutral buoyancy level or rise to the surface, the subroutine interpolates between the next two sets of environmental condition data to supply the new input to the PLUME3 model.
The PLUME3 model has been calibrated and validated for several conditions, including field and laboratory experimentation by Tate [23]. Recently, a new updated version has been used in other studies under the name of Primary Lagrangian Ocean Outfall Model (PLOOM3) [36]. The results of the PLUME3 model show the trajectory, extension, and shape of the plume, as well as its level of entrapment or arrival at the surface. It solves the equations for mass and momentum conservation in a Lagrangian scheme, including conservation of buoyancy, to estimate the initial dilution [36,37,38]. Two versions of the PLUME3 model were rewritten in MATLAB to consider dilution with and without waves.

2.2. Hydrodynamic Model

The ocean hydrodynamic model RMA10 was employed to study the state variables, pressure, and velocity distributions in the oceanic system. The model is based on a set of equations that combine the Navier–Stokes equations, mass conservation principles, advection–diffusion, and state equations relating density, salinity, temperature, and suspended sediments [39]. The RMA10 model solves for the free surface levels and horizontal velocity components for subcritical flow in three-dimensional oceanic fields. The hydrodynamic equations were solved using the finite element method in conjunction with the Galerkin weighted residual method. In this approach, quadratic shape functions were utilized to represent the velocity field, while linear functions were used to describe the depth distribution. The spatial integration was carried out through Gaussian quadrature. The fully implicit solution was obtained through the nonlinear Newton–Raphson iteration method. The solution algorithm was implemented through a frontal solution approach that partitions the solution matrix and couples the already-resolved parts to the current part of the matrix [39,40]. The temporal discretization of the non-stationary regime was performed through the modified Crank–Nicholson method, using Gauss quadrature for the spatial integration [39,40,41]. The governing differential equations, in their differential form in Cartesian coordinates, are presented in Equations (8) to (13). Bottom friction, Coriolis effects, and wind-induced stress on the water surface have also been included in the model.
The equations of movement in the three components of the cartesian field are shown by Equations (8)–(10):
ρ . u t + u u x + v u y + w u z x ε x x u x y ε x y u y z ε x z u z + p x Γ x = 0 ,
ρ . v t + u v x + v v y + w v z x ε y x v x   y ε y y v y z ε y z v z + p y Γ y = 0 ,
ρ . w t + u w x + v w y + w w z x ε z x w x y ε z y w y z ε z z w z + p z + ρ . Γ z = 0
The continuity equation is presented in Equation (11):
u x + v y + w z = 0
Advection–diffusion processes are presented in Equation (12):
s t + u s x + v s y + w s z x D x s x y D Y s y z D z s z θ s = 0 ,
Additionally, the equation of state is presented in Equation (13):
ρ = F s
where x, y, and z are the coordinates of the Cartesian system; u , v , and w are the velocities in the directions of the Cartesian system; p is the water pressure; t is time; ε x x ,   ε x y ,   ε x z ,   ε y x ,   ε y y ,   ε y z ,   ε z x ,   ε z y ,   ε z z are the eddy turbulence coefficients; g is the acceleration due to gravity; D x , D Y , and D z are the eddy diffusion coefficients; ρ is the density of water; Γ x , Γ y , and Γ z are the external forces; s is the salinity; and θ s is the salinity source/sink.
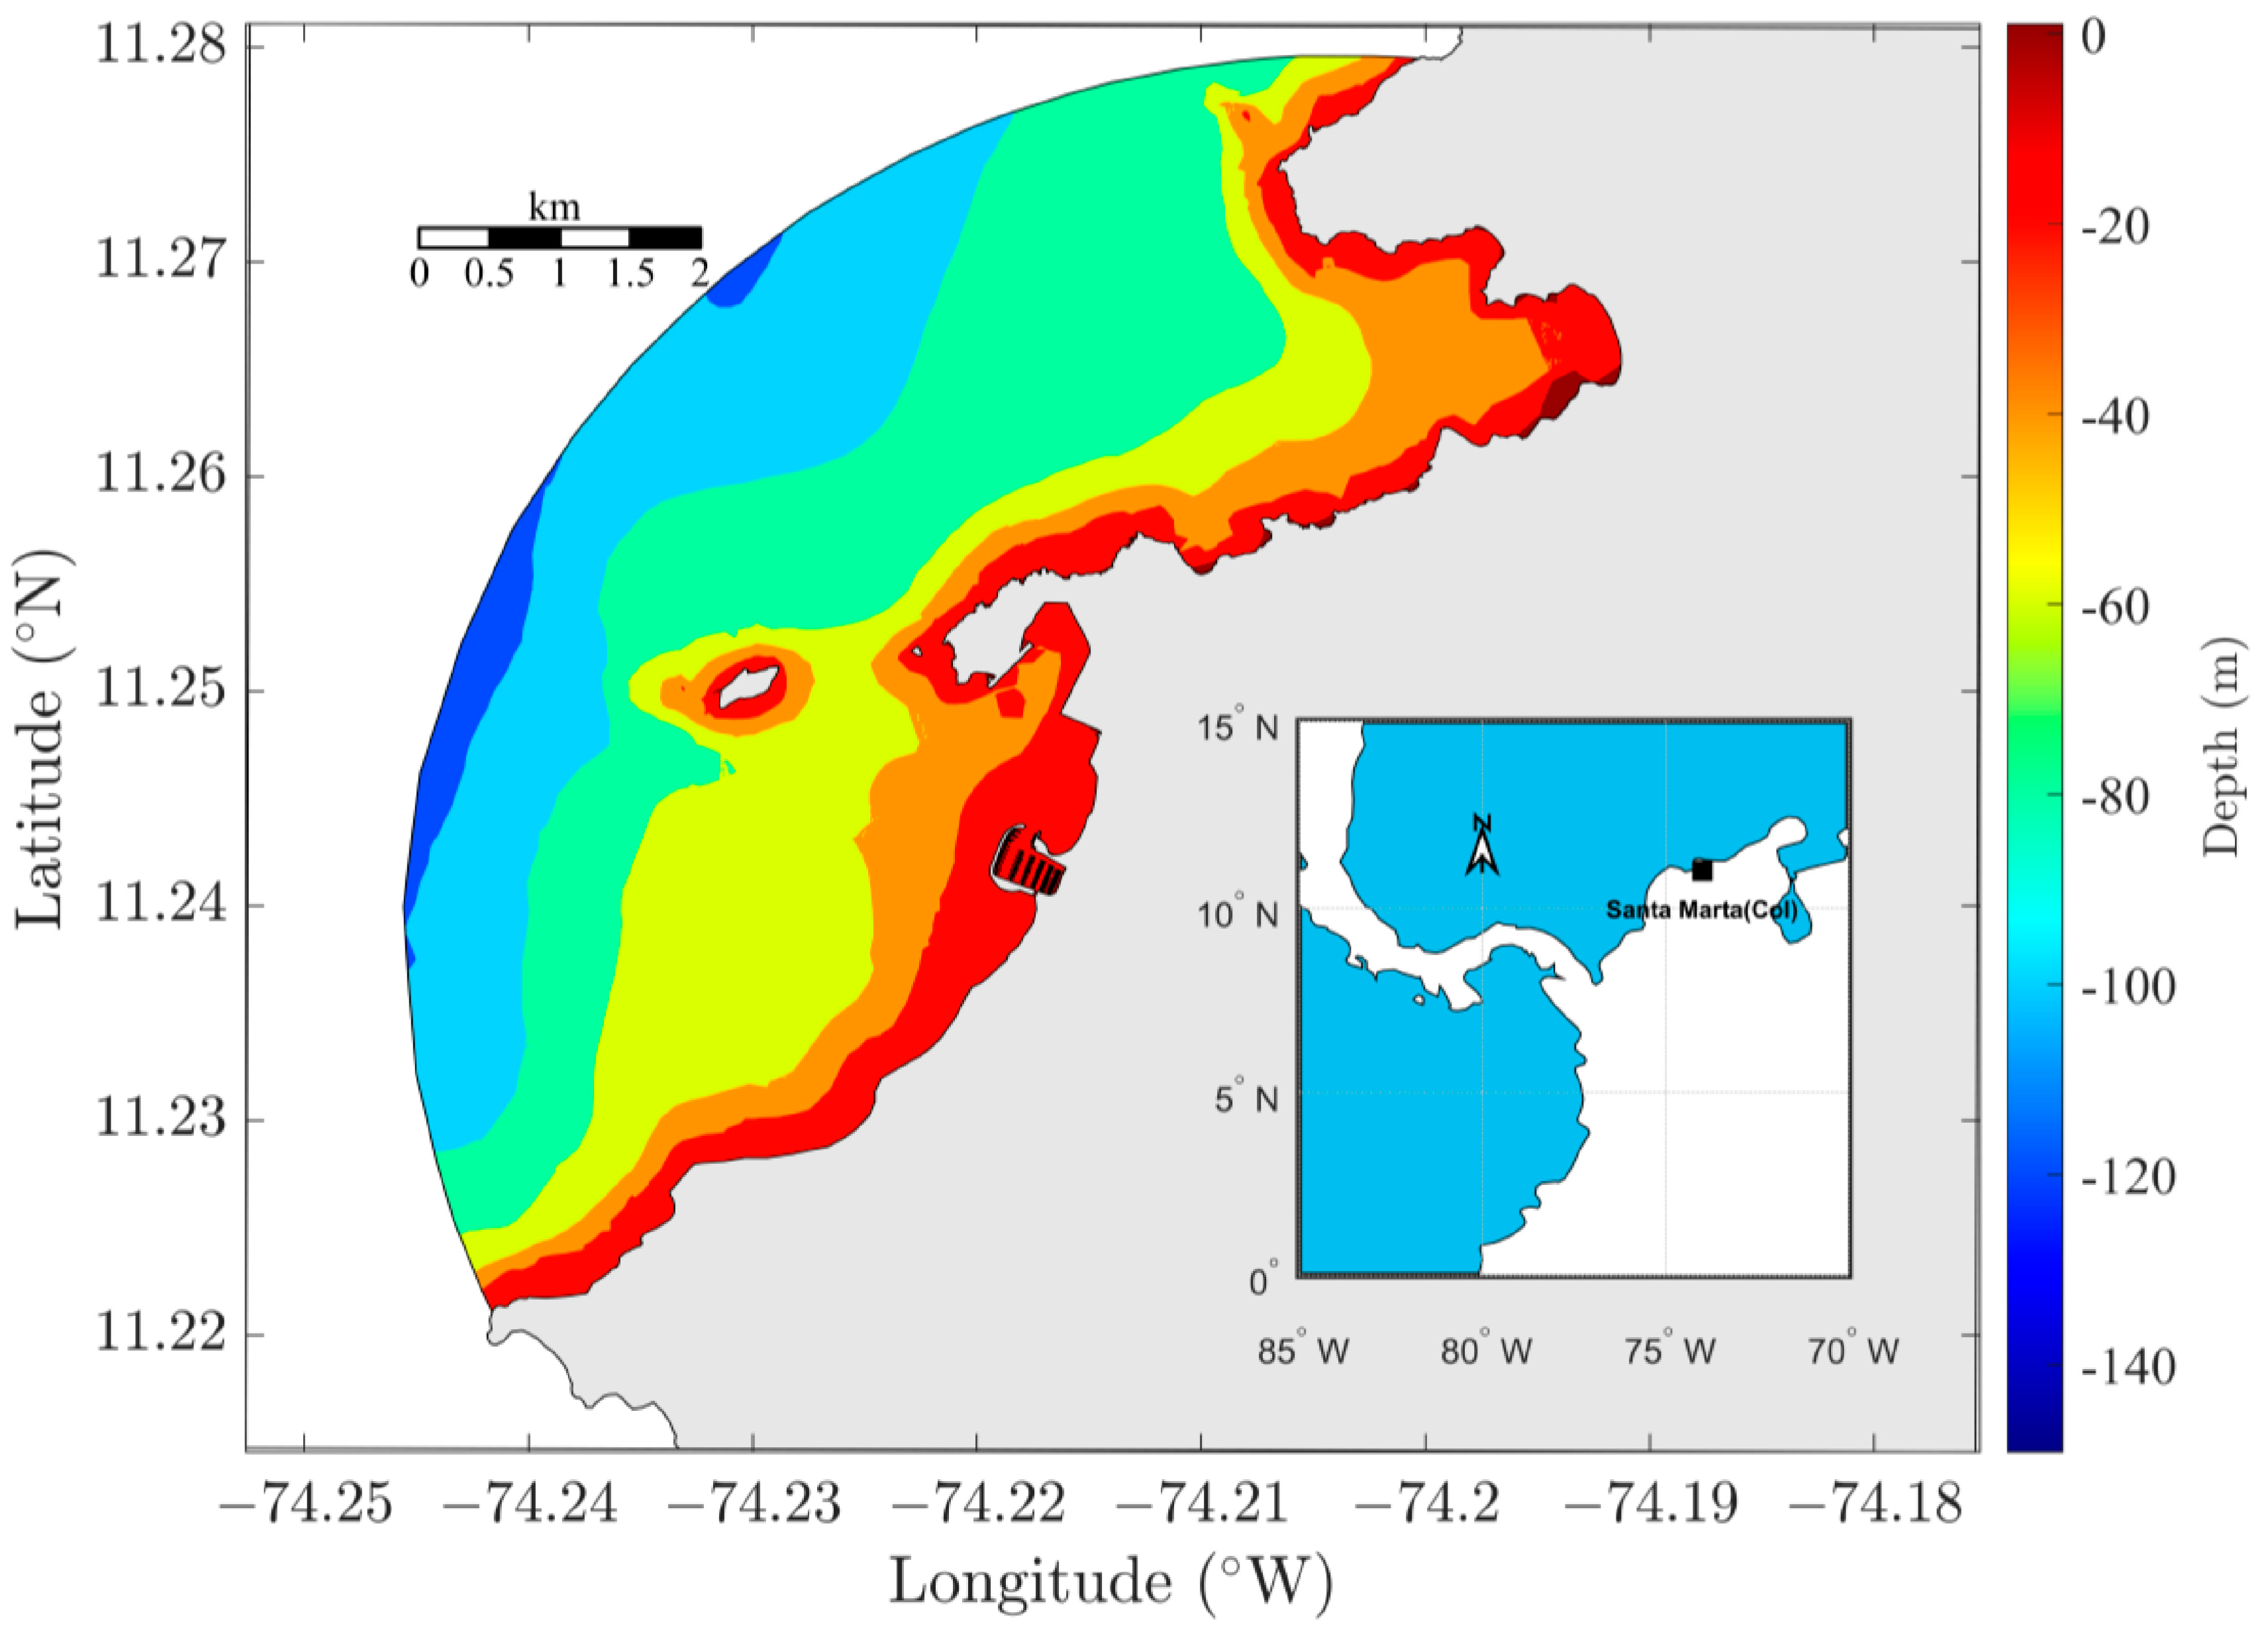
The mesh used consisted of 3694 elements and 10 layers in the vertical and was built using the MESH2D software in MATLAB (Figure 3). The sizes of the elements range from 10 to 500 m in length, with the smallest ones being found in enclosed borders and the largest ones in open borders. The interpolated bathymetry within the simulation domain is depicted in Figure 4. The bathymetry was extracted from the COL406 and COL244 nautical charts of the Oceanographic and Hydrographic Research Center (CIOH) of Colombia.
The RMA10 model has been in use since 2009 and has been previously applied within the same simulation domain [40,41,42]. However, a recent calibration and validation effort was conducted using updated data from 2019. The calibration and validation of the model were carried out through current and tide measurement campaigns, which took place from 1 to 31 January 2019 and 1 to 31 October 2019, respectively. Two monitoring stations were established to collect the necessary data. The first station, located at 74.220° W and 11.240° N, was used to gather current data (RCM). The second station, located at 74.222° W and 11.235° N and corresponding to 738A station of the University of Hawaii Sea Level Center (UHSLC) data, was used to gather surface water level data (WLR). Both stations are depicted in Figure 1. To measure current, an AANDERAA RCM9 LW (0 to 300 cm/s) device was deployed at a depth of 10 m, and was set to take data every 15 min. Tidal data are available in hourly format at “https://uhslc.soest.hawaii.edu/stations/?stn=738#levels (accessed on 1 October 2022)”. The open boundary was forced with current, water level, salinity, and temperature data from the HYCOM global model. Wind fields on the ocean surface, used to force the model and simulate wave height and period, were obtained from the NCEP/NCAR reanalysis from the National Oceanic and Atmospheric Administration (NOAA) Climate Data Center. The NCEP/NCAR reanalysis data tends to underestimate lower wind speeds, although it does accurately represent their direction, due to its coarse spatial resolution of 2.5 × 2.5 degrees and temporal resolution of 6 h [43]. To address this issue, a correction factor ( K ) dependent on wind speed intensity W has been introduced as recommended by Simonato et al. [43] (Equation (14)). The objective of this factor is to double the values of very low wind intensities while keeping higher intensities unchanged. The values of K are in the range of 1 and 2, with the higher value being applied to the lower wind intensities.
K = 1 +   exp W 2   m / s
A long-term monitoring campaign was conducted to validate the temperature and salinity conditions in the ocean near the diffusers of the Santa Marta submarine outfall. The measurement station, referred to as CTD1, is shown in Figure 1. Measurements were taken monthly from January to December 2021 using a SonTek CastAway–CTD instrument, which has a temperature accuracy of 0.05 °C and salinity accuracy of 0.1 PSU. The spatial and temporal coincidences of the measurement station and the model results were carefully considered to ensure comparable results. The analysis was performed using RMAVIEWER licenses; the methodology involved identifying the model point closest to the measurement location and using it to determine the model results. The accuracy was evaluated using the Normalized Mean Absolute Error (NMAE), as defined by Equation (15) in previous studies [34,44].
N M A E = i = 0 n P i O i n O ¯
where P i is the simulated variable, O i is the observed variable, O ¯ is the average observed value, and n is the number of observations. A value of zero indicates a perfect agreement between the predicted and measured [44].
Equations (16) and (17) were used for determining the height of waves ( H ) and the period ( T ) as a function of wind velocity ( U w i n d ), depth of water column ( h w a t e r ), Fecth ( F ), and gravity acceleration ( g ) [45].
g H U w i n d 2 = 0.283 t a n h 0.530 g h w a t e r U w i n d 2 3 / 4 t a n h 0.00565 g F U w i n d 2 1 / 2 t a n h 0.530 g h w a t e r U w i n d 2 3 / 4
g T U w i n d = 7.54 t a n h 0.833 g h w a t e r U w i n d 2 3 / 8 t a n h 0.0379 g F U w i n d 2 1 / 3 t a n h 0.833 g h w a t e r U w i n d 2 3 / 8
To analyze the behavior of the submarine outfall discharge and quantify the impact of waves, a one-year simulation period (2021) was conducted. Two runs were performed as follows: the first without waves and the second including surface waves. The wave effects were quantified using the methodology outlined by Niu [24].

3. Results

3.1. Calibration and Validation RMA10 Hydrodinamic Model

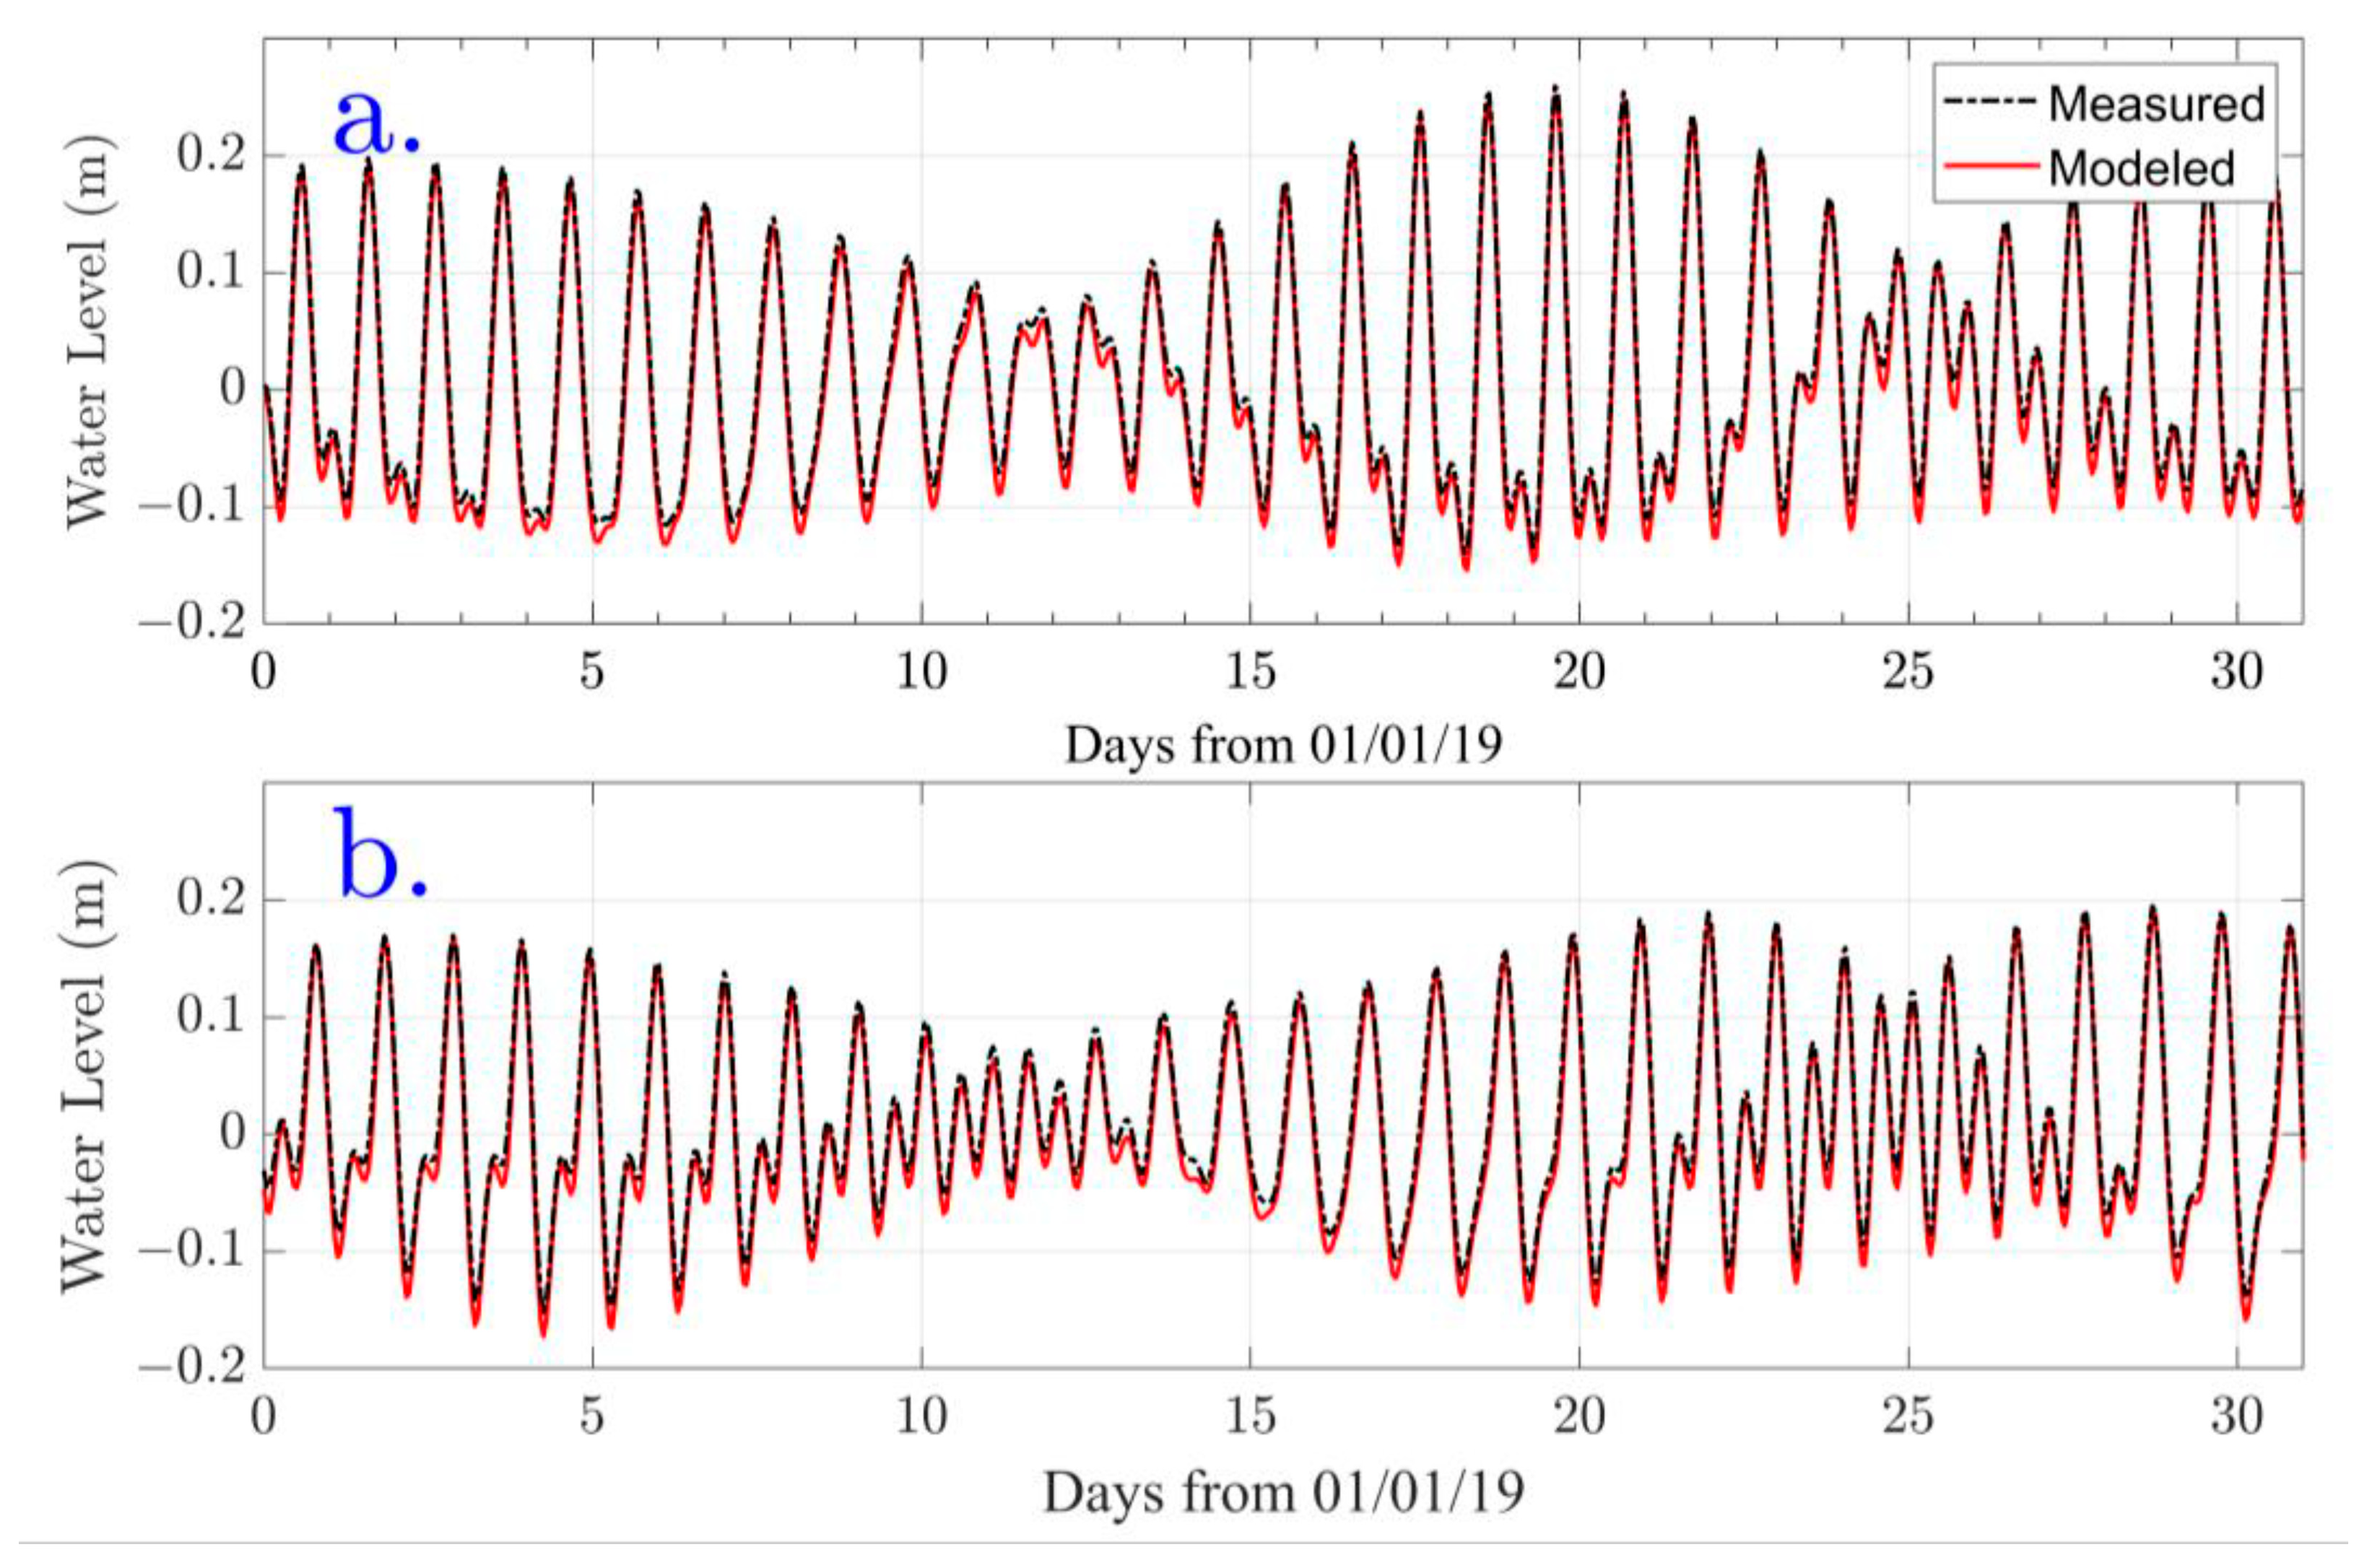
The results of the calibration and validation efforts indicate a strong agreement between the field measurements and the model predictions of water surface levels, as demonstrated in Figure 5. NMAE values of 0.002 were obtained by comparing the measured and simulated data from 1 to 31 January 2019, and 0.001 from 1 to 31 October 2019. These results demonstrate the effectiveness of the modeling approach.
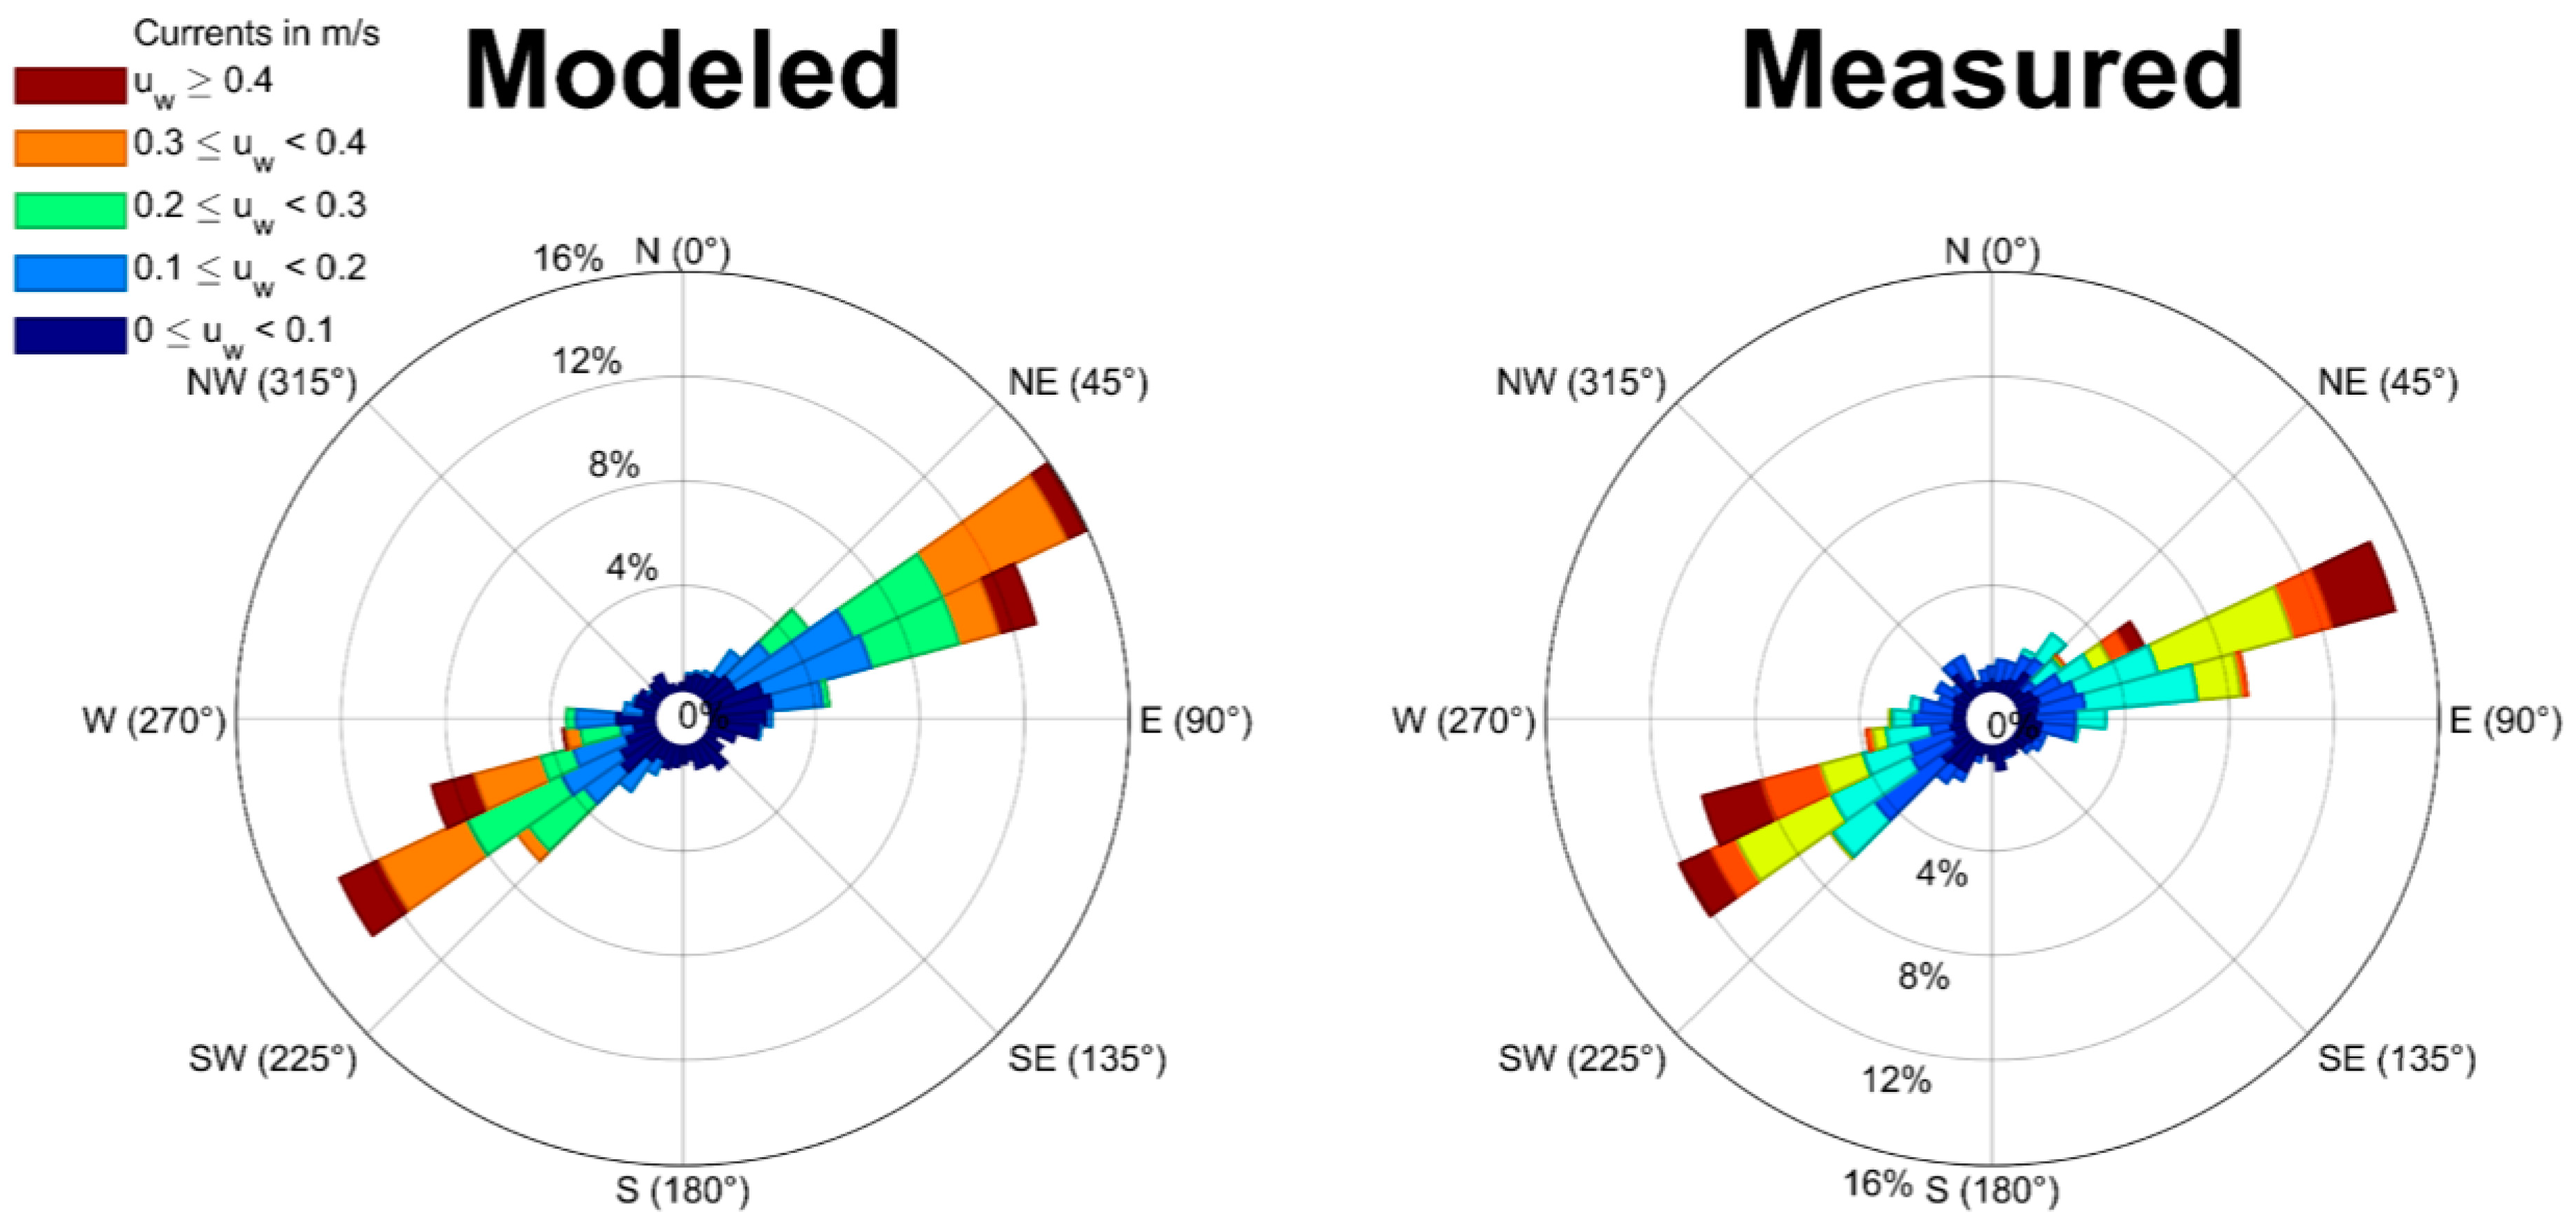
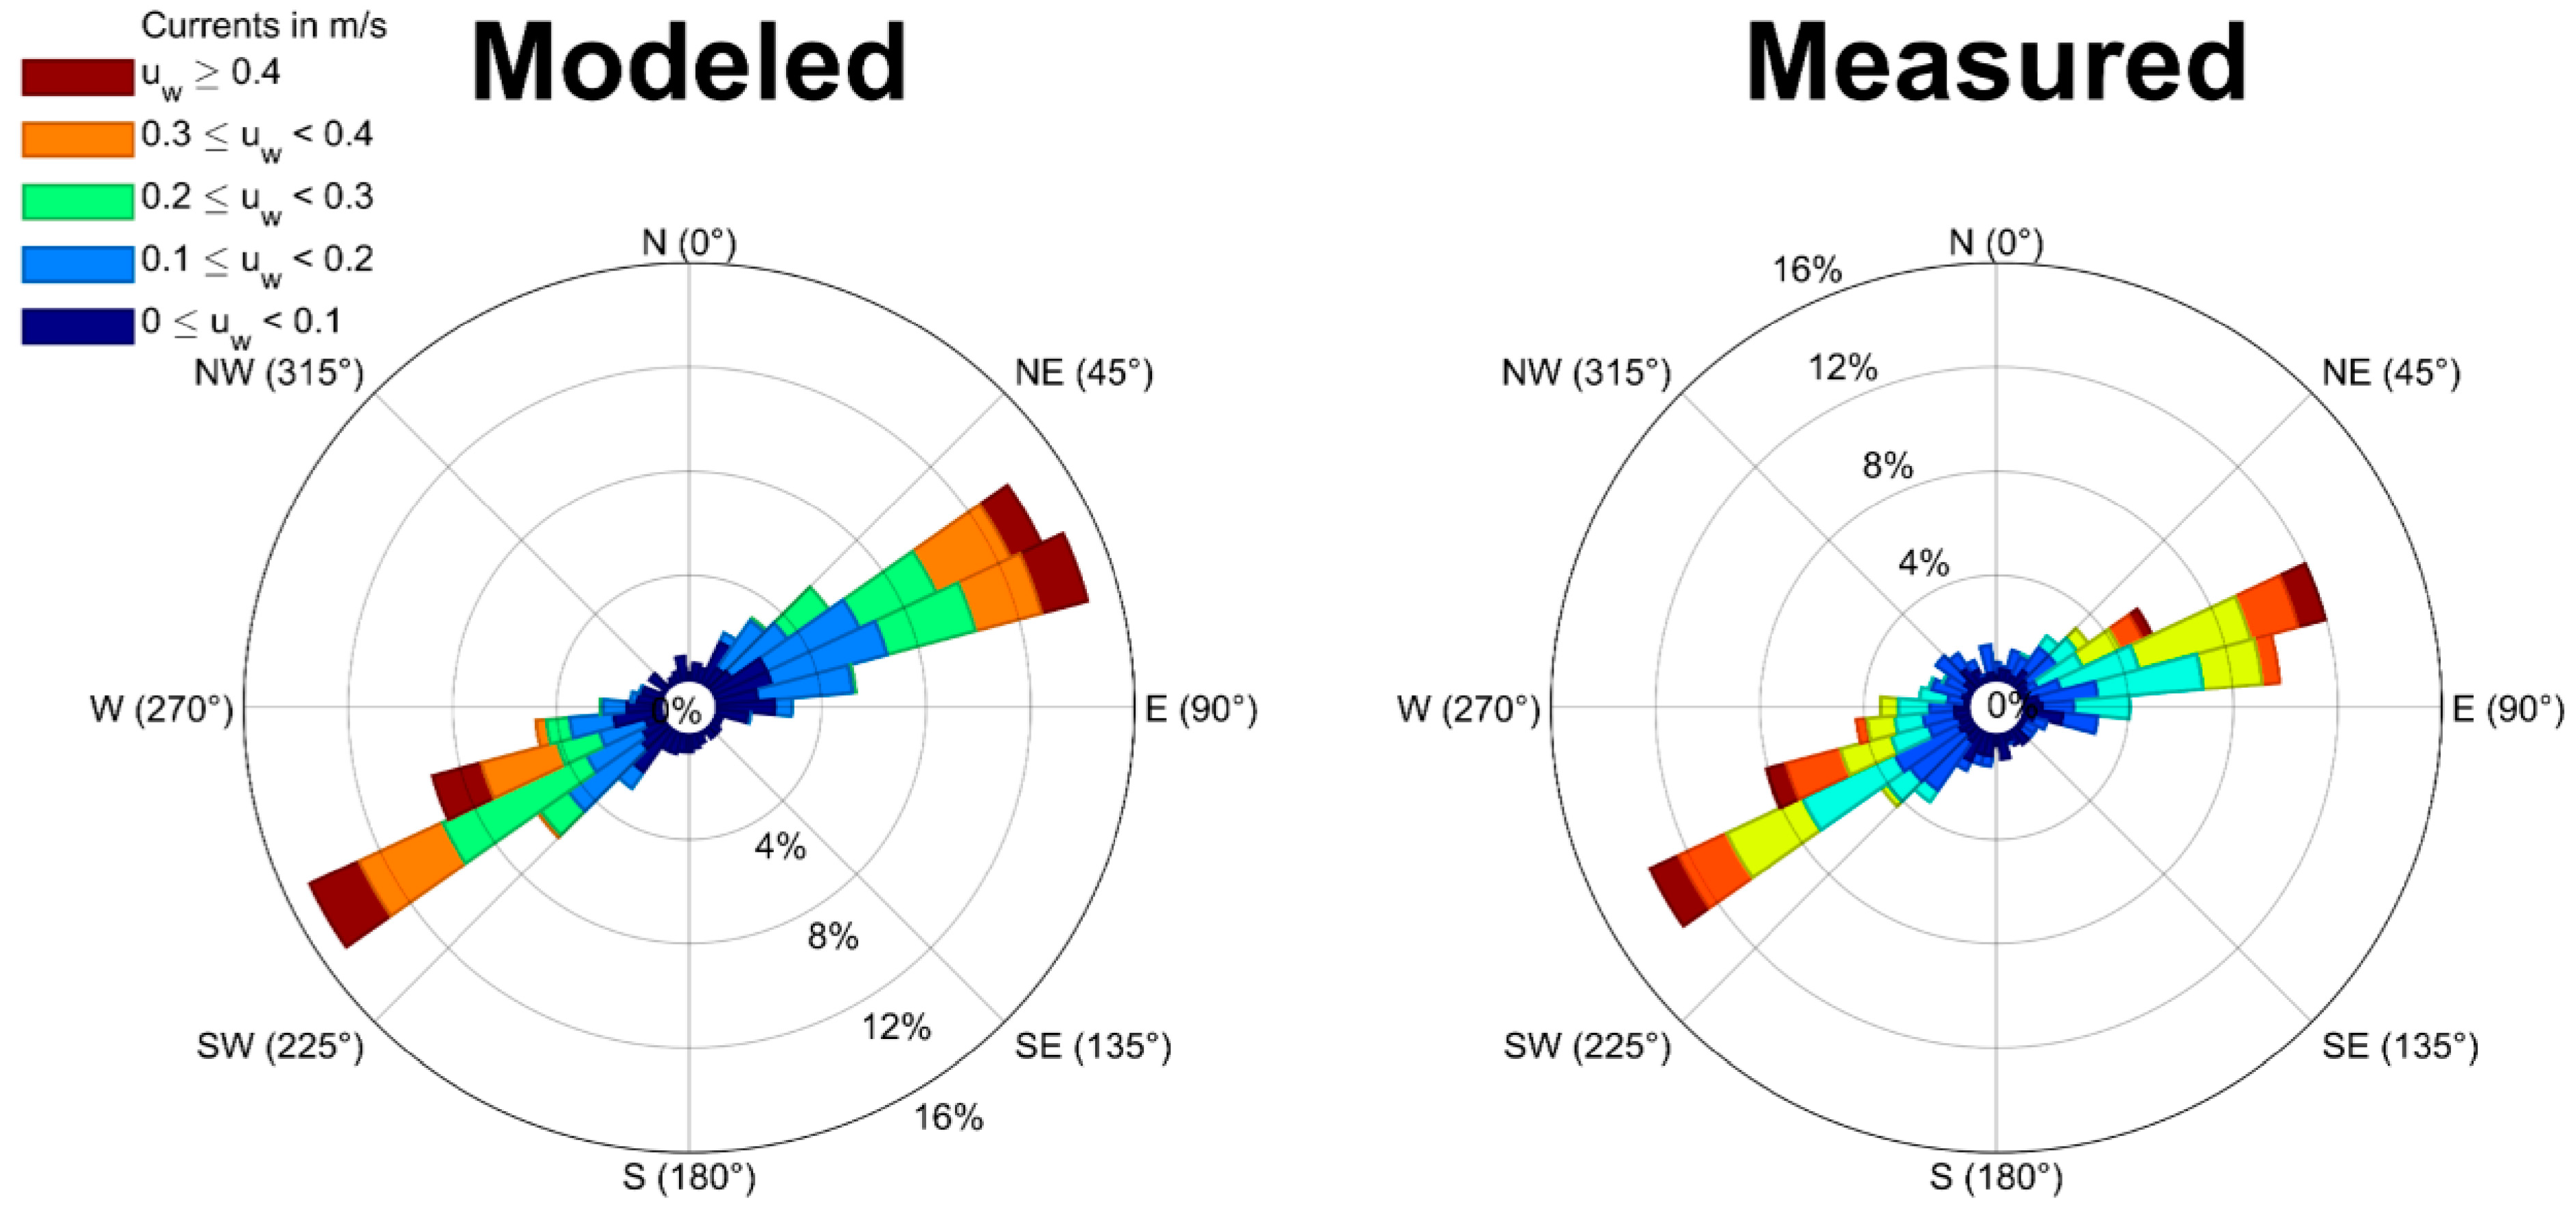
A similar behavior was observed in the model when reproducing the field measurements for current direction and velocity during the calibration and validation periods. An average error magnitude (NMAE) of 0.09 m/s was obtained from 1 to 31 January 2019, with a current magnitude and direction of 4.4 degrees during calibration. For the validation period from 1 to 31 October of the same year, values of 0.06 m/s and 7.4 degrees were reported. These results are supported by the graphical comparison of the current roses for the measured and simulated data during calibration and validation, as shown in Figure 6 and Figure 7, respectively.
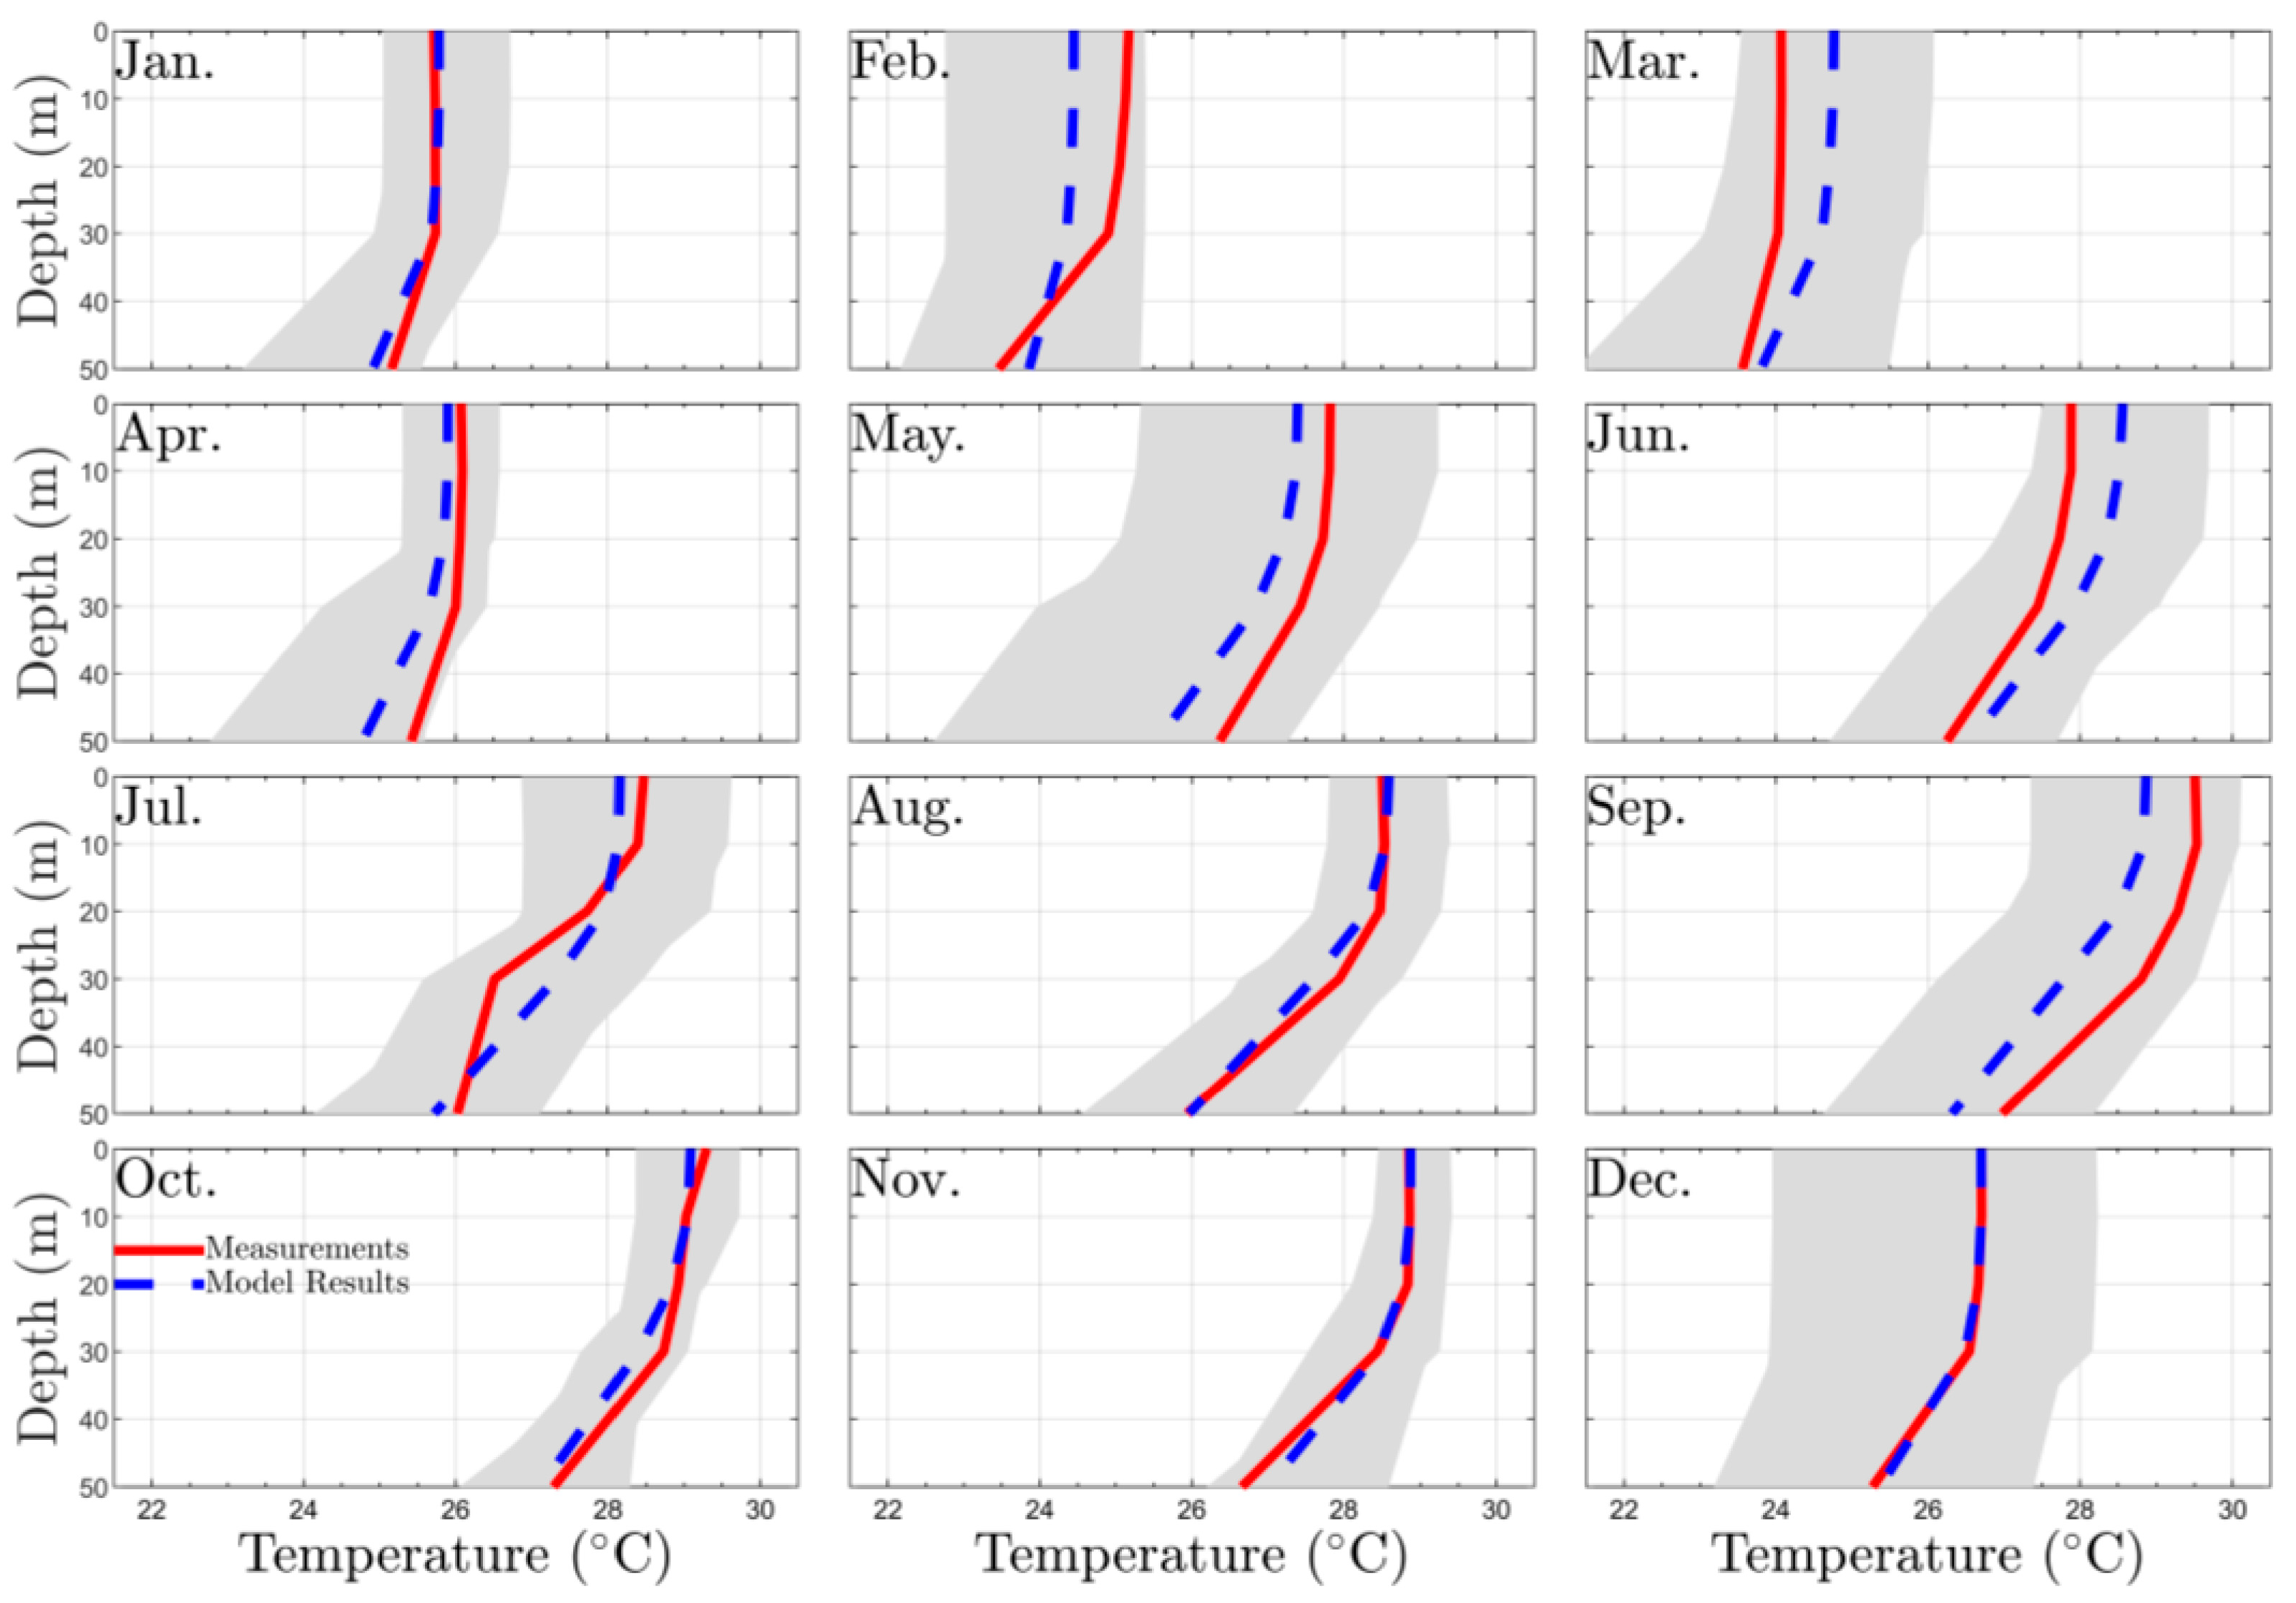
The simulated temperature profiles generated by the RMA10 model showed good agreement with the temperature measurements obtained using a CTD sensor. A comparison of the simulated and measured temperature profiles is shown in Figure 8 for each month of the year, demonstrating that the model accurately captures the temperature conditions at the location of the diffusers. In the figure, the blue dashed line and red continuous line represent the comparison of the model results and the CTD measurements profiles at 12 GMT on the 15th of each month, respectively. The shaded areas show the range of the model results for each corresponding month. The model results indicate that the temperature ranges between 23 °C and 28 °C.
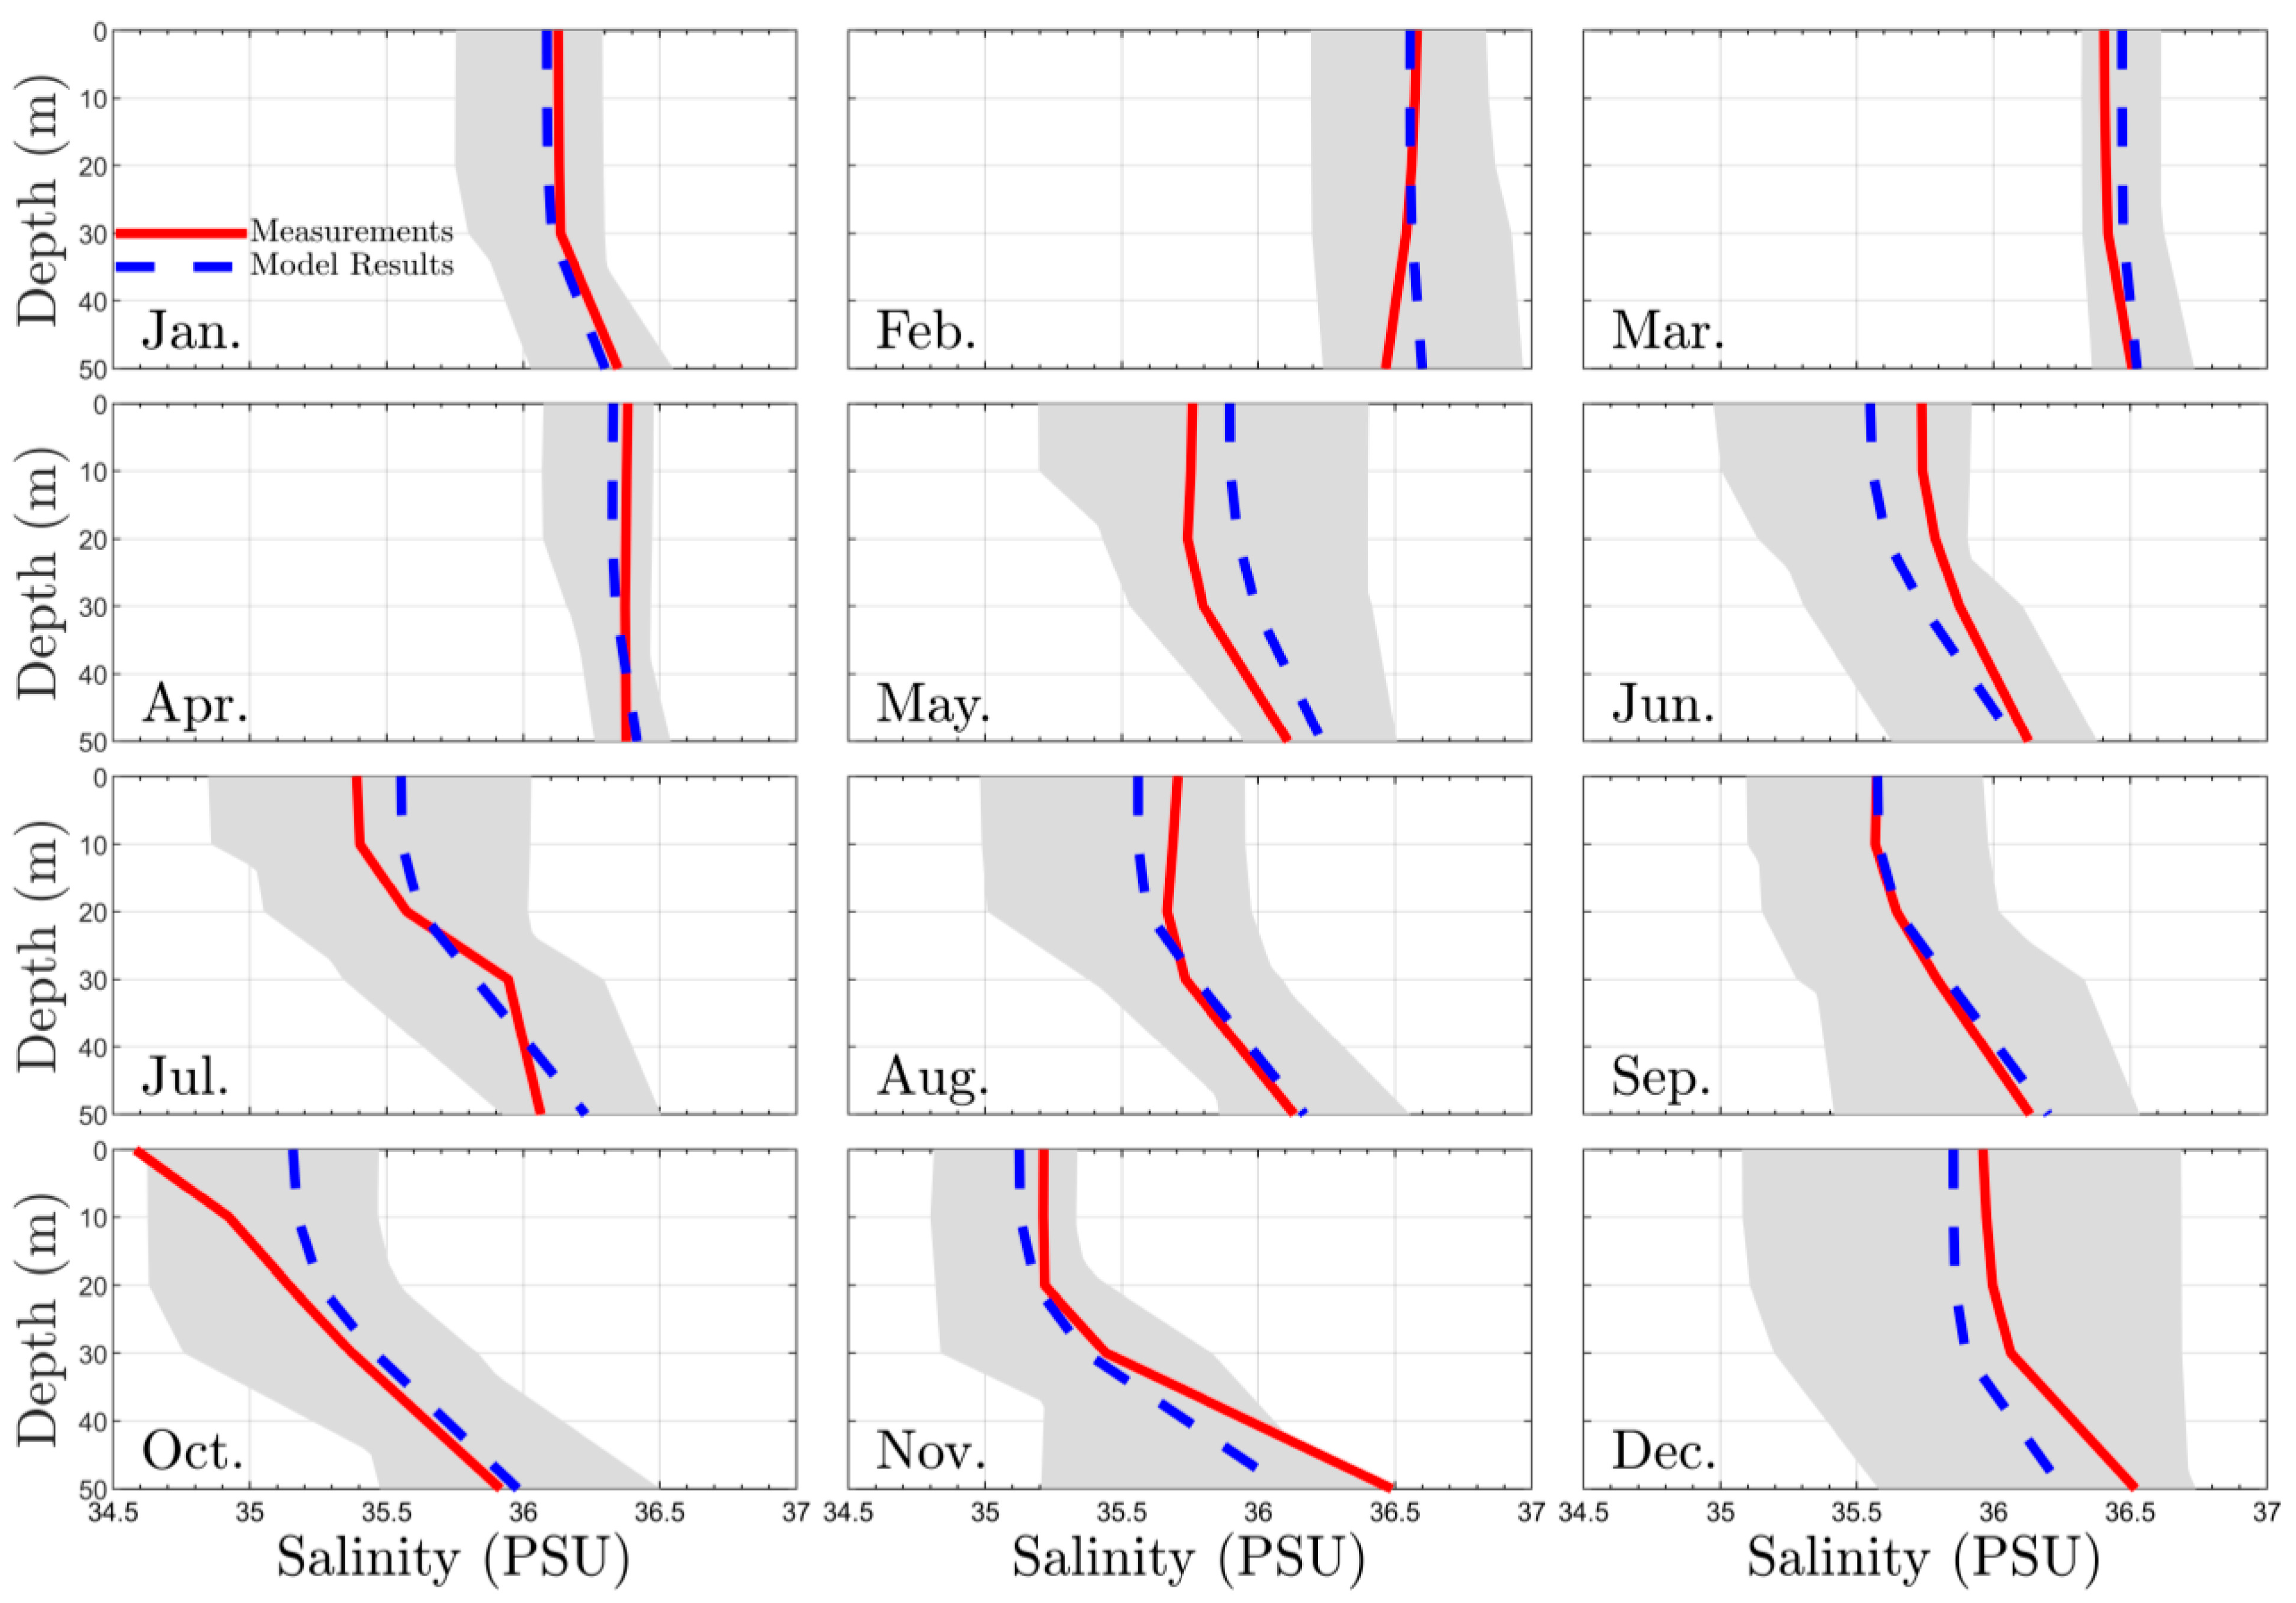
The salinity values ranged from 35.07 to 36.74 PSU according to the RMA10 model results. The comparison between these data and the results of the monthly measurement campaigns shows good agreement for the profiles in the water column (Figure 9). Consequently, the model results can be used to predict thermohaline conditions in SMCA. The validation of the model for temperature and salinity is confirmed by the NMAE values, which were found to be very close to zero when evaluating the error between the model results and field measurements. Table 1 shows the NMAE estimates for comparing the results of the RMA10 model and field measurements.

3.2. Wave Effects on the Initial Dilution of Santa Marta’s Submarine Outfall

The initial dilution model results (PLUME3) show the extension, elevation, and dilution of the plume as it rises from the diffusers of the submarine outfall to the surface or trapping depth. The outfall flow generates a velocity difference between the discharge and the environment, resulting in strong shear action. The density difference between the untreated wastewater (which has a density similar to fresh water) and the seawater causes the plume to rise due to buoyancy. The shear region at the interface of the jet and the environment grows rapidly, defining the plume characteristics such as orientation and dilution. Currents act as additional mixers, gradually deflecting the jet towards their flow direction and increasing mixing. Meanwhile, the stratification of the environment can cause changes in the density difference, potentially confining the effluent within a specific level of the water column. The slow ambient velocities and high density of coastal ocean water (with an average of approximately 1024 kg/m3) contrast with the faster discharge velocities (usually 1–4 m/s) and lower density of untreated sewage (around 1000 kg/m3). This creates a turbulent and buoyant jet with significant momentum [46].
The PLUME3 model simulation process consists of the following steps: (1) selection of starting conditions, including discharge configuration, fluid density, flow rate, and outlet size, (2) determination of ambient fluid velocity and density at the depth of discharge, (3) calculation of the entrainment function based on variables related to the ambient and buoyant fluids, (4) application of the fourth-order Runge–Kutta algorithm at each time step to solve the system of differential equations, (5) integration of the results from each time step until the buoyant fluid reaches its level of neutral buoyancy, and (6) monitoring at each time step to determine if the buoyant fluid has entered a new layer, in which case the process repeats from step 3 to 6. This enables the calculation of the rise, thickness, and dilution of the buoyant fluid at each time step and at the level of neutral buoyancy [23]. The simulation results obtained from the Plume3 model indicate that, on average, it takes 378 time steps or 189 s for the plume to reach the surface. One iteration is performed by the model every 0.5 s. The arrival of the plume at the neutral buoyancy levels, which are located at the average depth of the water column, takes an average of 54 s or 108 time steps to be detected.
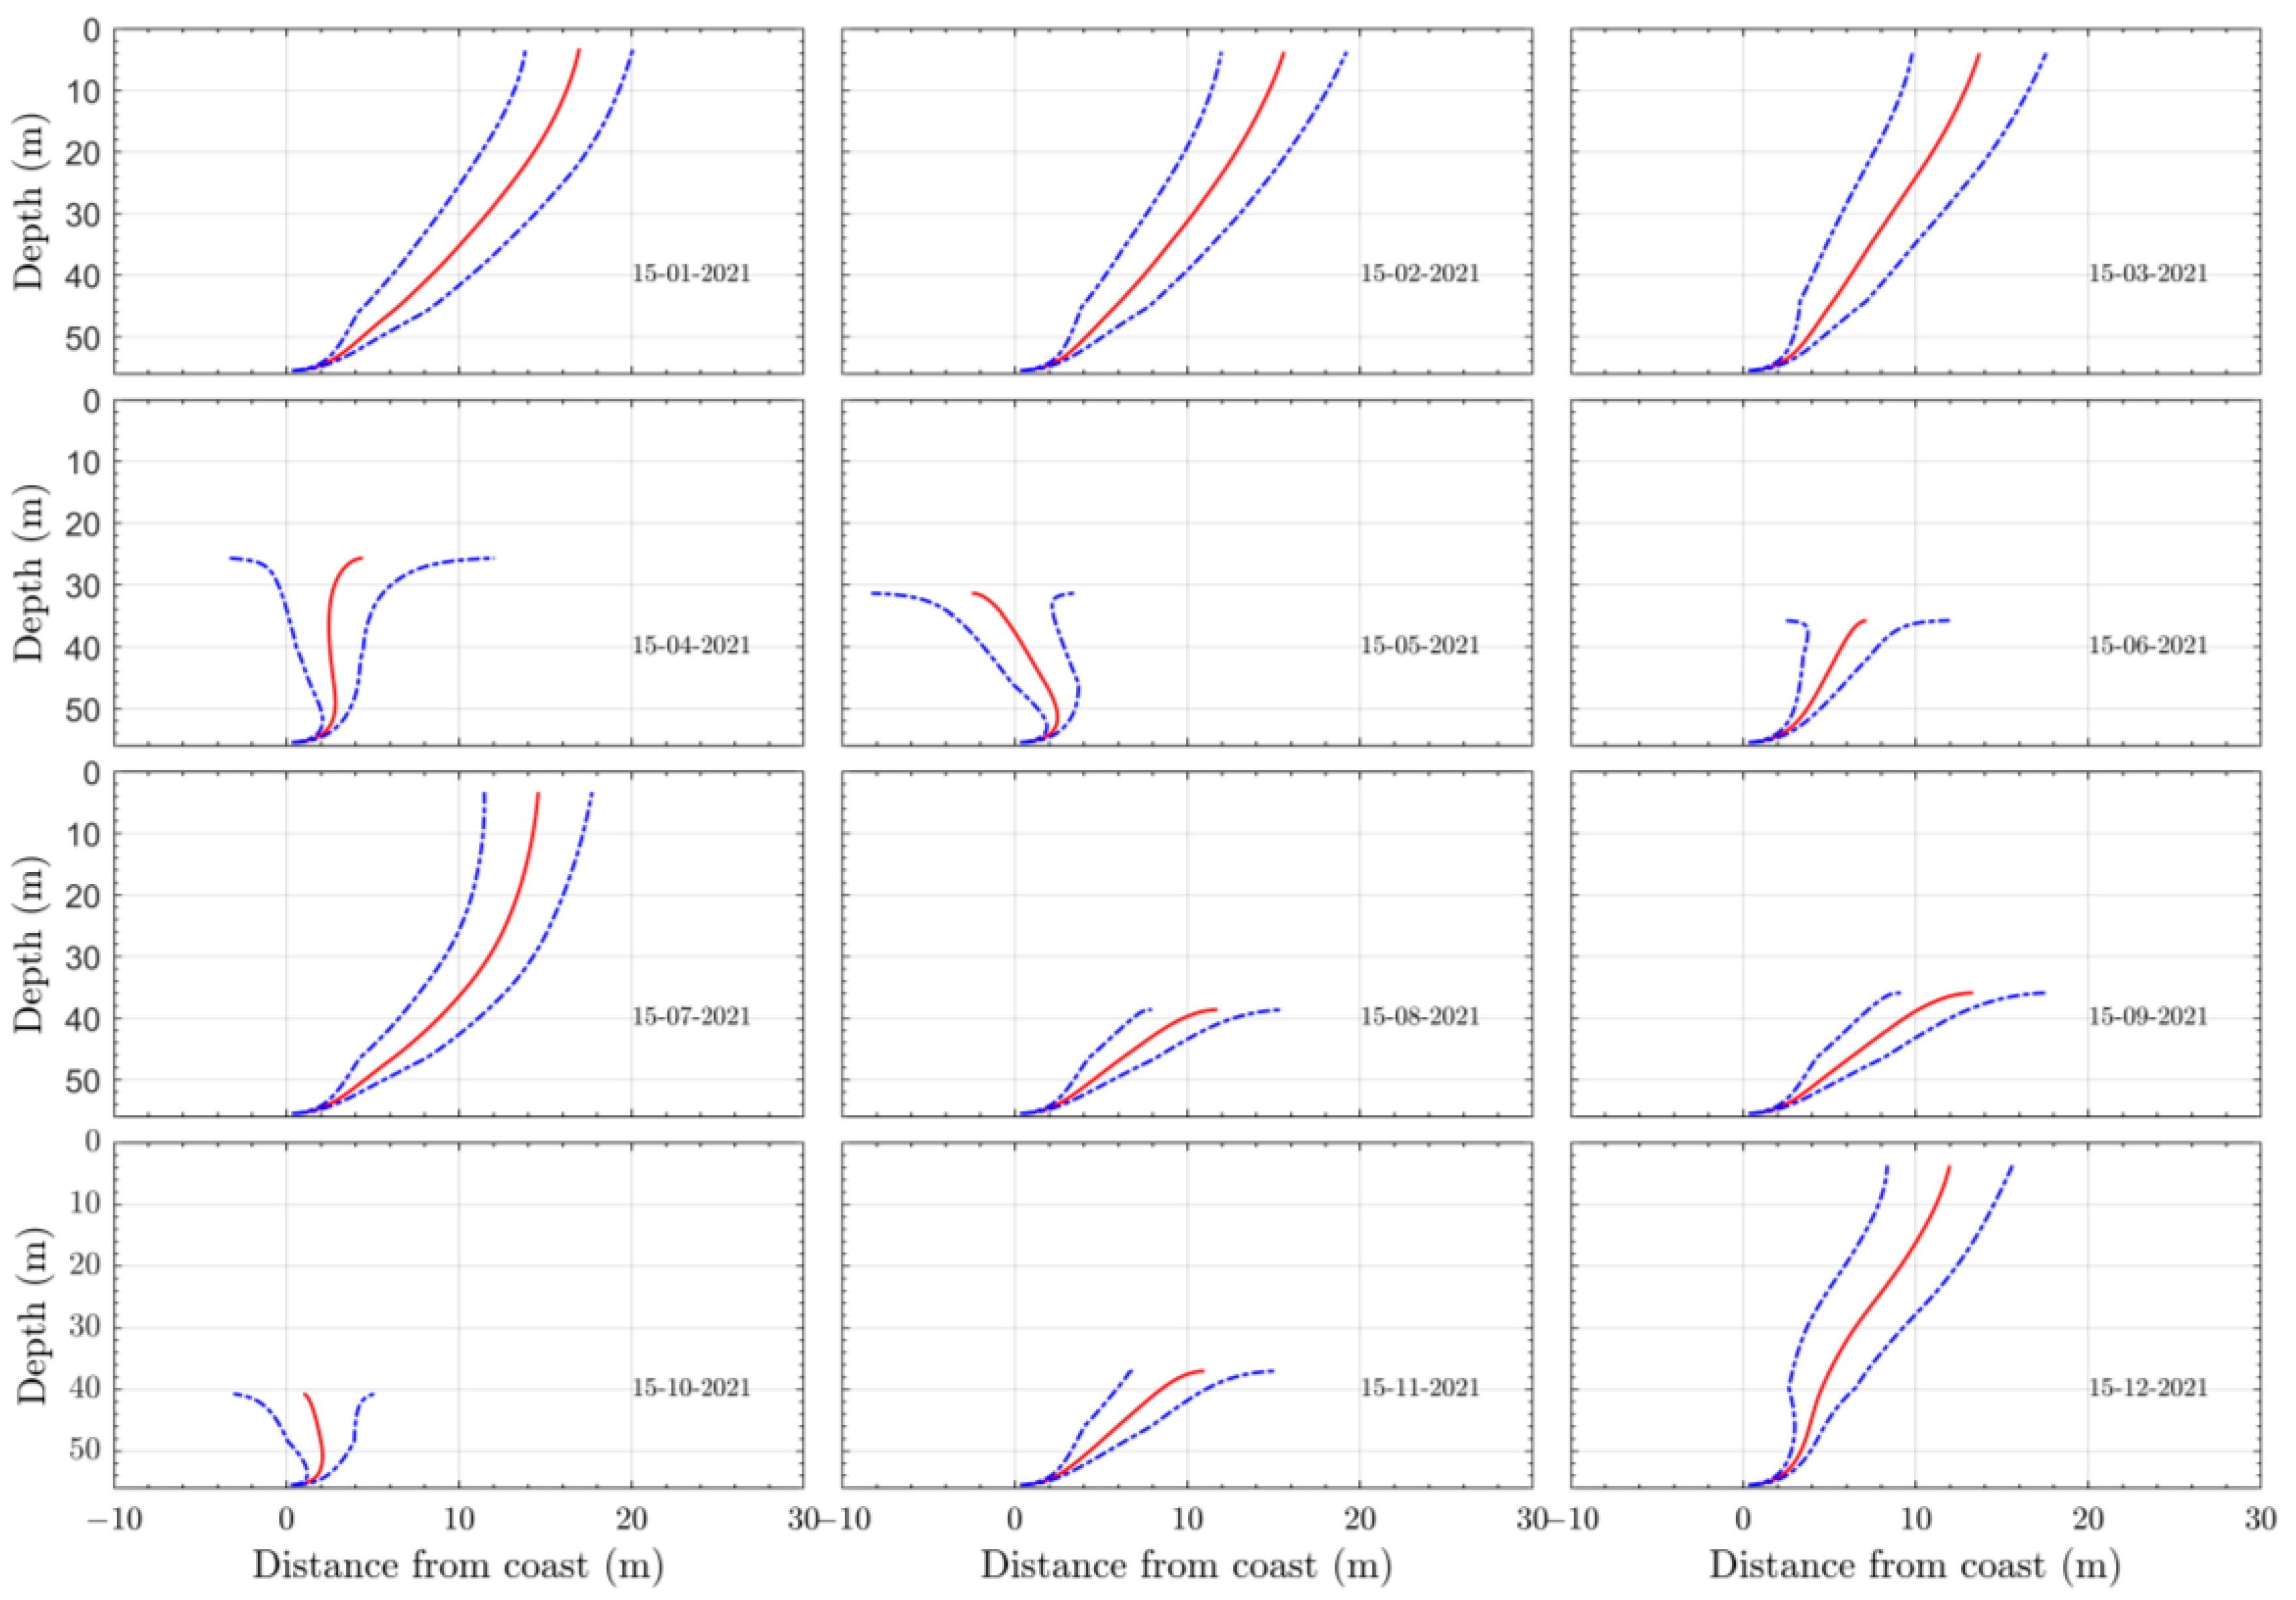
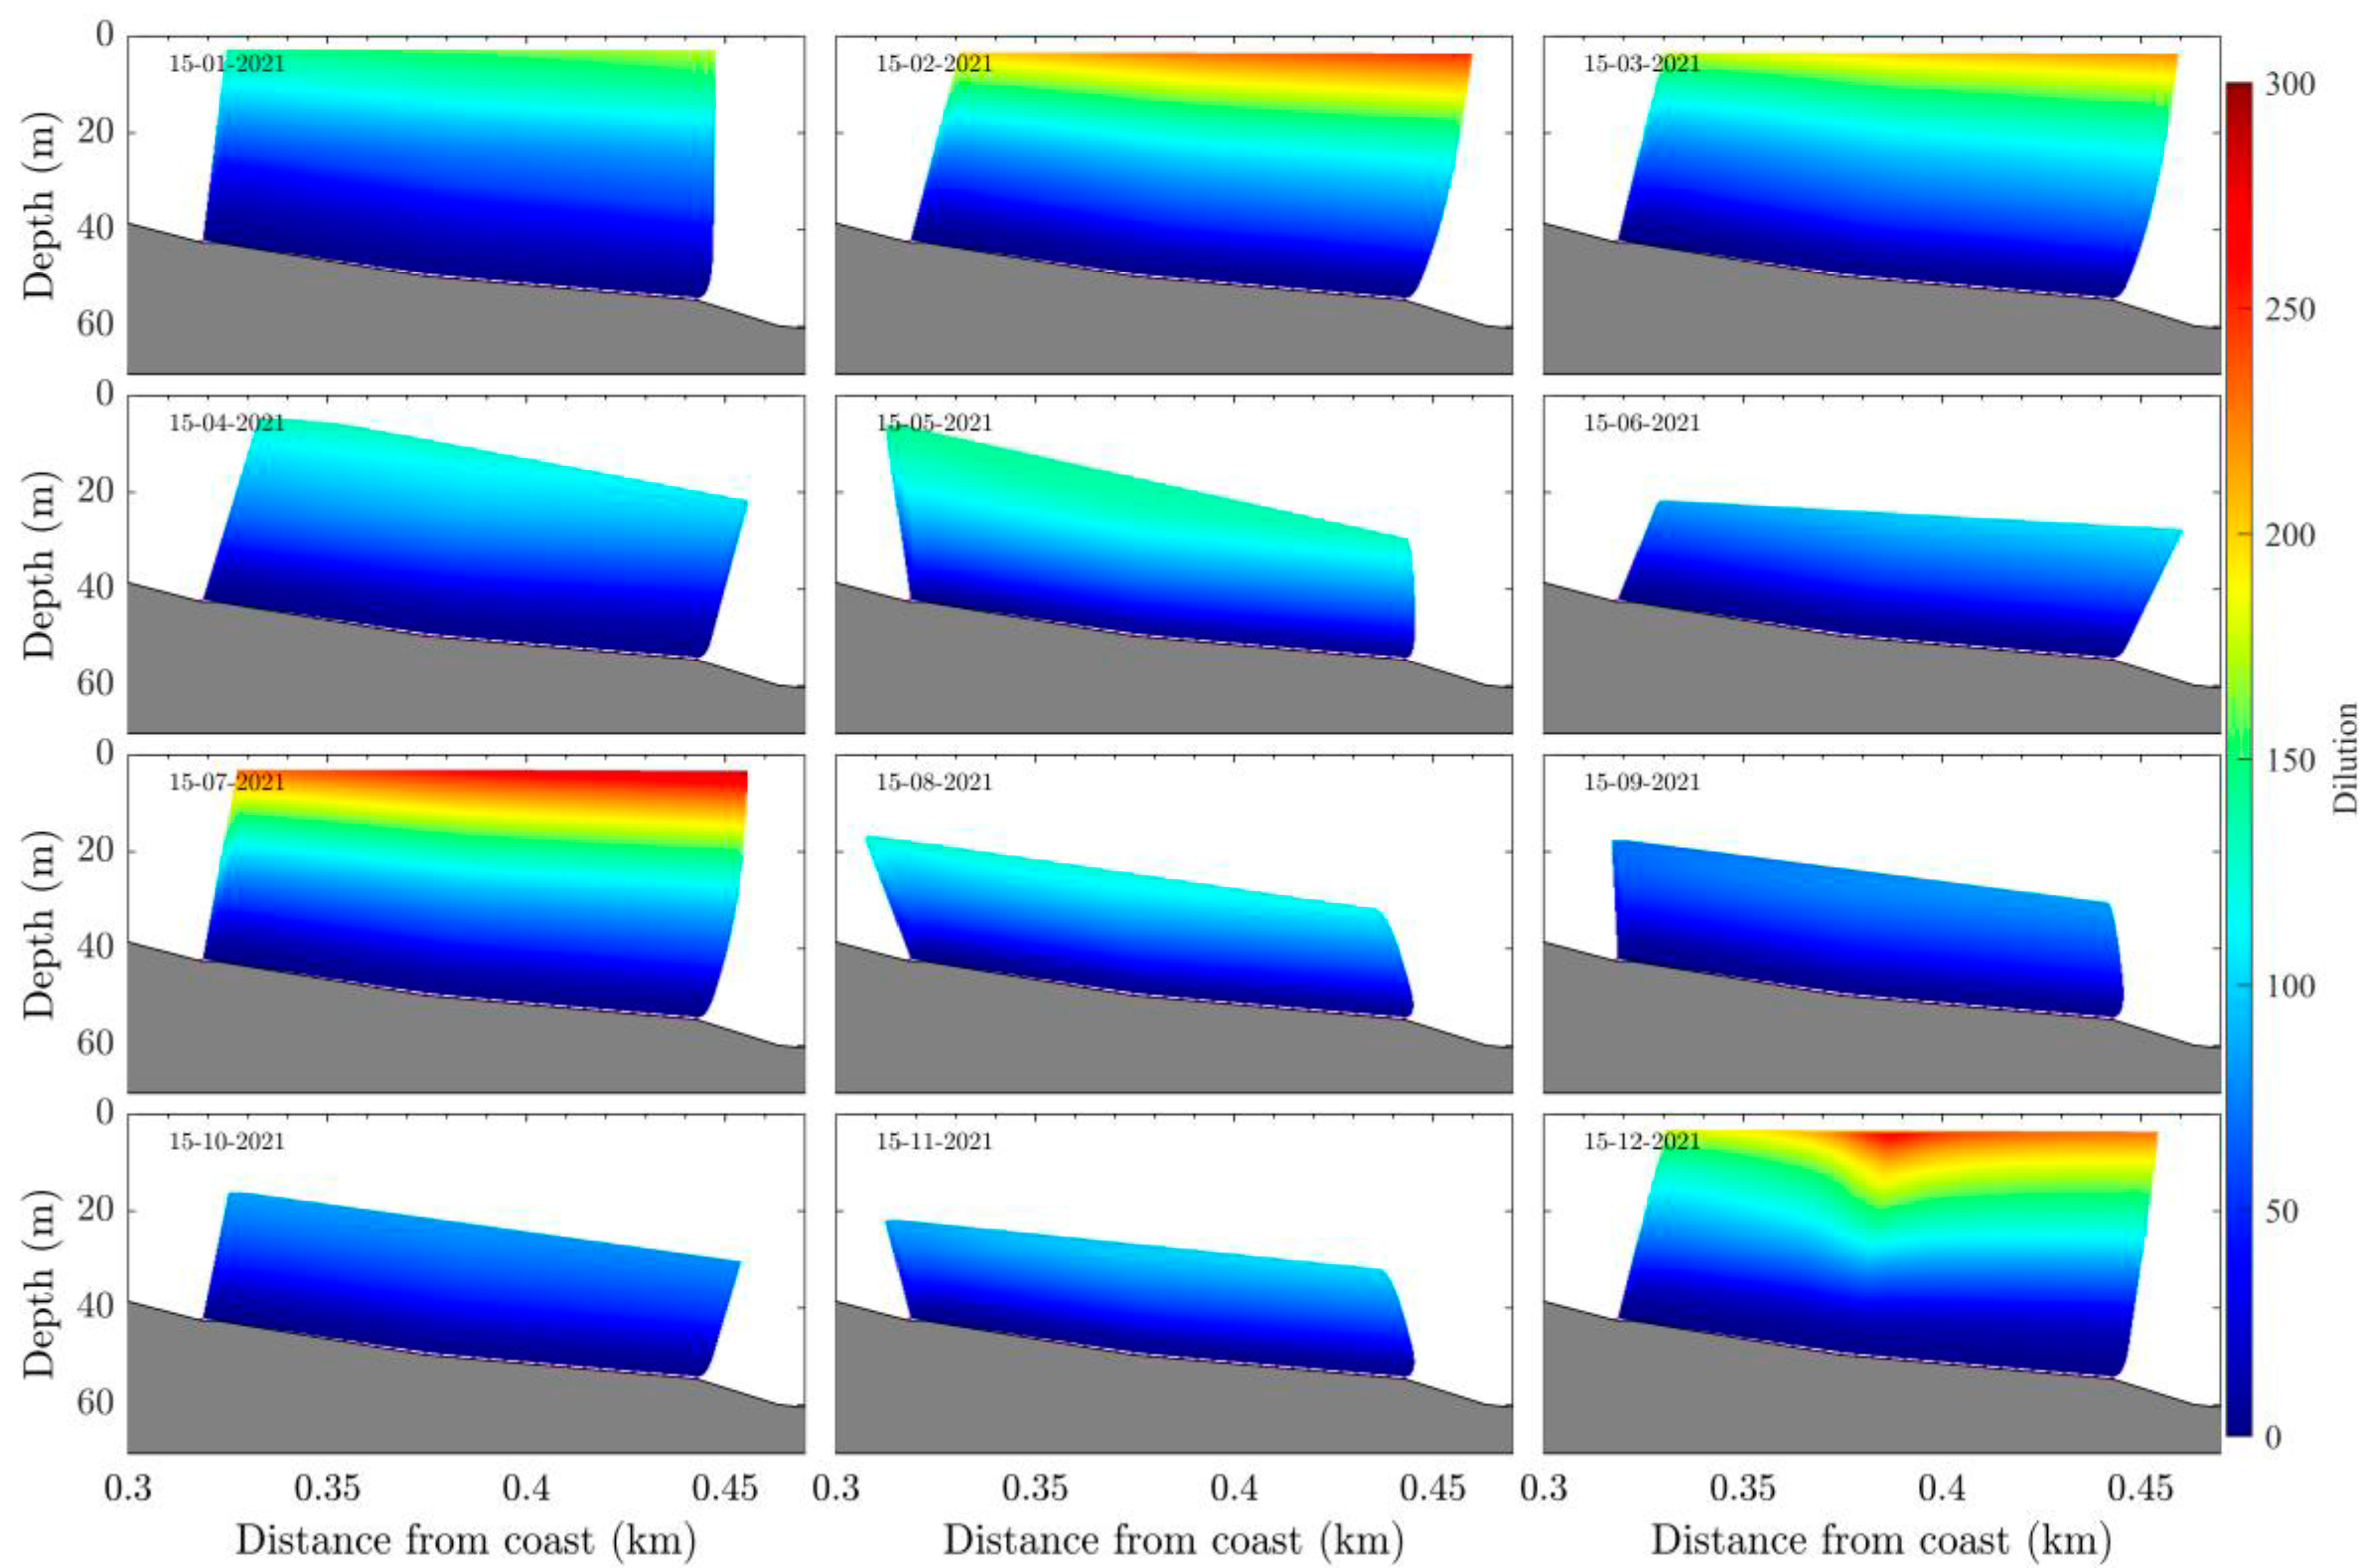
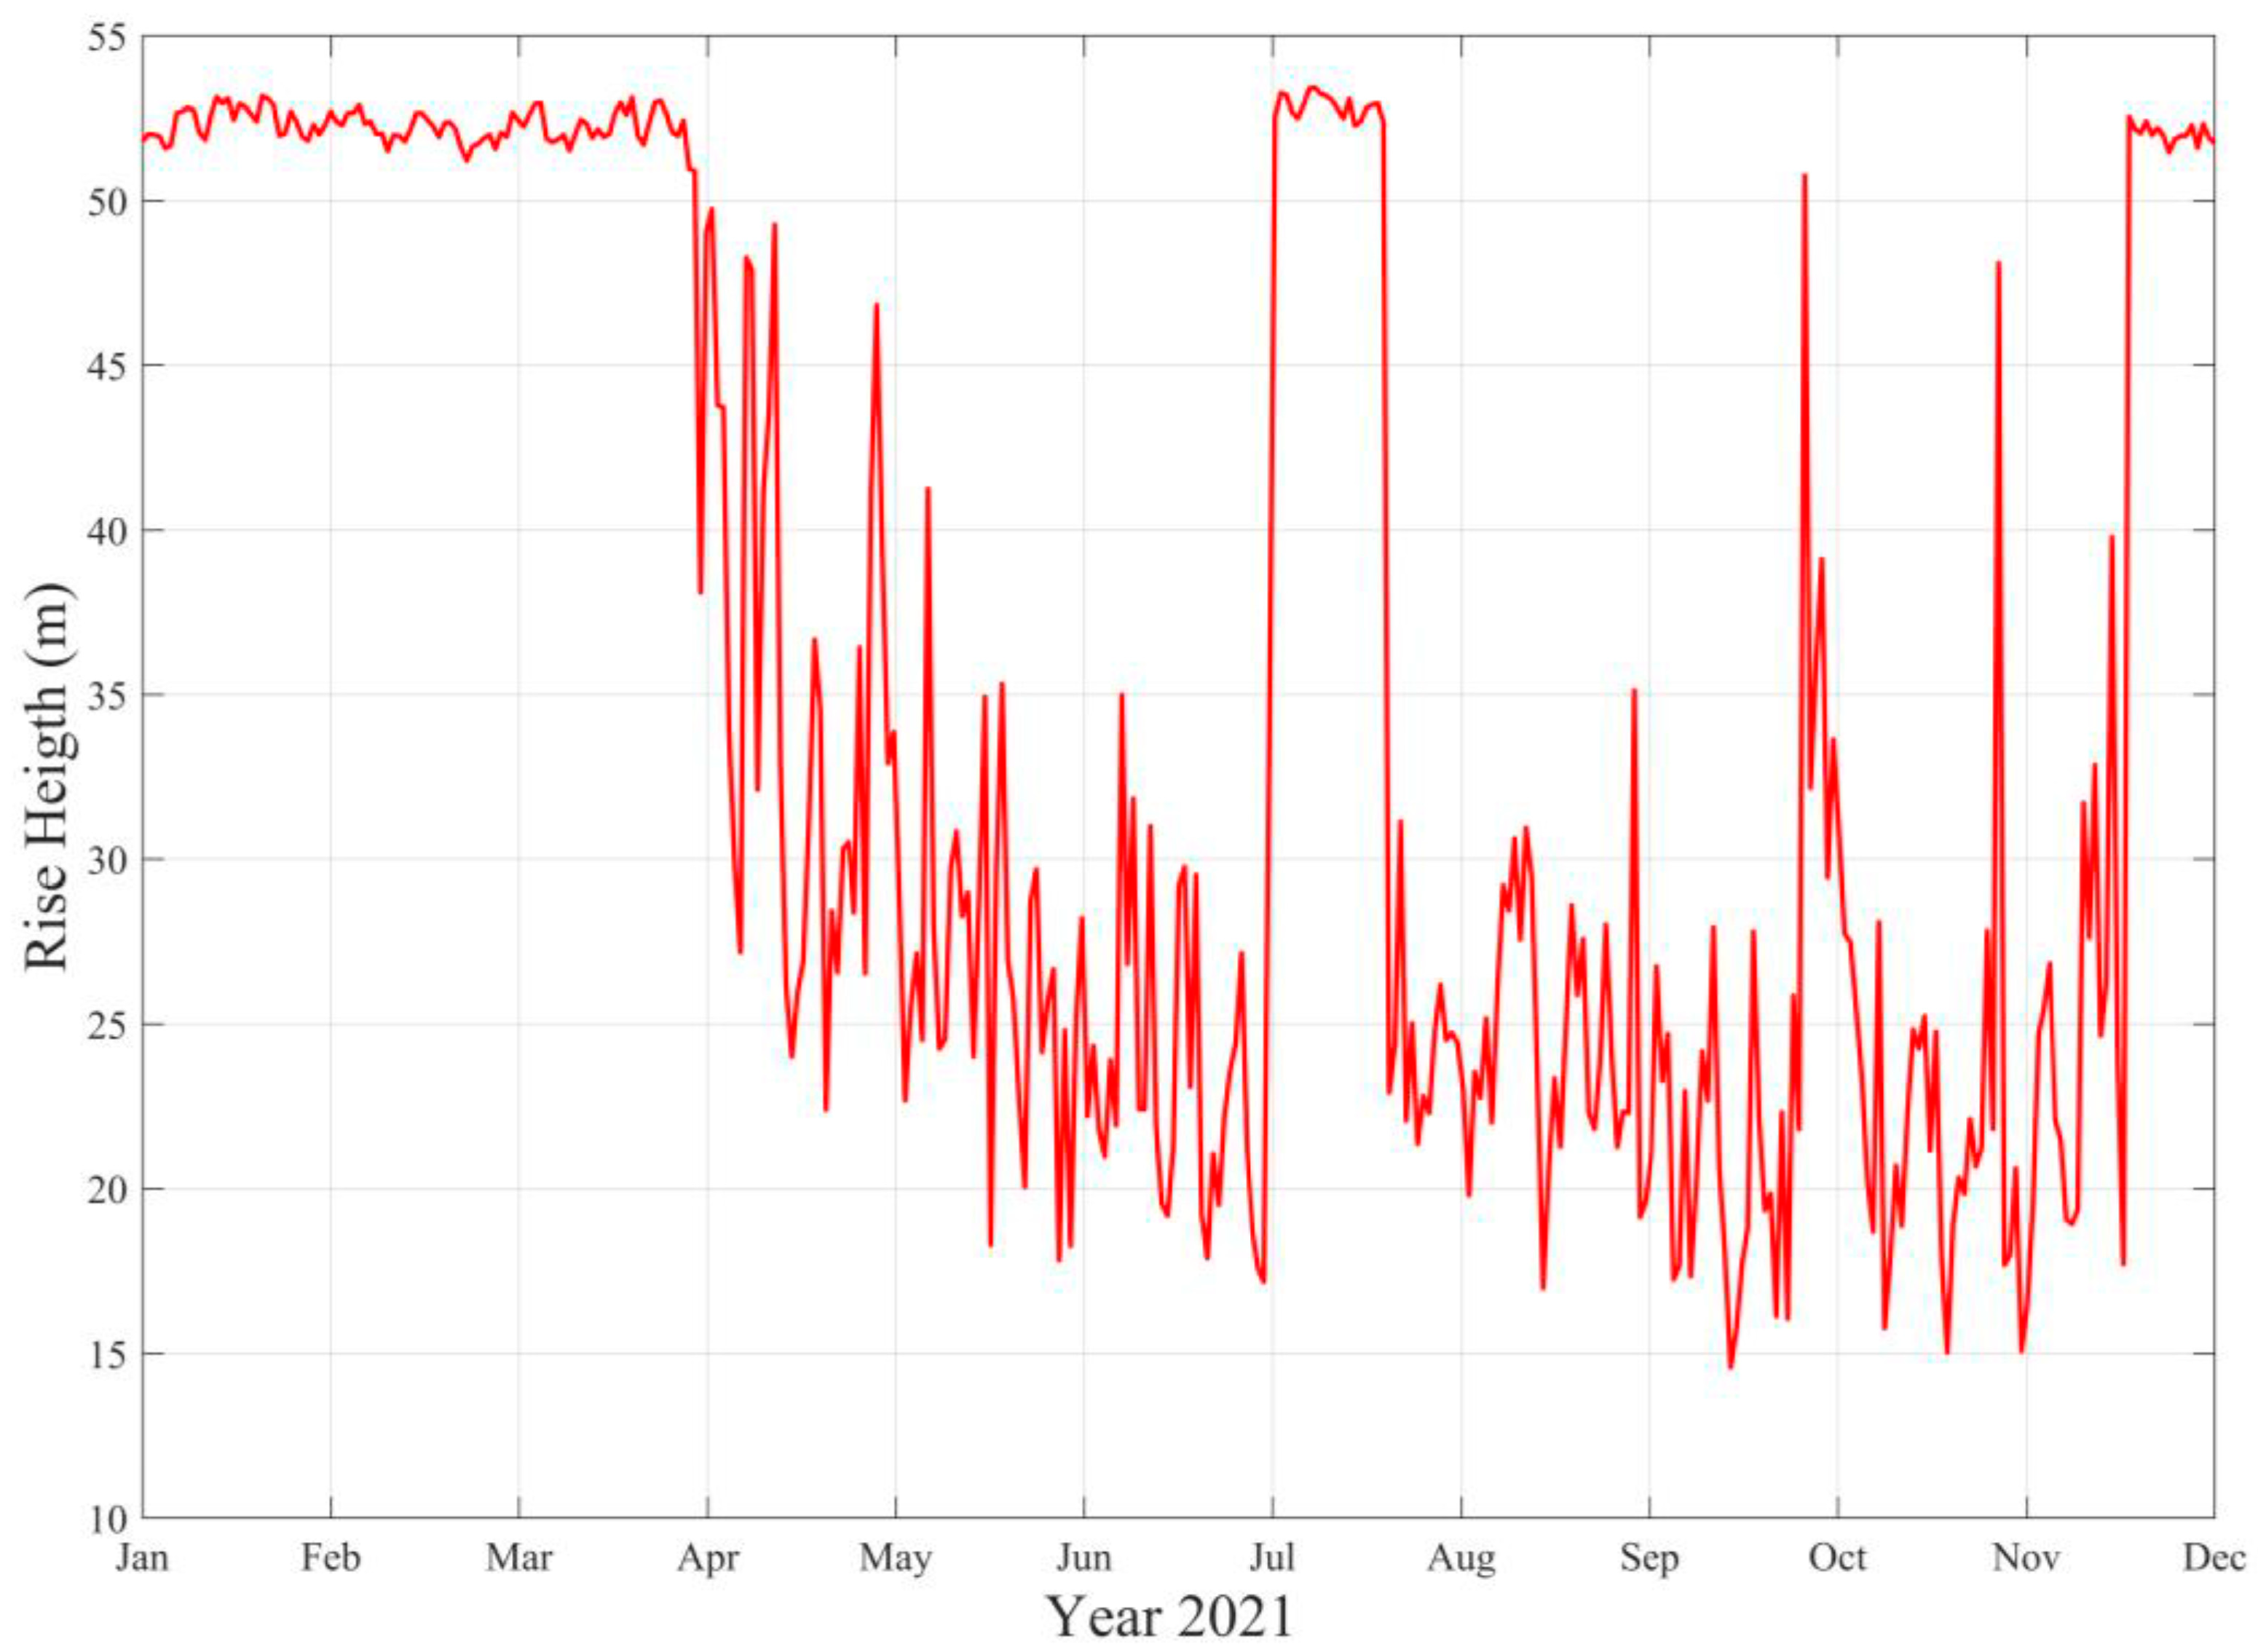
The discharge from the last diffuser is presented in Figure 10, which illustrates the discharge for one day of each month of the year at 12:00 GMT. Figure 11 shows the elevation of the plume formed by the 32 diffusers of the submarine outfall, marking the total extension of the near-field. The color scale depicts the dilution achieved by the plume as it ascends through the seawater. A merging process was considered between the plumes from the diffusers. Between December and March, and in July, the plumes reached the surface. During the remaining months (April–June, August–November), the plume was trapped at the middle depth of the water column. Figure 12 shows the height reached by the plume from the Santa Marta’s submarine outfall for each day of the year.
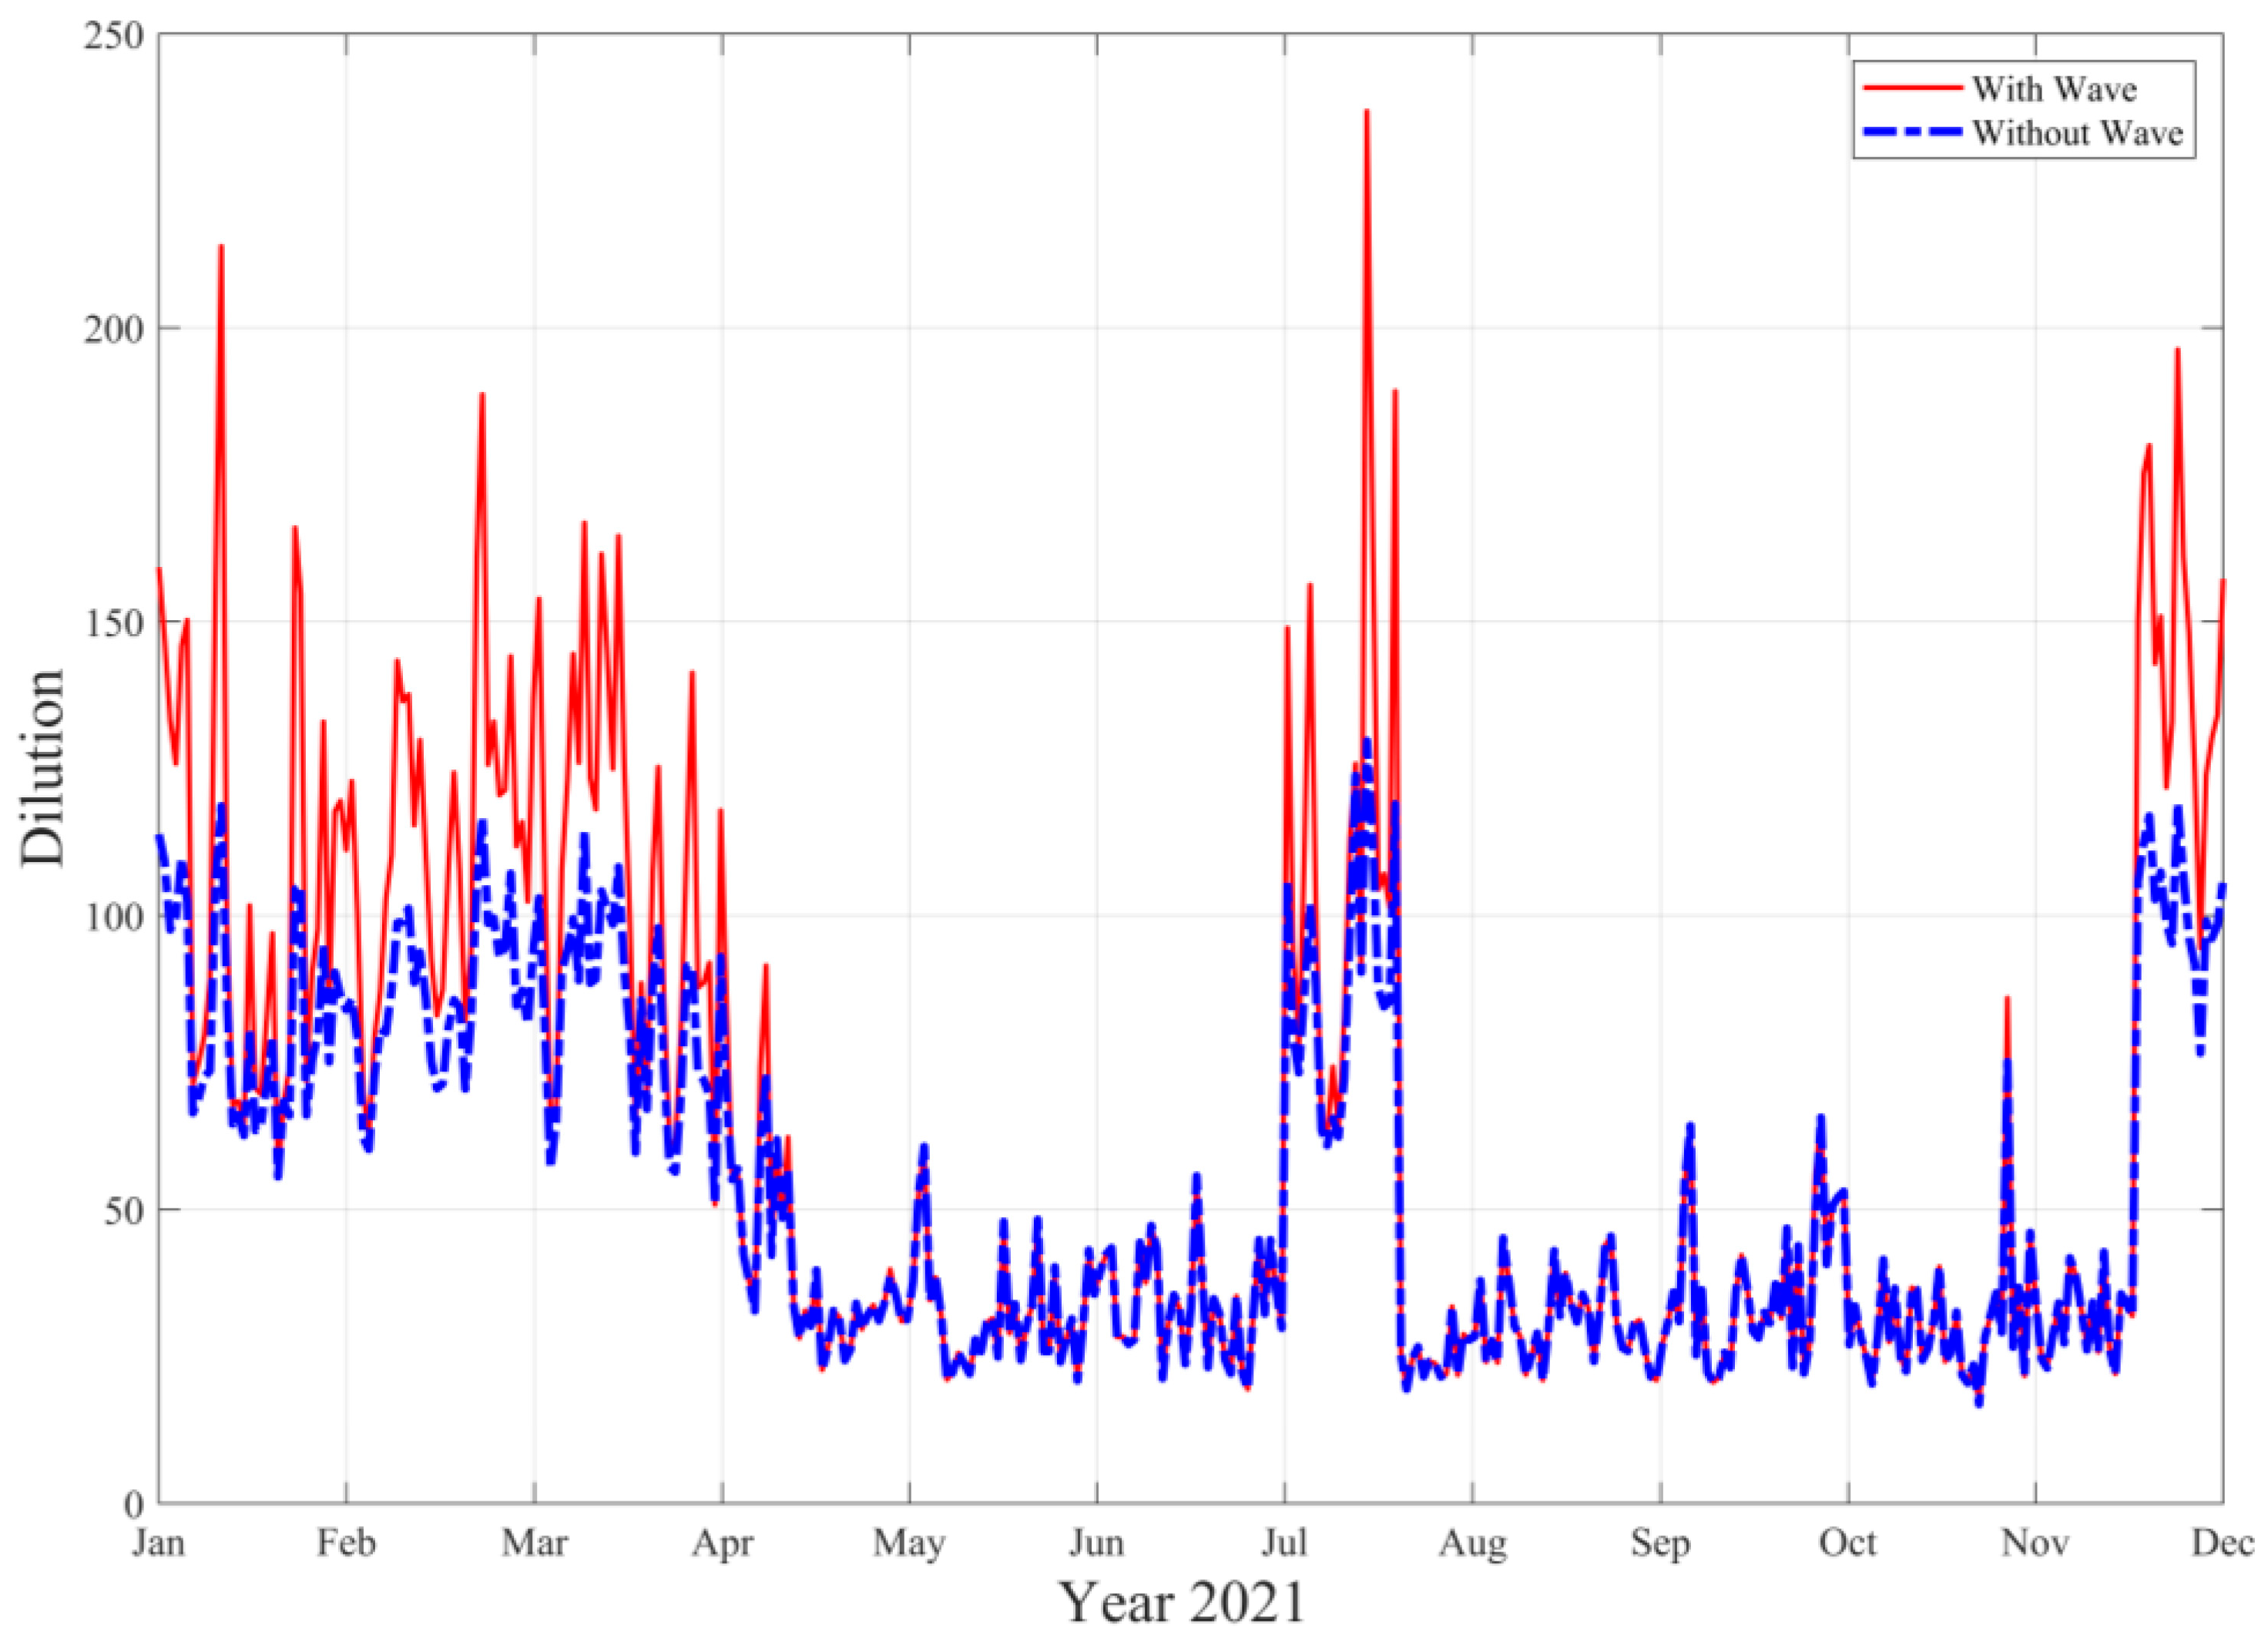
The initial dilution achieved in the near-field of Santa Marta’s submarine outfall reached values of 130. The lowest values were obtained when the plume remained trapped at the middle depth of the water column, while the maximum values were reached when it reached the surface. The effects of surface waves on the dilution of the wastewater discharge from Santa Marta’s submarine outfall are shown in Figure 13. The waves increased the initial near-field dilution of the Santa Marta’s submarine outfall when the wastewater plume reached the surface (December–March, June), with the factor S   w a v e s / S n o   w a v e s reaching 1.9. The dilution achieved at the initial moment of discharge of wastewater through the diffusers of the submarine outfall increased by 90%.

4. Discussion

The initial dilution of the discharge of submarine outfall has been widely used to measure the assimilation of wastewater disposal in marine environments [1,2,3,4,5,6,7,8,9,10,11,12,13,14,15]; by definition, this is the dimensionless relationship between the concentration of the effluent and the seawater at the time of discharge, occurring due to the entrains of seawater into the buoyant plume of wastewater discharge, thus reducing its density [46]. In this study, the dilution levels achieved in the near-field of Santa Marta’s submarine outfall were determined—that is, discharge that occurs through a 1 m diameter pipe, with a length of 442 m, and located at 56 m at its deepest point, where the residual water is disposed of in the marine environment by a system of 32 diffusers of 8 inches in diameter each.
The test statistic used to determine the magnitude of the error between the model results and the field measurements confirms the validation of the model, with low values obtained for this parameter (NMAE < 0.04). However, it should be noted that this validation was performed using a sparse data scenario, with only one CTD profile per month available. To increase the reliability of the hydrodynamic model, it will be necessary to improve the availability of temperature and salinity data in the future.
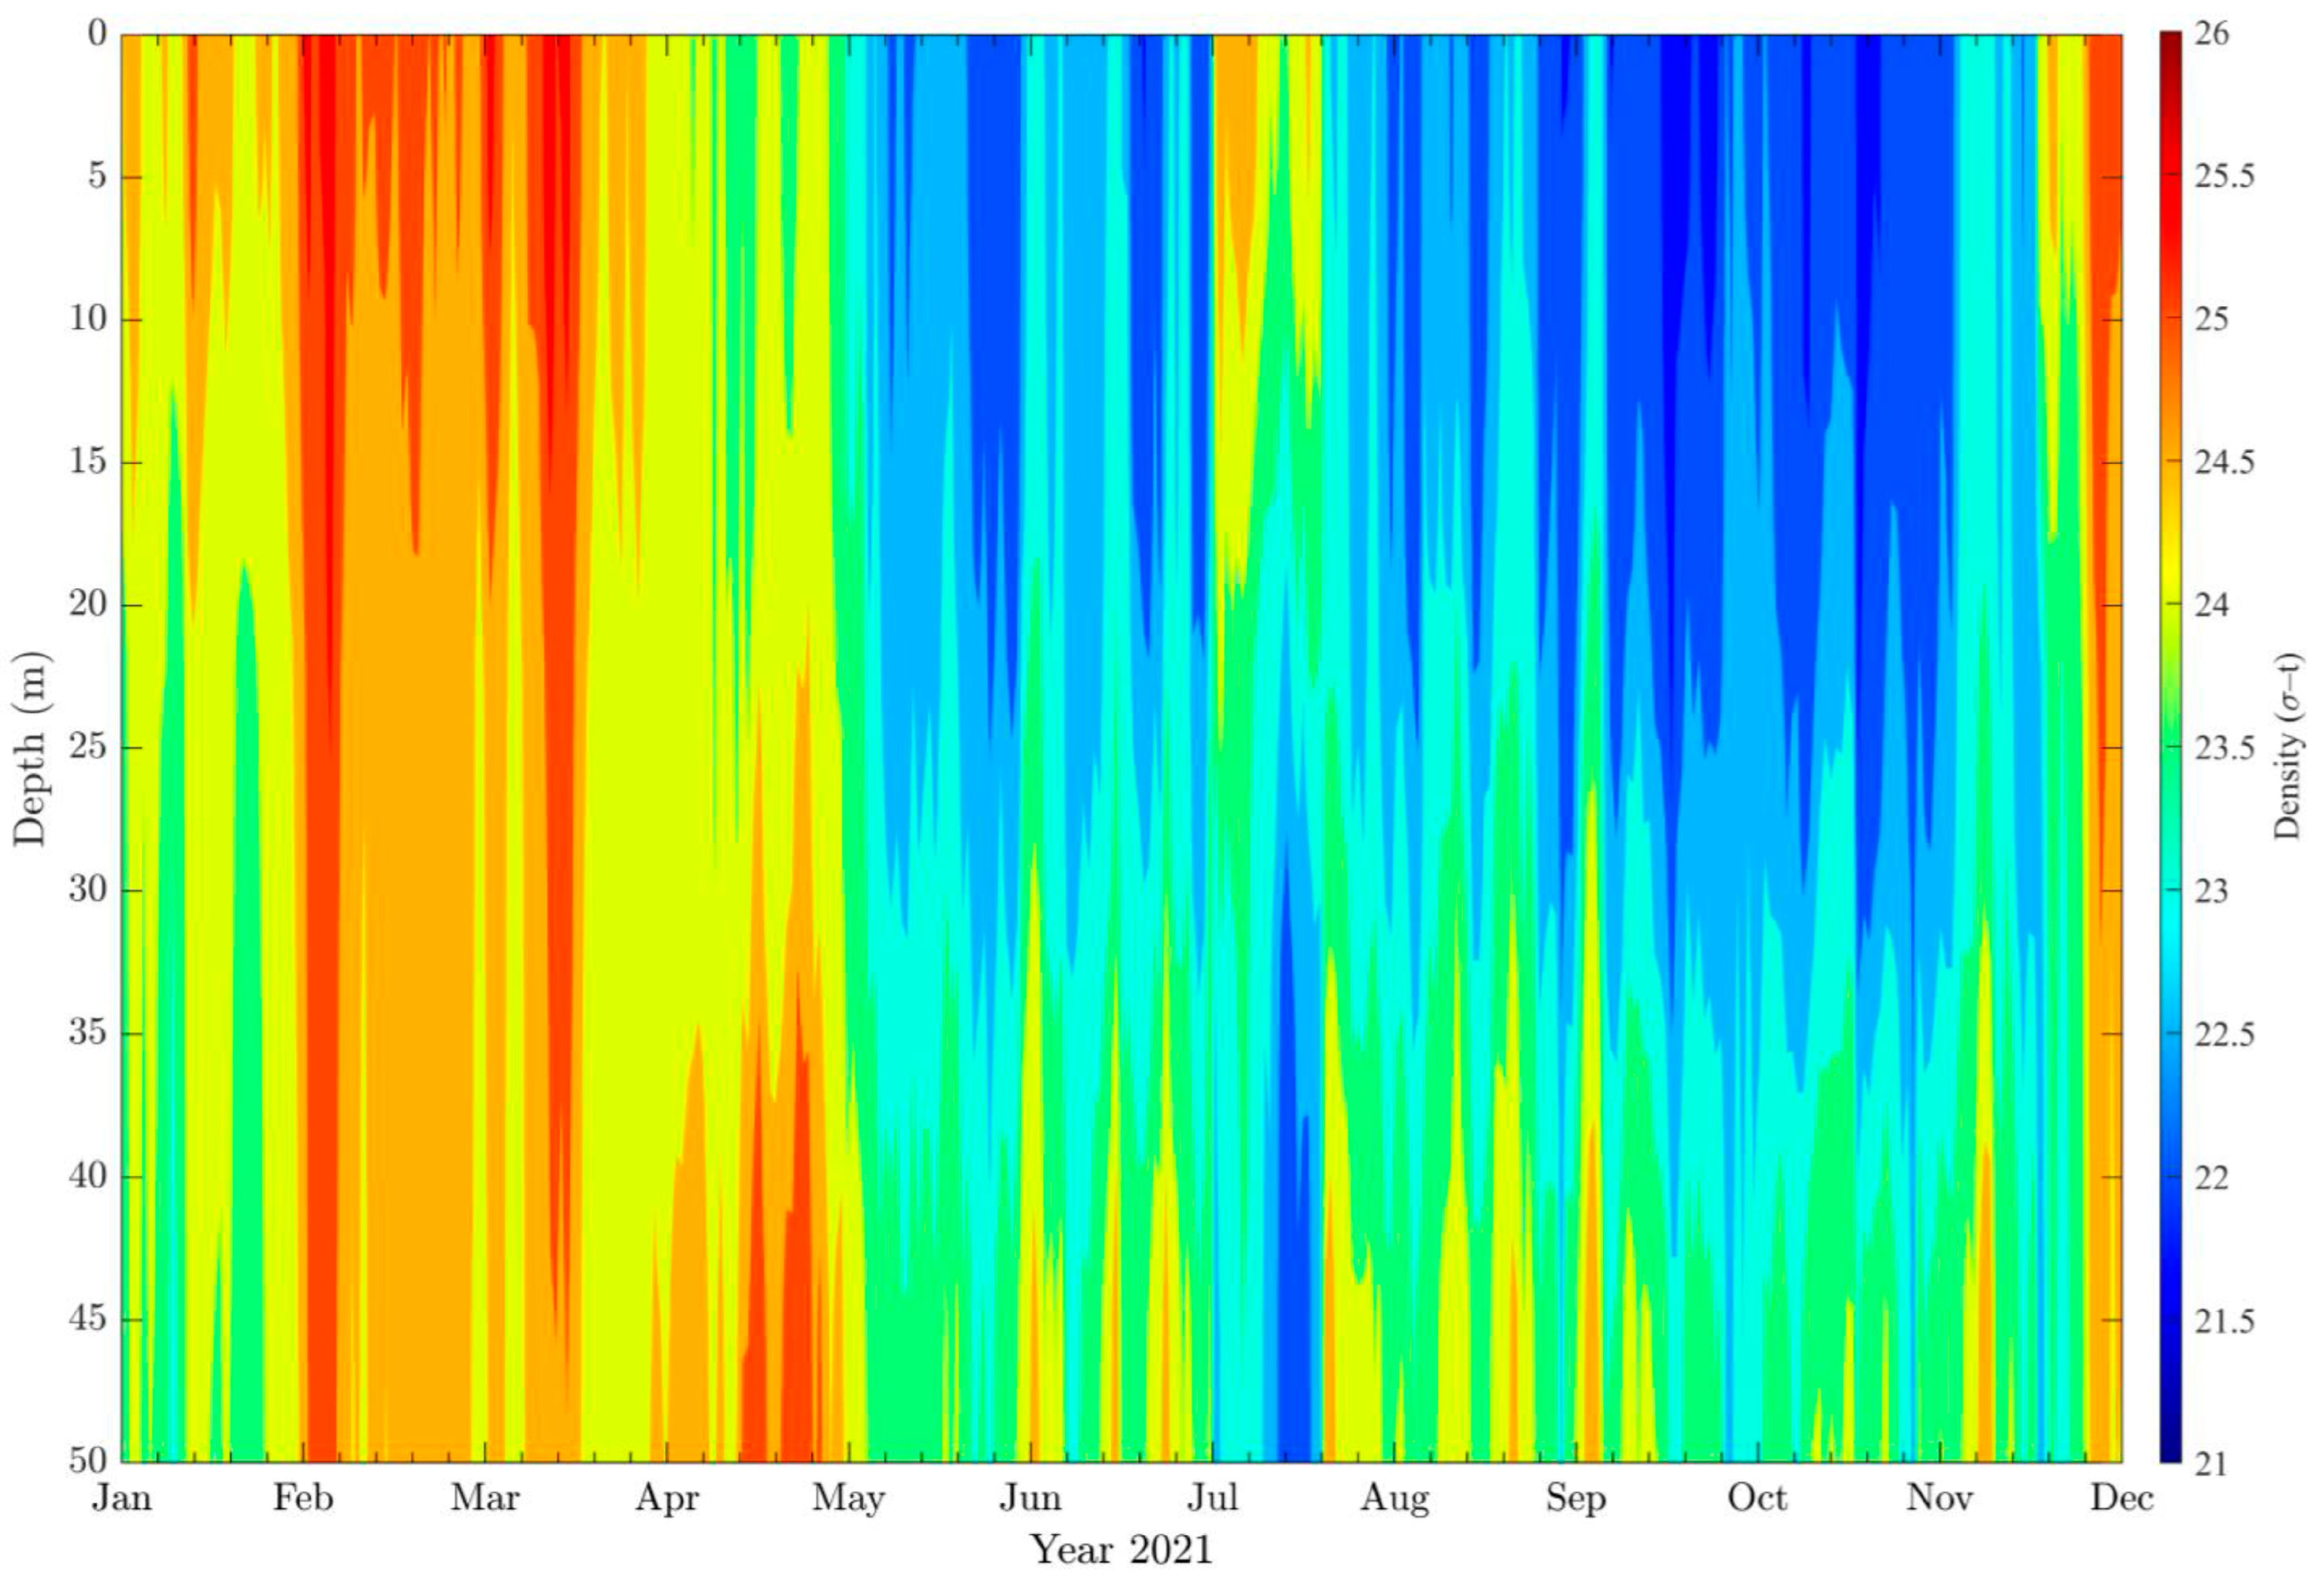
The results of the RMA10 3D model provide evidence of alternating upwelling and stratification phenomena in the SMCA. During the period from December to March, and July, a clear marine upwelling event is observed, characterized by a uniform density profile throughout the water column. By using the temperature and salinity results at different depths of the seawater column, the density of the seawater receiving untreated wastewater discharge was determined (Figure 14). During the period between December and March, the water column exhibited a density range of 23–26 kg/m3. Despite the relatively high-density values, the water column did not display significant density gradients between the surface and bottom depths. This resulted in a more uniform density profile during this period, a trend that is also evident in July, though for a shorter duration; despite the relatively high values, no significant density gradients were observed between the surface and the bottom of the water column. This resulted in a more uniform density profile during this time of the year. During two periods of the year, April to June and August to November, the water column exhibits a decrease in density to values between 21 and 25.5 kg/m3, showing clear differences between the surface and bottom depths due to the stratification of the water column. The water density at the surface displays the lowest values recorded throughout the year for the water column, with a minimum of 21 kg/m3; these findings agree with previous studies [33,34,35]. These conditions influence the extent of the near-field plume of the Santa Marta submarine outfall and the achieved dilution levels of the discharge. During upwelling events, the plume reaches the surface and achieves higher levels of dilution, which are further increased by the effects of waves. This occurs from December to April and for a shorter period in July. During stratified conditions, the plume remains trapped at intermediate depths of the water column, with lower levels of dilution achieved in the near-field, as well as no wave effects on the near-field.
The plume shape displayed in the Figure 11, indicates a uniform distribution of dilution values across the transverse axis to the plume’s movement direction. This is primarily due to the absence of a Gaussian distribution for dilution in this axis within the PLUME3 model, which highlights the need for model modifications to incorporate this condition. Currently, the Plume model assumes that the plume’s axis has maximum concentration, which remains constant towards the plume’s borders. This assumption is adequate for assessing the highest dilution levels reached during wastewater discharge into the sea via submarine outfalls. However, the model’s realism can be further enhanced by considering more realistic conditions.
The discharge of wastewater into the ocean through a submarine outfall can have a significant impact on the marine environment. The plume of water that is created by the discharge contains elevated levels of pollutants and nutrients, which can harm the surrounding ecosystem. In the absence of stratification, the water column is well mixed, with similar densities among the water layers and little to no variation in the density profile.
Under these conditions, the plume of wastewater will rise to the surface due to the difference in density between the wastewater and the surrounding seawater. This process, known as plume upwelling, can result in the release of pollutants and nutrients into the surface waters, with potential negative impacts on the marine environment. To minimize these impacts, it is desirable to achieve high dilutions in the near-field when the plume reaches the surface. The plume of the submarine outfall discharge reaches the surface in this period as a result of the absence of stratification in the water column. The highest dilution values, as reported by the PLUME3 model, are then achieved.
The timing of the upwelling of the plume to the surface of the marine water column was found to be concurrent with an intense wave period caused by the north trade winds. This resulted in an increase in the initial dilution achieved in the vicinity of the submarine outfall discharge, as demonstrated by the findings from the initial dilution mode.
During the period between December and March (year 2021), coinciding with the dry period, with the arrival of trade winds, and the occurrence of major upwelling, maximum dilutions of 1:130 were obtained when the plume appeared on the surface in near-field. The marine water then reached the lowest temperature of the year, with uniform density profiles and minimum variation between the bottom and the surface. No stratification episodes occurred. The S   w a v e s / S n o   w a v e s factor was up to 1.90 for the center of the plume on the water column. The plume also reached the surface in a shorter period, in July, when dilutions up to 1:260 were reached.
The effects of surface waves during other periods of time of the year were not significant; the S   w a v e s / S n o   w a v e s factor, which quantifies this effect, ranged between 1.08 and 1.0. The minimum dilution is 1:22; this value was obtained when the plume just reached 18 m caused by the stratification seen during the rainy periods (April–July and August–December). These periods coincide with water column temperatures reaching 30 °C, low magnitude winds, and waves that do not reach a height of 30 cm.
The effects of waves on dilution have been reported by several authors; however, there are very few reports of effects on plume elevation [24]. For Santa Marta’s submarine outfall, these effects are important when the plume has already reached the surface. No effect on plume elevation was found. When the plume reaches neutral buoyancy levels at medium depths of the water column, the waves do not have a significant effect on either the dilution or the rise of the same, generated by the turbulence of the external waves.

5. Conclusions

The total dilution achieved by the discharge from a submarine outfall is the sum of the near-field, the far field, and the transition zone. The incorporation of the effects of the waves on the dilution in the near-field contributes to improving the determination of the total dilution in the dilution zone of submarine outfalls.
The results of the model on water column density confirm the existence of two stratification layers in the water column, where differences in density can be observed between the surface (21 kg/m3) and the bottom (25.5 kg/m3), both reported as sigma–t. The stratification acts as a barrier, trapping the plume at intermediate depths and preventing it from rising to the surface. These stratification layers occur during specific times of the year, from April to June and from August to November, with a brief interruption by an upwelling period in July.
The results of the initial dilution model of PLUME3 provide a basic understanding of the uniformity of the dilution in the transverse direction of the wastewater discharge. However, further refinement is needed to account for the complex interactions and distributions of the dilution in the transverse direction. To achieve this, it is recommended to incorporate a Gaussian distribution model in future studies, which will provide a more accurate representation of the dilution pattern and highlight areas of higher and lower concentration within the plume.

Author Contributions

Conceptualization, F.-F.G.-R.; methodology, F.-F.G.-R., G.H.C., and G.A.C.N.; software, F.-F.G.-R., G.H.C. and G.A.C.N.; validation, F.-F.G.-R., G.H.C. and G.A.C.N.; formal analysis, F.-F.G.-R., G.H.C. and G.A.C.N.; writing—original draft preparation, F.-F.G.-R., G.H.C. and G.A.C.N.; writing—review and editing, F.-F.G.-R., G.H.C. and G.A.C.N. All authors have read and agreed to the published version of the manuscript.

Funding

This research received no external funding, and the APC was funded by G.F., C.G. and H.G.

Data Availability Statement

Not applicable.

Acknowledgments

The authors are grateful to Peter M. Tate, who provided the source code in Fortran of the PLUME3 model.

Conflicts of Interest

The authors declare no conflict of interest.

References

  1. Birocchi, P.; Dottori, M.; de Godoi, R.C.; Bairão, L.J. Study of three domestic sewage submarine outfall plumes through the use of numerical modeling in the São Sebastião channel, São Paulo state, Brazil. Reg. Stud. Mar. Sci. 2021, 44, 101647. [Google Scholar] [CrossRef]
  2. Lamparelli, C.C.; Moura, D.O.; Pinto, K.C.; Camolez, A.C. Monitoring sea outfall discharges in São Paulo Coast—Brazil. In Proceedings of the International Symposium on Outfall Systems, IAHR–IWA Joint Committee on Marine Outfall Systems, Ottawa, ON, Canada, 10–13 May 2016. [Google Scholar]
  3. Lapointe, B.; Thacker, K.; Hanson, C.; Getten, L. Sewage pollution in Negril, Jamaica: Effects on nutrition and ecology of coral reef macroalgae. Chin. J. Oceanol. Limnol. 2011, 29, 775–789. [Google Scholar] [CrossRef]
  4. Despland, L.M.; Vancov, T.; Aragno, M.; Clark, M.W. Diversity of microbial communities in an attached–growth system using Bauxsol™ pellets for wastewater treatment. Sci. Total Environ. 2012, 433, 383–389. [Google Scholar] [CrossRef] [PubMed]
  5. Wang, Z.H.; Yang, J.Q.; Zhang, D.J.; Zhou, J.; Zhang, C.D.; Su, X.R.; Li, T.W. Composition and structure of microbial communities associated with different domestic sewage outfalls. Genet. Mol. Res. 2012, 13, 7542–7552. [Google Scholar] [CrossRef]
  6. FischerRoth, F.; Lessa, G.; Wild, C.; Kikuchi, R.; Naumann, M. Impacts of a high–discharge submarine sewage outfall on water quality in the coastal zone of Salvador (Bahia, Brazil). Mar. Pollut. Bull. 2016, 106, 43–48. [Google Scholar]
  7. Inan, A. Modeling of Hydrodynamics and Dilution in Coastal Waters. Water 2019, 11, 83. [Google Scholar] [CrossRef] [Green Version]
  8. Fischer, H.B.; List, E.J.; Koh, R.C.Y.; Imberger, J.; Brooks, N.H. Mixing in Inland and Coastal Waters; Academic Press: New York, NY, USA, 1979. [Google Scholar]
  9. Garcia, F.; Palacio, C.; Chang, G. Simulation of near field dilution of the submarine outfall of Santa Marta (Colombia). Dyna 2013, 182, 138–146. [Google Scholar]
  10. Roberts, P.J.; Salas, H.J.; Reiff, F.M.; Libhaber, M.; Labbe, A.; Thomson, J.C. Marine Wastewater Outfalls and Treatment Systems, 2nd ed.; IWA Publishing: London, UK, 2011; pp. 51–134. [Google Scholar]
  11. Anghan, C.; Bade, M.; Banerjee, J. A review on fundamental properties of the jet in the wave environment. Ocean. Eng. 2022, 250, 2–23. [Google Scholar] [CrossRef]
  12. Otoo, E.; Chen, Y.; Xu, Z.; Chen, Y. Dilution characteristics of dual buoyant jets in wavy cross–flow environment. Water Sci. Eng. 2022, in press. [Google Scholar] [CrossRef]
  13. Roberts, P.J.W. Ocean outfall dilution: Effects of currents. J. Hydraul. Div. ASCE 1980, 106, 769–782. [Google Scholar] [CrossRef]
  14. Roberts, P.J.W. Modeling Mamala Bay outfall plumes. I: Near field. J. Hydraul. Eng. 1999, 125, 564–573. [Google Scholar] [CrossRef]
  15. Jirka, G.H.; Doneker, R.L.; Barnwell, T.O. CORMIX: An expert system for mixing–zone analysis. Waterence Technol. 1991, 24, 267–274. [Google Scholar] [CrossRef]
  16. Fan, L. Turbulent Buoyant Jets into Stratified or Flowing Ambient Fluids. California Institute of Technology, Pasadena. 1967. Available online: https://authors.library.caltech.edu/25955/1/KH–R–15.pdf (accessed on 21 October 2022).
  17. Chin, D.A. Influence of surface waves on outfall dilution. J. Hydraul. Eng. 1987, 113, 1006–1018. [Google Scholar] [CrossRef]
  18. Xu, Z.; Chen, Y.; Jiang, D. Experimental study on a buoyant jet in wavy crossflow. In Proceedings of the 28th International Ocean and Polar Engineering Conference, ISOPE, Sapporo, Japan, 10–15 June 2018. [Google Scholar]
  19. Xu, Z.; Otoo, E.; Chen, Y.P.; Ding, H.W. 2D PIV measurement of twin buoyant jets in wavy cross–flow environment. Water 2019, 11, 399. [Google Scholar] [CrossRef] [Green Version]
  20. Watanabe, R.; Gono, T.; Yamagata, T.; Fujisawa, N. Three–dimensional flow structure in highly buoyant jet by scanning stereo PIV combined with POD analysis. Int. J. Heat Fluid Flow 2015, 52, 98–110. [Google Scholar] [CrossRef]
  21. Lu, J.; Wang, L.L.; Tang, H.W.; Dai, H.C. Large eddy simulation of vertical turbulent jets under JONSWAP waves. Acta Mech. Sin. 2011, 27, 189–199. [Google Scholar] [CrossRef]
  22. Fang, S.; Chen, Y.; Xu, Z.; Otoo, E.; Lu, S. An Improved Integral Model for a Non–Buoyant Turbulent Jet in Wave Environment. Water 2019, 11, 765. [Google Scholar] [CrossRef] [Green Version]
  23. Tate, P.M. The Rise and Dilution of Buoyant Jets and Their Behaviour in an Internal Wave Field. Ph.D. Thesis, University of New South Wales, Sydney, Australia, June 2002. [Google Scholar]
  24. Niu, H. Dispersion of Offshore Discharged Produced Water in the Marine Environment: Hydrodynamic Modeling and Experimental Study. Ph.D. Thesis, University of Newfoundland, St. John’s, NL, Canada, 2008. [Google Scholar]
  25. Hwung, H.; Chyan, J.; Chang, C.; Chen, Y. The dilution processes of alternative horizontal buoyant jets in wave motions. Coast. Eng. Proc. 1994, 24, 3045–3059. [Google Scholar]
  26. Xu, C.; Chen, Y.; Wang, Y.; Zhang, C. Near–field dilution of a turbulent jet discharged into coastal waters: Effect of regular waves. Ocean Eng. 2017, 140, 29–42. [Google Scholar] [CrossRef]
  27. Chin, D.A. Model of buoyant–jet–surface–wave interaction. J. Waterw. Port Coast. Ocean Eng. 1988, 114, 331–345. [Google Scholar] [CrossRef]
  28. Tam, B.-F.; Li, C.W. Flow induced by a turbulent jet under random waves. J. Hydraul. 2008, 46, 820–829. [Google Scholar] [CrossRef]
  29. Díaz–Rocca, L.H.; Causado–Rodríguez, E. La insostenibilidad del desarrollo urbano: El caso de Santa Marta–Colombia. Clío América 2007, 1, 64–100. [Google Scholar]
  30. Moscarella, M.V.; García, F.; Palacio, C. Microbiological water quality of Santa Marta Bay, Colombia. Dyna 2001, 167, 132–141. [Google Scholar]
  31. Hwang, R.R.; Yang, W.C.; Chiang, T.P. Effects of Surface Waves on a Buoyant Jet. J. Mar. Environ. Eng. 1996, 3, 63–84. [Google Scholar]
  32. Chyan, J.M.; Hwung, H.H.; Chang, C.Y.; Chen, I.P. Effects of Discharge Angles on Dilution of Buoyant Jet in Wave Motions. In Proceedings of the 5th International Conference of Hydrodynamics, Tainan, Taiwan, 31 October–2 November 2002. [Google Scholar]
  33. Andrade, C.A.; Barton, E.D. The guajira upwelling system. Cont. Shelf Res. 2005, 25, 1003–1022. [Google Scholar] [CrossRef] [Green Version]
  34. Arroyave, D.M.; Bartoli, M.; Bresciani, M.; Luciani, G.; Toro, M. Biogeochemical modelling of a tropical coastal area undergoing seasonal upwelling and impacted by untreated submarine outfall. Mar. Pollut. Bull. 2021, 172, 112771. [Google Scholar] [CrossRef] [PubMed]
  35. Lozano, Y.; Medellín, J.; Navas, G. Contexto Climatológico y Oceanográfico del mar Caribe Colombiano. Biodiversidad del Margen Continental del Caribe Colombiano; Serie de Publicaciones Especiales; Instituto de Investigaciones Marinas y Costeras José Benito Vives de Andréis—INVEMAR: Santa Marta, Colombia, 2010; Volume 20, p. 4588. [Google Scholar]
  36. Tate, P.M.; Holden, C.J.; Tate, D.J. Influence of plume advection and particle settling on wastewater dispersion and distribution. Mar. Pollut. Bull. 2019, 145, 678–690. [Google Scholar] [CrossRef] [PubMed]
  37. Tate, P.M.; Middleton, J.H. Unification of non–dimensional solutions to asymptotic equations for plumes of different shape. Bound.-Layer Meteorol. 2000, 94, 225–251. [Google Scholar] [CrossRef]
  38. Tate, P.M.; Middleton, J.H. Buoyant jets of elliptical shape: An approximation for duckbill valves. J. Hydraul. Eng. 2004, 130, 432–440. [Google Scholar] [CrossRef]
  39. Fossati, M.; Piedra, I. Numerical modelling of residual flow and salinity in the Rio de la Plata. Appl. Math. Model. 2008, 32, 1066–1086. [Google Scholar] [CrossRef]
  40. Garcia, F.F.; Palacio, C.; Garcia, U. Uso de un modelo regional para el mar Caribe para obtener condiciones fronteras abiertas en un modelo local para la bahía de Santa Marta—Colombia. Boletín Científico CIOH 2008, 26, 33–46. [Google Scholar] [CrossRef]
  41. Garcia, F.F.; Palacio, C.; Garcia, U. Simulation of hydrodynamic conditions at Santa Marta coastal area (Colombia). Dyna 2012, 174, 119–126. [Google Scholar]
  42. Garcia, F.F.; Palacio, C.; Garcia, U. Calibración y validación de un modelo 3D para el área costera de Santa Marta (Colombia). Rev. Fac. Ing. Univ. Antioq. 2012, 62, 177–188. [Google Scholar]
  43. Simionato, C.; Meccia, V.; Dragani, W.; Nuñez, M. On the use of the NCEP/NCAR surface winds for modeling barotropic circulation in the Río de la Plata. Estuar. Coast. Shelf Sci. 2006, 70, 195–206. [Google Scholar] [CrossRef]
  44. Alewell, C.; Manderscheid, B. Use of objective criteria for the assessment of biogeochemical ecosystem models. Ecol. Model. 1998, 107, 213–224. [Google Scholar] [CrossRef]
  45. U.S. Army Corps of Engineers. Shore Protection Manual, Vol. I; 4th Edition. 1984. Available online: http://ft–sipil.unila.ac.id/dbooks/S%20P%20M%201984%20volume%201–1.pdf (accessed on 1 October 2022).
  46. Ishikawa, M. Methodology to Classify and Visualize Time–Series Simulations Using Dilution Contour Maps. Master’s Thesis, Universidade Federal do Paraná, Curitiba, Brazil, March 2016. [Google Scholar]
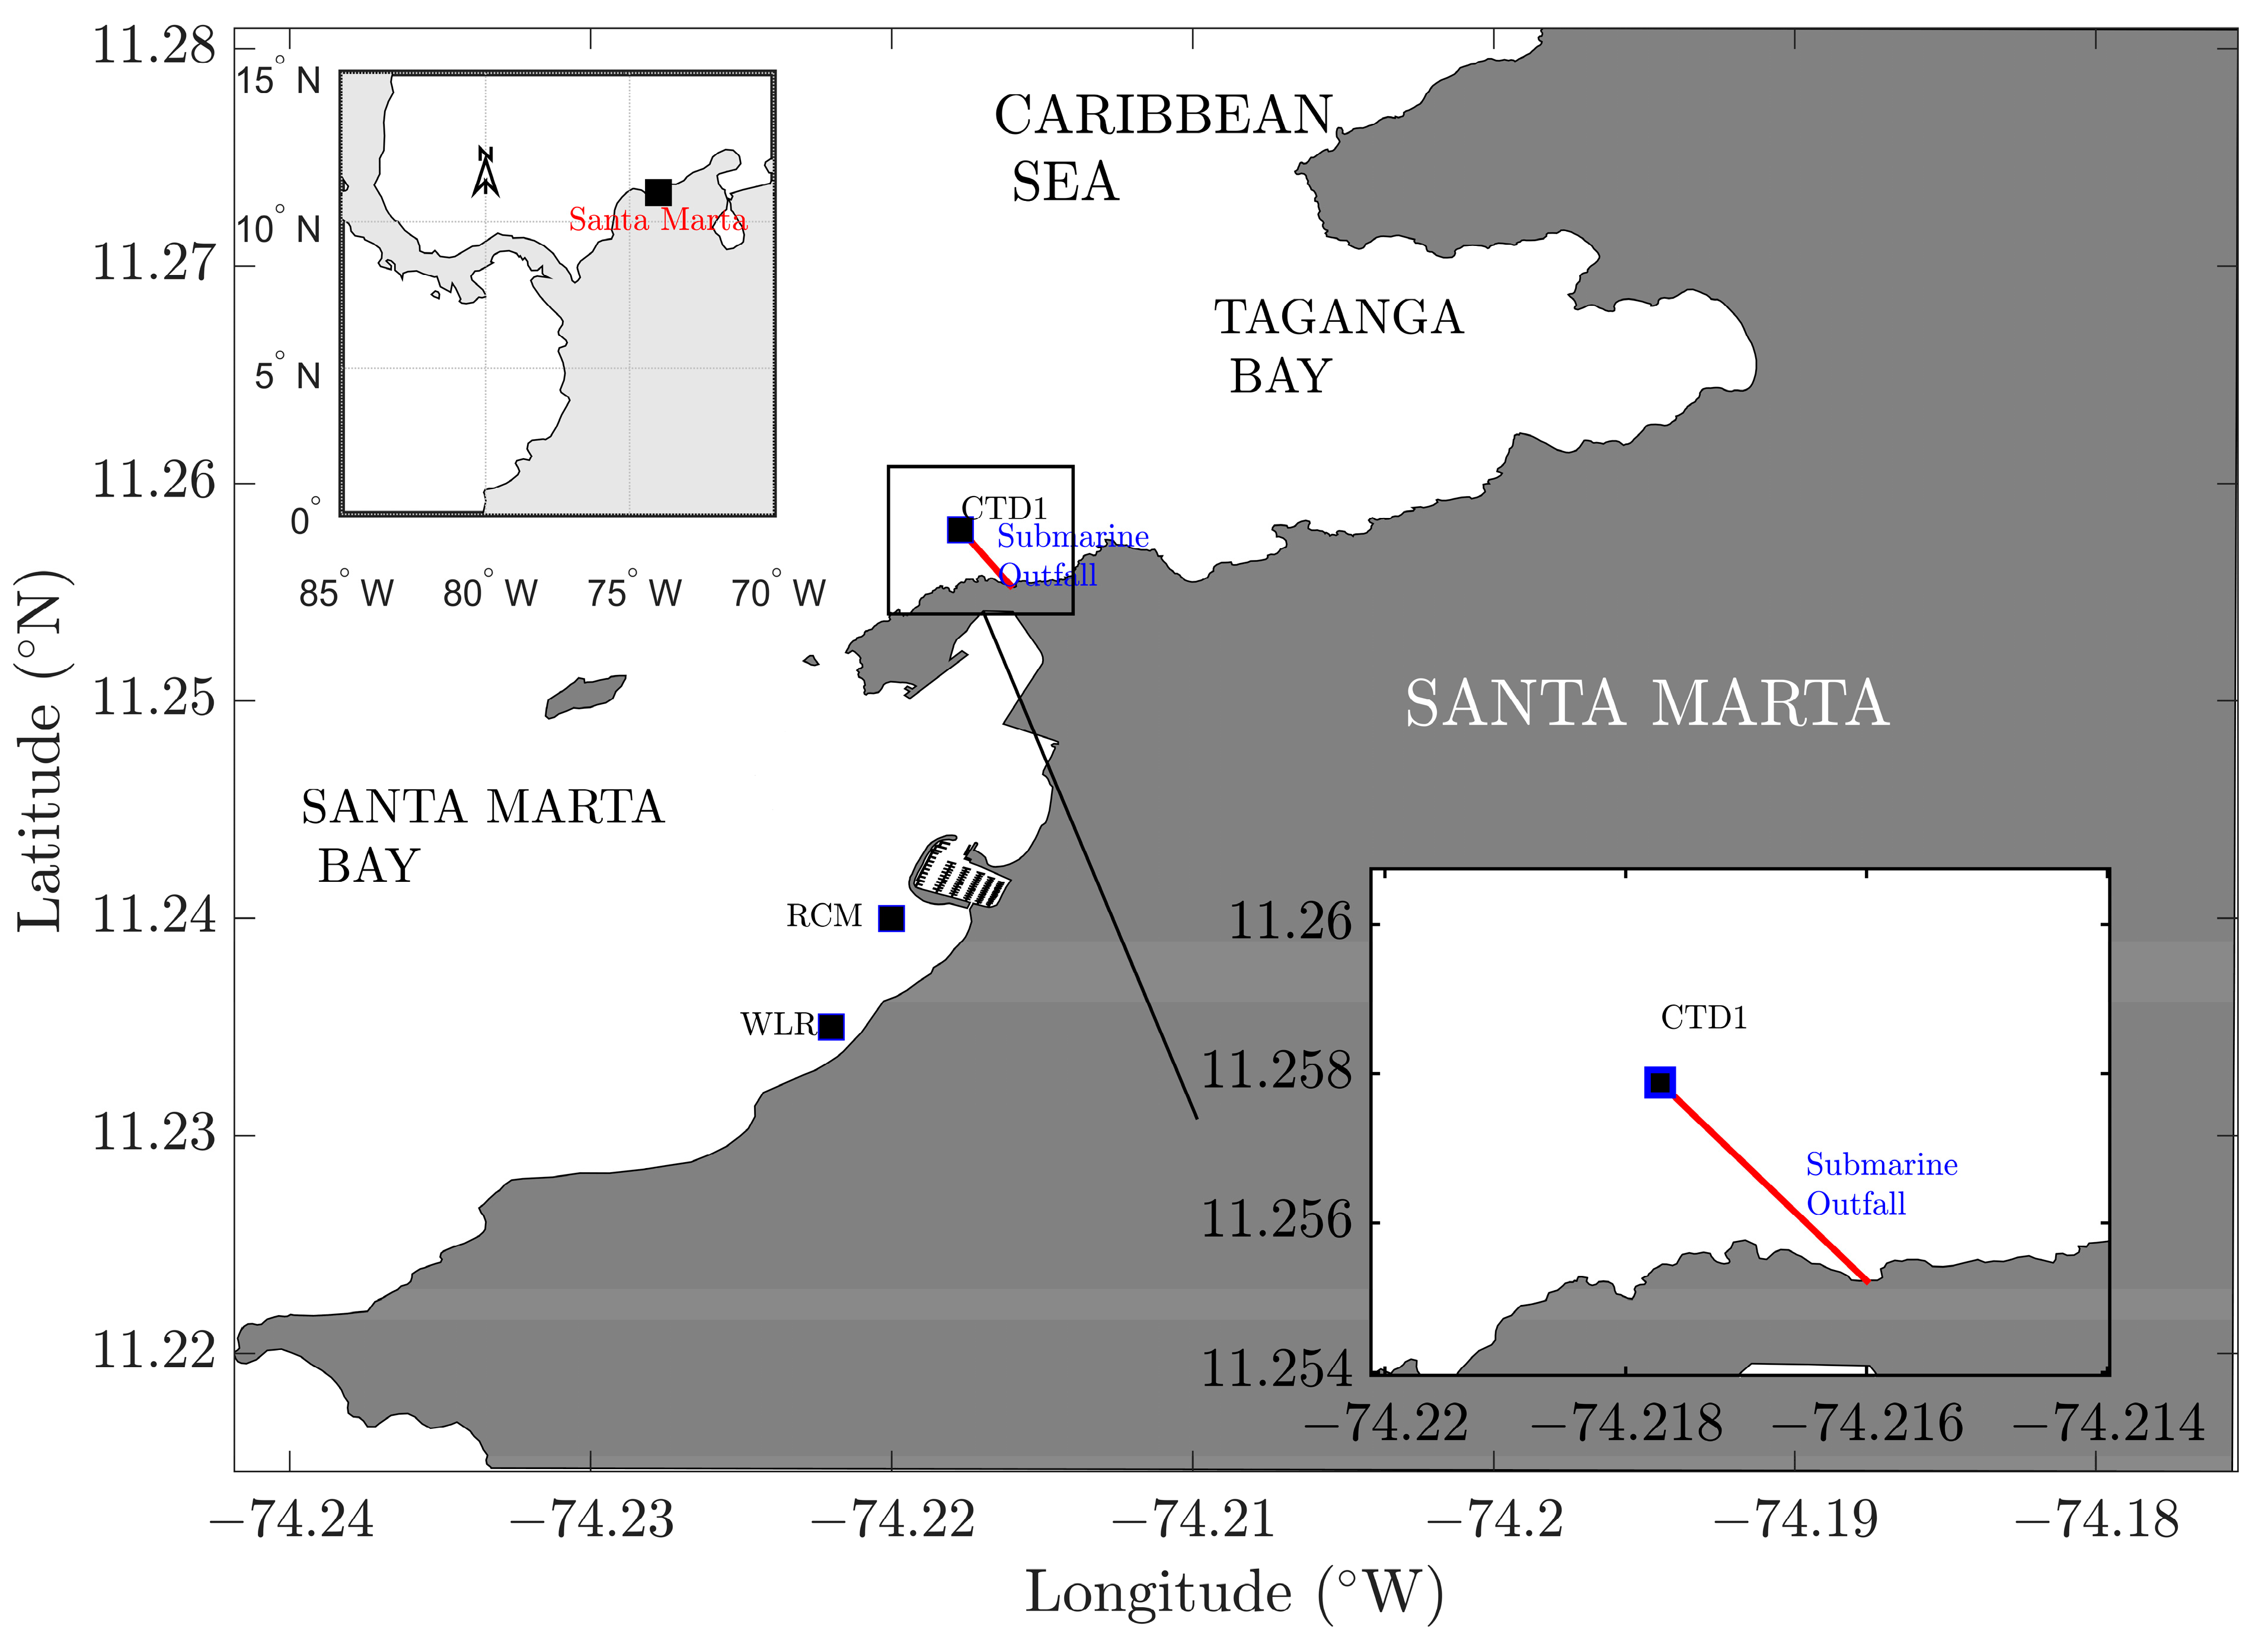
Figure 1. Location of the submarine outfall at Santa Marta Bay, CTD1 = temperature and salinity measurement station, RCM = current measurement station, WLR = Water level measurement station.
Water 15 00919 g001
Figure 2. Chin [17]. Validation of the equation of Niu [24] to quantify the effects of surface waves on wastewater discharge dilution (Fr = 2.658). Adapted from Niu [24]. Hwung et al. [25].
Water 15 00919 g002
Figure 3. Finite element mesh.
Water 15 00919 g003
Figure 4. Interpolated bathymetry in the simulation domain.
Water 15 00919 g004
Figure 5. Comparison of simulated and measured water surface level data, (a) calibration period (1 to 31 January 2019), (b) validation period (1 to 31 October 2019).
Water 15 00919 g005
Figure 6. Currents roses comparison for simulations and measurements for the calibration period.
Water 15 00919 g006
Figure 7. Currents roses comparison for simulations and measurements for the validation period.
Water 15 00919 g007
Figure 8. Comparison of the measured (red line) and simulated (dashed blue line) temperature profiles and model results for each month (shaded area). Temperature ranges by month (max–min): Jan. (30.11–24.62 °C), Feb. (29.74–26.05 °C), Mar. (29.42–26.20 °C), Apr. (28.24–23.18 °C), May (29.24–22.61 °C), Jun. (29.69–24.70 °C), Jul. (29.63–24.13 °C), Aug. (29.39–24.55 °C), Sep. (26.73–23.20 °C), Oct. (25.39–22.16 °C), Nov. (26.08–21.36 °C), Dec. (26.58–22.77 °C).
Water 15 00919 g008
Figure 9. Comparison of measured (red line) and simulated (dashed blue line) salinity profiles and model results for each month (shaded area). Salinity ranges by month (max–min): Jan. (36.55–35.75 PSU), Feb. (36.97–36.19 PSU), Mar. (36.73–36.32 PSU), Apr. (36.54–36.07 PSU), May (36.51–35.19 PSU), Jun. (36.38–34.97 PSU), Jul. (36.50–34.85 PSU), Aug. (36.56–34.98 PSU), Sep. (36.53–35.09 PSU), Oct. (36.50–34.58 PSU), Nov. (36.49–34.80 PSU), Dec. (36.74–35.08 PSU).
Water 15 00919 g009
Figure 10. Trajectory of the plume formed by the discharge of the last diffuser of the Santa Marta submarine outfall with wave effects, center plume (red line), plume extension (dashed blue line).
Water 15 00919 g010
Figure 11. Plume merge from the 32 diffusers of Santa Marta’s submarine outfall. Color bar shows the dilution level with wave effects.
Water 15 00919 g011
Figure 12. Rise height of Santa Marta’s submarine outfall discharge with wave effects.
Water 15 00919 g012
Figure 13. Santa Marta’s submarine outfall dilution without and with wave effects.
Water 15 00919 g013
Figure 14. Density profile from January to December 2021 from RMA10 3D model result.
Water 15 00919 g014
Table 1. NMAE estimation, comparing results of the RMA10 model and field measurements.
JanuaryFebruaryMarchAprilMayJuneJulyAugustSeptemberOctoberNovemberDecember
Temperature0.00330.02020.02330.01340.02140.01910.01140.00410.03310.00510.00320.0001
Salinity0.0010.0010.0010.0010.0040.0030.0020.0010.00070.00480.00370.0045
Disclaimer/Publisher’s Note: The statements, opinions and data contained in all publications are solely those of the individual author(s) and contributor(s) and not of MDPI and/or the editor(s). MDPI and/or the editor(s) disclaim responsibility for any injury to people or property resulting from any ideas, methods, instructions or products referred to in the content.