Article

Implications of Accuracy of Global Glacier Inventories in Hydrological Modeling: A Case Study of the Western Himalayan Mountain Range

1
Department of Civil Engineering, University of Engineering and Technology, Peshawar 25000, Pakistan
2
Department of Civil Engineering, Jalozai Campus, University of Engineering and Technology, Peshawar 24210, Pakistan
3
Department of Mathematics, Islamia College, Peshawar 25000, Pakistan
4
International Water Management Institute (IWMI), Lahore 54800, Pakistan
*
Author to whom correspondence should be addressed.
Water 2023, 15(22), 3887; https://doi.org/10.3390/w15223887
Submission received: 8 October 2023 / Revised: 22 October 2023 / Accepted: 26 October 2023 / Published: 8 November 2023
(This article belongs to the Special Issue Ice, Snow and Glaciers and the Water Cycle)

Abstract

:
Alpine glaciers are a fundamental component of the cryosphere and are significantly sensitive to climate change. One such region is the Hindukush Karakoram Himalaya (HKH) and Tibetan Plateau (TP) region, which contains more than 40,000 glaciers. There are more than 12 glacier inventories available covering parts of (or the entire) HKH region, but these show significant uncertainties regarding the extent of glaciers. Researchers have used different glacier inventories without assessing their accuracy. This study, therefore, assessed the implications of the accuracy of global glacier inventories in hydrological modeling and future water resource planning. The accuracy assessment of most commonly used two global glacier inventories (Global Land Ice Monitoring from Space-GLIMS v 2.0 and Randolph Glacier Inventory-RGI v 6.0) has been carried out for three sub-basins of the Upper Indus Basin—the Swat, the Chitral, and the Kabul River basins (combined, this is referred to as the Great Kabul River Basin)—with a total basin area of 94,552.86 km2. Glacier outlines have been compared with various Landsat 7 ETM+, Landsat 8, high-resolution Google Earth images, and manually digitized debris-covered glacier outlines during different years. The total glacier area for the Great Kabul River Basin derived from RGI and GLIMS is estimated to be 2120.35 km2 and 1789.94 km2, respectively, which was a difference of 16.9%. Despite being sub-basins of the Great Kabul River Basin, the Swat, and the Chitral River basins were different by 54.74% and 19.71%, respectively, between the two inventories, with a greater glacierized area provided by RGI, whereas the Kabul River basin was different by 54.72%, with greater glacierized area provided by GLIMS. The results and analysis show that GLIMS underestimates glacier outlines in the Swat and the Chitral basins and overestimates glacier extents in the Kabul River basin. The underestimation is mainly due to the non-representation of debris-covered glaciers. The overestimation in GLIMS data is due to the digitization of seasonal snow as part of the glaciers. The use of underestimated GLIMS outlines may result in 5–10% underestimation of glacier-melt contribution to flows in the Swat River basin, while an underestimation of 7% to 15% is expected in the Chitral River Basin, all compared to RGI v 6.0 outlines. The overestimation of glacier-melt contribution to flows in the Kabul River basin is insignificant (1% to 2%) using GLIMS data. In summary, the use of the GLIMS inventory will lead to underestimated flows and show that the Great Kabul River Basin (particularly the Chitral River Basin) is less sensitive to climate change effects. Thus, the current study recommends the use of RGI v 6.0 (best glacier inventory) to revisit the existing biased hydro-climate studies and to improve future hydro-climate studies with the concomitant rectification of the MODIS snow coverage data. The use of the best glacier inventory will provide the best estimates of flow sensitivity to climate change and will result in well-informed decision-making, precise and accurate policies, and sustainable water resource management in the study area. The methodology adopted in the current study may also be used in nearby areas with similar hydro-climate conditions, as well as for the most recently released RGI v 7.0 data.

1. Introduction

Glaciers, one of the fundamental components of the cryosphere, are considered to be major reserves of fresh water [1,2]. People living in mountainous areas and further downstream in semi-arid and arid regions are directly or indirectly reliant on these freshwater reserves [3]. The sensitivity of complex alpine glaciers towards climate change has already been observed [1,4]. Future rises in temperature may induce negative glacier mass fluxes, causing an irreversible recession in the extent of glaciers, which can ultimately lead to an enhanced glacier-melt rate [5] for a few decades, followed by a significant decline, conferring serious threats to downstream water users and other important water ecosystems. In addition, due to an increase in global warming, intense/potential risks associated with the retreat of alpine glaciers, such as an increase in destructive flood events, droughts, debris flow, and landslides due to mountain slope failure, have been experienced at a global scale. For these reasons, alpine glaciers are deemed one of the most direct and apparent indicators of the effects of climate change [1,6,7,8].
The Hindukush Karakoram Himalaya (HKH) and Tibetan Plateau (TP) region, one of the giant alpine settings/ranges of the High Mountains Asia, also known as the “third pole” [4,9], contains the largest alpine glacier reserves outside the polar regions [4,10]. The HKH region contains more than 38,000 glaciers [11,12], spreading over an area of ~60,000 km2 [13,14,15]. Large Asian River basins, including the Indus, Amu Darya, Brahmaputra, Irrawaddy, Ganges, Salween, Mekong, Tarim, Yellow, and Yangtze basins, originate from the HKH [16]. More than 1.4 billion people residing in these river basins are direct and or indirect beneficiaries of the water resources from these rivers; the main uses are for irrigation, hydropower generation [17,18], drinking, navigation, sanitation, and industrial purposes [19]. The contribution of snow and glacier melt to the annual average flow ranges between 30% and 80% in various basins of the HKH alpine region [20,21,22,23,24].
However, contributions to river flow may vary with changes in climate. Therefore, glaciologists and hydrologists play key roles in determining and understanding the possible responses of such complex alpine glaciers towards climate change, as well as the associated variability in water resources. The knowledge of the impact of climate change on glaciers is vital for socio-economic implications along with sustainable water resource management and precise policy making, particularly in glacier-fed river basins. Hydro-climate modeling using the best available glacier outlines [14] is an effective approach to understanding and evaluating their impacts on water storage, release, and distribution in downstream areas [25].
The available hydro-climate studies have used various snow (such as MODIS snow-cover data) and glacier-covered areas (such as those based on GLIMS or RGI) in their hydrological models. It should be noted that studies have also adopted different models, such as The University of British Columbia Watershed Model (UBCWM) [26,27], the Spatial Processes in Hydrology (SPHY) model [23], the Snowmelt Runoff Model (SRM) [28], and the Soil and Water Assessment Tool (SWAT) model [29] for hydrologic modeling and to assess the response of glaciers to climate change. However, these hydrologic models primarily used hydroclimatic inputs, including the snow and glacier-covered areas, which were derived from diverse techniques and datasets.
According to [4], despite being a highly glacierized area, the HKH region is still lacking consistent and optimized representative datasets of glacier outlines. No or limited research studies have been conducted in this regard, such as the study of [30], which carried out an accuracy assessment of eight glacier inventories for the Tibetan Plateau.
Therefore, the use of any glacier inventory without assessing its accuracy at spatial and temporal scales may induce significant uncertainties and biases associated with glacier-melt contributions and their projection, particularly in large glacierized basins.
One of the major basins of the HKH region is the Indus Basin, where different snow and glacier datasets have been used during the last two decades without prior accuracy assessment [14,27,28,31,32,33,34]. None of the available studies carried out prior accuracy assessment of the glacier datasets in the entire or part of the Indus Basin. In addition, none of the available studies carried out an attempt to provide accurate glacier outlines by correcting and bridging the existing gaps in the available datasets. Therefore, the aim of this study is to carry out the accuracy assessment of glacier inventories for a few main sub-basins of the Upper Indus Basin (UIB) using the most commonly used RGI and GLIMS glacier inventories. The accuracy assessment of the glacier inventories has been carried out by the comparison of glacier outlines for snow (seasonal and perennial), clean ice, and debris-covered ice with the Landsat 7 ETM+, Landsat 8, and high-resolution Google Earth imageries together with manually digitized outlines debris-covered ice. On the basis of the above assessment, the best representative glacier outline dataset has been selected, derived, and recommended for each sub-basin. Furthermore, glacier-melt contributions to river flow on the basis of various glacier inventories and best available/proposed inventory have also been estimated and compared for the study area.

1.1. Study Area

One of the major river basins originating from the HKH region, where snow and glacier-melt contributions to river flow (in various sub-basins) are greater than 80% [23,24], is the Indus Basin. This basin can be divided into two main parts: (i) the Upper Indus Basin (UIB) and (ii) the Lower Indus Basin (LIB). The upper part of the Indus Basin lies in a high-altitude mountainous region of the HKH–Tibetan Plateau and is considered to be one of the dynamic hydrological regions [32,35] due to the presence of large glaciated clusters concomitant with high variability in hydro-meteorological conditions with respect to altitude [14]. Due to high dependency on snow and glacier melt, slight changes in climate, particularly temperature, can produce significant changes in river flow.
Therefore, this study covers the analysis of three major western river sub-basins of the UIB: the Swat River basin, the Chitral River Basin, and the Kabul River basin (Figure 1). The Swat and the Chitral Rivers are the indirect and major tributaries of the Kabul River. The combined river basin in this study is known as the Great Kabul River Basin, with a total area of 94,552.86 km2. A brief description of all the sub-basins is given below.

1.2. The Swat River Basin

The Swat River, originating in the Hindukush mountains, starts from the confluence of two rivers, the Utror and Ushu, in the Kalam Valley. The Swat River merges into the Kabul River at Chakdara with a total length of about 250 km and finally contributes to the Indus River near Nowshera. Numerous minor and major tributaries of the Swat River are the Arnowai, Barwai, Chail, Daral, Gahil, Jambil, Mankial, and Marghazar. The Swat River basin area is about 12,067.15 km2, with an elevation range between 572 m a.s.l and 5820 m a.s.l, with a steep rise from the south towards the north. The geographical location of the basin extends between 34°31′29.95″ to 35°54′3.61″ N and 71°12′36.15″ to 72°50′44.24″ E (Figure 1).
The lower (south-western) and upper (north-eastern) parts of the basin have significant variation in precipitation patterns, where summer monsoon rainfall strongly prevails in the lower parts, while the westerlies produce winter snowfall in the upper reaches. The maximum temperature of about 33 °C was observed in the month of June, whereas the lowest winter temperature of −2 °C was recorded during January [35].
Snowfall occurs and is stored during winter months, and snowmelt contributions start during spring to summer months. Snowmelt is one of the main sources of water supply from the UIB to the Indus River and contributes from 65% to 75% of the total runoff [36]. The reported percentage of snowmelt contributions in the Swat River basin also ranges between 65% and 75%. It is noteworthy that about 45% and 55% of the total precipitation in the Swat River basin is produced by westerlies and the monsoon [37], respectively. The average annual stream flow of 187 cusecs at the Chakdara flow gauging station has been measured from 1960 to 2011 [13], where annual precipitation ranges between 1000 mm and 1200 mm [35,38].

1.3. The Chitral River Basin

The Chitral River, one of the major tributaries of the Great Kabul River Basin, lies in the eastern part of Afghanistan and the northern part of Pakistan. The Chitral River originates in the glaciated Hindukush mountains with a catchment area of about 14,755.13 km2 and elevation ranges between 1059 m a.s.l and 7603 m a.s.l. The geographical area of the Chitral River Basin extends from 36°2′42.71″ to 36°43′38.73″ N and 71°38′2.71″ to 73°38′52.66″ E (Figure 1). The Mastuj River, after meeting the Lukhto River in the North of Chitral, joins the Chitral River up to its confluence with the Kunar River, located in the eastern part of Afghanistan. The Kabul River, after receiving a significant flow from the Kunar River, finally becomes part of the main Indus River at Attock/Nowshera.
The Chitral River is characterized by a steady water supply throughout the year, with a peak flow in the monsoon season. The maximum discharge over the 45 years from 1964 to 2009 was recorded as 54,225.67 cusecs, and the minimum discharge was 1624.47 cusecs [27]. The recorded annual average stream flow from 1960 to 2011 was 276.16 cusecs at the Chitral flow gauging station [14].

1.4. The Kabul River Basin

The Kabul River, one of the major tributaries of the upper part of the Indus River, forms a transboundary basin between Pakistan and Afghanistan. The Kabul River, originating in Afghanistan, flows through the two countries and joins the Indus River at Khairabad (Attock/Nowshera). The Kabul River has a basin area of about 67,730.58 km2. The average annual river flow of the Kabul River is approximately 26% of Afghanistan’s total river flow [39] and 10–12% of the total Indus River flow [29]. Therefore, the Kabul River is a critical source of fresh water to support nearly 35% of the total population of Afghanistan [39]. The Kabul River basin lies between 33°27′38.93″ to 34°21′30.27″ N and 67°48′33.06″ to 71°11′14.99″ E (Figure 1). The main source of the river flow is snowmelt. However, rainfall in late winter and early spring also contributes to the main stream flow. The recorded basin-wide annual precipitation reaches 1600 mm [40].

2. Datasets and Methods

There are more than 12 glacier inventories available for the HKH region. However, for the current study, two global glacier inventories (GLIMS v 2.0 and RGI v 6.0) have been selected for a detailed accuracy assessment. It is also noteworthy that other available inventories are either part of the selected global glacier inventories or available at a local/regional scale with limited practical applications, while few of the available inventories are outdated (such as Digital Chart of the World, DCW, and Glacier Length Change, GLC).

2.1. Global Land Ice Monitoring from Space (GLIMS) Version 2.0

GLIMS, a project carried out at the National Snow and Ice Data Center (NSIDC), is responsible for digitizing and providing detailed information about the glacier boundaries in a standard format on a large scale, almost for every part of the world. It is one of the major archives and has been used broadly in the studies conducted at regional and or global scales. GLIMS glacier outlines are publicly available and can be downloaded from http://www.glims.org/download/, accessed on 15 December 2018.
The GLIMS dataset provides glacier outlines in vector format (polygonal shape-files). These polygons collectively represent both glacier cover and internal rocks (internal rocks are not part of glaciers).

2.2. Randolph Glacier Inventory (RGI) Version 6.0

The Randolph Glacier Inventory (RGI) is one of the most comprehensive and up-to-date glacier inventories. The dataset contains glacier outlines for a global glacier area of about 682,605 km2. Compared to the other inventories, this dataset lacks the metadata and IDs of glaciers. However, this inventory can be used to estimate glacier extent and glacier-melt contributions at both regional/global scales.

2.3. Debris-Covered Glacier Outlines

Debris-covered glaciers in the study area are identified using the best available datasets. In this study, a manually digitized set of debris-covered glacier outlines has been used [41]. For the basins for which manually digitized debris cover is not available, high-resolution images from Google Earth have been used to identify debris-covered glaciers.
Therefore, due to the unavailability of a manually digitized set of debris-covered glaciers for the Kabul River basin, Landsat imagery supplemented by high-resolution Google Earth images has been used for the visual inspection and interpretation of debris-covered ice.

2.4. Landsat Imageries

To evaluate the accuracy of each glacier inventory, Landsat images have also been used. Landsat 7 ETM+ imageries used in the RGI database (1999–2003), together with recent imageries (Landsat 8 OLI/ TIRS) for different years, have been used for critical visual assessment. For this purpose, high-quality Landsat images with less than 10% cloud cover (except for one image for the Swat River basin with a cloud cover of 10.86%) were acquired for different years for the months with the least seasonal snow cover: July, August, and September. For the Chitral River Basin, Landsat images from the same year with less than 10% cloud cover are not available for the entire basin; therefore, images from different years with less than 10% cloud cover are downloaded and mosaicked to investigate different parts of the basin.
However, to avoid any discrepancy in the results, Landsat imageries from the same month for different years are used in the current study (Table 1). For this purpose, an attempt has also been made to use the images at the end of the ablation period, i.e., from 1 September to 30 September, when most of the seasonal snow is supposed to have melted away.
Landsat imageries have been downloaded free of cost using the website https://earthexplorer.usgs.gov/, accessed on 1 October 2019. The details of Landsat imageries used for the study area are provided in Table 1.

2.5. River Flow Data

The average annual stream flow data for the three gauging stations (one at each sub-basin) from 1980 to 2010 was obtained from the Surface Water Hydrology Project (SWHP) of the Water and Power Development Authority (WAPDA).

2.6. Methods

The methodology used for the accuracy assessment of the glacier inventories has been carried out by a comparison of glacier outlines for snow (seasonal and perennial), clean ice, and debris-covered ice with the Landsat imageries together with debris-covered ice (manually digitized outlines). Using visual interpretation techniques to identify snow, clean ice, and debris-covered ice is a time-consuming approach. This traditional method provides more precise results in studying/identifying all sizes of glacier boundaries, from very small to large glaciers. The band ratio and Normalized Difference Snow Index (NDSI) methods are the most common, time-effective, and robust techniques and can also be used for glacier mapping and comparison [42,43]. The authors in [1] used a traditional method to compare with other methods of separating snow and ice and quantifying glacier extent changes. The study showed that the results obtained from the band ratio were similar to those of visual observations. However, NDSI showed large glacier extents in comparison to visual interpretation and band ratio.
Based on the available studies, the main problem associated with NDSI and band ratio methods is the selection of the appropriate threshold required for the post-processing of images. The selection of improper thresholds may result in the inaccurate boundaries of snow and glaciers. On the other hand, visual interpretation technique greatly depends on the availability of high-quality and long time series satellite (Landsat) images. The Landsat images with minimum cloud cover help in identifying accurate glacier outlines. Fortunately, a set of 12 high-quality Landsat images for a late ablation period over a multiyear period covers the study area. Therefore, visual inspection has successfully been carried out in the current study, covering the entire areas of the Kabul, the Chitral, and the Swat River basins.
The step-by-step methodology adopted for the accuracy assessment and estimation of glacier-melt contributions to flow is outlined below:
  • In the first step, the glacier boundaries and area for each of the sub-basins have been estimated by intersecting the delineated basin boundary and respective glacier inventory. To estimate the glacier area based on the GLIMS dataset, areas for internal rocks have been excluded. The repair geometry tool was also applied to the GLIMS data to remove the errors generated by self-intersecting polygons.
  • In the second step, the percentage difference between the glacierized areas obtained from the two selected inventories has been calculated for each of the river basins.
  • In the third step, to compare the two inventories quantitatively, the glaciers in the basins are divided into the following five classes, all based on their areal extents:
    • Greater than 5 km2 (Large glaciers)
    • Greater than 3 and less than 5 km2 (Medium glaciers)
    • Greater than 1 and less than 3 km2 (Small glaciers)
    • Greater than 0.05 and less than 1 km2 (Very small glaciers)
    • Less than 0.05 km2 (Very very small glaciers)
  • In the fourth step, to compare both inventories, a quantitative assessment for all five classes was carried out.
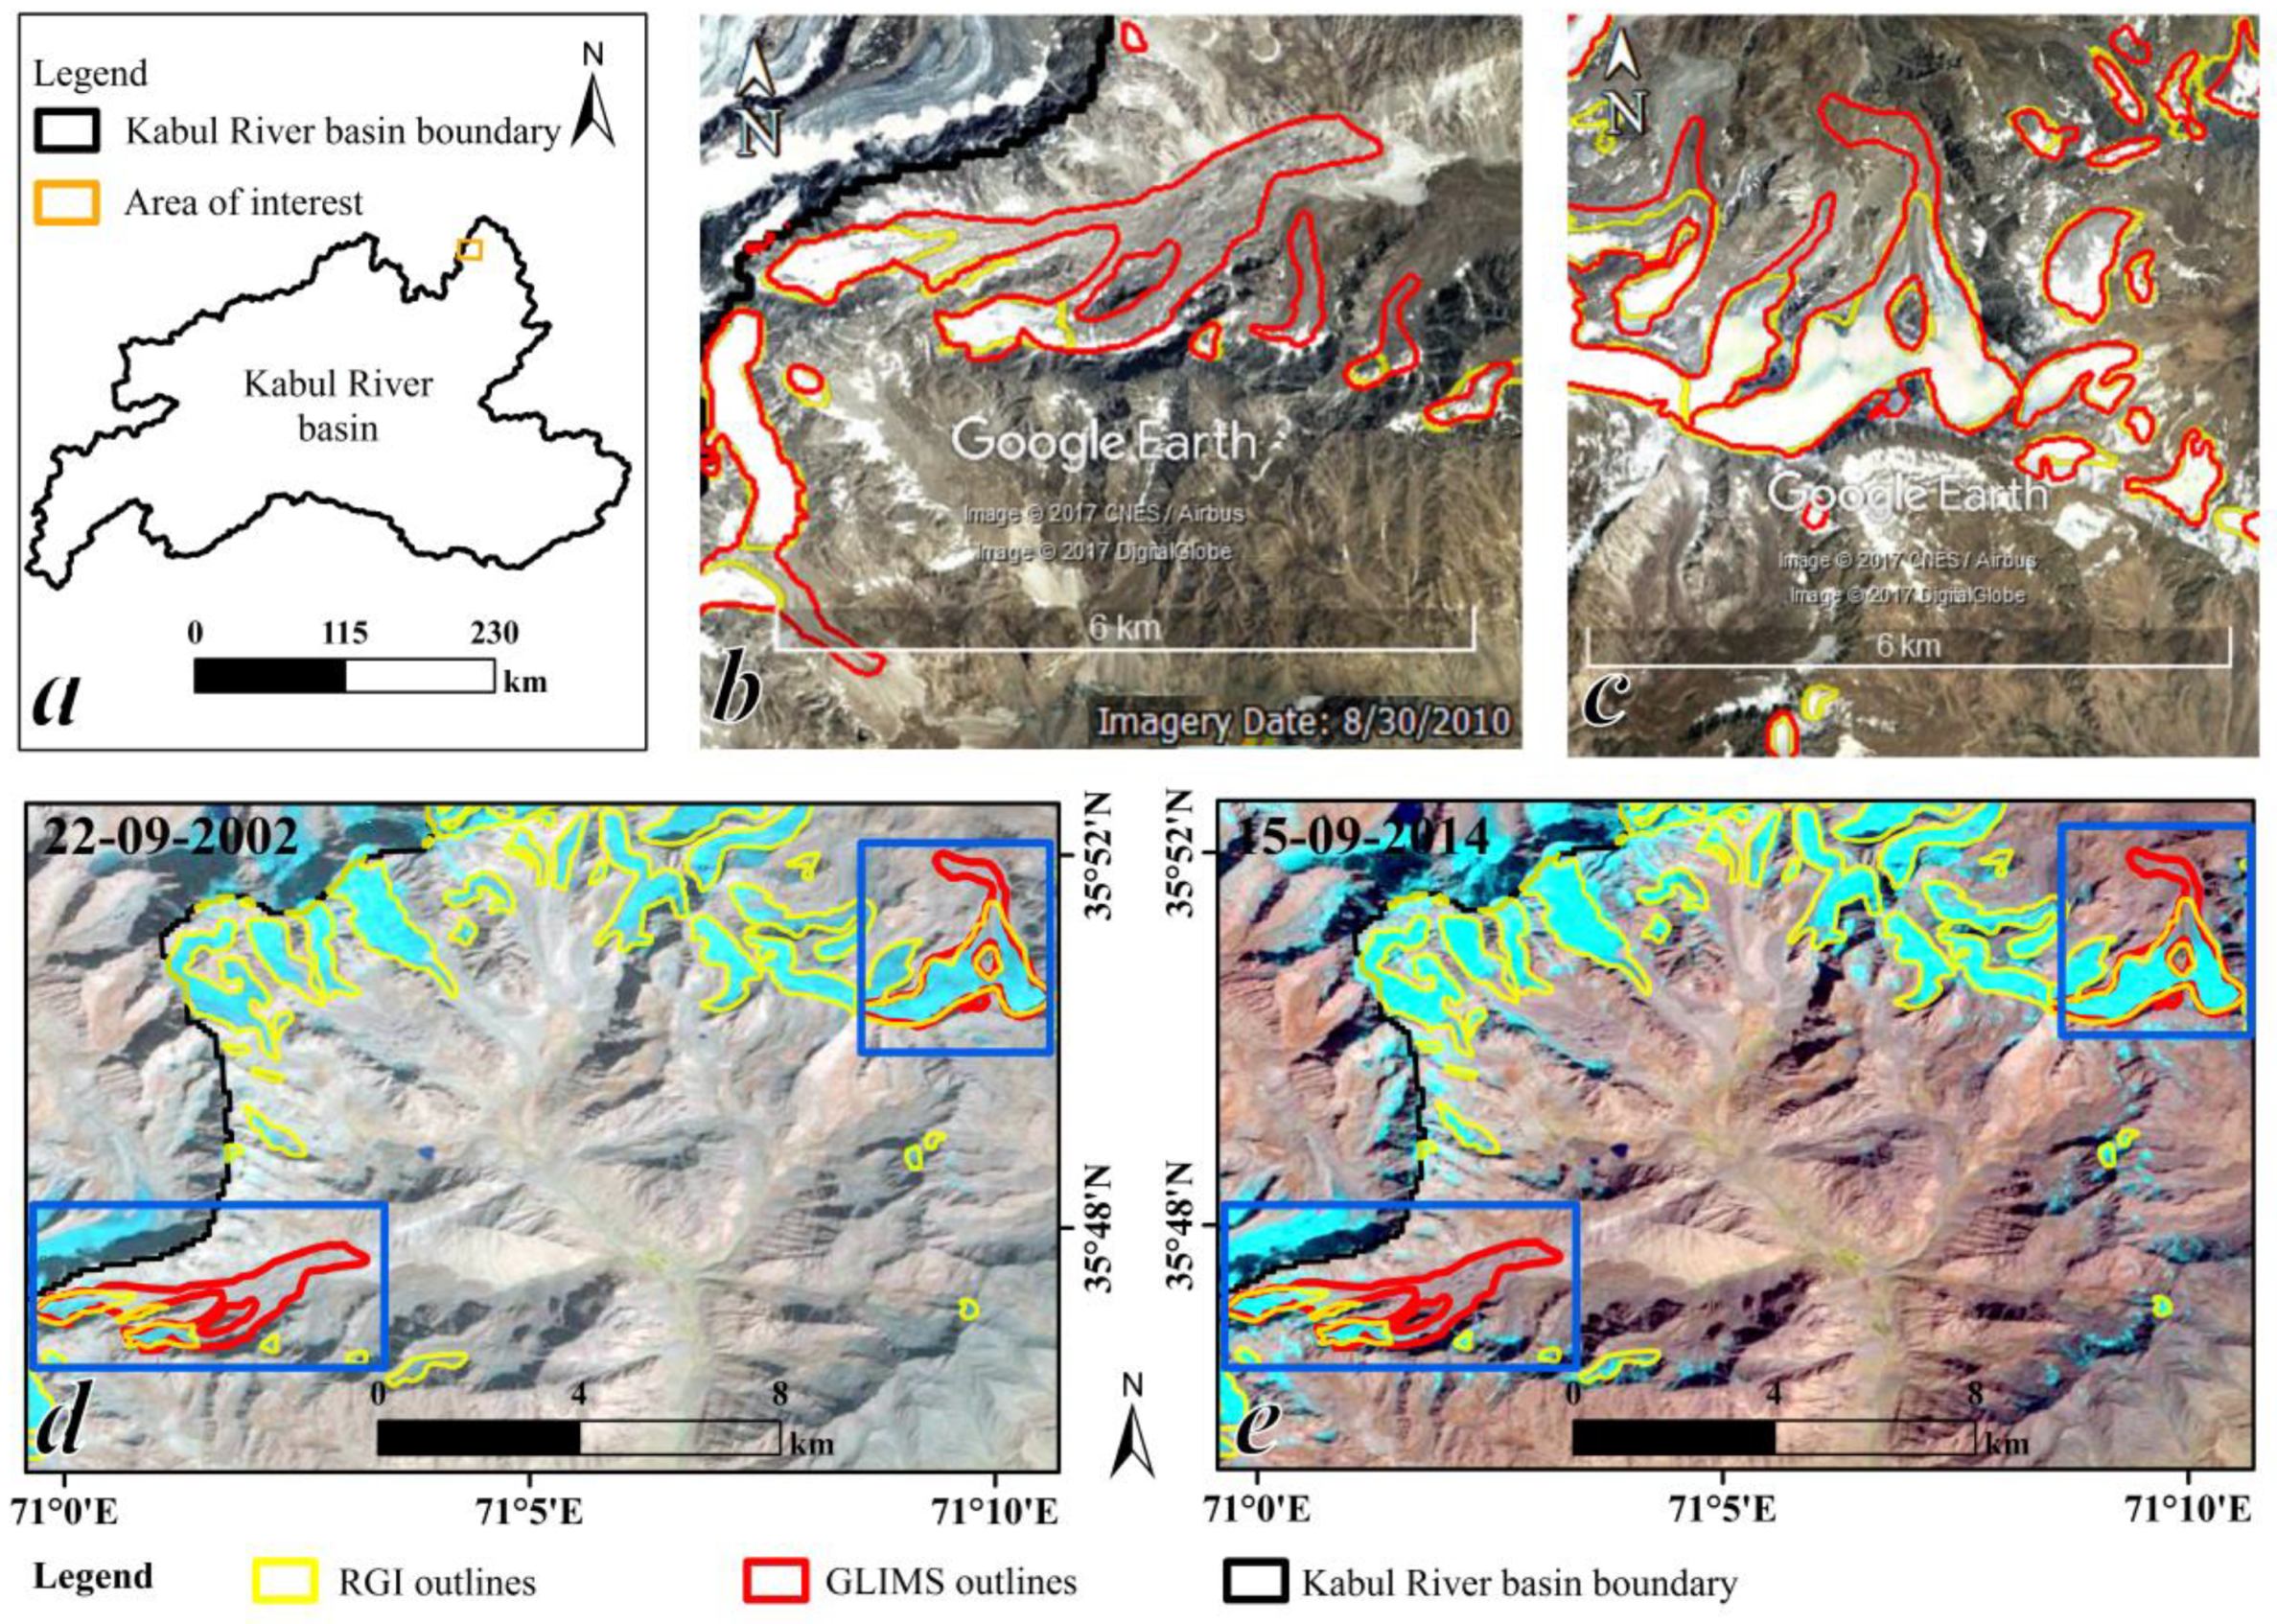
  • In the fifth step, a visual inspection of overall glaciers as well as debris-cover extent has been conducted. In this step, the glacier outlines were overlayed/superimposed on Landsat images of different years to check the accuracy of the outlines as well as to visualize/evaluate any seasonal snow as part of the glacier inventories. For debris-covered glacier outlines, Landsat images, as well as other remotely sensed images available in Google Earth, were used for a glacier outline overlay. Based on this analysis, the best available glacier inventory has been selected/derived and proposed for each basin.
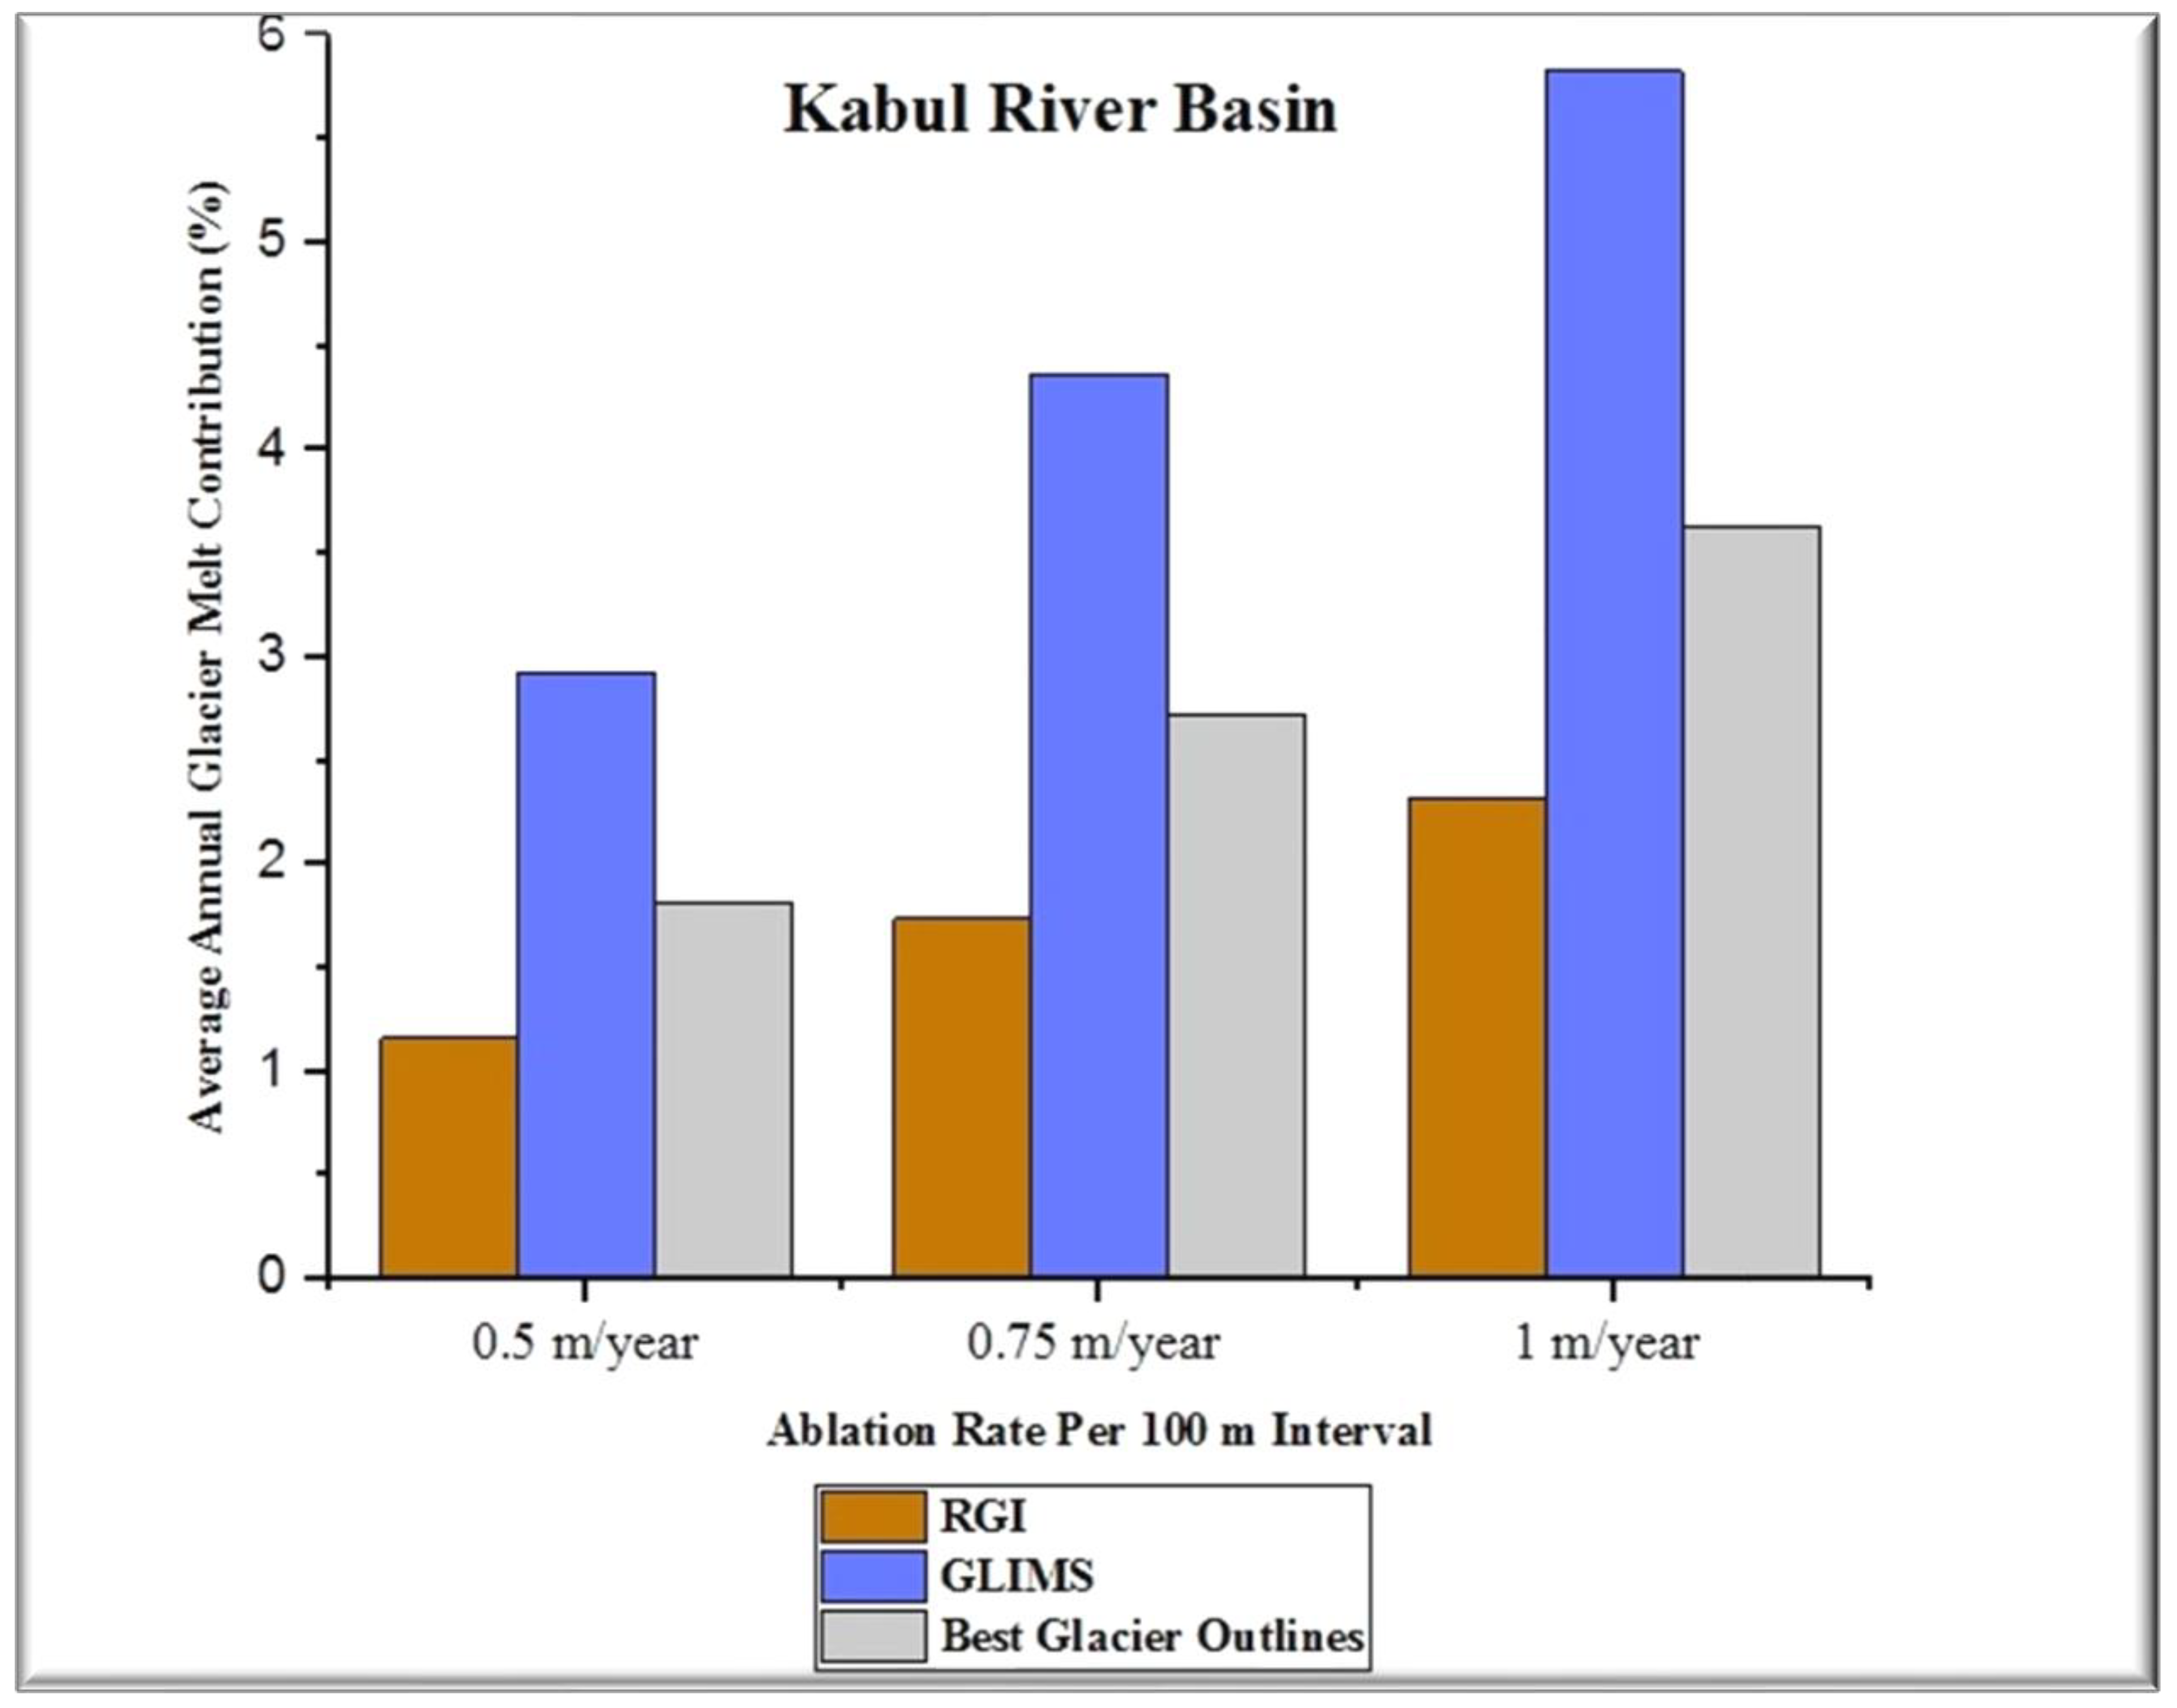
  • In the last step, the importance of the selected/derived best glacier inventories has been assessed by estimating glacier-melt contributions to flows of each basin. The glacier-melt contribution has been estimated using the method proposed by [21]. For this study, an equilibrium line altitude (ELA) of 5000 m.a.s.l based on the study conducted by [21] and [44] for the HKH region has been used. The ablation zone extracted from DEM (SRTM 90 m) has been subdivided into 100 m elevation bands. Ablation rates of 0.5 m/year, 0.75 m/year, and 1 m/year for 100 m intervals suggested by [21] have been used for annual glacier-melt estimation.

3. Results and Discussion

3.1. The Kabul River Basin

The estimated glacier area for the Kabul River basin based on RGI and GLIMS data are 115.55 km2 and 202.60 km2, respectively (Table 2). RGI estimates 428 glaciers in the Kabul River basin, and GLIMS estimates 689 glaciers. Although this basin is not a highly glacierized area in terms of large and medium glaciers, a concentration of glaciers of various sizes exists near the boundaries of Nuristan (a province of Afghanistan), sharing with Badakhshan (a province of Afghanistan) and Chitral (a district of Pakistan). There is a significant difference of 54.72% in glacierized areas based on the two inventories.
Table 2 provides estimates of various classes of glaciers. This table also shows no large glacier in the basin based on RGI data. Major areal differences are for small and very small glaciers. In addition, the glacier areas for each class show that most of the glaciers in the Kabul River basin are classified as small and very small. Most of these types of glaciers are found in the north and northern-eastern sides of the Mir Samir region of Afghanistan.

3.2. Large Glaciers (Greater than 5 km2)

The study of glaciers greater than 5 km2 for the Kabul River basin shows that, according to RGI, there is no large glacier, while GLIMS estimates only two large glaciers with a total surface area of about 15.35 km2. A thorough visual examination shows that RGI has not taken debris-covered glaciers into account, and this is the main cause of the non-existence of the large glaciers. A good match of GLIMS inventory with Google Earth images confirms that the large glaciers comprising numerous white perennial snow/ice masses exist in the Kabul River basin along the boundary shared by Badakhshan and Nuristan (provinces of Afghanistan) near the Kohe–Khrebek mountain range. These glaciers, in the form of a compound valley, exhibit debris-covered ice increase towards the glacier terminus tongue (Figure 2). In Figure 2, two large glaciers are shown in the Landsat images of 22-09-2002, 28-09-2013, 15-09-2014, and 18-09-2015. These images are compared with the Google Earth image shown in Figure 3, which substantiates the presence of debris-covered ice as a part of large glaciers.

3.3. Medium Glaciers (3 to 5 km2)

The analysis of medium glaciers suggests that, according to RGI outlines, there are only two medium glaciers in the Kabul River basin. GLIMS also shows these medium glaciers but reports slightly larger areas. GLIMS outlines overlaid on the Google Earth images show that three medium glaciers exist with significantly large extents of debris-covered ice at the terminus compared to RGI outlines, which did not consider debris-covered ice parts. Therefore, these medium glaciers are underestimated by RGI (Figure 4).

3.4. Small Glaciers (1 to 3 km2)

The glacierized area for small glaciers is estimated to be 32.54 km2 and 61.52 km2 by RGI and GLIMS data, respectively. Visual inspection indicates that the glacier outlines for small glaciers provided by the two glacier inventories along the boundary shared by Badakhshan and Nuristan near the Kohe–Khrebek mountain range are approximately the same (see glaciers in blue polygons in Figure 5 and Figure 6). However, the major difference exists in the glaciated area in the region of the Mir Samir and the divide between the two provinces of Afghanistan, namely Badakhshan and Panjshair. One such example is shown in Figure 7. In these regions, most of the small glaciers represented by GLIMS are classified as very small glaciers by RGI, ignoring the debris cover, resulting in the underestimation of the glaciated area. Compared to RGI, GLIMS shows a good match with the latest Google Earth image for small glaciers (Figure 7b).

3.5. Very Small and Very Very Small Glaciers (0.05 to 1 km2 and Less than 0.05 km2)

The study of glaciers ≤ 1 km2 in size (considered to be very small and very very small glaciers in the present study) reveals different results in contrast to the results suggested for glaciers > 1 km2. Unlike the glaciers > 1 km2 in size, GLIMS shows a good agreement with the high-resolution Google Earth images, which have overestimated the area of very small and very very small glaciers across the region. Such overestimation is shown in Figure 8, Figure 9 and Figure 10.
In most places, GLIMS considered seasonal snow as very small and very very small glaciers, resulting in the overestimation of glacier area (Figure 8). Seasonal snow patches are clearly visible in Figure 8c but are absent in the other Landsat images for 22-09-2002, 28-09-2013, 15-09-2014, and 07-09-2017 (Figure 8a,b,d). In addition, most of the very small glaciers that have been digitized by GLIMS are neither seasonal snow nor debris-covered glaciers (Figure 9). However, RGI outlines seem quite accurate for these two classes of glacier.

3.6. Comparison of Glacier Melts Contribution to Flows

The understanding of the glacier-melt contribution to river flow and its projections for a changing climate is vital in the Upper Indus Basin, particularly for the transboundary sub-basins. In this part of the study, the glacier-melt contribution to flows has been estimated based on RGI and GLIMS together with the best (derived from the combination of best parts of both of the inventories) glacier inventory in all three sub-basins of the Great Kabul River Basin. SRTM 90 m (DEM) has been used to derive the glacier area from the glacier inventories at various altitudinal zones at 100 m intervals.
Figure 10 shows the annual contribution of glacier melt to the river flow for the three sub-basins using RGI, GLIMS, and Best Glacier Outlines. Results clearly show that the annual glacier-melt contribution from RGI/ Best Glacier Outlines in the Swat River basin accounts for 9.81%, 14.72%, and 19.62% of average annual river flow, while glacier melt based on GLIMS inventory is 4.89%, 7.34%, and 9.78% for different ablation rates. Glaciers in the highly glacierized area of the Chitral River Basin show a significant melt contribution of 26.99%, 40.52%, and 54.03% to the annual stream flow using RGI/Best Glacier Outlines, and from GLIMS, these values are estimated to be 20.93%, 31.39%, and 41.86%. In contrast, the Kabul River basin, with the less glaciated area, shows 1.16%, 1.74%, and 2.32% of glacier melt from RGI inventory, and 2.92%, 4.37%, and 5.83% of glacier melt from GLIMS inventory. However, glacier-melt contributions from the Best Glacier Outlines in the Kabul River basin are 1.82%, 2.72%, and 3.63% of the annual river flow. Overall, the total glacier-melt contribution using Best Glacier Outlines for the Great Kabul River Basin is approximately 12%, 18%, and 24% to the Indus River (Figure 10). In summary, RGI and Best Glacier Outlines provide greater glacier-melt contributions to flows compared to GLIMS data. Therefore, the use of GLIMS inventory will result in underestimated flows and/or in the Great Kabul River Basin (particularly the Chitral River Basin) being less sensitive to the rise in temperature and the effects of climate change.

3.7. Significance of the Current Study

The current study compares two of the most commonly used glacier inventories and points out their biases/discrepancies. The result of this study will improve the understanding of the hydroclimatic impact in the Greater Kabul River basin and will assist in the rectification of glacier inventories used in the current study. The methodology can be opted in other regions of the world.
In addition, the current proposed best inventory can be used for the rectification of satellite datasets commonly used in various hydro-climate studies (see Table 3). These studies used snow cover and glacier cover derived from MODIS and Landsat images. Landsat image classification on a daily and weekly basis is not possible due to the non-availability of images on a daily basis, the non-availability of images on the same date for large areas, and prolonged analysis and computation time. Therefore, depending on availability and accessibility, researchers prefer to use MODIS snow cover in their analysis. On the one hand, MODIS, in comparison to Landsat images, proves to be the best choice for hydro-climate modeling studies, as MODIS data provides good spatial and temporal data. However, on the other hand, MODIS data have a coarse spatial resolution (500 m), which hinders the identification of small and debris-covered glaciers.
Therefore, to reduce the uncertainties and biases, the results of the current study can be used to improve and rectify MODIS snow-cover images for small glaciers as well as for debris-covered ice/glaciers.
Furthermore, the glacier area from RGI v 4.0 (dataset frequently used in the available recent studies, see Table 4) shows an overall difference of 4.37% with RGI v 6.0 for the Great Kabul River Basin. However, at a regional scale, the difference is more pronounced, with 45.22% for the Kabul River basin compared to the Swat and the Chitral River basins, where differences are 5.96% and 2.27%, respectively. The estimates show an underestimation of RGI v 4.0 for the Swat River basin and an overestimation for the Chitral and the Kabul River basins (Column 5 of Table 4). Significant differences between another commonly used global inventory GLIMS and best representative glacier outlines (RGI v.6.0) may provide biased results, especially for the Swat River basin, which estimates a pronounced difference of 54.6% with an underestimation of glacier area by GLIMS. Therefore, the use of either RGI v 4.0 or GLIMS data may result in biased estimates and ill-informed decision-making. Therefore, existing studies (Table 3) where GLIMS and RGI v 4.0 were used need to be revisited and corrected.

4. Conclusions and Recommendations

On the basis of the above analysis, observations, and results of each basin, the conclusions and recommendations are summarized as follows:
  • Use of global glacier inventories without accuracy assessment is likely to produce under- or overestimation in hydro-climate modeling (flows and floods).
  • Use of GLIMS and or RGI inventories in the Kabul, the Chitral, and the Swat River basins may result in a 1–2%, 7–15%, or 5–10% increase/decrease, respectively.
  • Both RGI and GLIMS glacier inventories show uncertainties and inaccuracies for various classes/sizes of glaciers in the Kabul River basin.
  • For the glaciers in size > 1 km2 classified as large, medium, and small glaciers, GLIMS outlines show higher consistency with the Google Earth images. In contrast, RGI ignored the digitization of debris-covered ice parts of such glaciers, resulting in an underestimation of glacier extent.
  • The results derived for the glaciers in size < 1 km2 indicate a significant discrepancy in glacier area by GLIMS, as it considered seasonal snow to be part of the glaciers.
  • Based on a significant contrast in results for the glaciers greater and less than 1 km2, none of the two global glacier inventories can be recommended as the best representative glacier inventory for the entire basin. It is, therefore, recommended to use GLIMS glacier outlines for glacier sizes equal to or greater than 1 km2 and RGI for glaciers less than 1 km2. The derived inventory from the recommended classes is the best glacier inventory for the Greater Kabul River basin.
  • The present study also concludes that glacier-melt contribution to the total observed stream flow of the individual basin varies extensively for different ablation rates. However, the total melt from the glacierized area of the Great Kabul River Basin represents approximately 12%, 18%, and 24% (based on different ablation rates) of the total average annual observed stream flow.

Limitations and Future Needs

  • Little uncertainties in the results can be expected in identifying the debris-covered glacier outlines in the Kabul River basin based on considering missing debris-covered glacier outlines for the basin. However, a careful attempt has been made to minimize the errors using high-quality Google Earth images. It is, therefore, recommended to develop debris-covered glacier outlines for the basin.
  • To understand the dynamics of hydro-climatology of the transboundary basins, it is recommended to conduct transboundary hydrologic modeling based on the available best and most accurate datasets, such as those evaluated in this study.
  • In the current study, the glacier-melt contribution has been estimated considering a single altitude as ELA (5000 m) for all basins. However, the estimated values may vary from year to year, with topography, response to climate change, and the existence of various types of glaciers in different basins. It is, therefore, recommended to determine the average ELA from in situ observations and or historic glaciological data.
  • RGI v 7.0 has been recently released and needs to be assessed using the above or similar methodology.
  • Glacier shrinkage and depletion has not been considered in the current study. The available glacier inventories developed during different years may vary in size due to glacial shrinkage and may be considered in future research.

Author Contributions

H.A. (Haleema Attaullah) conceived the research idea and carried out the analysis together with drafting the manuscript, A.K. provided inputs in carrying out the research and drafting the manuscript, M.K. provided inputs in manuscript writeup and review, H.A. (Hadia Atta) provided inputs in analysis and drafting the manuscript, and M.S.I. provided inputs in drafting manuscript and review. All authors have read and agreed to the published version of the manuscript.

Funding

This research received no external funding.

Informed Consent Statement

All authors gave their informed consent for inclusion before they participated in the study.

Data Availability Statement

Data will be available upon a formal request to the corresponding author.

Conflicts of Interest

The authors declare no conflict of interest.

References

  1. Man, Q.X.; Guo, H.D.; Liu, G.; Dong, P.L. Comparison of different methods for monitoring glacier changes observed by Landsat images. IOP Conf. Ser. Earth Environ. Sci. 2014, 17, 012127. [Google Scholar] [CrossRef]
  2. Rankl, M.; Kienholz, C.; Braun, M. Glacier changes in the Karakoram region mapped by multimission satellite imagery. Cryosphere 2014, 8, 977–989. [Google Scholar] [CrossRef]
  3. Alifu, H.; Tateishi, R.; Johnson, B. A new band ratio technique for mapping debris-covered glaciers using Landsat imagery and a digital elevation model. Int. J. Remote Sens. 2015, 36, 2063–2075. [Google Scholar] [CrossRef]
  4. Bajracharya, S.R.; Maharjan, S.B.; Shrestha, F.; Guo, W.; Liu, S.; Immerzeel, W.; Shrestha, B. The glaciers of the Hindu Kush Himalayas: Current status and observed changes from the 1980s to 2010. Int. J. Water Resour. Dev. 2015, 31, 161–173. [Google Scholar] [CrossRef]
  5. Ragettli, S.; Immerzeel, W.W.; Pellicciotti, F. Contrasting climate change impact on river flows from high-altitude catchments in the Himalayan and Andes Mountains. Proc. Natl. Acad. Sci. USA 2016, 113, 9222. [Google Scholar] [CrossRef] [PubMed]
  6. Haeberli, W.; Hoelzle, M.; Paul, F.; Zemp, M. Integrated monitoring of mountain glaciers as key indicators of global climate change: The European Alps. Ann. Glaciol. 2017, 46, 150–160. [Google Scholar] [CrossRef]
  7. Zhao, Q.; Zhang, S.; Ding, Y.J.; Wang, J.; Han, H.; Xu, J.; Zhao, C.; Guo, W.; Shangguan, D. Modeling Hydrologic Response to Climate Change and Shrinking Glaciers in the Highly Glacierized Kunma Like River Catchment, Central Tian Shan. J. Hydrometeorol. 2015, 16, 2383–2402. [Google Scholar] [CrossRef]
  8. Rastner, P.; Bolch, T.; Mölg, N.; Machguth, H.; Le Bris, R.; Paul, F. The first complete inventory of the local glaciers and ice caps on Greenland. Cryosphere 2012, 6, 1483–1495. [Google Scholar] [CrossRef]
  9. Soncini, A.; Bocchiola, D.; Confortola, G.; Bianchi, A.; Rosso, R.; Mayer, C.; Lambrecht, A.; Palazzi, E.; Smiraglia, C.; Diolaiuti, G. Future Hydrological Regimes in the Upper Indus Basin: A Case Study from a High-Altitude Glacierized Catchment. J. Hydrometeorol. 2014, 16, 306–326. [Google Scholar] [CrossRef]
  10. Rasul, G.; Dahe, Q.; Chaudhry, Q.Z. Global Warming and Melting Glaciers along Southern Slopes of HKH Ranges. Pak. J. Meteorol. 2008, 5, 63–76. [Google Scholar]
  11. Bajracharya, S.R.; Shrestha, B. The Status of Glaciers in the Hindu Kush—Himalayan Region; International Centre for Integrated Mountain Development: Kathmandu, Nepal, 2011. [Google Scholar]
  12. Pfeffer, W.T.; Arendt, A.A.; Bliss, A.; Bolch, T.; Cogley, J.G.; Gardner, A.S.; Hagen, J.O.; Hock, R.; Kaser, G.; Kienholz, C.; et al. The Randolph glacier inventory: A globally complete inventory of glaciers. J. Glaciol. 2014, 60, 537–552. [Google Scholar] [CrossRef]
  13. Kääb, A.; Berthier, E.; Nuth, C.; Gardelle, J.; Arnaud, Y. Contrasting patterns of early twenty-first-century glacier mass change in the Himalayas. Nature 2012, 488, 495. [Google Scholar] [CrossRef] [PubMed]
  14. Khan, A.; Naz, B.S.; Bowling, L.C. Separating snow, clean and debris covered ice in the Upper Indus Basin, Hindukush-Karakoram-Himalayas, using Landsat images between 1998 and 2002. J. Hydrol. 2015, 521, 46–64. [Google Scholar] [CrossRef]
  15. You, Q.-L.; Ren, G.-Y.; Zhang, Y.-Q.; Ren, Y.-Y.; Sun, X.-B.; Zhan, Y.-J.; Shrestha, A.B.; Krishnan, R. An overview of studies of observed climate change in the Hindu Kush Himalayan (HKH) region. Adv. Clim. Change Res. 2017, 8, 141–147. [Google Scholar] [CrossRef]
  16. Immerzeel, W.W.; van Beek, L.P.H.; Bierkens, M.F.P. Climate change will affect the Asian water towers. Science 2010, 328, 1382–1385. [Google Scholar] [CrossRef] [PubMed]
  17. Bocchiola, D.; Diolaiuti, G.; Soncini, A.; Mihalcea, C.; D’Agata, C.; Mayer, C.; Lambrecht, A.; Rosso, R.; Smiraglia, C. Prediction of future hydrological regimes in poorly gauged high altitude basins: The case study of the upper Indus, Pakistan. Hydrol. Earth Syst. Sci. 2011, 15, 2059–2075. [Google Scholar] [CrossRef]
  18. Lutz, A.F.; Immerzeel, W.W.; Kraaijenbrink, P.D.A.; Shrestha, A.B.; Bierkens, M.F.P. Climate Change Impacts on the Upper Indus Hydrology: Sources, Shifts and Extremes. PLoS ONE 2016, 11, e0165630. [Google Scholar] [CrossRef]
  19. Khan, A.; Richards, K.S.; Parker, G.T.; McRobie, A.; Mukhopadhyay, B. How large is the Upper Indus Basin? The pitfalls of auto-delineation using DEMs. J. Hydrol. 2014, 509, 442–453. [Google Scholar] [CrossRef]
  20. Racoviteanu, A.; Armstrong, R.; Williams, M. Evaluation of an ice ablation model to estimate the contribution of melting glacier ice to annual discharge in the Nepal Himalaya. Water Resour. Res. 2013, 49, 5117–5133. [Google Scholar] [CrossRef]
  21. Winston, Y.; Yi-Chen, Y.; Andre, S.; Donald, A.; Casey, B.; James, W.; Dario, D.; Sherman, R. Indus Basin of Pakistan: Impacts of Climate Risks on Water and Agriculture; World Bank Group: Washington, DC, USA, 2013; Volume 1. [Google Scholar]
  22. Lutz, A.F.; Immerzeel, W.W.; Kraaijenbrink, P.D.A. Gridded Meteorological Datasets and Hydrological Modelling in the Upper Indus Basin; FutureWater: Wageningen, The Netherlands, 2014. [Google Scholar]
  23. Lutz, A.F.; Immerzeel, W.W.; Shrestha, A.B.; Bierkens, M.F.P. Consistent increase in High Asia’s runoff due to increasing glacier melt and precipitation. Nature Clim Change advance online publication. Nat. Clim. Change 2014, 4, 587–592. [Google Scholar] [CrossRef]
  24. Mukhopadhyay, B.; Khan, A. Rising river flows and glacial mass balance in central Karakoram. J. Hydrol. 2014, 513, 192–203. [Google Scholar] [CrossRef]
  25. Uhlmann, B.; Jordan, F.; Beniston, M. Modelling runoff in a Swiss glacierized catchment-part I: Methodology and application in the Findelen basin under a long-lasting stable climate. Int. J. Climatol. 2013, 33, 1293–1300. [Google Scholar] [CrossRef]
  26. Ali, S.; Li, D.; Congbin, F.; Khan, F. Twenty first century climatic and hydrological changes over Upper Indus Basin of Himalayan region of Pakistan. Environ. Res. Lett. 2015, 10, 014007. [Google Scholar] [CrossRef]
  27. Naeem, U.; Hashmi, H.; Mughal, H.-U.-R.; Shakir, A.S. Flow trends in river Chitral due to different scenarios of glaciated extent. KSCE J. Civ. Eng. 2013, 17, 244–251. [Google Scholar] [CrossRef]
  28. Adnan, M.; Nabi, G.; Poomee, M.S.; Ashraf, A. Snowmelt runoff prediction under changing climate in the Himalayan cryosphere: A case of Gilgit River Basin. Geosci. Front. 2017, 8, 941–949. [Google Scholar] [CrossRef]
  29. Iqbal, M.S.; Dahri, Z.H.; Querner, E.P.; Khan, A.; Hofstra, N. Impact of climate change on flood frequency and intensity in the kabul river basin. Geosciences 2018, 8, 114. [Google Scholar] [CrossRef]
  30. He, X.; Zhou, S. An Assessment of Glacier Inventories for the Third Pole Region. Front. Earth Sci. 2022, 10, 848007. [Google Scholar] [CrossRef]
  31. Hasson, S.; Lucarini, V.; Khan, M.R.; Petitta, M.; Bolch, T.; Gioli, G. Early 21st century snow cover state over the western river basins of the Indus River system. Hydrol. Earth Syst. Sci. 2014, 18, 4077–4100. [Google Scholar] [CrossRef]
  32. Atif, I.; Mahboob, M.A.; Iqbal, J. Snow cover area change assessment in 2003 and 2013 using MODIS data of the upper Indus basin Pakistan. J. Himal. Earth Sci. 2015, 48, 117–128. [Google Scholar]
  33. Ahmad, S.; Israr, M.; Liu, S.; Hayat, H.; Gul, J.; Wajid, S.; Ashraf, M.; Baig, S.U.; Tahir, A.A. Spatio-temporal trends in snow extent and their linkage to hydro-climatological and topographical factors in the Chitral River Basin (Hindukush, Pakistan). Geocarto Int. 2018, 35, 711–734. [Google Scholar] [CrossRef]
  34. Koppes, M.; Rupper, S.; Asay, M.; Winter-Billington, A. Sensitivity of glacier runoff projections to baseline climate data in the Indus River basin. Front. Earth Sci. 2015, 3, 59. [Google Scholar] [CrossRef]
  35. Bacha, M.S.; Nafees, M.; Adnan, S. Farmers’ Perceptions about Climate Change Vulnerabilities and their Adaptation Measures in District Swat. Sarhad J. Agric. 2018, 34, 311–326. [Google Scholar] [CrossRef]
  36. SUPARCO. Estimation of Snow Cover for Year 2013 (Indus Basin). 36. 2013. Available online: https://reliefweb.int/report/pakistan/pakistan-monsoon-update-issue-2-28-july-2-august-2013 (accessed on 1 October 2019).
  37. Malik, M.A. Characterizing snowmelt regime of the river swat—A case study. Tech. J. 2015, 20, 95–103. [Google Scholar]
  38. Dahri, Z.H.; Ahmad, B.; Leach, J.H.; Ahmad, S. Satellite-based snow cover distribution and associated snow melt runoff modeling in Swat River Basin of Pakistan. Proc. Pak. Acad. Sci. 2011, 48, 19–32. [Google Scholar]
  39. World Bank. Afghanistan—Scoping Strategic Options for Development of the Kabul River Basin: A Multisectoral Decision Support System Approach; World Bank: Washington, DC, USA, 2010; Volume 1. [Google Scholar]
  40. Lashkaripour, G.R.; Hussaini, S.A. Water resource management in Kabul river basin, eastern Afghanistan. Environmentalist 2008, 28, 253–260. [Google Scholar] [CrossRef]
  41. Sher, M. Region-Wide Glacier Mass Balance Changes in the Indus Basin during the First Decade of 21st Century. Ph.D. Thesis, Institute of Tibetan Plateau Research, Beijing, China, 2017. [Google Scholar]
  42. Paul, F.; Barrand, N.; Baumann, S.; Berthier, E.; Bolch, T.; Casey, K.; Frey, H.; Joshi, S.P.; Konovalov, V.; Le Bris, R.; et al. On the accuracy of glacier outlines derived from remote-sensing data. Ann. Glaciol. 2013, 54, 171–182. [Google Scholar] [CrossRef]
  43. Paul, F.; Frey, H.; Le Bris, R. A new glacier inventory for the European Alps from Landsat TM scenes of 2003: Challenges and results. Ann. Glaciol. 2017, 52, 144–152. [Google Scholar] [CrossRef]
  44. Butt, M.J. Exploitation of Landsat data for snow zonation mapping in the Hindukush, Karakoram and Himalaya (HKH) region of Pakistan. Hydrol. Sci. J. 2013, 58, 1088–1096. [Google Scholar] [CrossRef]
  45. Attaullah, H.; Khan, A.; Khan, M.; Khan, F.; Ali, S.; Masud, T.; Iqbal, M.S. The Karakoram Anomaly: Validation through Remote Sensing Data, Prospects and Implications. Water 2022, 14, 3157. [Google Scholar] [CrossRef]
Figure 1. The study area is shown as a transboundary basin between Pakistan and Afghanistan. The lower figure shows enlarged basins in various colors. The Great Kabul River Basin composed of three sub-basins, namely the Swat River basin (purple), the Chitral River Basin (green), and the Kabul River basin (red). The junction point of the Himalayas–Karakoram and Hindukush is also demarcated.
Water 15 03887 g001
Figure 2. (ad) The Landsat images for the dates 22-09-2002, 28-09-2013, 15-09-2014, and 18-09-2015 showing compound valley-based large glaciers with debris-covered ice at the terminus. The presence of debris-covered ice has also been confirmed from the Google Earth image in Figure 3, showing the same glaciers.
Water 15 03887 g002
Figure 3. Google Earth image of 08/30/2010. The inset shows the Kabul River basin boundary along with the area of interest. Red represents the GLIMS outlines, and yellow represents the RGI outlines. The image clearly shows that RGI has underestimated the glacier areas by ignoring debris-covered ice.
Water 15 03887 g003
Figure 4. The locations of glaciers in the basin are shown in (a). Comparison of Landsat images for the dates 22-09-2002 and 15-09-2014 (d,e) with Google Earth images (b,c) of 08/30/2010 providing evidence that RGI has underestimated the glaciers (see within blue rectangles) by not considering debris-covered ice. However, GLIMS is showing consistency with Google Earth images for these medium glaciers.
Water 15 03887 g004
Figure 5. Google Earth image of 08/30/2010 showing little difference between the two glacier inventories for small glaciers.
Water 15 03887 g005
Figure 6. Comparison of a Landsat image from 15-09-2014 with a Google Earth image in Figure 7 showing small glaciers (within the blue polygon) along the Badakhshan and Nuristan boundary near the Kohe–Khrebek mountain range. The inset shows the Kabul River basin boundary and area of interest.
Water 15 03887 g006
Figure 7. The Landsat image for 28-09-2003 (a) and Google Earth image (b) show small glaciers covered with debris in the region of Mir Samir (Afghanistan). The area of interest is shown in (c).
Water 15 03887 g007
Figure 8. Landsat images obtained for 22-09-2002 (a), 28-09-2013 (b), 15-09-2014 (c), and 07-09-2017 (d) showing very small and very very small glaciers across the Kabul River basin. Seasonal snow patches can be observed in the image of 15-09-2014 (c).
Water 15 03887 g008
Figure 9. Landsat images obtained for 22-09-2002 (a), 28-09-2013 (b), 15-09-2014 (c), and 07-09-2017 (d) confirming that GLIMS has digitized the glacier boundaries for most of the very small and very very small glaciers, which are neither seasonal snow nor debris-covered ice.
Water 15 03887 g009
Figure 10. Glacier-melt contribution from the Kabul River basin to Kabul River flow for ablation rates 0.5 m/year, 0.75 m/year, and 1 m/year for 100 m intervals using GLIMS, RGI, and Best Glacier Outlines. The Best Glacier Outlines for the Kabul River basin (GLIMS for >1 km2 glacier sizes and RGI for <1 km2 glacier sizes) are shown in gray.
Water 15 03887 g010
Table 1. Detail of Landsat products used in the current study.
ProductDate of Acquisition%Age of Cloud CoverResolutionBasinLandsat Scene (ID)
Landsat 7 ETM+22/09/2002030The Kabul River basinLE71520352002265EDC00
Landsat 828/09/20133.730The Kabul River basinLC81520352013271LGN01
Landsat 815/09/20140.4730The Kabul River basinLC81520352014258LGN01
Landsat 818/09/20153.8830The Kabul River basinLC81520352015261LGN01
Landsat 807/09/20173.0630The Kabul River basinLC81520352017250LGN00
Table 2. Glacier area for each class of glaciers by RGI and GLIMS for the Kabul River basin.
Class No.Type of GlacierGlacier Size (km2)Glacier Area by
RGI (km2)
Glacier Area by
GLIMS (km2)
1Large>5015.24
2Medium3–58.5010.46
3Small1–332.5461.52
4Very small0.05–173.20111.52
5Very very small<0.051.313.88
Total 115.55202.60
Table 3. List of available hydro-climate studies where various satellite datasets have been used for deriving snow and glacier areas for different purposes.
SourcePurpose of StudyDatasets UsedDescription
[33]Hydroclimatic study conducted for the Chitral River BasinMODIS 8-day product for (2000–2016)Snow cover was estimated from MODIS data for trend analysis
[18]For Hydroclimatic studiesRGI v 4.0Glacier area was estimated using RGI v 4.0 to be used in hydrologic modeling for the assessment of seasonal water availability
[34]Estimation of glacier-melt flux for the UIB (including the Great Kabul River basins)RGI v 4.0Glacier area was obtained from RGI v 4.0
[32]Changes in snow-cover extent in the UIBMODIS product for 2003 and 2013Snow-covered area was estimated from MODIS data using NDSI, Band threshold values, and classification of satellite images
[31]Estimation of snow coverage in various parts of the UIB (including the Great Kabul River Basin) by comparing daily MODIS images with RGIRGI v 4.0/MODIS/LandsatThe results showed an underestimation of snow coverage by MODIS product when compared with the glacier area extracted from RGI v 4.0 for all sub-basins. However, in comparison to Landsat, MODIS showed underestimated and overestimated snow cover in autumn and spring/summer seasons
[14]Classification of snow and glaciers in the UIB, excluding the Kabul River basinGLIMSSnow-covered glacier area obtained from MODIS and Landsat product was compared with GLIMS
[36]Snow-cover estimation in the Indus Basin for 2013MODIS (TERRA Satellite) product for the period 2008–2013Snow-cover dynamics were assessed, and trend analysis was performed for snow cover for the period 2008 to 2013
[13]Estimation of Glacier mass change in HKH regionRGI v 1.0Glacier area was estimated using RGI v 1.0. Please note that the authors in the study admitted that a number of considerable gaps were present in RGI 1.0 when compared with Landsat images
[45]Estimation of Equilibrium Line Altitudes in the Hunza BasinRGI v 6.0RGI v 6.0 was used for correction of MODIS snow-cover data
Table 4. Summary of the glacier areas by RGI v.6.0, GLIMS, and RGI v.4.0 Inventories. Differences between the inventories used in the current study and their differences with RGI v.4.0 are also provided.
BasinRGI v.6.0
Glacier Area
(km2)
GLIMS
Glacier Area (km2)
Difference
(%)
RGI v.4.0
Glacier Area (km2)
Difference b/w RGI v.4.0 and v.6.0 (%)Difference b/w RGI v.4.0 and GLIMS (%)
The Kabul River basin115.55203.3155.04183.7045.2210.48
Disclaimer/Publisher’s Note: The statements, opinions and data contained in all publications are solely those of the individual author(s) and contributor(s) and not of MDPI and/or the editor(s). MDPI and/or the editor(s) disclaim responsibility for any injury to people or property resulting from any ideas, methods, instructions or products referred to in the content.

