
Development of a Low-Cost Automated Hydrological Information System for Remote Areas in Morelia, Mexico

 , ,
, ,
Abstract
:1. Introduction
2. Materials and Methods
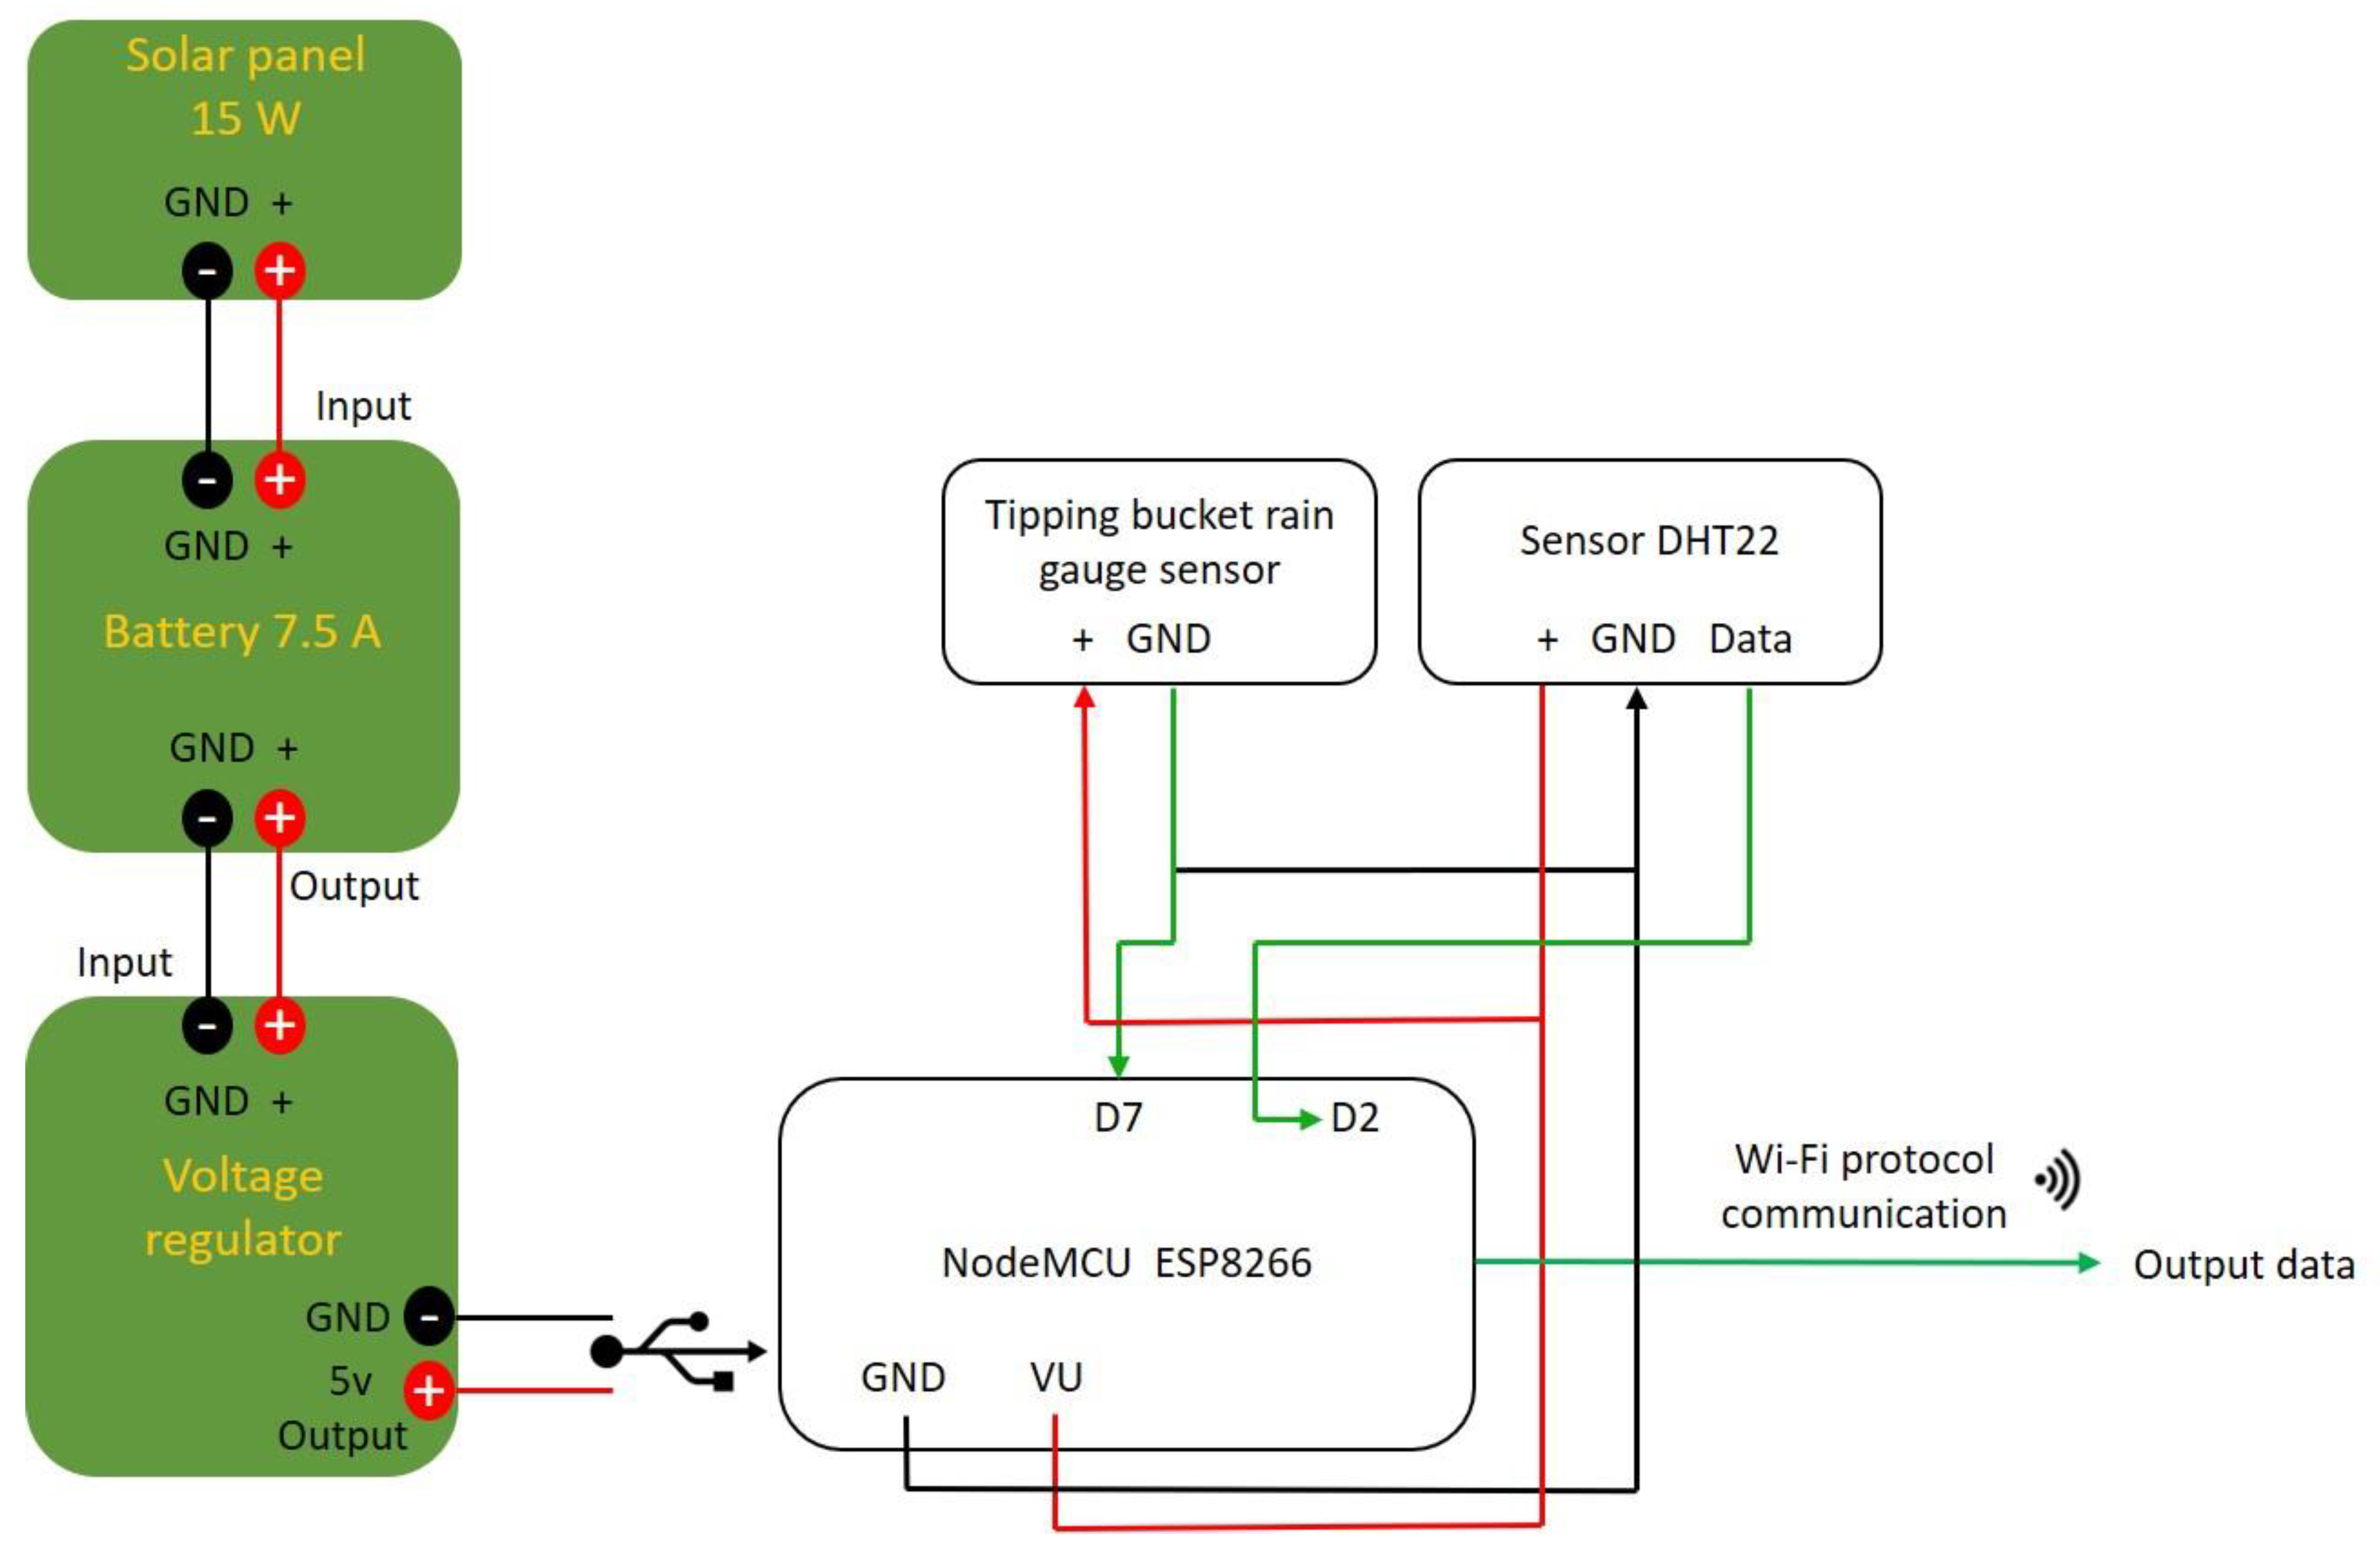
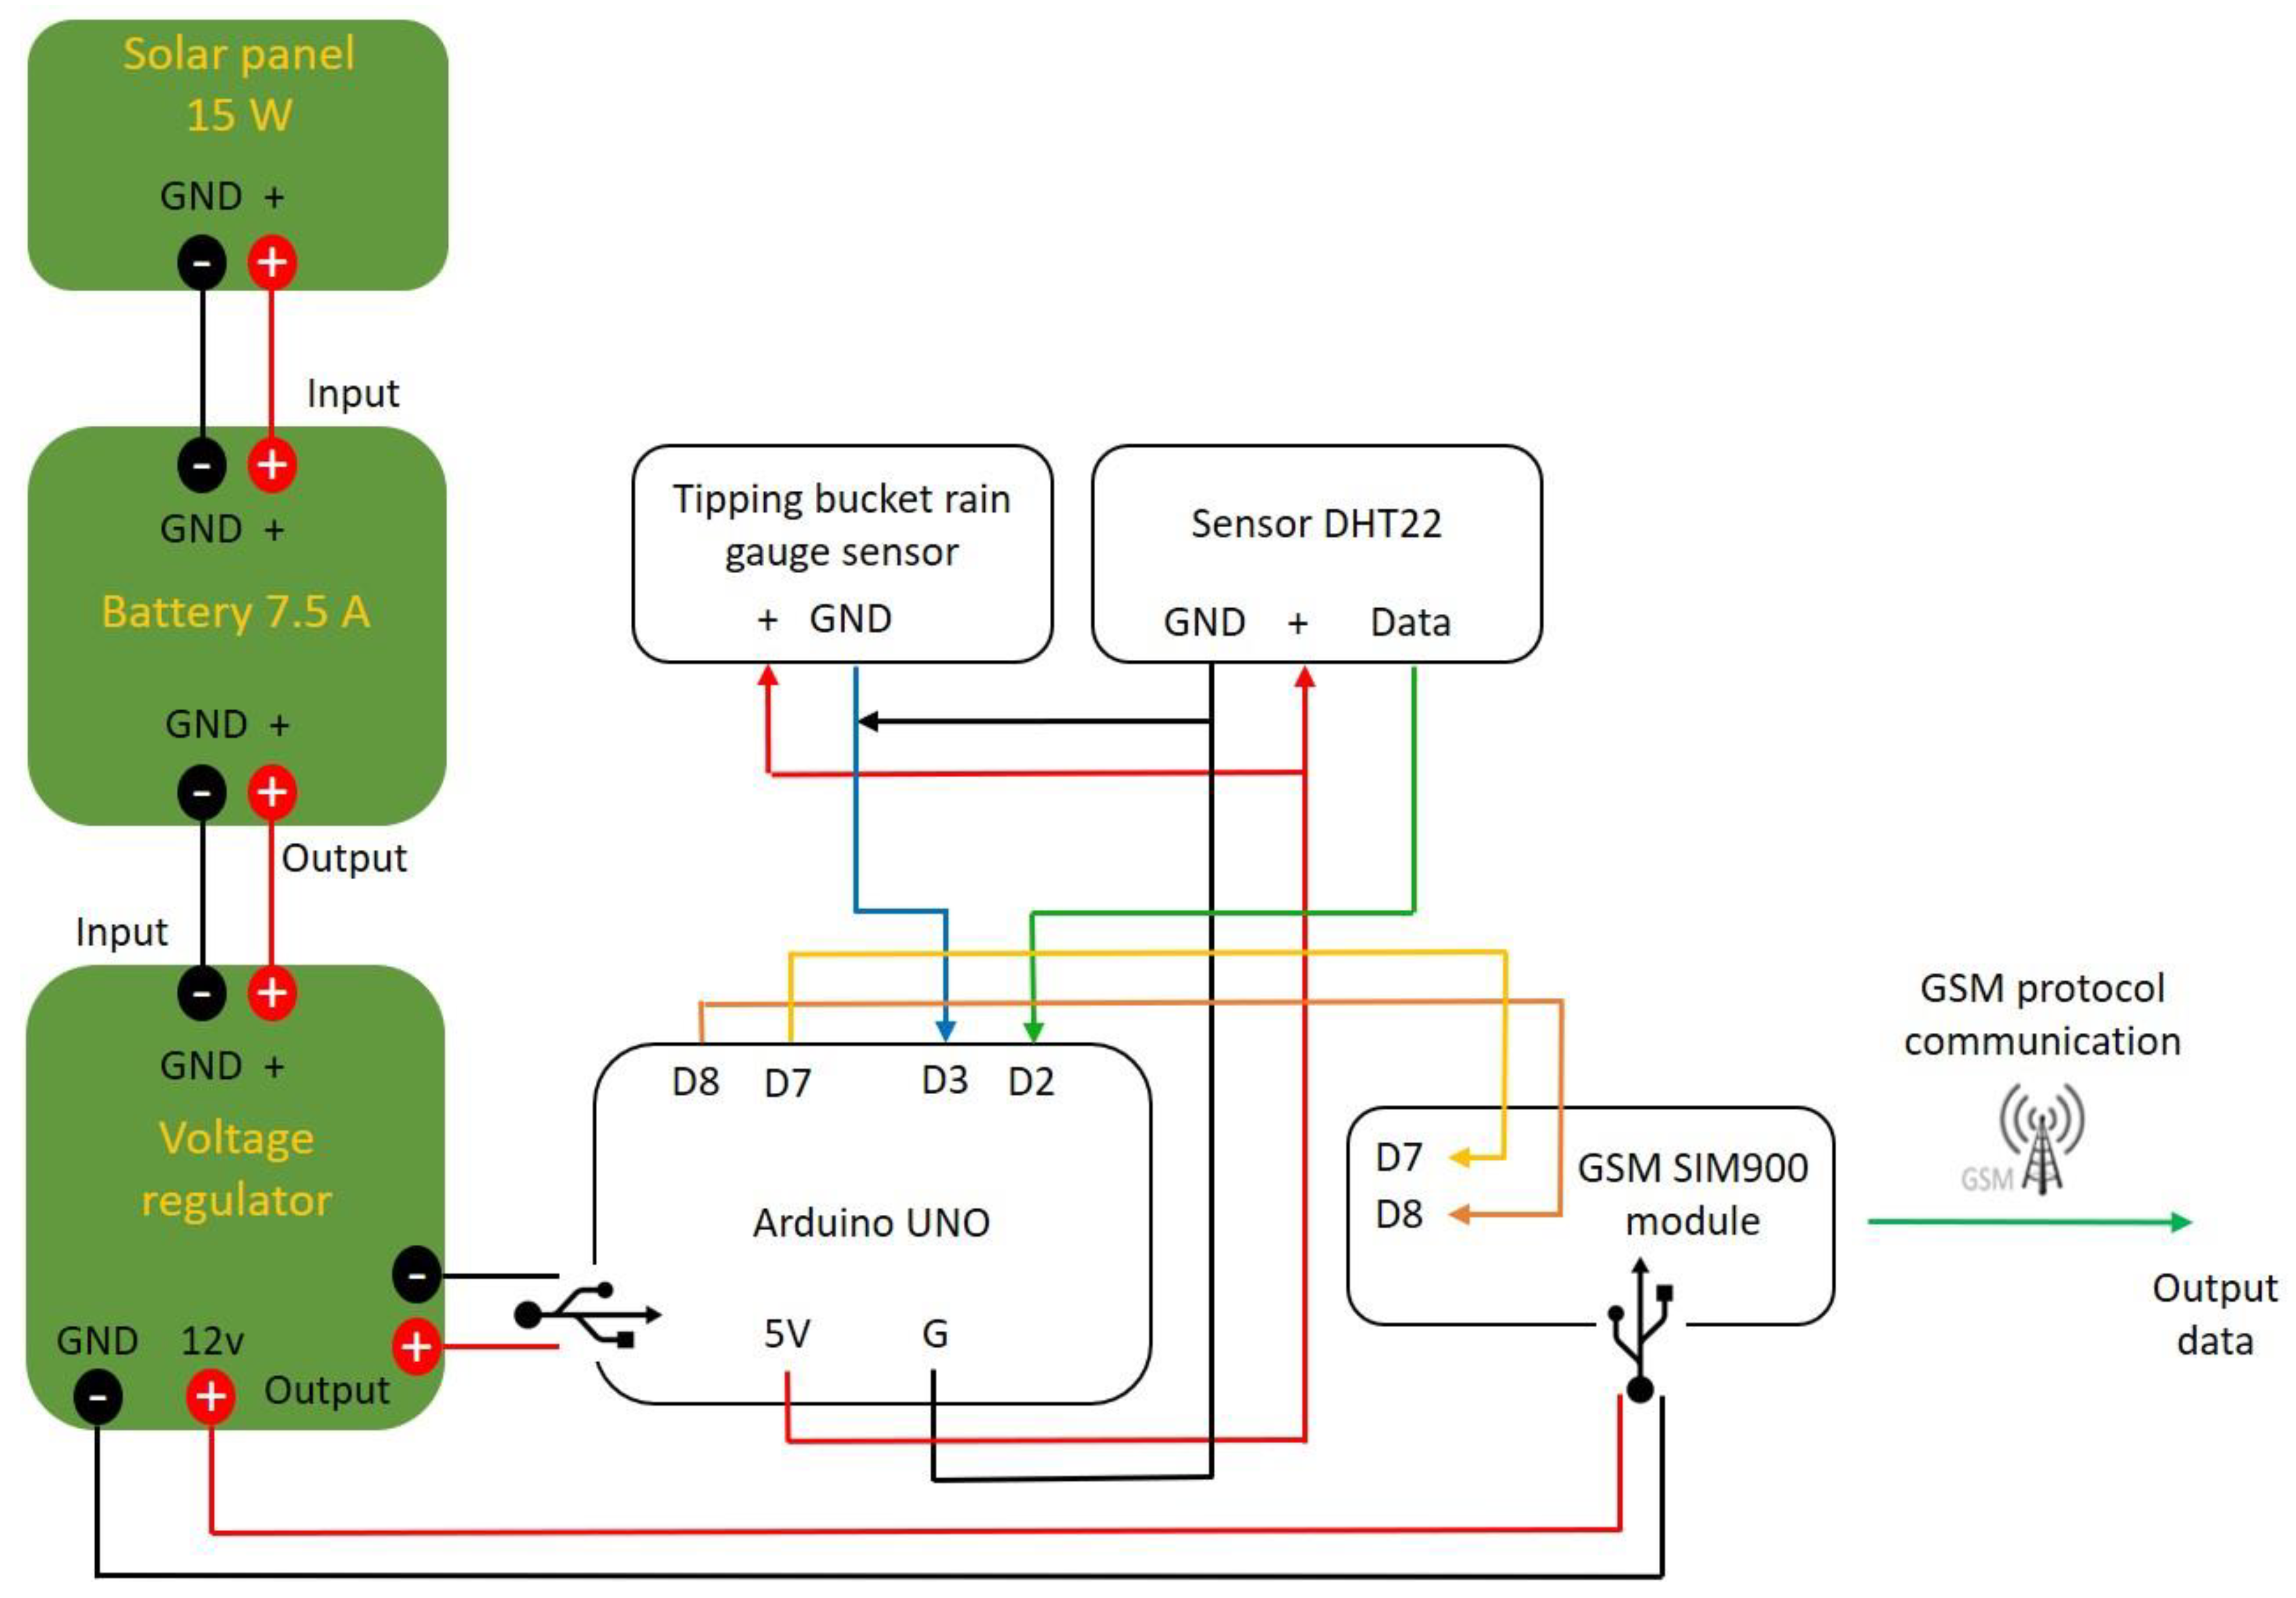
2.1. Instrumentation
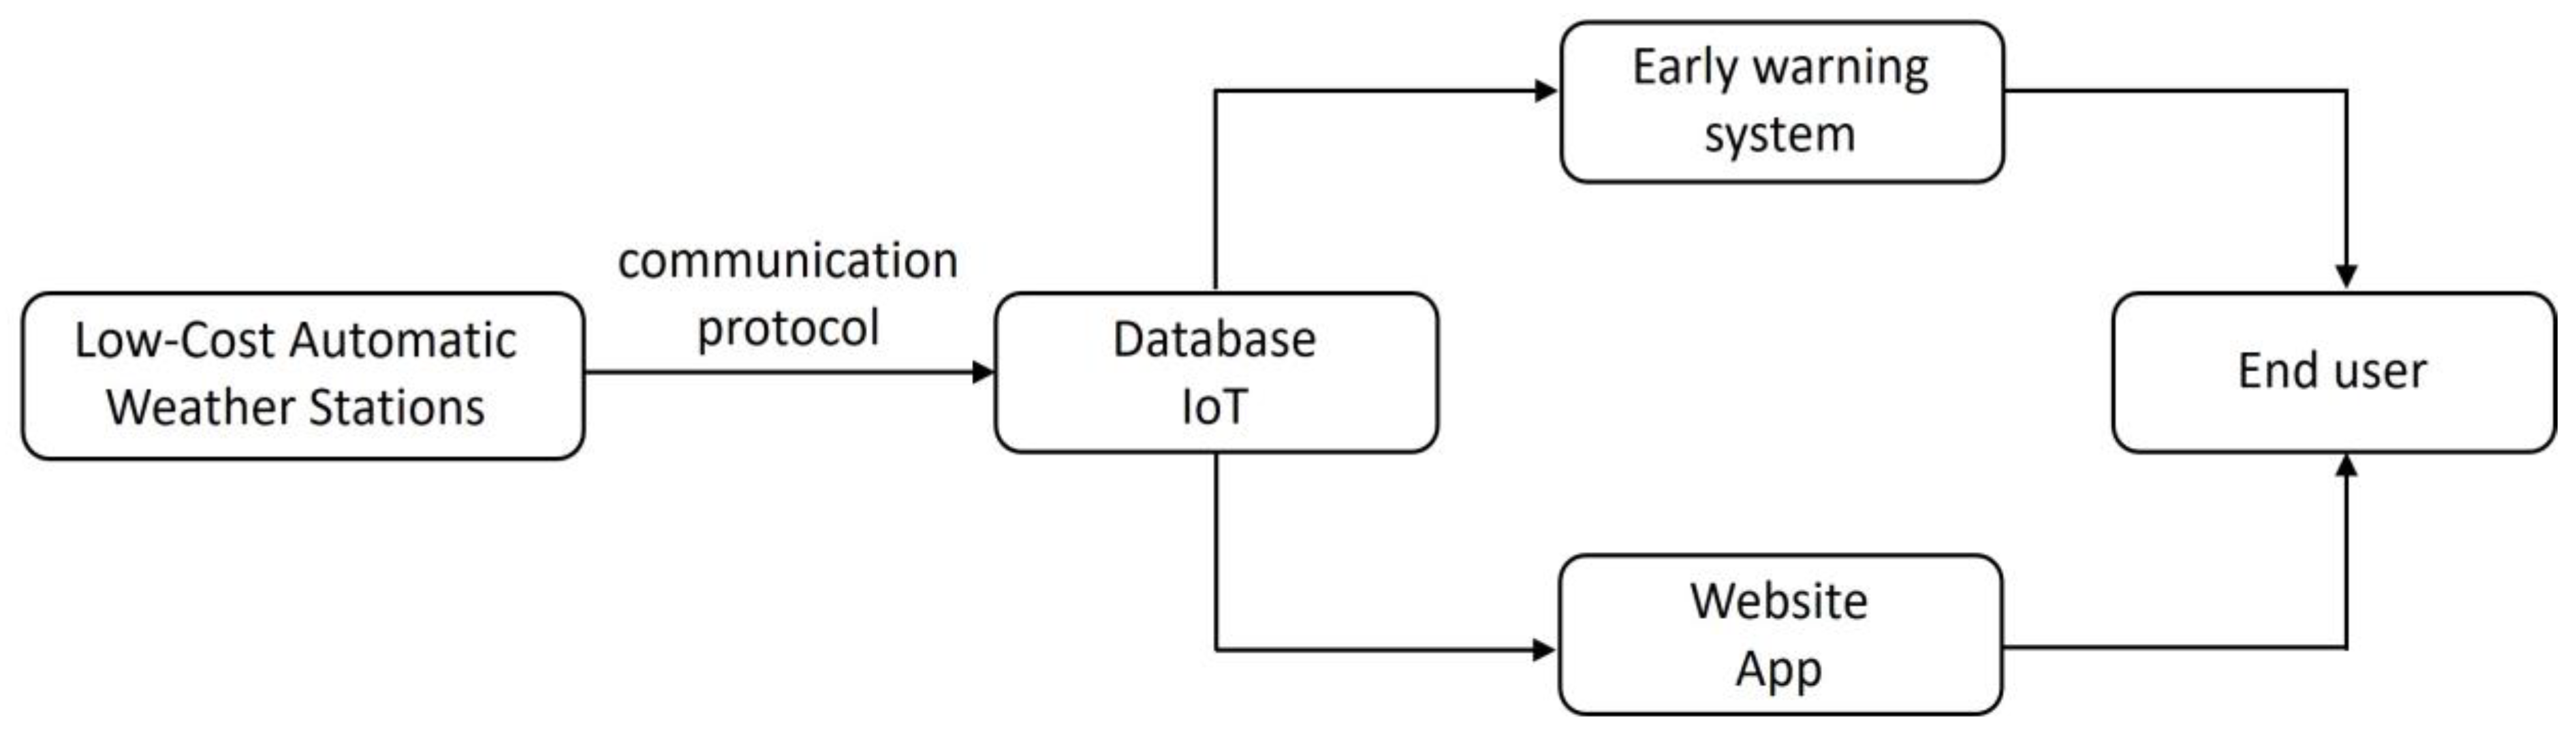
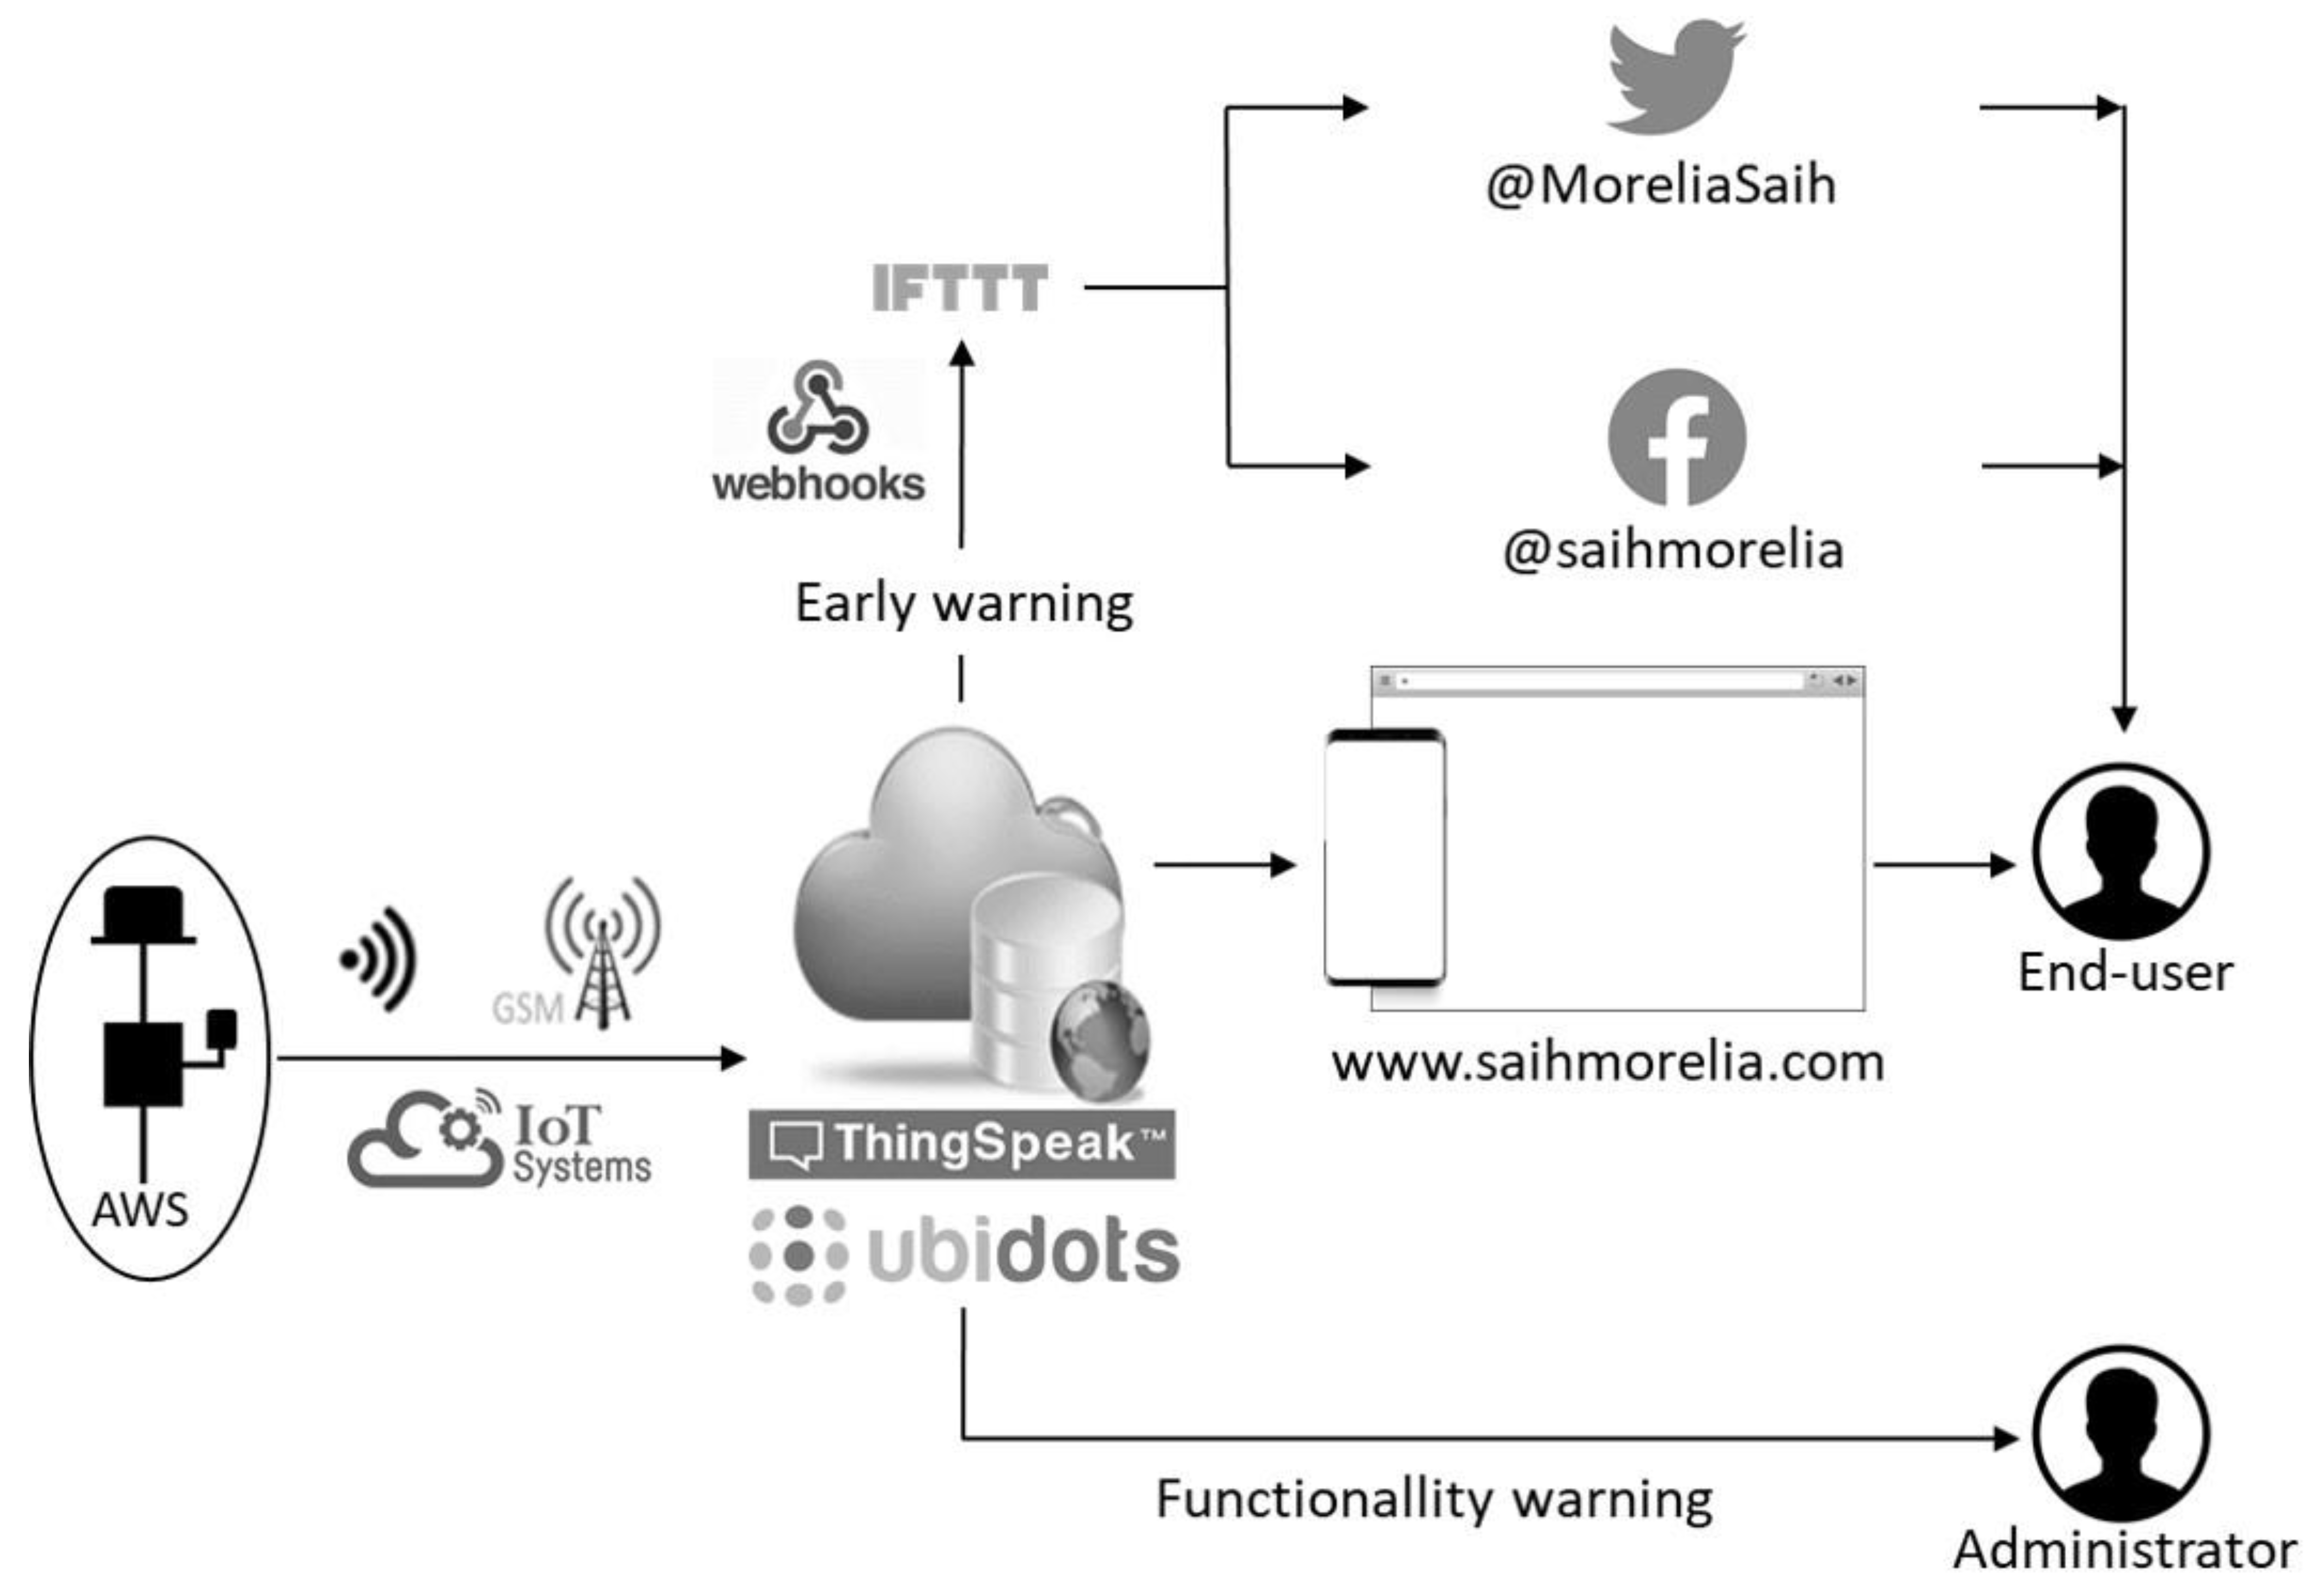
2.2. Data Storage and Linkage
2.3. Visualization
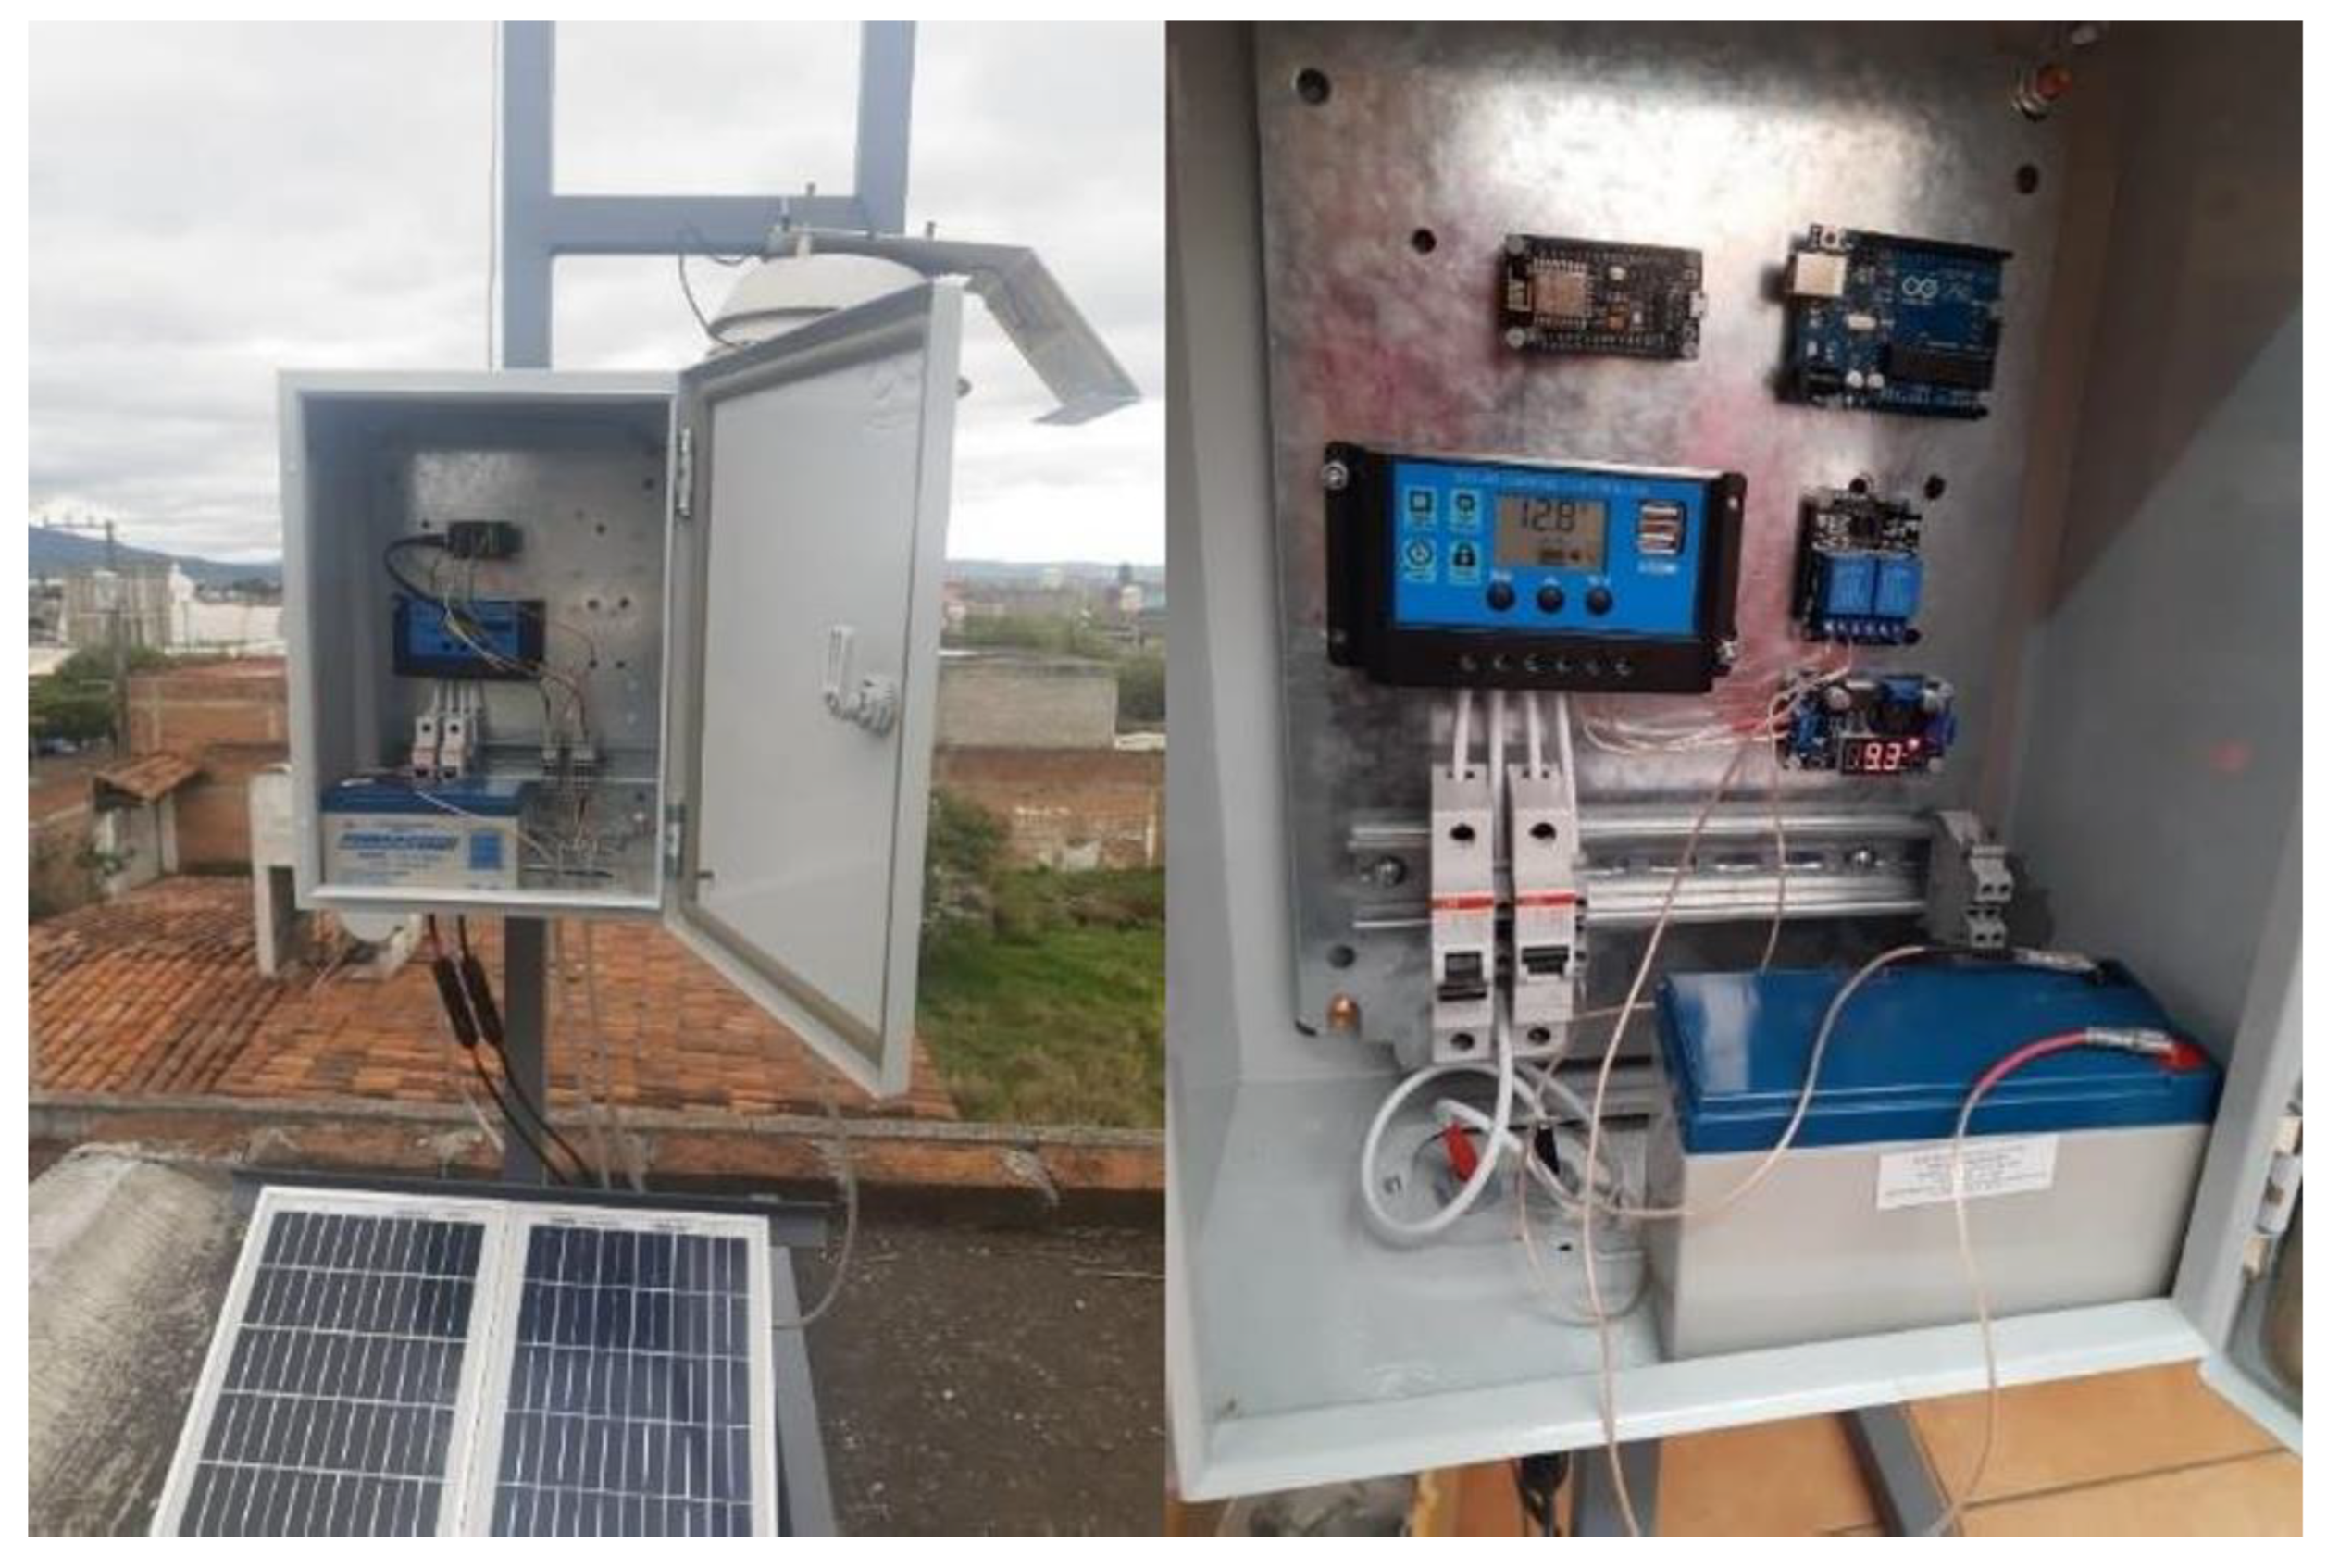
2.4. Prototyping
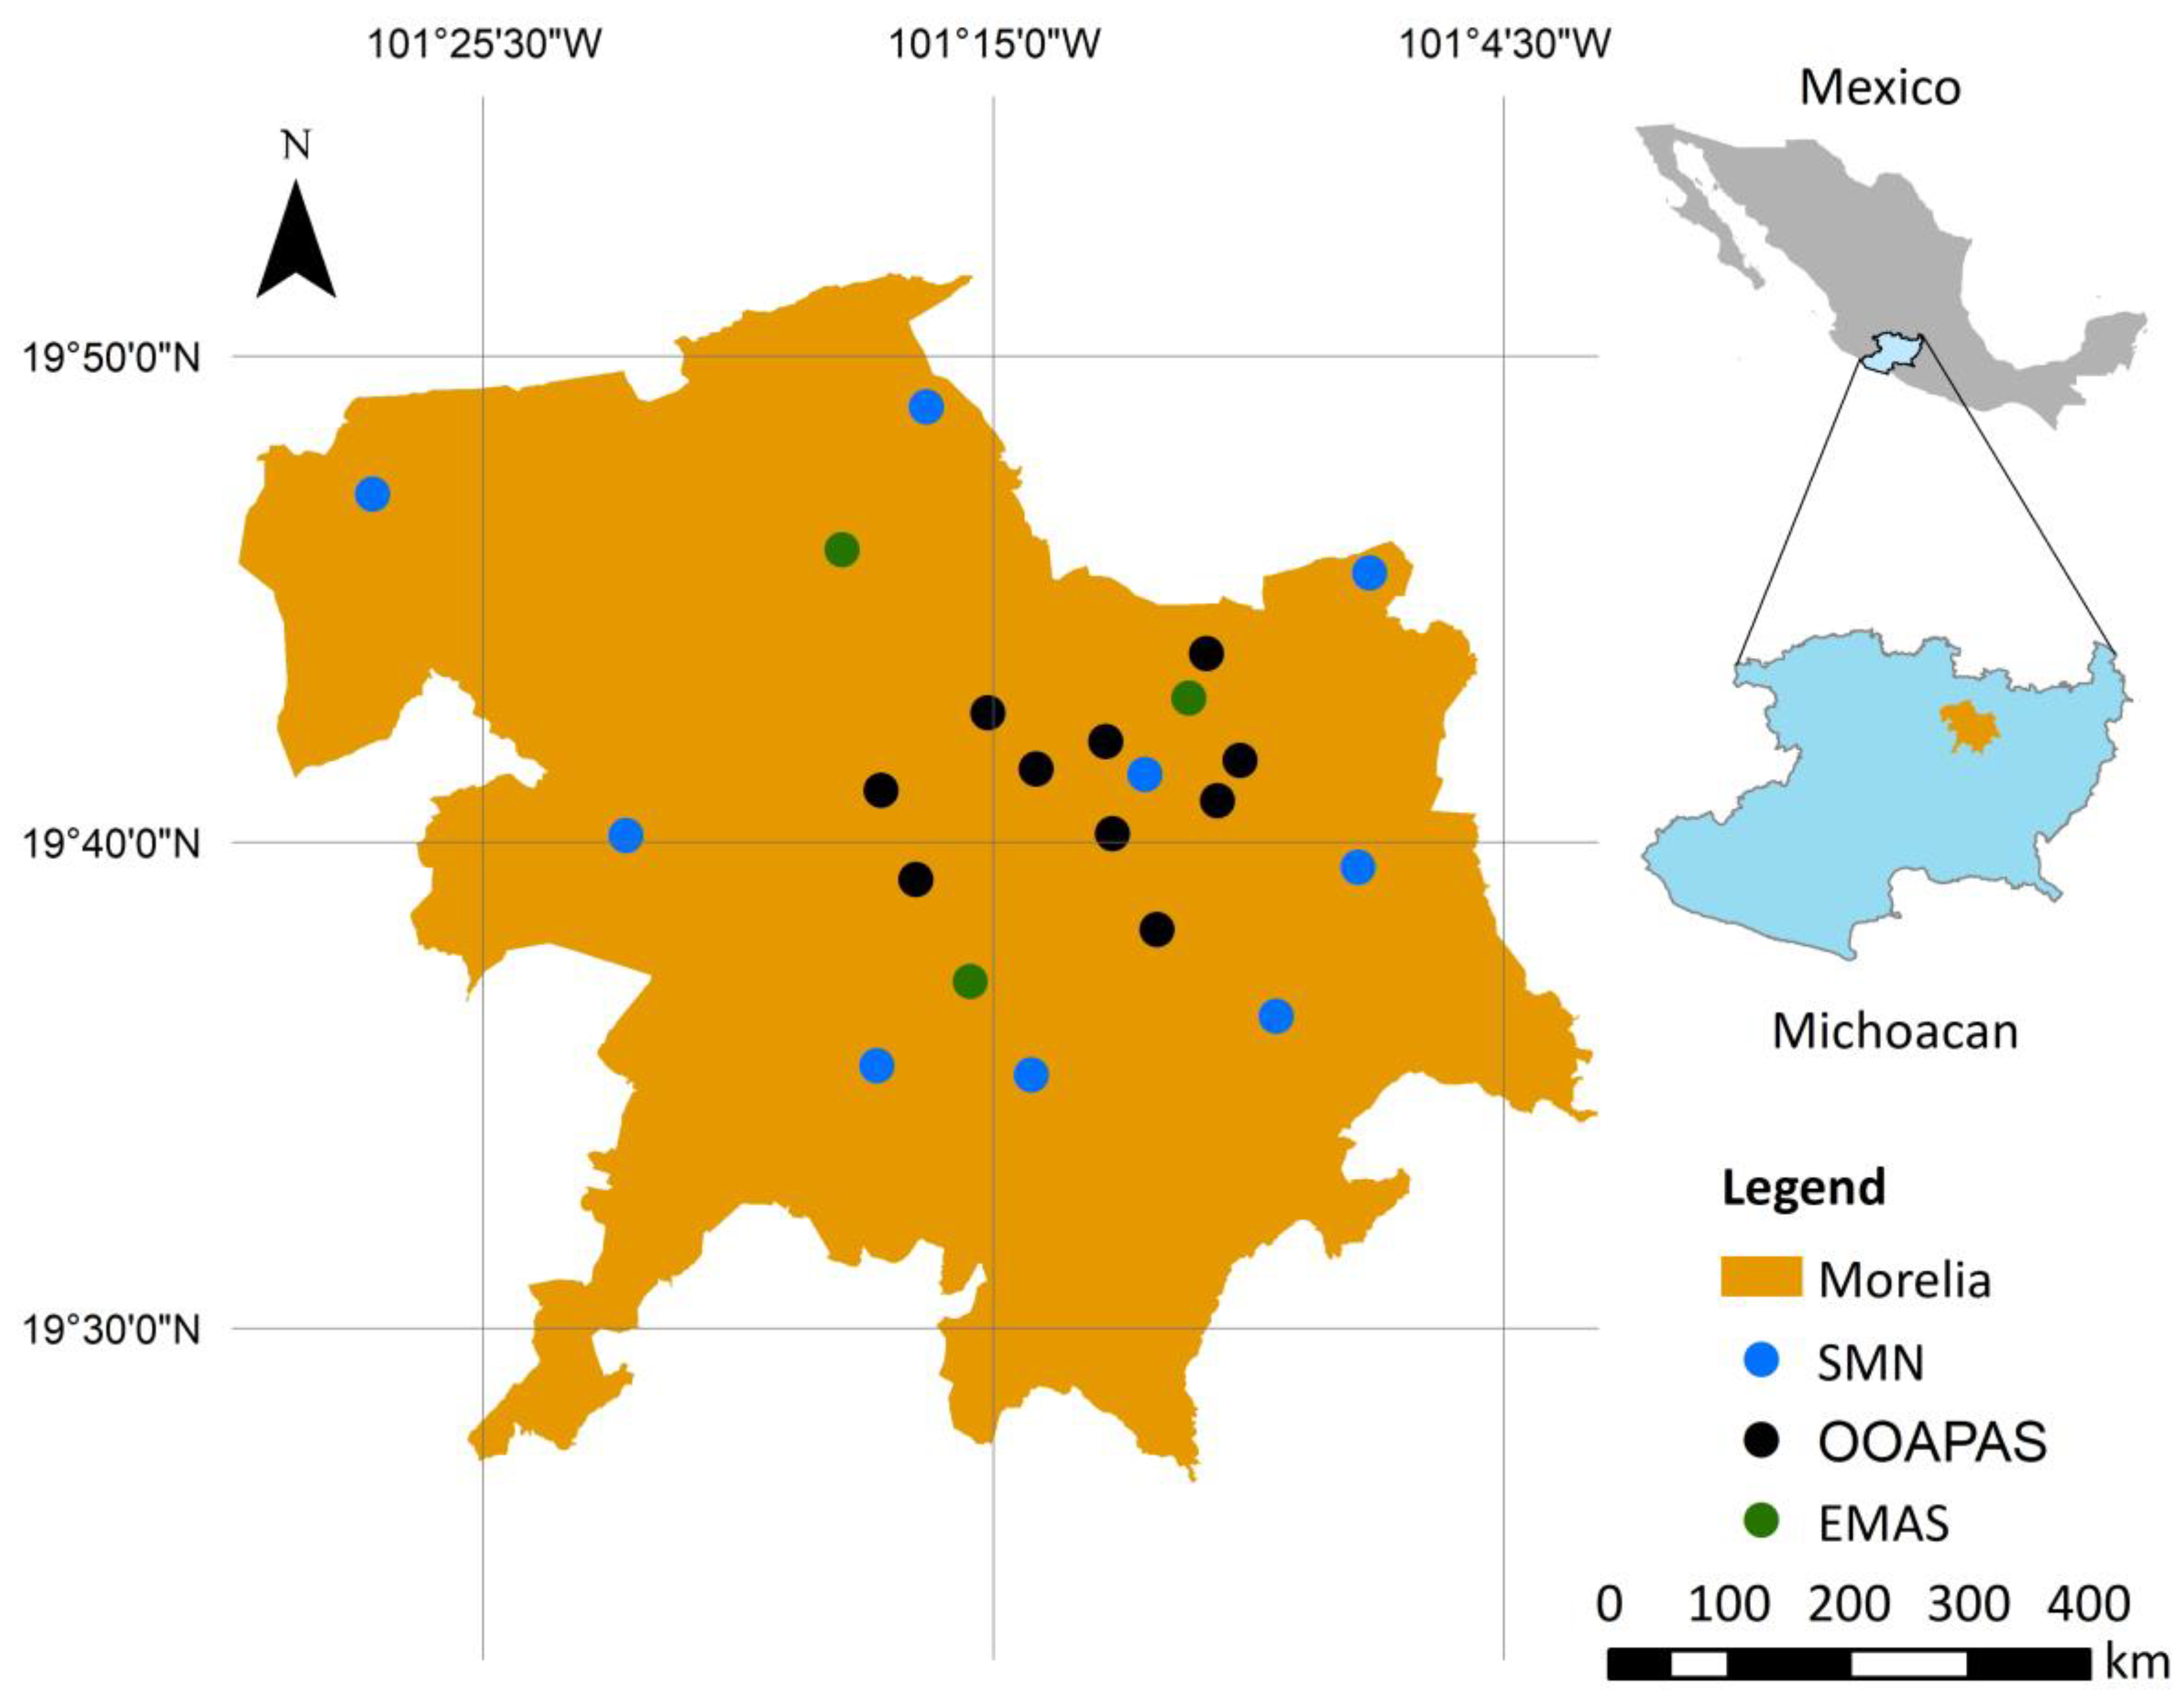
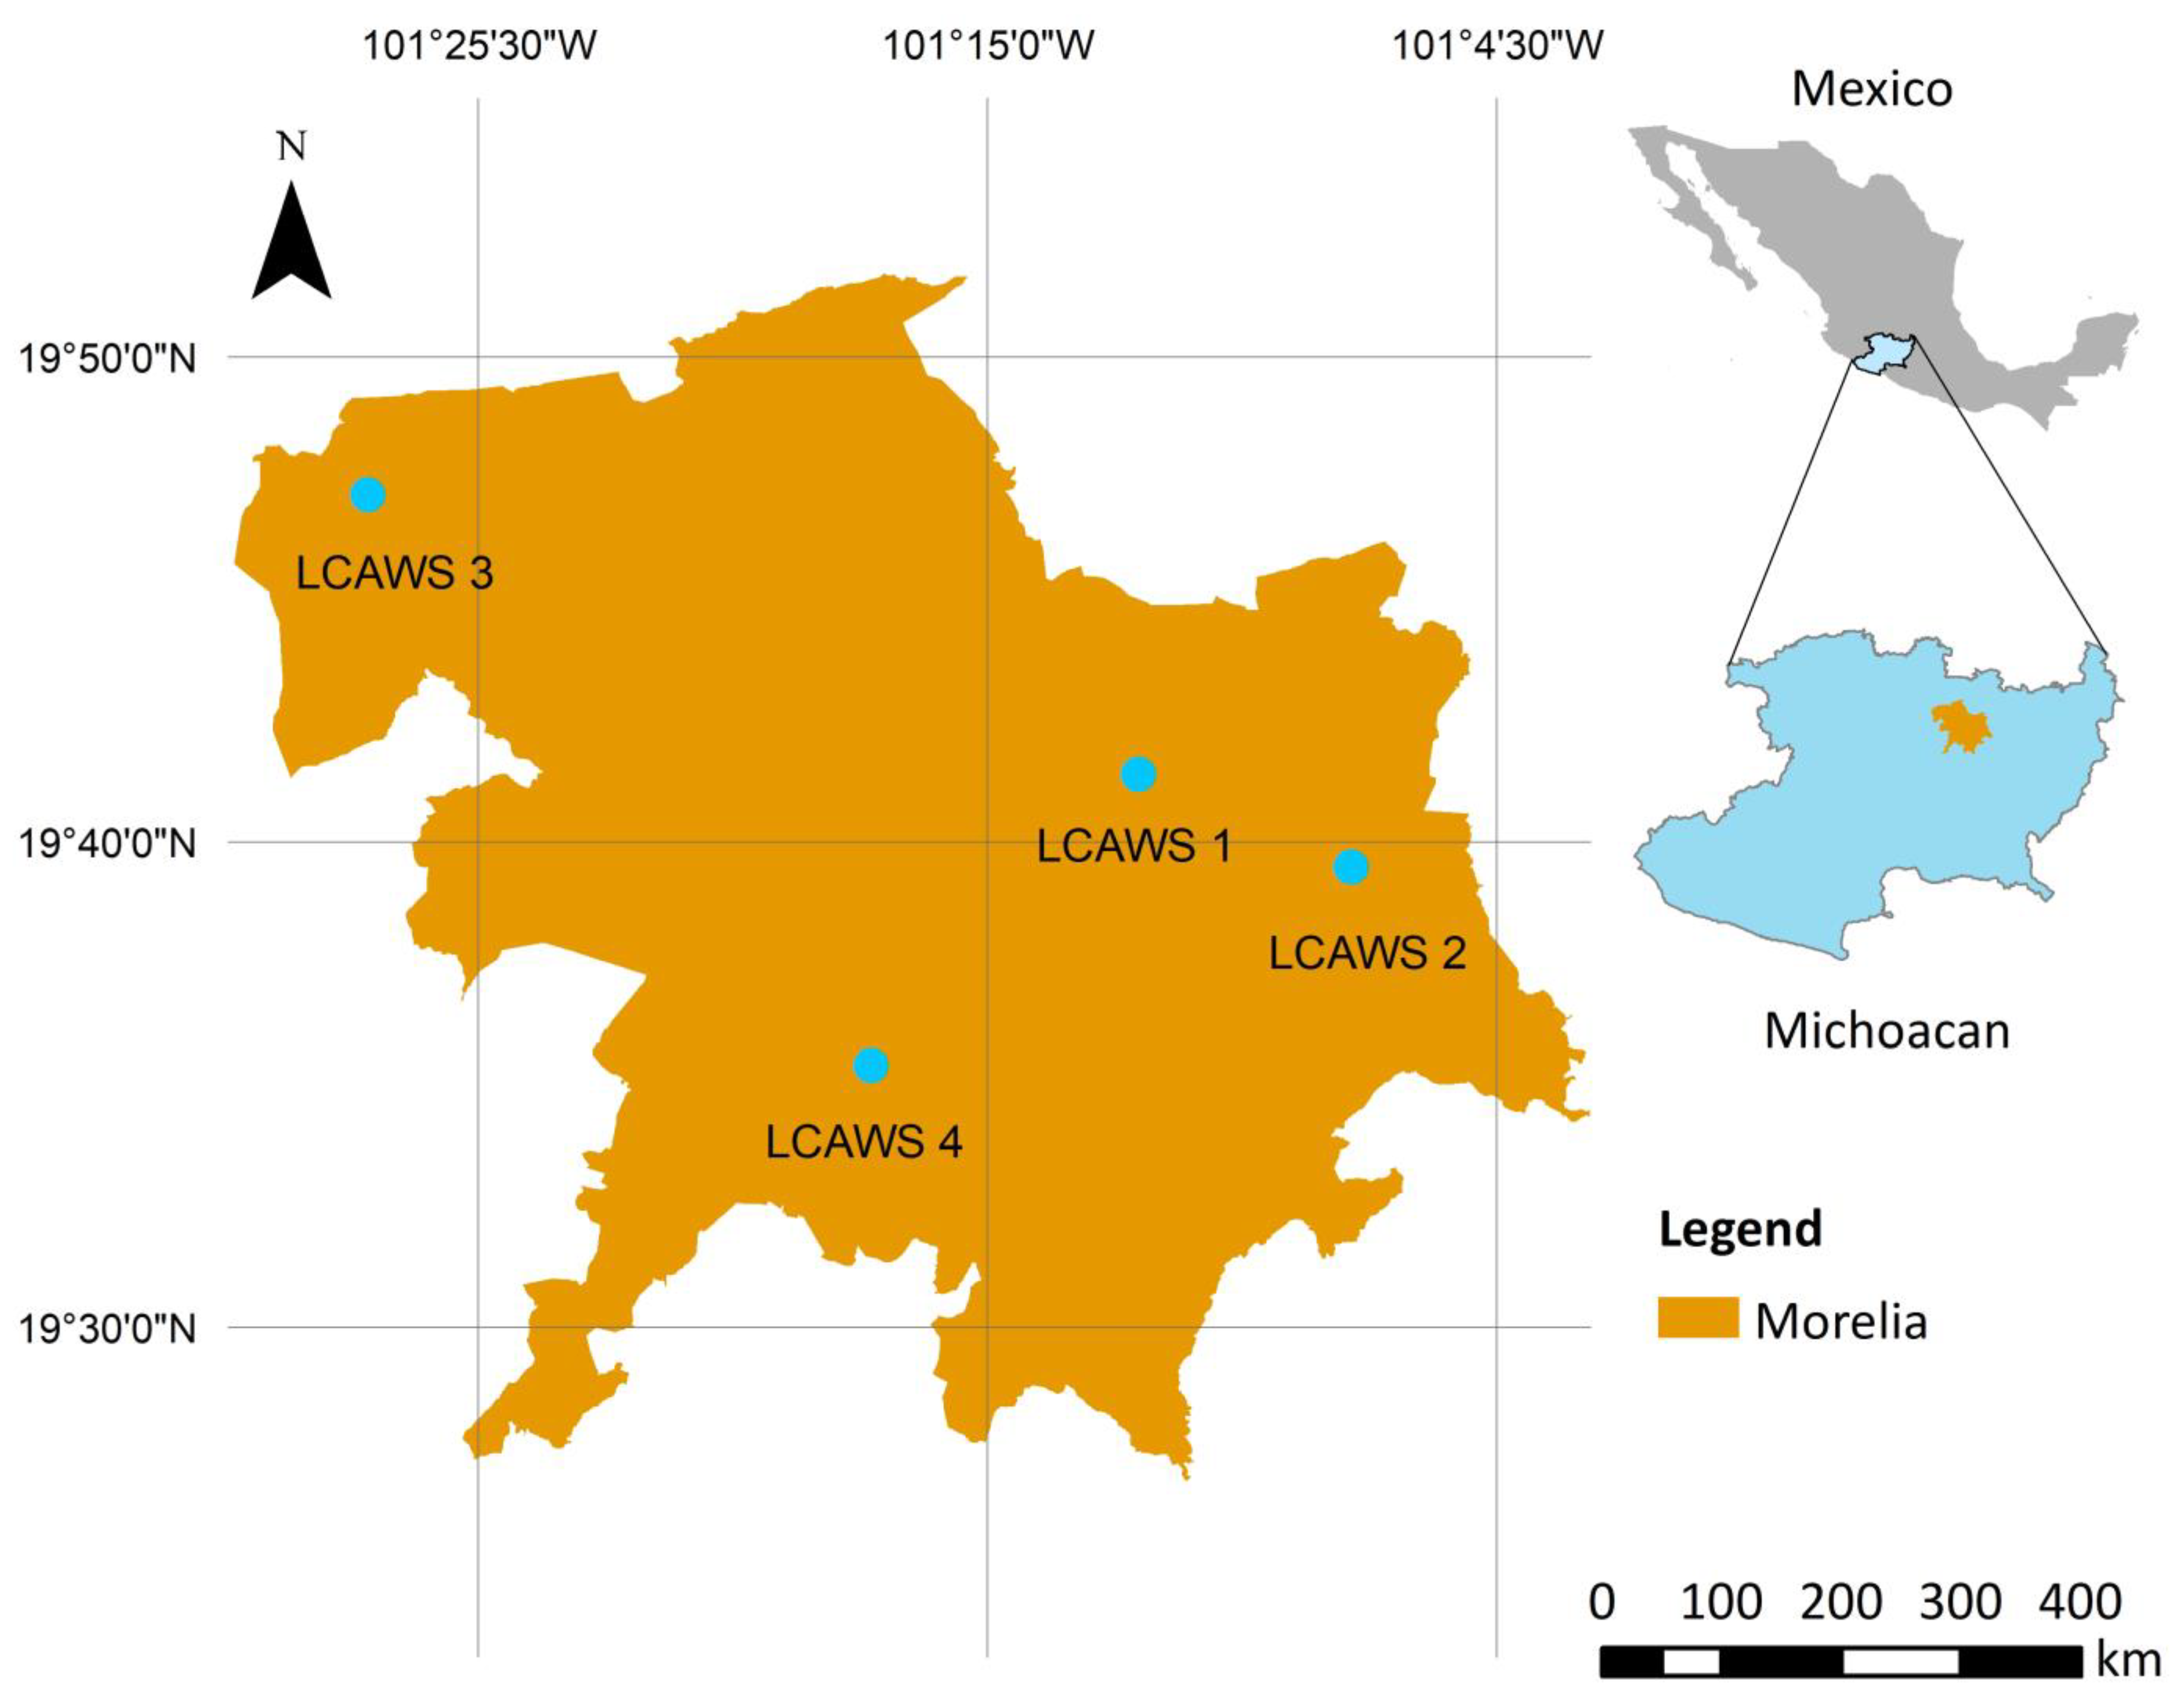
3. Case Study
4. Results and Discussion
4.1. Wi-Fi Low-Cost Automatic Weather Stations (Wi-Fi LCAWS)
4.2. GSM Low-Cost Automatic Weather Stations (GSM LCAWS)
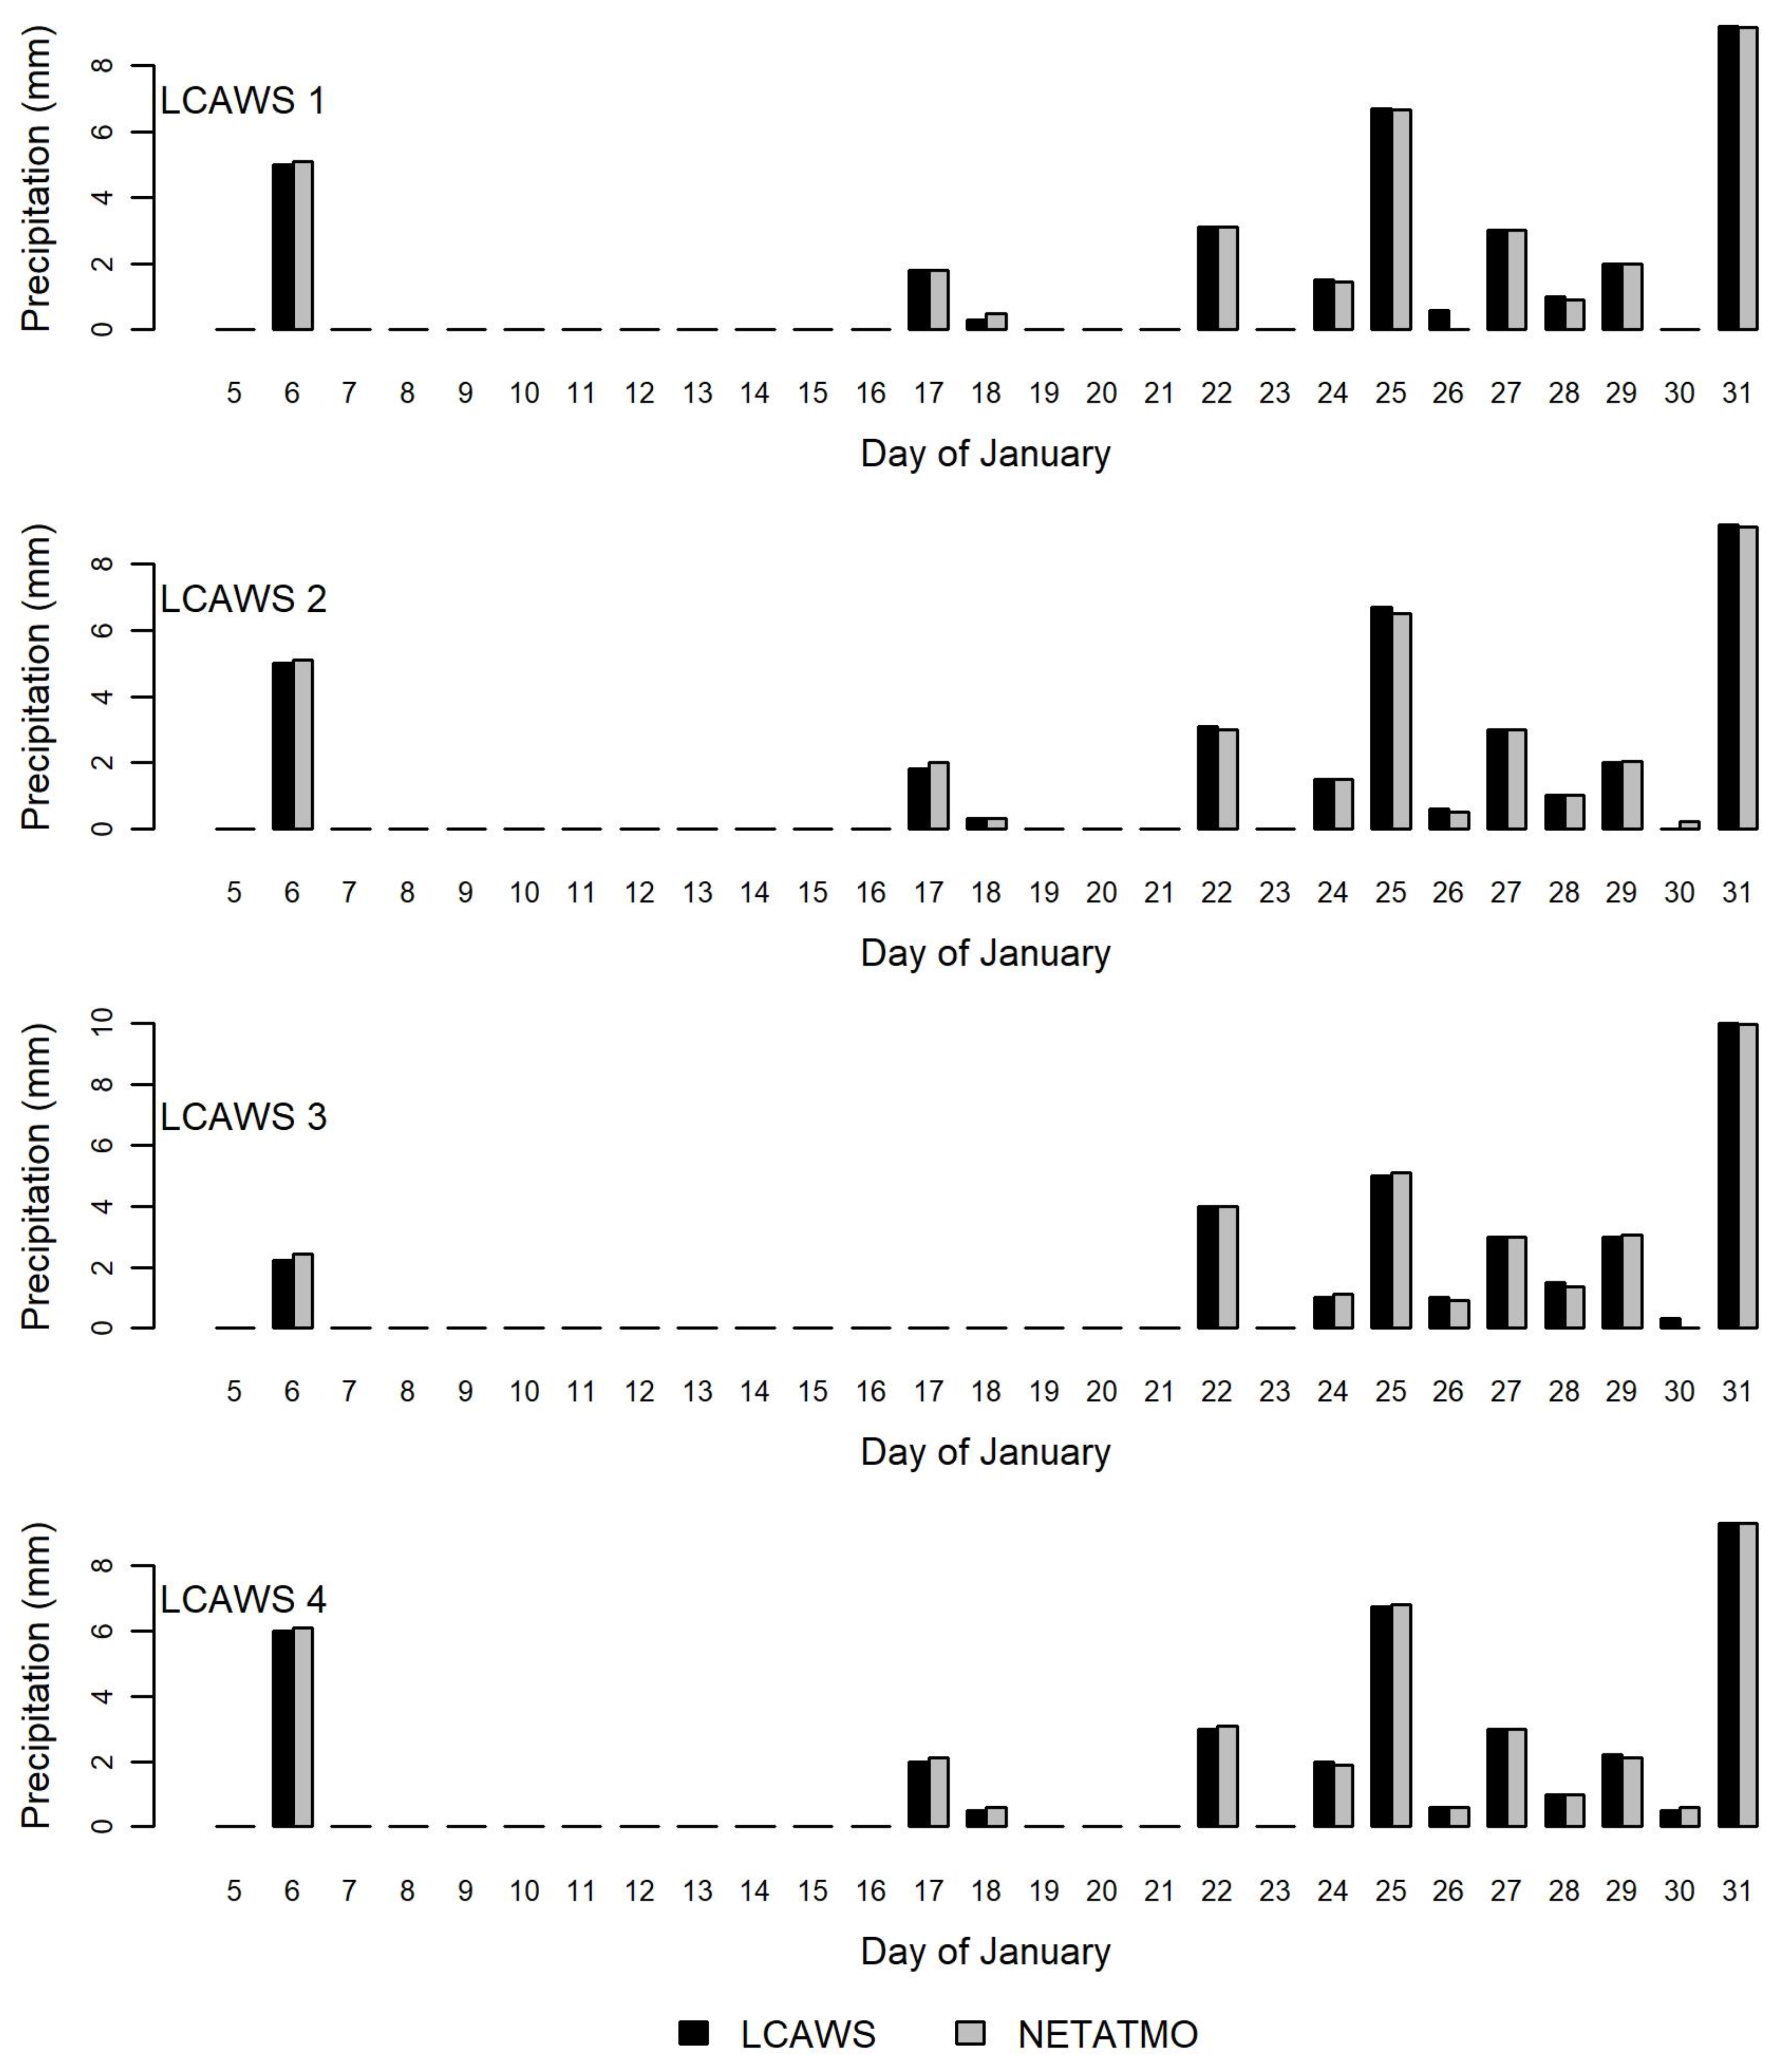
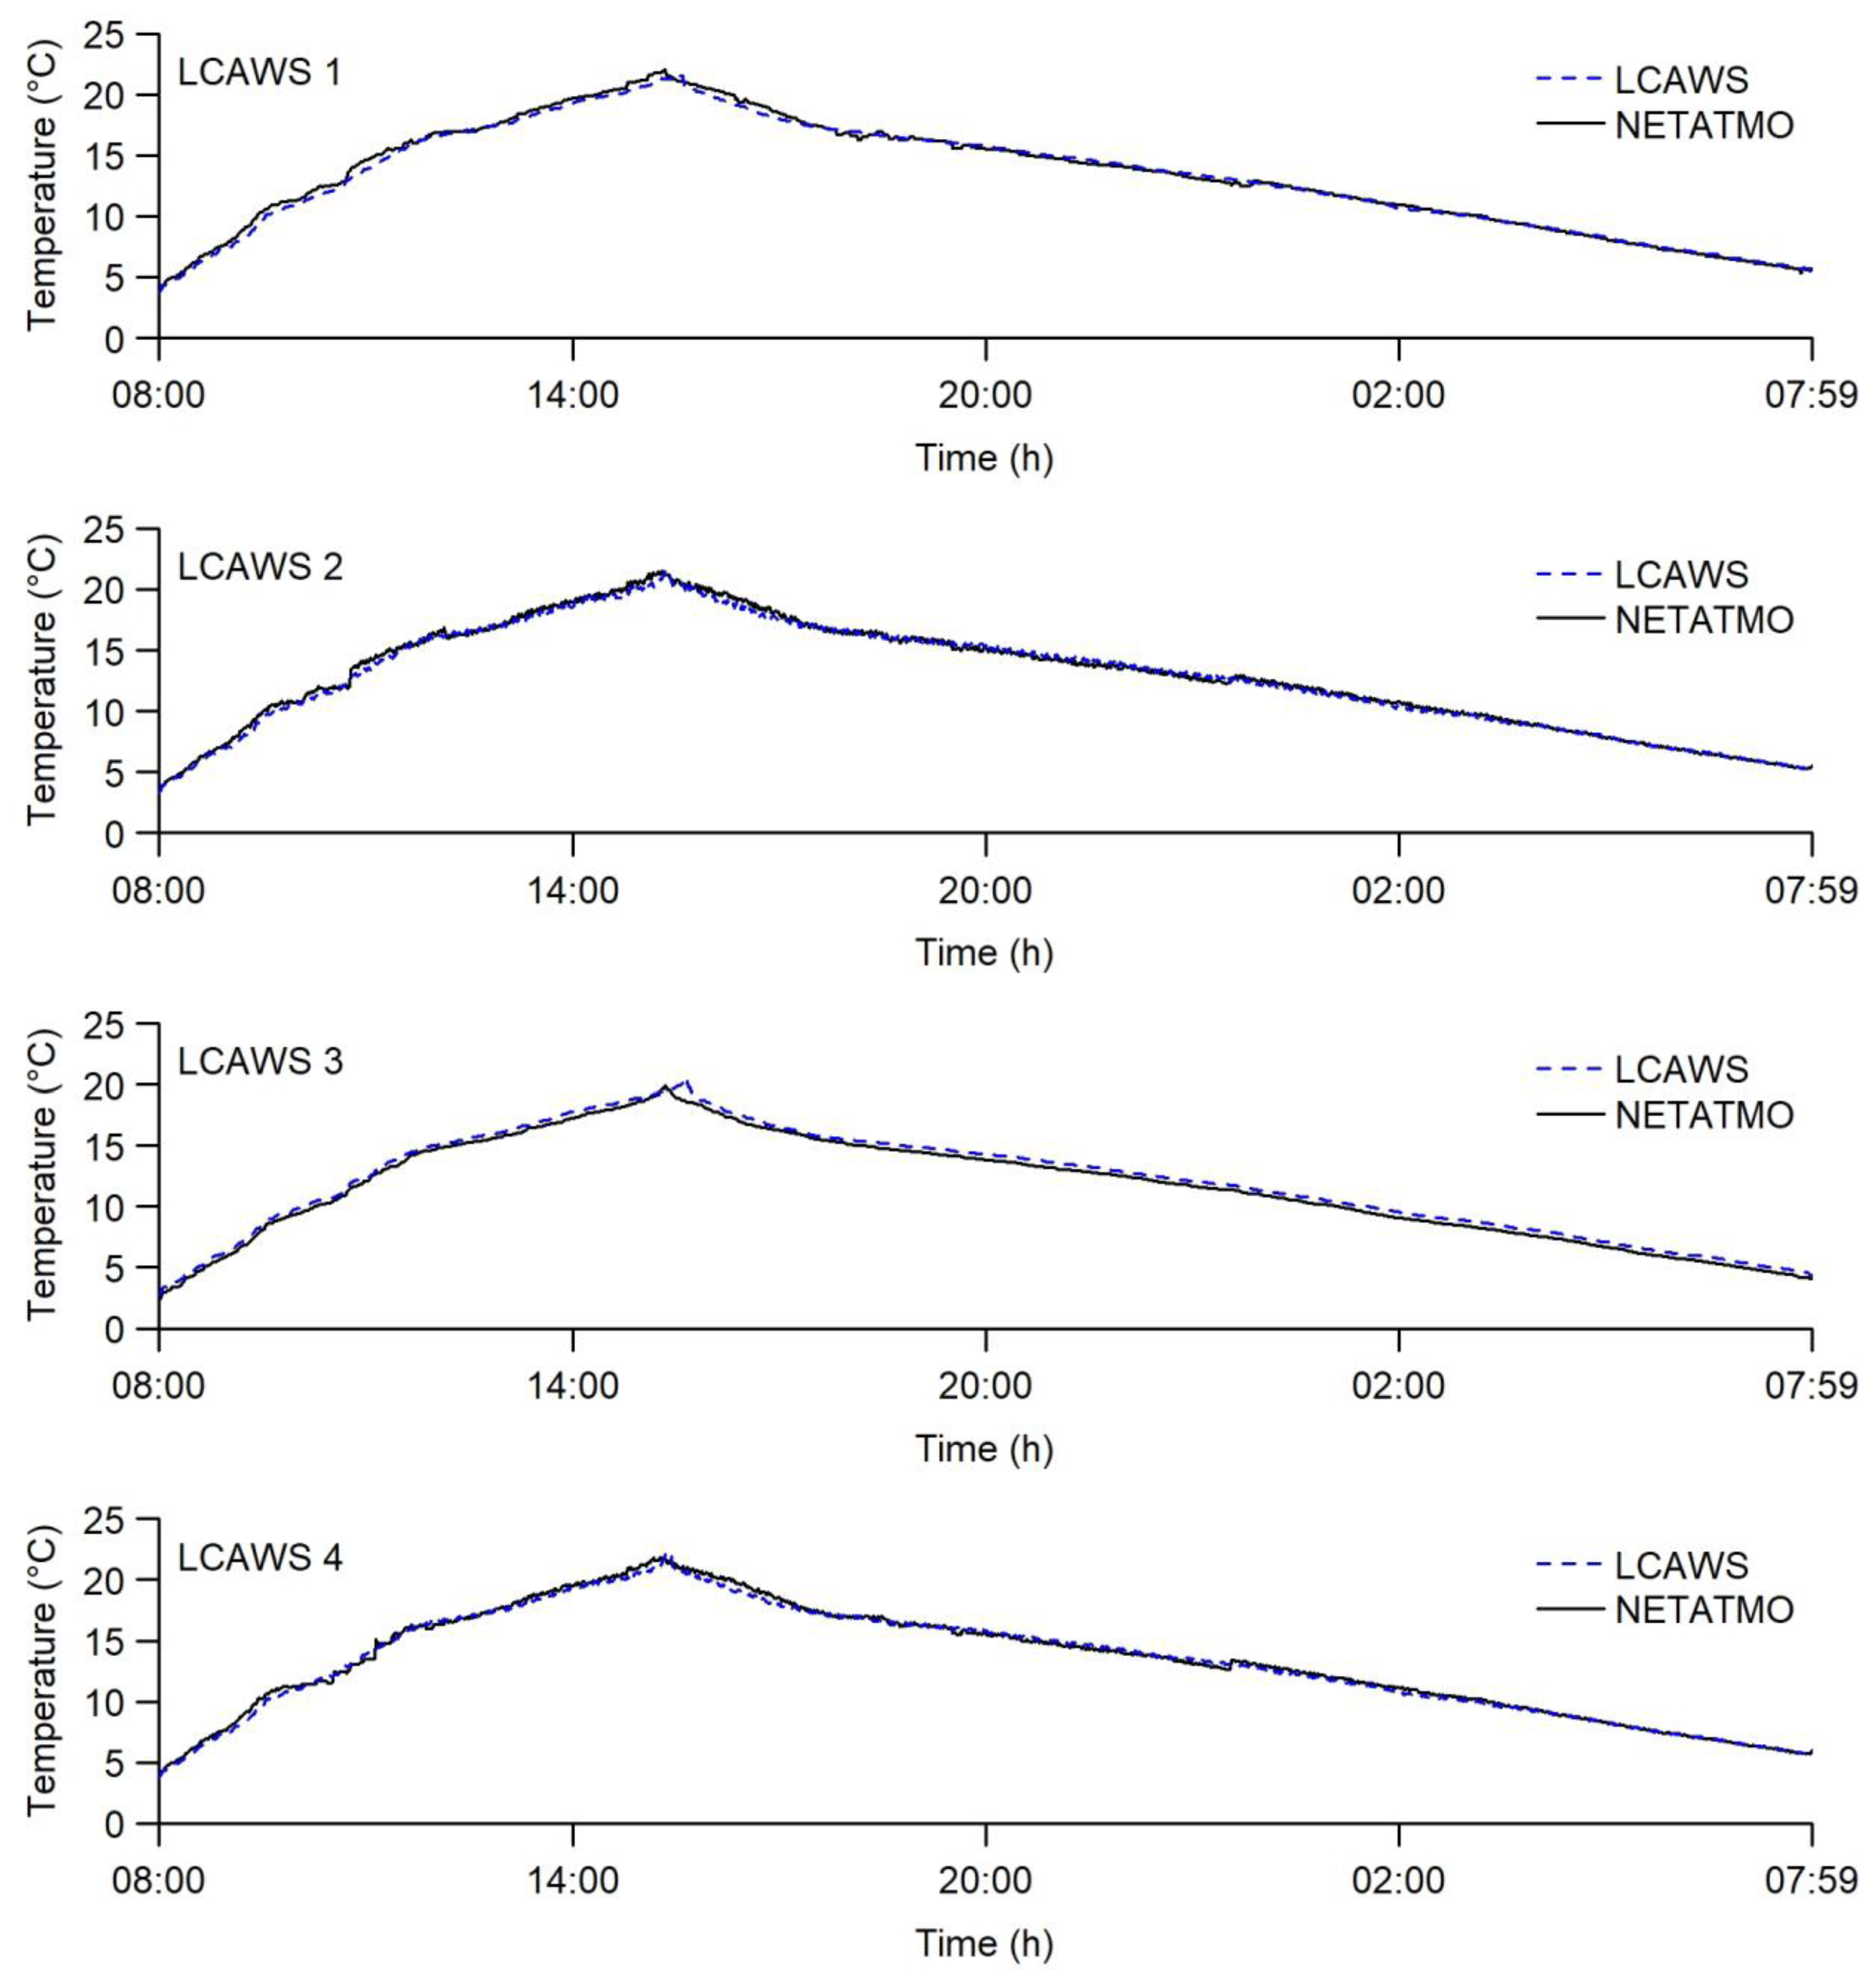
4.3. Calibration and Validation of the LCAWS Elements
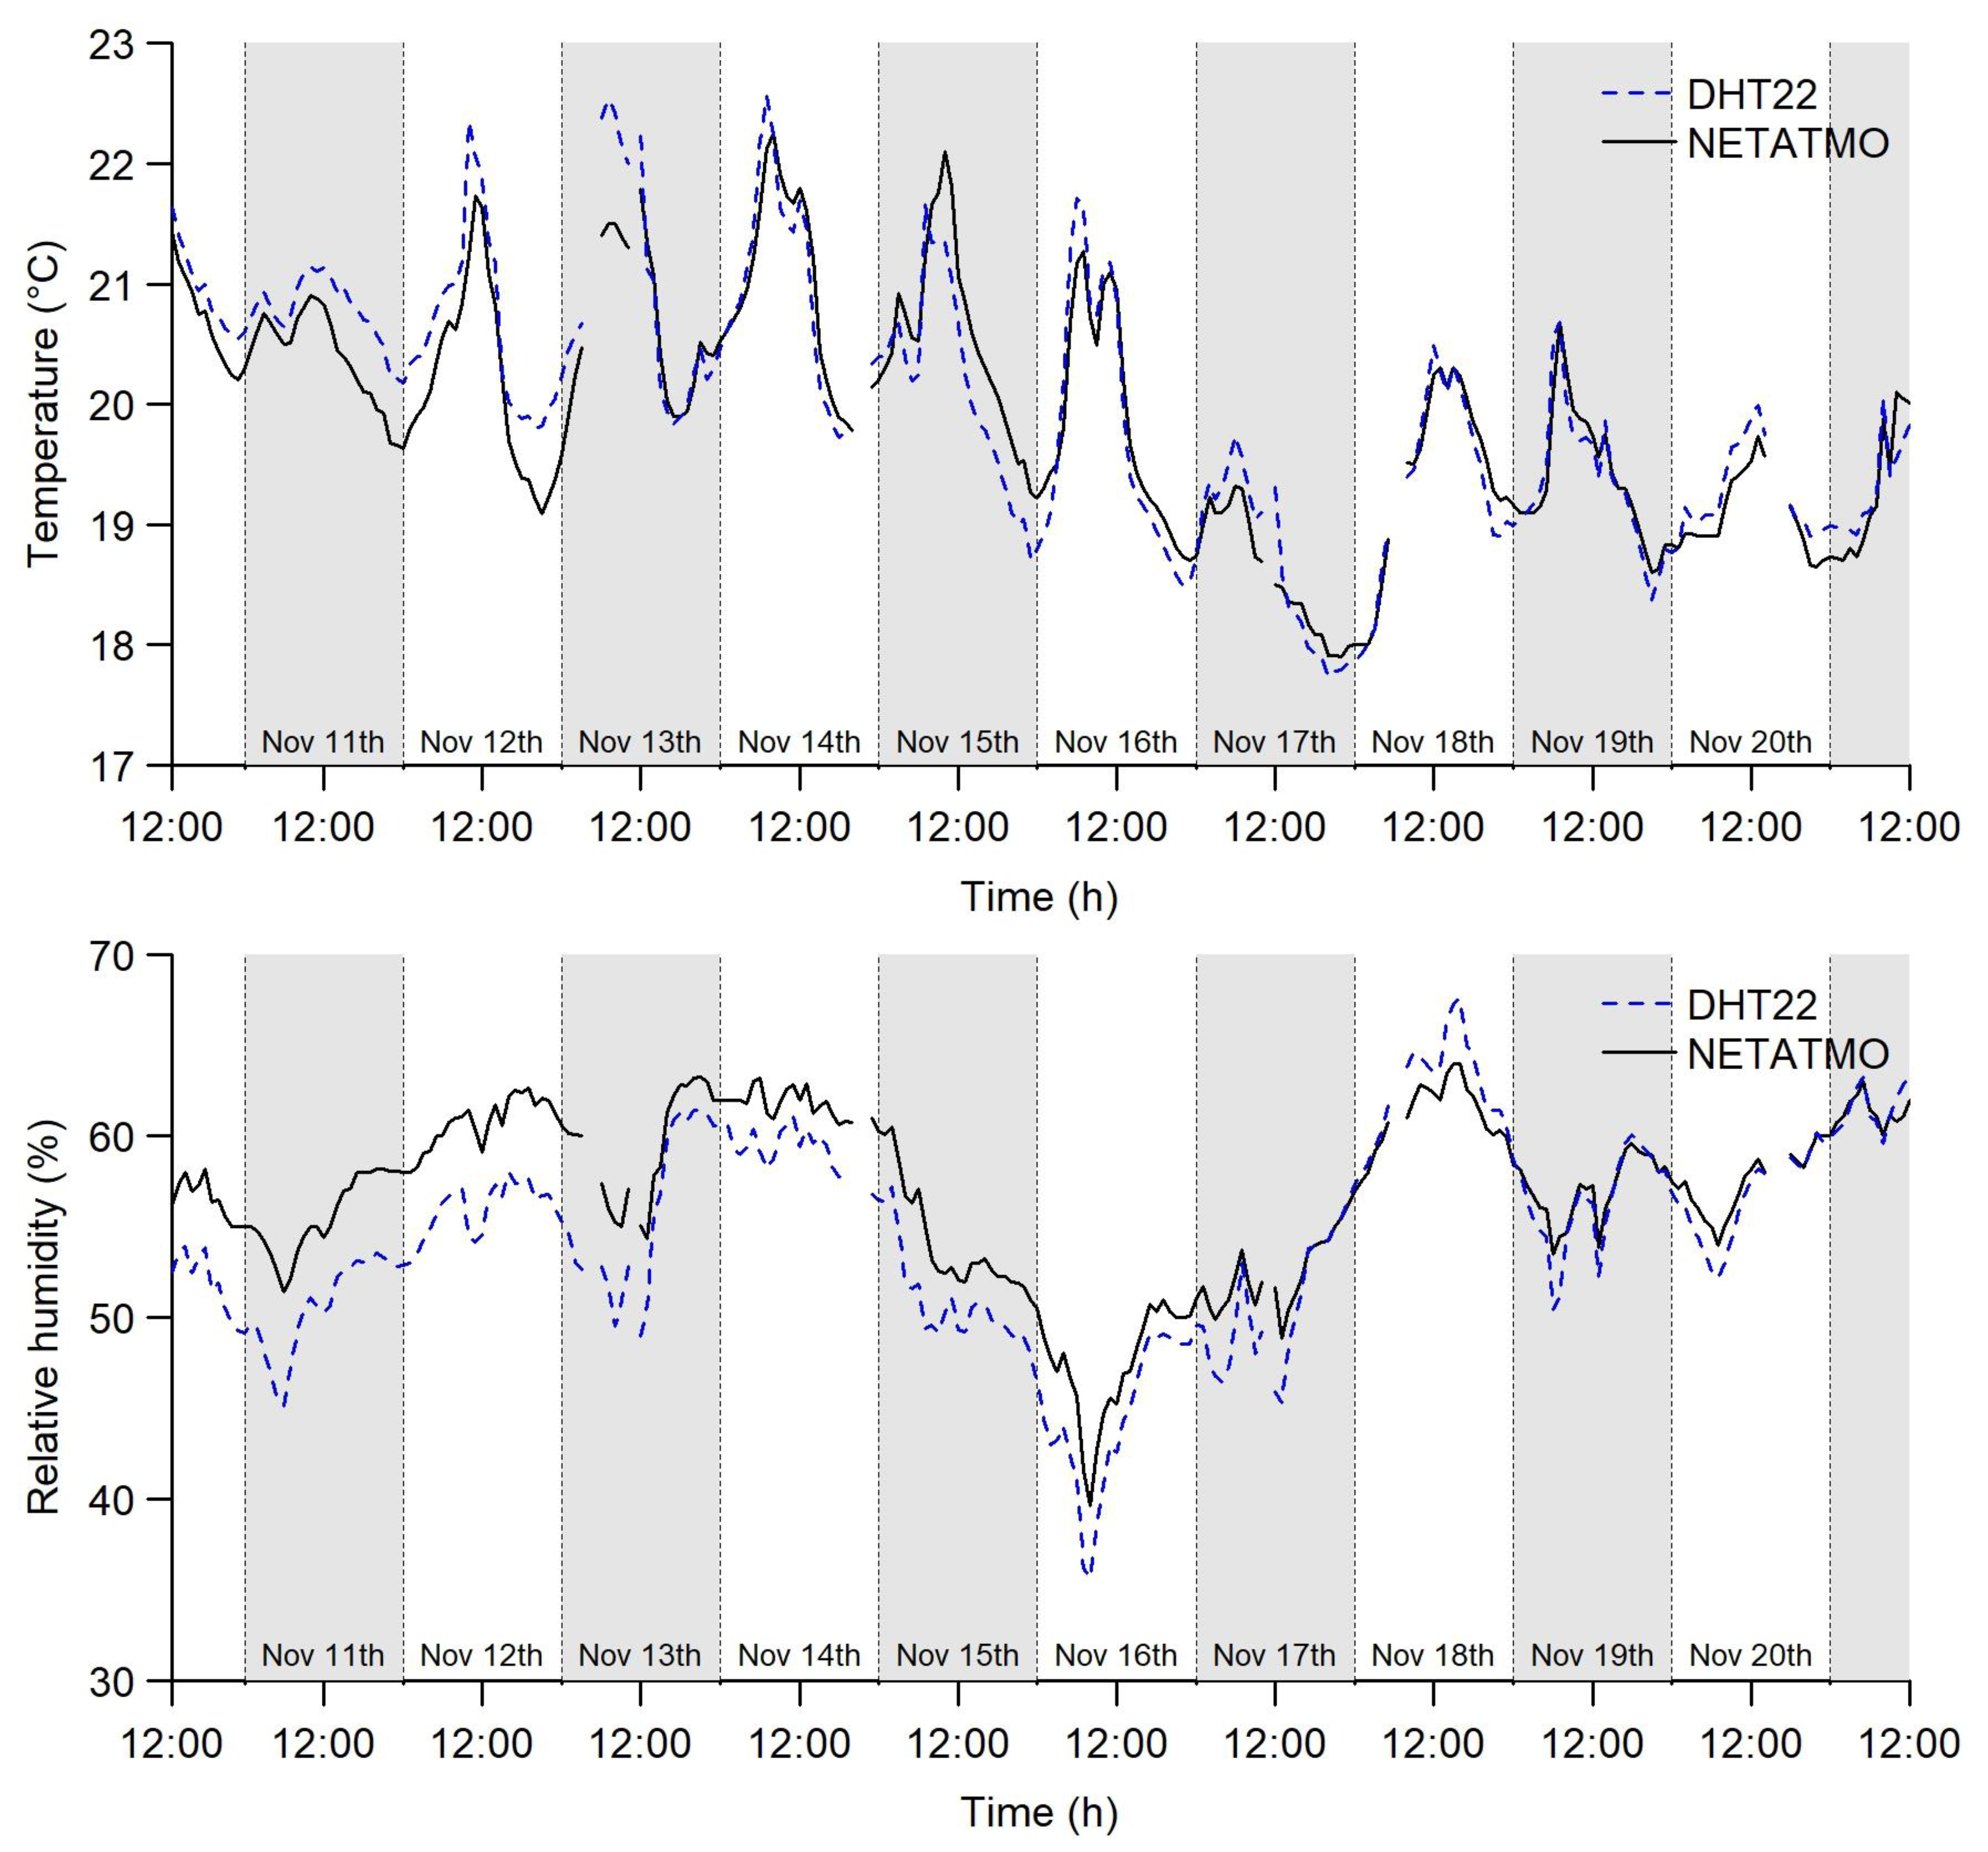
4.3.1. Accuracy and Calibration Test of the DHT22 Sensor
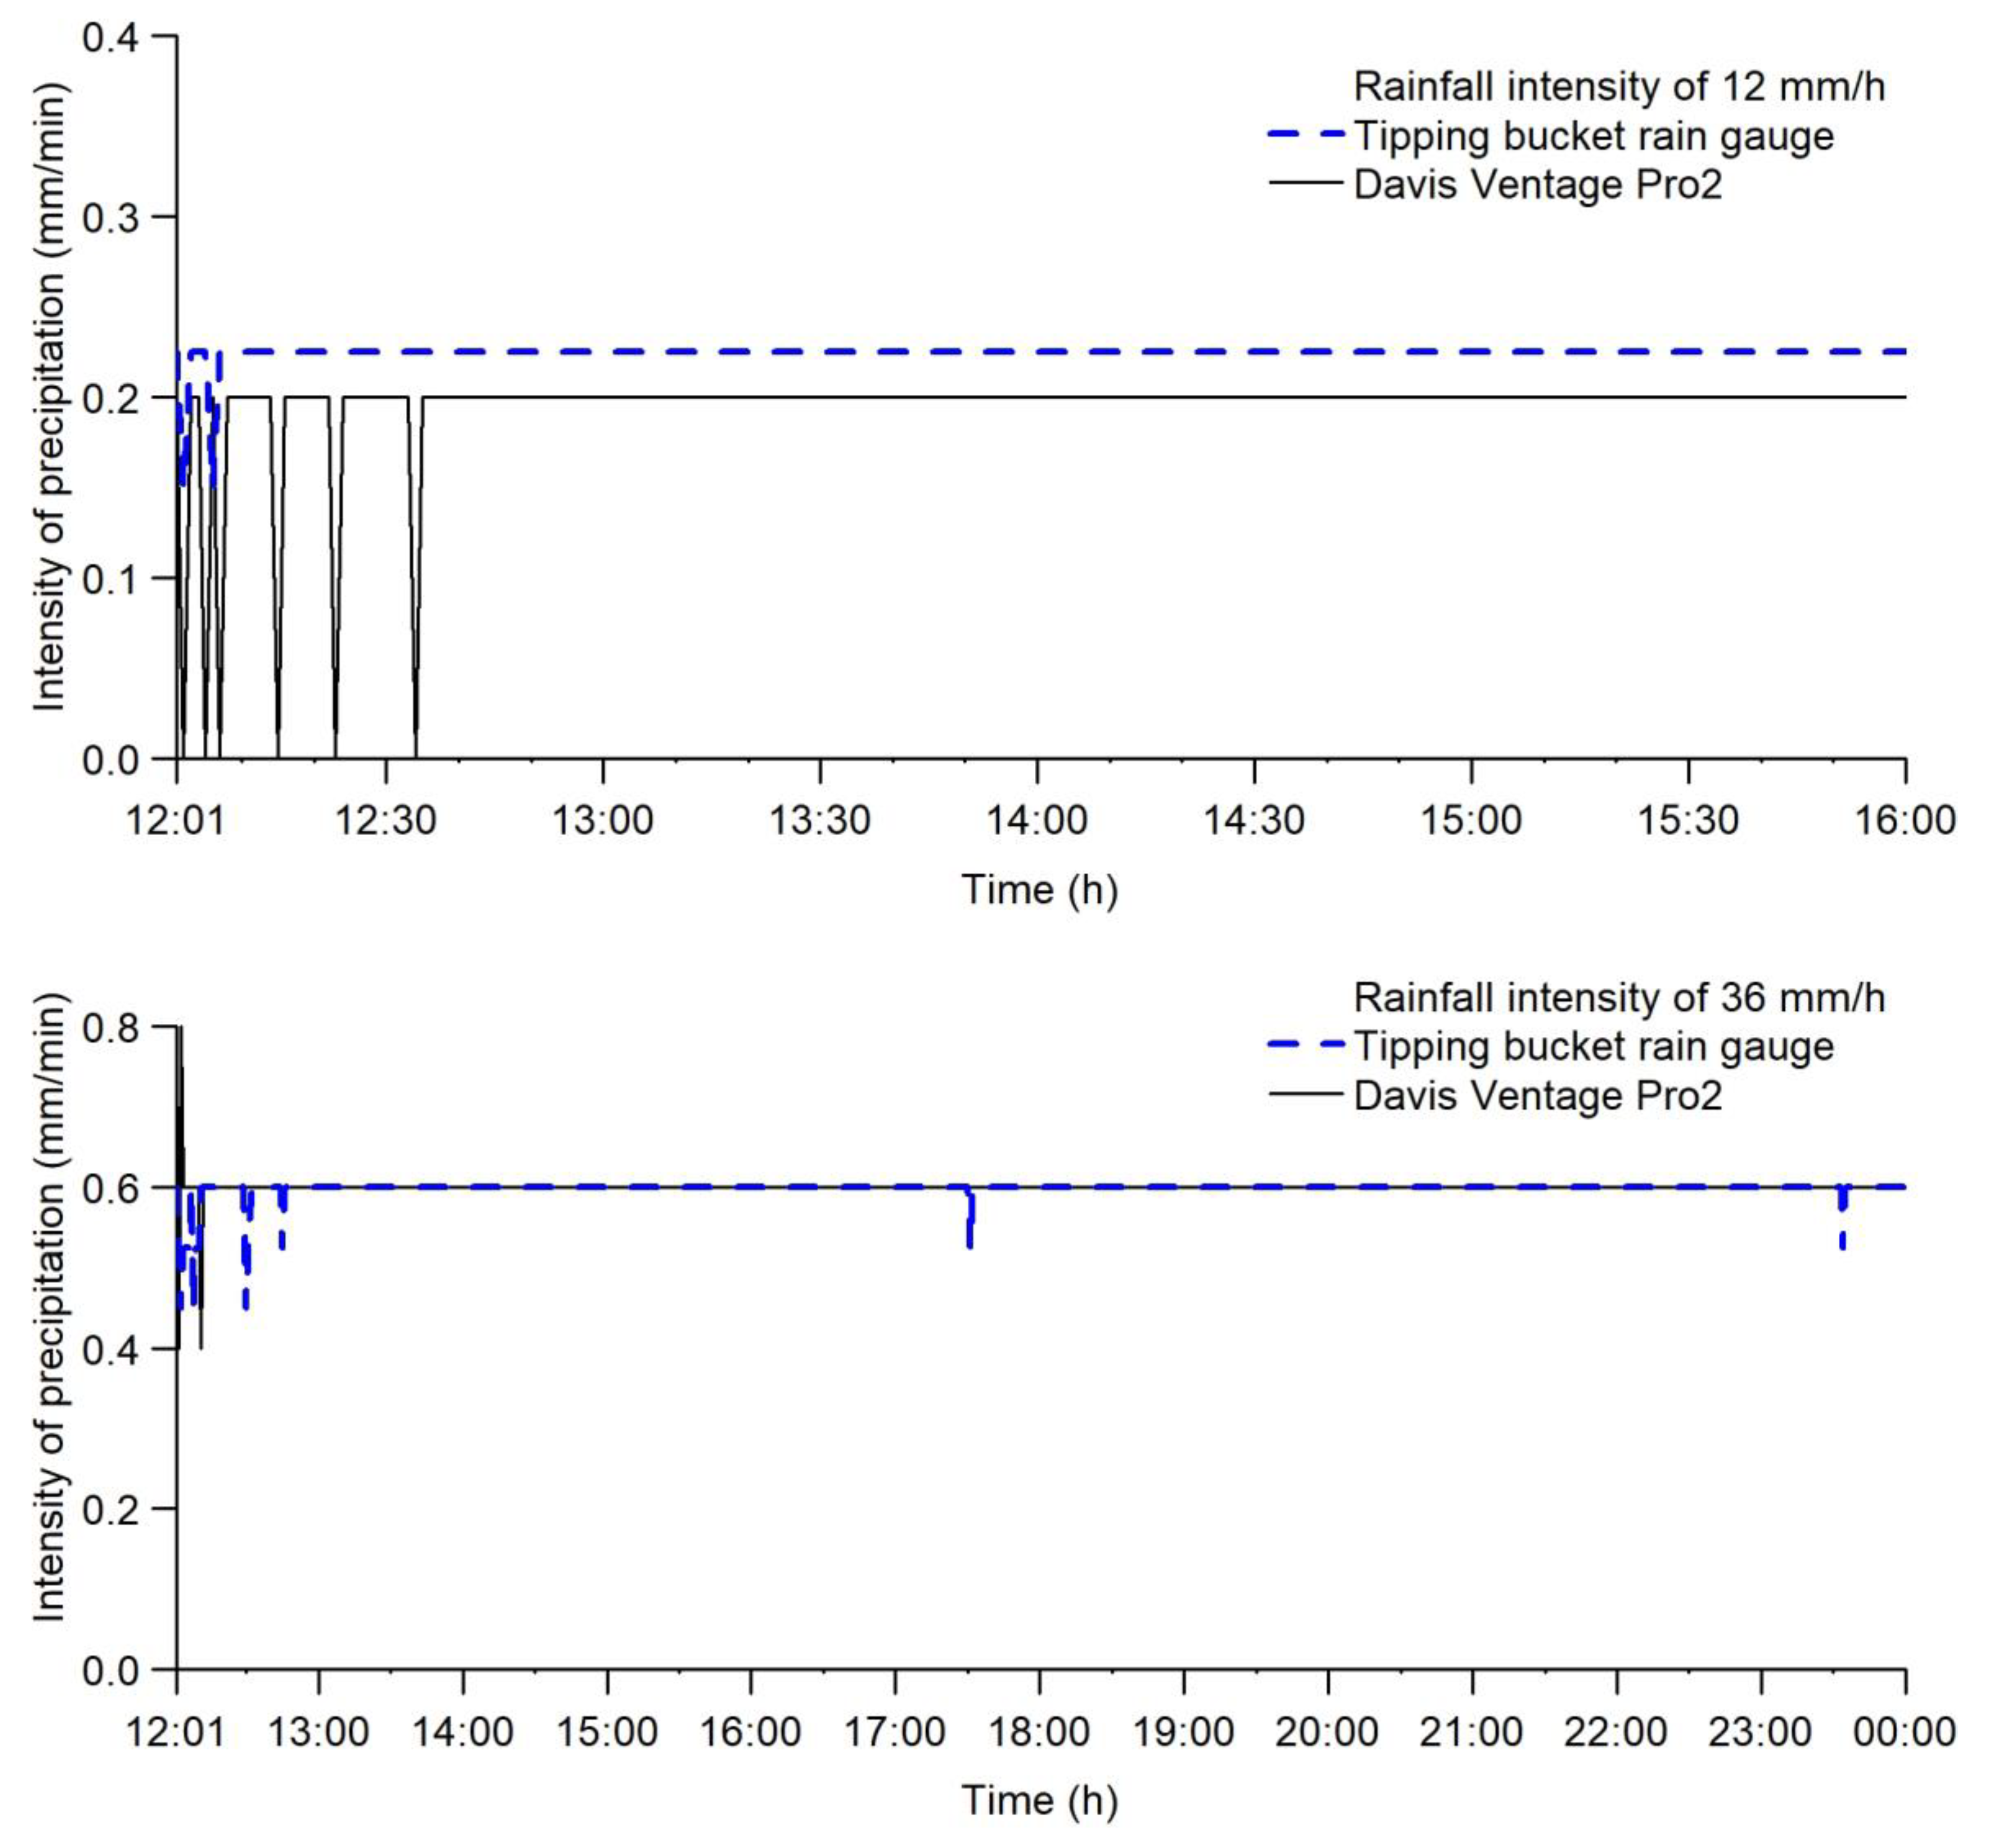
4.3.2. Accuracy and Calibration Test of the Tipping Bucket Rain Gauge Sensor
4.4. IoT Database Service Implementation
4.5. Automated Hydrological Information System (AHIS)
5. Conclusions
Author Contributions
Funding
Data Availability Statement
Acknowledgments
Conflicts of Interest
References
- Haider, S.; Masood, M.U.; Rashid, M.; Alshehri, F.; Pande, C.B.; Katipoğlu, O.M.; Costache, R. Simulation of the Potential Impacts of Projected Climate and Land Use Change on Runoff under CMIP6 Scenarios. Water 2023, 15, 3421. [Google Scholar] [CrossRef]
- Akbar, H.; Gheewala, S.H. Effect of Climate Change on Cash Crops Yield in Pakistan. Arab. J. Geosci. 2020, 13, 390. [Google Scholar] [CrossRef]
- Yesuph, A.Y.; Dagnew, A.B. Land Use/Cover Spatiotemporal Dynamics, Driving Forces and Implications at the Beshillo Catchment of the Blue Nile Basin, North Eastern Highlands of Ethiopia. Environ. Syst. Res. 2019, 8, 21. [Google Scholar] [CrossRef]
- Arreguín-Cortés, F.I.; López-Pérez, M. Impacts of Climate Change on the Hydrological Cycle in Mexico. Int. J. Water Resour. Dev. 2013, 29, 172–183. [Google Scholar] [CrossRef]
- Chang, B.; Li, R.; Zhu, C.; Liu, K. Quantitative Impacts of Climate Change and Human Activities on Water-Surface Area Variations from the 1990s to 2013 in Honghu Lake, China. Water 2015, 7, 2881–2899. [Google Scholar] [CrossRef]
- Madrigal, J.; Solera, A.; Suárez-Almiñana, S.; Paredes-Arquiola, J.; Andreu, J.; Sánchez-Quispe, S.T. Skill Assessment of a Seasonal Forecast Model to Predict Drought Events for Water Resource Systems. J. Hydrol. 2018, 564, 574–587. [Google Scholar] [CrossRef]
- Cuadrat, J.M.; Saz, M.; Vicente-Serrano, S.M.; González-Hidalgo, J.C. Water Resources and Precipitation Tends in Aragon. Int. J. Water Resour. Dev. 2007, 23, 107–123. [Google Scholar] [CrossRef]
- McNamara, I.; Nauditt, A.; Zambrano-Bigiarini, M.; Ribbe, L.; Hann, H. Modelling Water Resources for Planning Irrigation Development in Drought-Prone Southern Chile. Int. J. Water Resour. Dev. 2020, 37, 793–818. [Google Scholar] [CrossRef]
- Srivastava, C.; Singh, S.; Singh, A.P. IoT-Enabled Air Monitoring System. In Advances in Intelligent Systems and Computing; Springer: Singapore, 2020; Volume 910, pp. 173–180. ISBN 9789811360947. [Google Scholar]
- Kohlhuber, M.; Mielck, A.; Weiland, S.K.; Bolte, G. Social Inequality in Perceived Environmental Exposures in Relation to Housing Conditions in Germany. Environ. Res. 2006, 101, 246–255. [Google Scholar] [CrossRef]
- Rey, D.; Pérez-Blanco, C.D.; Escriva-Bou, A.; Girard, C.; Veldkamp, T.I.E. Role of Economic Instruments in Water Allocation Reform: Lessons from Europe. Int. J. Water Resour. Dev. 2019, 35, 206–239. [Google Scholar] [CrossRef]
- Baklanov, A.; Grimmond, C.S.B.; Carlson, D.; Terblanche, D.; Tang, X.; Bouchet, V.; Lee, B.; Langendijk, G.; Kolli, R.K.; Hovsepyan, A. From Urban Meteorology, Climate and Environment Research to Integrated City Services. Urban Clim. 2018, 23, 330–341. [Google Scholar] [CrossRef]
- Bauer, P.; Thorpe, A.; Brunet, G. The Quiet Revolution of Numerical Weather Prediction. Nature 2015, 525, 47–55. [Google Scholar] [CrossRef] [PubMed]
- Kim, H.; Vitart, F.; Waliser, D.E. Prediction of the Madden-Julian Oscillation: A Review. J. Clim. 2018, 31, 9425–9443. [Google Scholar] [CrossRef]
- Dunea, D.; Șerban, G.; Brețcan, P. Hydroinformatic Tools and Spatial Analyses for Water Resources and Extreme Water Events. Water 2023, 15, 463. [Google Scholar] [CrossRef]
- Ioannou, K.; Karampatzakis, D.; Amanatidis, P.; Aggelopoulos, V.; Karmiris, I. Low-Cost Automatic Weather Stations in the Internet of Things. Information 2021, 12, 146. [Google Scholar] [CrossRef]
- Bagiorgas, H.S.; Assimakopoulos, M.N.; Patentalaki, A.; Konofaos, N.; Matthopoulos, D.P.; Mihalakakou, G. The design, installation and operation of a fully computerized, automatic weather station for high quality meteorological measurements. Fresenius Bull. 2007, 16, 948–962. [Google Scholar]
- Ureña, F. Utilización de Estaciones Meteorológicas Automáticas Como Nueva Alternativa Para El Registro y Transmisión de Datos Fernando Ureña Elizondo. Posgrado Soc. Rev. Electron. Sist. Estud. Posgrado 2011, 11, 33–49. [Google Scholar]
- Imtiaz, A.; Omar, S.G.; Ali, T.A. Efficient Design of a Low Cost Portable Weather Station. In Proceedings of the 2018 International Conference on Computer Communication and Informatics, ICCCI 2018, Coimbatore, India, 5–7 June 2018; pp. 1–7. [Google Scholar] [CrossRef]
- Muñoz, R.C.; Yumang, X.S.; Japitana, S.J.A.; Medina, K.R.C.; Tibayan, J.E.T. Micro-Weather Station System for Small Geographical Coverage in the Philippines. IOP Conf. Ser. Earth Environ. Sci. 2018, 192, 012064. [Google Scholar] [CrossRef]
- Tomaschewski Netto, G.; Arigony-Neto, J. Open-Source Automatic Weather Station and Electronic Ablation Station for Measuring the Impacts of Climate Change on Glaciers. HardwareX 2019, 5, e00053. [Google Scholar] [CrossRef]
- Strigaro, D.; Cannata, M.; Antonovic, M. Boosting a Weather Monitoring System in Low Income Economies Using Open and Non-Conventional Systems: Data Quality Analysis. Sensors 2019, 19, 1185. [Google Scholar] [CrossRef]
- Haque, M.I.; Md Shatil, A.H.; Tusar, A.N.; Hossain, M.; Rahman, M.H. Renewable Powered Portable Weather Update Station. In Proceedings of the 1st International Conference on Robotics, Electrical and Signal Processing Techniques, ICREST 2019, Dhaka, Bangladesh, 10–12 January 2019; pp. 374–377. [Google Scholar] [CrossRef]
- Hong, W.J.; Shamsuddin, N.; Abas, E.; Apong, R.A.; Masri, Z.; Suhaimi, H.; Gödeke, S.H.; Noh, M.N.A. Water Quality Monitoring with Arduino Based Sensors. Environments 2021, 8, 6. [Google Scholar] [CrossRef]
- Mabrouki, J.; Azrour, M.; Dhiba, D.; Farhaoui, Y.; Hajjaji, S. El IoT-Based Data Logger for Weather Monitoring Using Arduino-Based Wireless Sensor Networks with Remote Graphical Application and Alerts. Big Data Mining Anal. 2021, 4, 25–32. [Google Scholar] [CrossRef]
- WMO Guide to Instruments and Methods of Observation; WMO: Geneva, Switzerland, 2018; Volume I, ISBN 9789263100085.
- Enciso, L.; Vargas, A. Interface with Ubidots for a Fire Alarm System Using WiFi. In Proceedings of the 2018 13th Iberian Conference on Information Systems and Technologies (CISTI), Caceres, Spain, 13–16 June 2018; pp. 1–6. [Google Scholar] [CrossRef]
- Singh, R.; Bhojwani, Y.; Reddy, R.; Sultana, H.P. Hand Gesture Based Multi-Purpose Bot. Int. J. Innov. Technol. Explor. Eng. 2019, 9, 4419–4423. [Google Scholar] [CrossRef]
- Vijaya Rajan, P.; Babu, T.; KarthikPandiyan, G.; Venkatragavan, D.; Shanmugam, R. Auxillary Safety Locking System of Vehicle Doors Using Arduino. Int. J. Innov. Technol. Explor. Eng. 2019, 9, 277–281. [Google Scholar] [CrossRef]
- Mejia, A.B.; Linares, A.; Reyes, C.; Rosales, M. Resource Management in Completion of an Arduino Engineering Project and Its Industrial Applications. In Proceedings of the 6th First Year Engineering Experience (FYEE) Conference, College Station, TX, USA, 7–8 August 2014. [Google Scholar]
- Salahuddin; Basyir, M.; Tusannalaila, S. Design Tools of Electric Applications Kwh Printing by Short Message Service. IOP Conf. Ser. Mater. Sci. Eng. 2019, 536, 012099. [Google Scholar] [CrossRef]
- Satria, D.; Yana, S.; Yusibani, E.; Syahreza, S. Zulfan Implementation of the SMS Gateway in the Flood Early Warning Information System for Village Warning and Community Information. Int. J. Eng. Adv. Technol. 2019, 8, 4005–4009. [Google Scholar] [CrossRef]
- Taştan, M.; Gökozan, H. Real-Time Monitoring of Indoor Air Quality with Internet of Things-Based e-Nose. Appl. Sci. 2019, 9, 3435. [Google Scholar] [CrossRef]
- Anggraini, D.; Effendy, N.; Ihsan Al Hafiz, M.; Ojeda Luviano, D. Research and Development of a Power Monitoring System for the Sustainable Energy Management System Implementation at Green School, Bali, Indonesia. E3S Web Conf. 2018, 43, 01021. [Google Scholar] [CrossRef]
- Radhika, D.; Aruna Kumari, D. The Smart Triad: Big Data Analytics, Cloud Computing and Internet of Things to Shape the Smart Home, Smart City, Smart Business & Smart Country. Int. J. Recent Technol. Eng. 2019, 8, 3594–3600. [Google Scholar] [CrossRef]
- Xu, R.; Zeng, Q.; Zhu, L.; Chi, H.; Du, X.; Guizani, M. Privacy Leakage in Smart Homes and Its Mitigation: IFTTT as a Case Study. IEEE Access 2019, 7, 63457–63471. [Google Scholar] [CrossRef]
- Iskandar, M.S.; Adhayani, S.W. Analysis of Utilizing Website in Designing Online Store Site. IOP Conf. Ser. Mater. Sci. Eng. 2018, 407, 12178. [Google Scholar] [CrossRef]
- Stair, R.; Reynolds, G. Principles of Information Systems. A Managerial Approach, 9th ed.; Course Technology; Cengage Learning: Boston, MA, USA, 2010; ISBN 13:978-0-324-66528-4. [Google Scholar]
- NMX-AA-166/1-SCFI-2013; Estaciones Meteorológicas, Climatológicas e Hidrológicas. Secretaría de Economía: Ciudad de México, Mexico, 2013.
- Avanzato, R.; Beritelli, F. An Innovative Acoustic Rain Gauge Based on Convolutional Neural Networks. Information 2020, 11, 183. [Google Scholar] [CrossRef]


| Attributes | Weather Stations | ||
|---|---|---|---|
| SMN | OOAPAS | EMAS | |
| Public information | X | X | X |
| Historical database generation | X | X | |
| Use of GIS | X | X | |
| Real-time monitoring | X | X | |
| Low-cost | |||
| Warning generation system | |||
| Device | Current (mA) | Power (W) | Time of Use (h) |
|---|---|---|---|
| Modules and sensors | 200 | 1 | 24 |
| Material | Cost |
|---|---|
| Modules, sensors, and communication system | $70.00 |
| Phenolic plate | $25.00 |
| Power supply | $30.00 |
| Mounting frame | $25.00 |
Disclaimer/Publisher’s Note: The statements, opinions and data contained in all publications are solely those of the individual author(s) and contributor(s) and not of MDPI and/or the editor(s). MDPI and/or the editor(s) disclaim responsibility for any injury to people or property resulting from any ideas, methods, instructions or products referred to in the content. |
© 2023 by the authors. Licensee MDPI, Basel, Switzerland. This article is an open access article distributed under the terms and conditions of the Creative Commons Attribution (CC BY) license (https://creativecommons.org/licenses/by/4.0/).
Share and Cite
Sánchez-Quispe, S.T.; Madrigal, J.; Rodríguez-Licea, D.; Domínguez-Mota, F.J.; Domínguez-Sánchez, C.; Lara-Ledesma, B. Development of a Low-Cost Automated Hydrological Information System for Remote Areas in Morelia, Mexico. Water 2023, 15, 3888. https://doi.org/10.3390/w15223888
Sánchez-Quispe ST, Madrigal J, Rodríguez-Licea D, Domínguez-Mota FJ, Domínguez-Sánchez C, Lara-Ledesma B. Development of a Low-Cost Automated Hydrological Information System for Remote Areas in Morelia, Mexico. Water. 2023; 15(22):3888. https://doi.org/10.3390/w15223888
Chicago/Turabian StyleSánchez-Quispe, Sonia Tatiana, Jaime Madrigal, Daniel Rodríguez-Licea, Francisco Javier Domínguez-Mota, Constantino Domínguez-Sánchez, and Benjamín Lara-Ledesma. 2023. "Development of a Low-Cost Automated Hydrological Information System for Remote Areas in Morelia, Mexico" Water 15, no. 22: 3888. https://doi.org/10.3390/w15223888
APA StyleSánchez-Quispe, S. T., Madrigal, J., Rodríguez-Licea, D., Domínguez-Mota, F. J., Domínguez-Sánchez, C., & Lara-Ledesma, B. (2023). Development of a Low-Cost Automated Hydrological Information System for Remote Areas in Morelia, Mexico. Water, 15(22), 3888. https://doi.org/10.3390/w15223888