Abstract
As a coastal city with rapid urbanization and high-intensity human activities, Shenzhen, China has carried out a series of comprehensive treatments for water pollution control and ecological restoration in recent years. However, the restoration effect is mainly reflected in the improvement of water quality and riparian landscape, and there is still a big gap in reaching the river’s ecological restoration goals. Therefore, it is necessary to make a full investigation and evaluation of river aquatic systems that focuses on the restoration of aquatic communities and ecosystem health. We surveyed forty-seven sampling sites in nine basins to investigate water quality and aquatic organisms (algae and macroinvertebrates) during the low-water period in 2019. Under the guidance of the EU Water Framework Directive (WFD), the urban river ecosystem health assessment system, with a total of twenty indicators from six criteria layers, was established. We addressed the bioremediation objectives in this system and aquatic organism indicators as high-weight characteristic indicators. The results showed that the degradation of the river ecosystem in Shenzhen is serious, which is mainly reflected in the simple structure of the aquatic biological community and the low biodiversity. Only one “healthy” sample site, accounting for 2% of the total sampling sites; six sites of “sub-health” level, accounting for 13%; twenty-four “poor” sample points, accounting for 51%; sixteen “extremely poor” sample points, accounting for 34%. From the perspective of spatial distribution, the river ecological status of Daya Bay Basin and Dapeng Bay Basin is good, which is at the level of “health” to “sub-health”; the Guanlan River Basin, Maozhou River Basin, Shenzhen River Basin, Shenzhen Bay Basin, Pingshan River Basin, and most of the Longgang River Basin are of “poor to extremely poor” grade; the Pearl Estuary basin is of “extremely poor” grade. This assessment system can be used as an effective tool to monitor the ecological health status, especially the enhancement of biodiversity and ecosystem function of rivers. Moreover, it could provide important decision-making guidance for river management affected by high-intensity human activities.
1. Introduction
River ecological health is the foundation of urban ecosystem service supply and water ecological civilization construction, which is of great significance to urban sustainable development [1]. A healthy river ecosystem should have reasonable organizational structure and good operational function. It can exert elasticity and stability against sudden natural or man-made disturbances. In recent years, with intensive human activities, resource overexploitation and environmental pollution, urban river ecosystems in mega-cities, such as Shenzhen and Shanghai, have been greatly stressed. The integrity of aquatic ecosystems has been seriously damaged, aquatic species have decreased, and river health has shown a trend of degradation, causing a series of “urban stream syndrome” incidents [2,3,4]. The “Act Plan for Prevention and Control of Water Pollution of China” clearly states that we must make every effort to ensure the safety of the water ecological environment, protect the aquatic ecosystem, improve aquatic biodiversity, and strive to restore the national aquatic ecosystem functions by 2030. However, for cities, restoration measures such as improving habitat conditions in urban rivers, reducing pollution discharge, and improving water quality are not enough to restore the river ecosystem. The integrity and health status of restored ecosystems deserve to be paid great attention [5].
The assessment work on river ecosystem health started early abroad from the 1980s [6]. Marked progress has been achieved in establishing a set of river ecosystem assessment systems, such as the Australian River Assessment Scheme (AusRIVAS) [7], River Invertebrate Prediction and Classification System (RIVPACS) from the UK [8], and Rapid Bioassessment Protocols (RBPs) proposed by the USA [9]. These worldwide applied systems have been concerned with the ecological integrity of rivers and their biological indicators.
From a management point of view, the EU Water Framework Directive (WFD) (2000/60/EC) [10], formulated by the European Union, is reinforcing the importance of shared international policies on monitoring the quality of river ecosystems. Since its promulgation and implementation in 2000, the directive has been dedicated to enabling the European water environment to meet the needs of human beings and flora and fauna. Its advanced water environment assessment system, strict pollution management standards, scientific concept of water ecological protection, and legal effect have played an important role in the field of water environment protection [11]. The water ecosystem includes biological and abiotic factors, and its health involves not only its physical and chemical environment, but also the integrity of biological community. The evaluation sequence of water ecological status in WFD is as follows: biological indexes—physical and chemical indexes—hydrological and morphological indexes. Only the state of three indexes are “excellent” and the water body can be finally rated as “excellent”. Among the indicators, the WFD ranks biological indicators in the first place.
The multi-indicator evaluation method considers the ecological, economic, and social function of river ecosystems, and becomes an important means to evaluate the health assessment of river-water ecosystems by reflecting the physical, chemical, biological, and social index at different scales. In recent years, the multi-indicator evaluation method has been widely used in the health assessment of urban restoration river ecosystems [12,13,14,15].
Over the last few decades, point source (industrial and domestic sewage discharges) and non-point source pollution loads have inundated river channels resulting in the poor water quality situation in Shenzhen. With the gradual and effective control of point source pollution, the stress of non-point source and intercepted overflow pollution on water has become increasingly prominent. The rapid urban construction, continuous expansion of population size, the existence of urban villages, and other factors, have led to the failure to keep up with the urban supporting facilities construction and urban health management. The collection and treatment measures for key pollution sources, such as urban villages, farmers’ markets, auto repair shops, garbage tanks, grease traps, landfills, orchards, and vegetable fields are imperfect. For the above reasons, inadequate urban management projects (road garbage, catering industry management, garbage transportation management, etc.) lead to a large number of non-point source pollutants (solid pollutants, heavy metals, oils, toxic organic compounds, pesticides, nitrogen and phosphorus nutrients, etc.). At the same time, the formation of a large number of hardened underlying surface characteristics (buildings and roads) has changed the original low-impact underlying surface characteristics (soil and vegetation). In addition, the rainfall intensity is concentrated and the runoff formation is short in Shenzhen. The heavy load of non-point source polluted river water has a great impact on urban water quality.
In recent years, Shenzhen has carried out a series of water pollution control and water ecological restoration work projects. In 2019, Shenzhen achieved the goal of the elimination of black and odorous water bodies in the city. With river ecological restoration and waterfront landscape construction, water quality improved effectively. However, in general, river restoration still stays in terms of pollution control and landscape improvement, and there is still a big gap in the requirements of water ecosystem restoration goals. At present, the evaluation study of Shenzhen rivers focuses relatively on water quality and habitat [16,17], and the assessment of biome status and anthropogenic disturbance is insufficient, which cannot fully reflect the community complexity and urban regionality. There is a lack of studies on the health evaluation of the city’s river-water ecosystem, especially after large-scale restoration. Therefore, aiming at the goal of aquatic biological remediation, based on the comprehensive analysis of aquatic biological survey characteristics, we established a river ecosystem health evaluation index system with WFD’s guide. It is of specific significance to improving river health and provides a theoretical scientific basis for managing and restoring urban river ecosystems.
2. Materials and Methods
2.1. Study Area
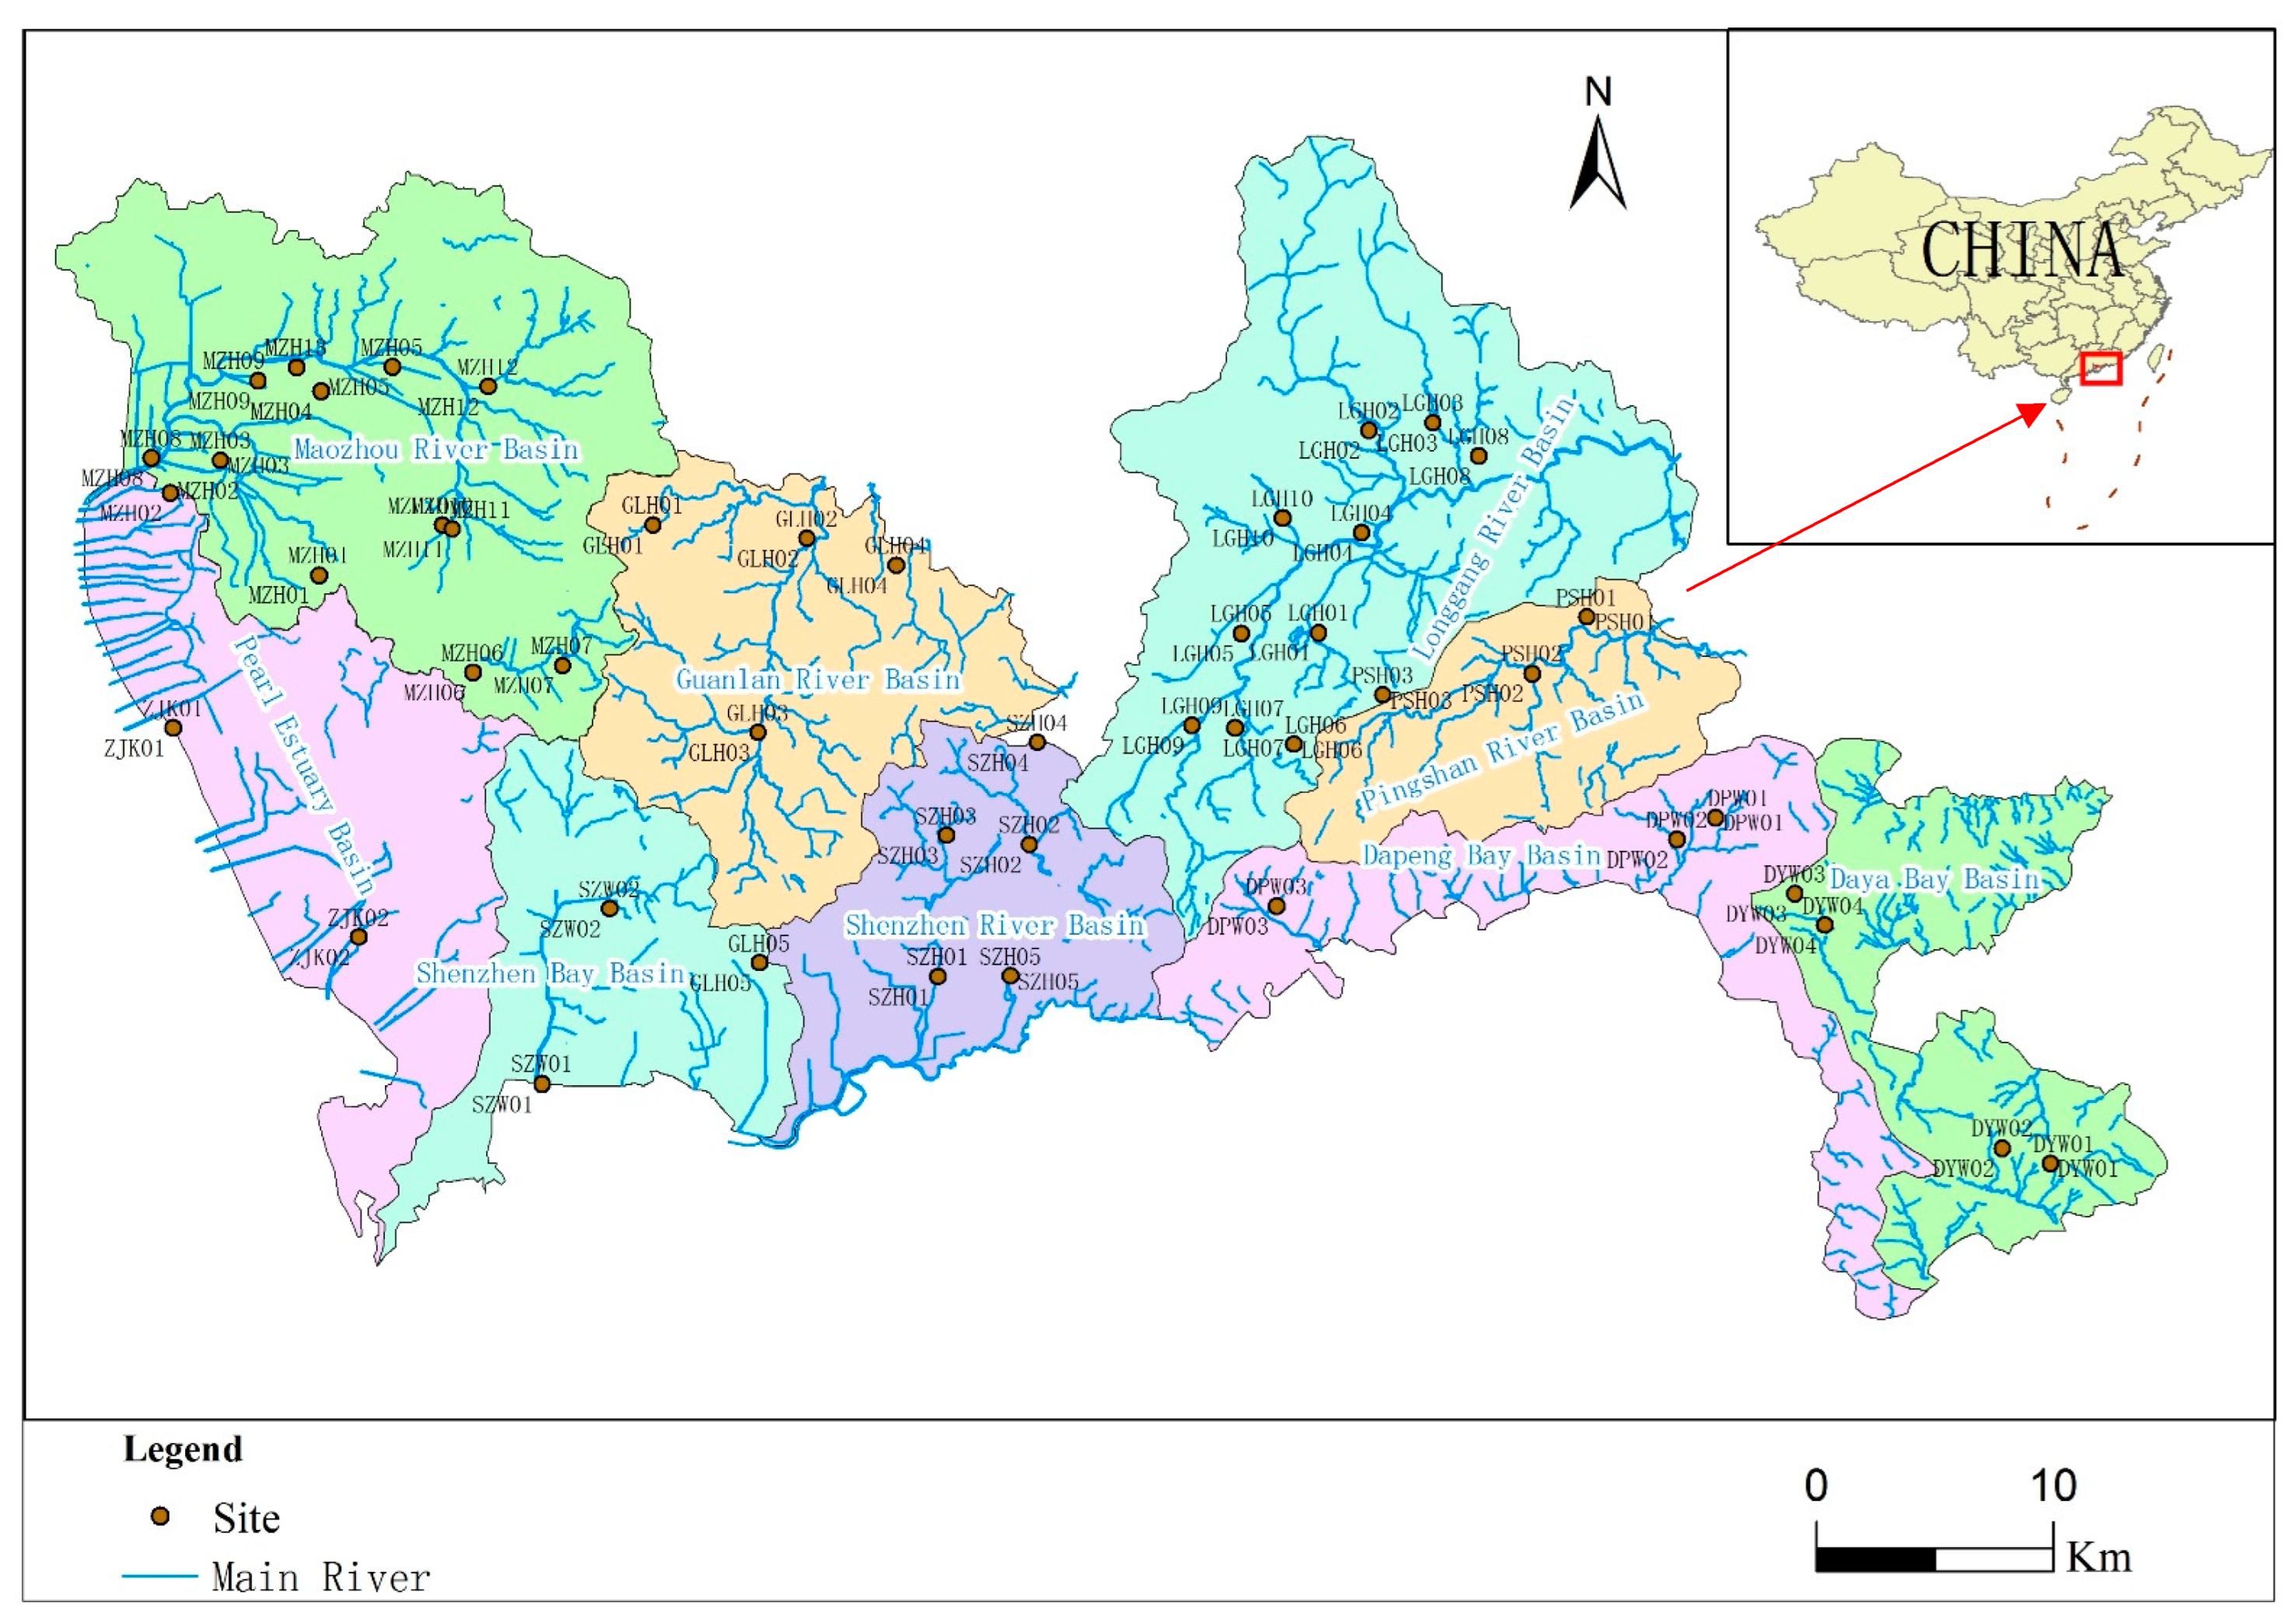
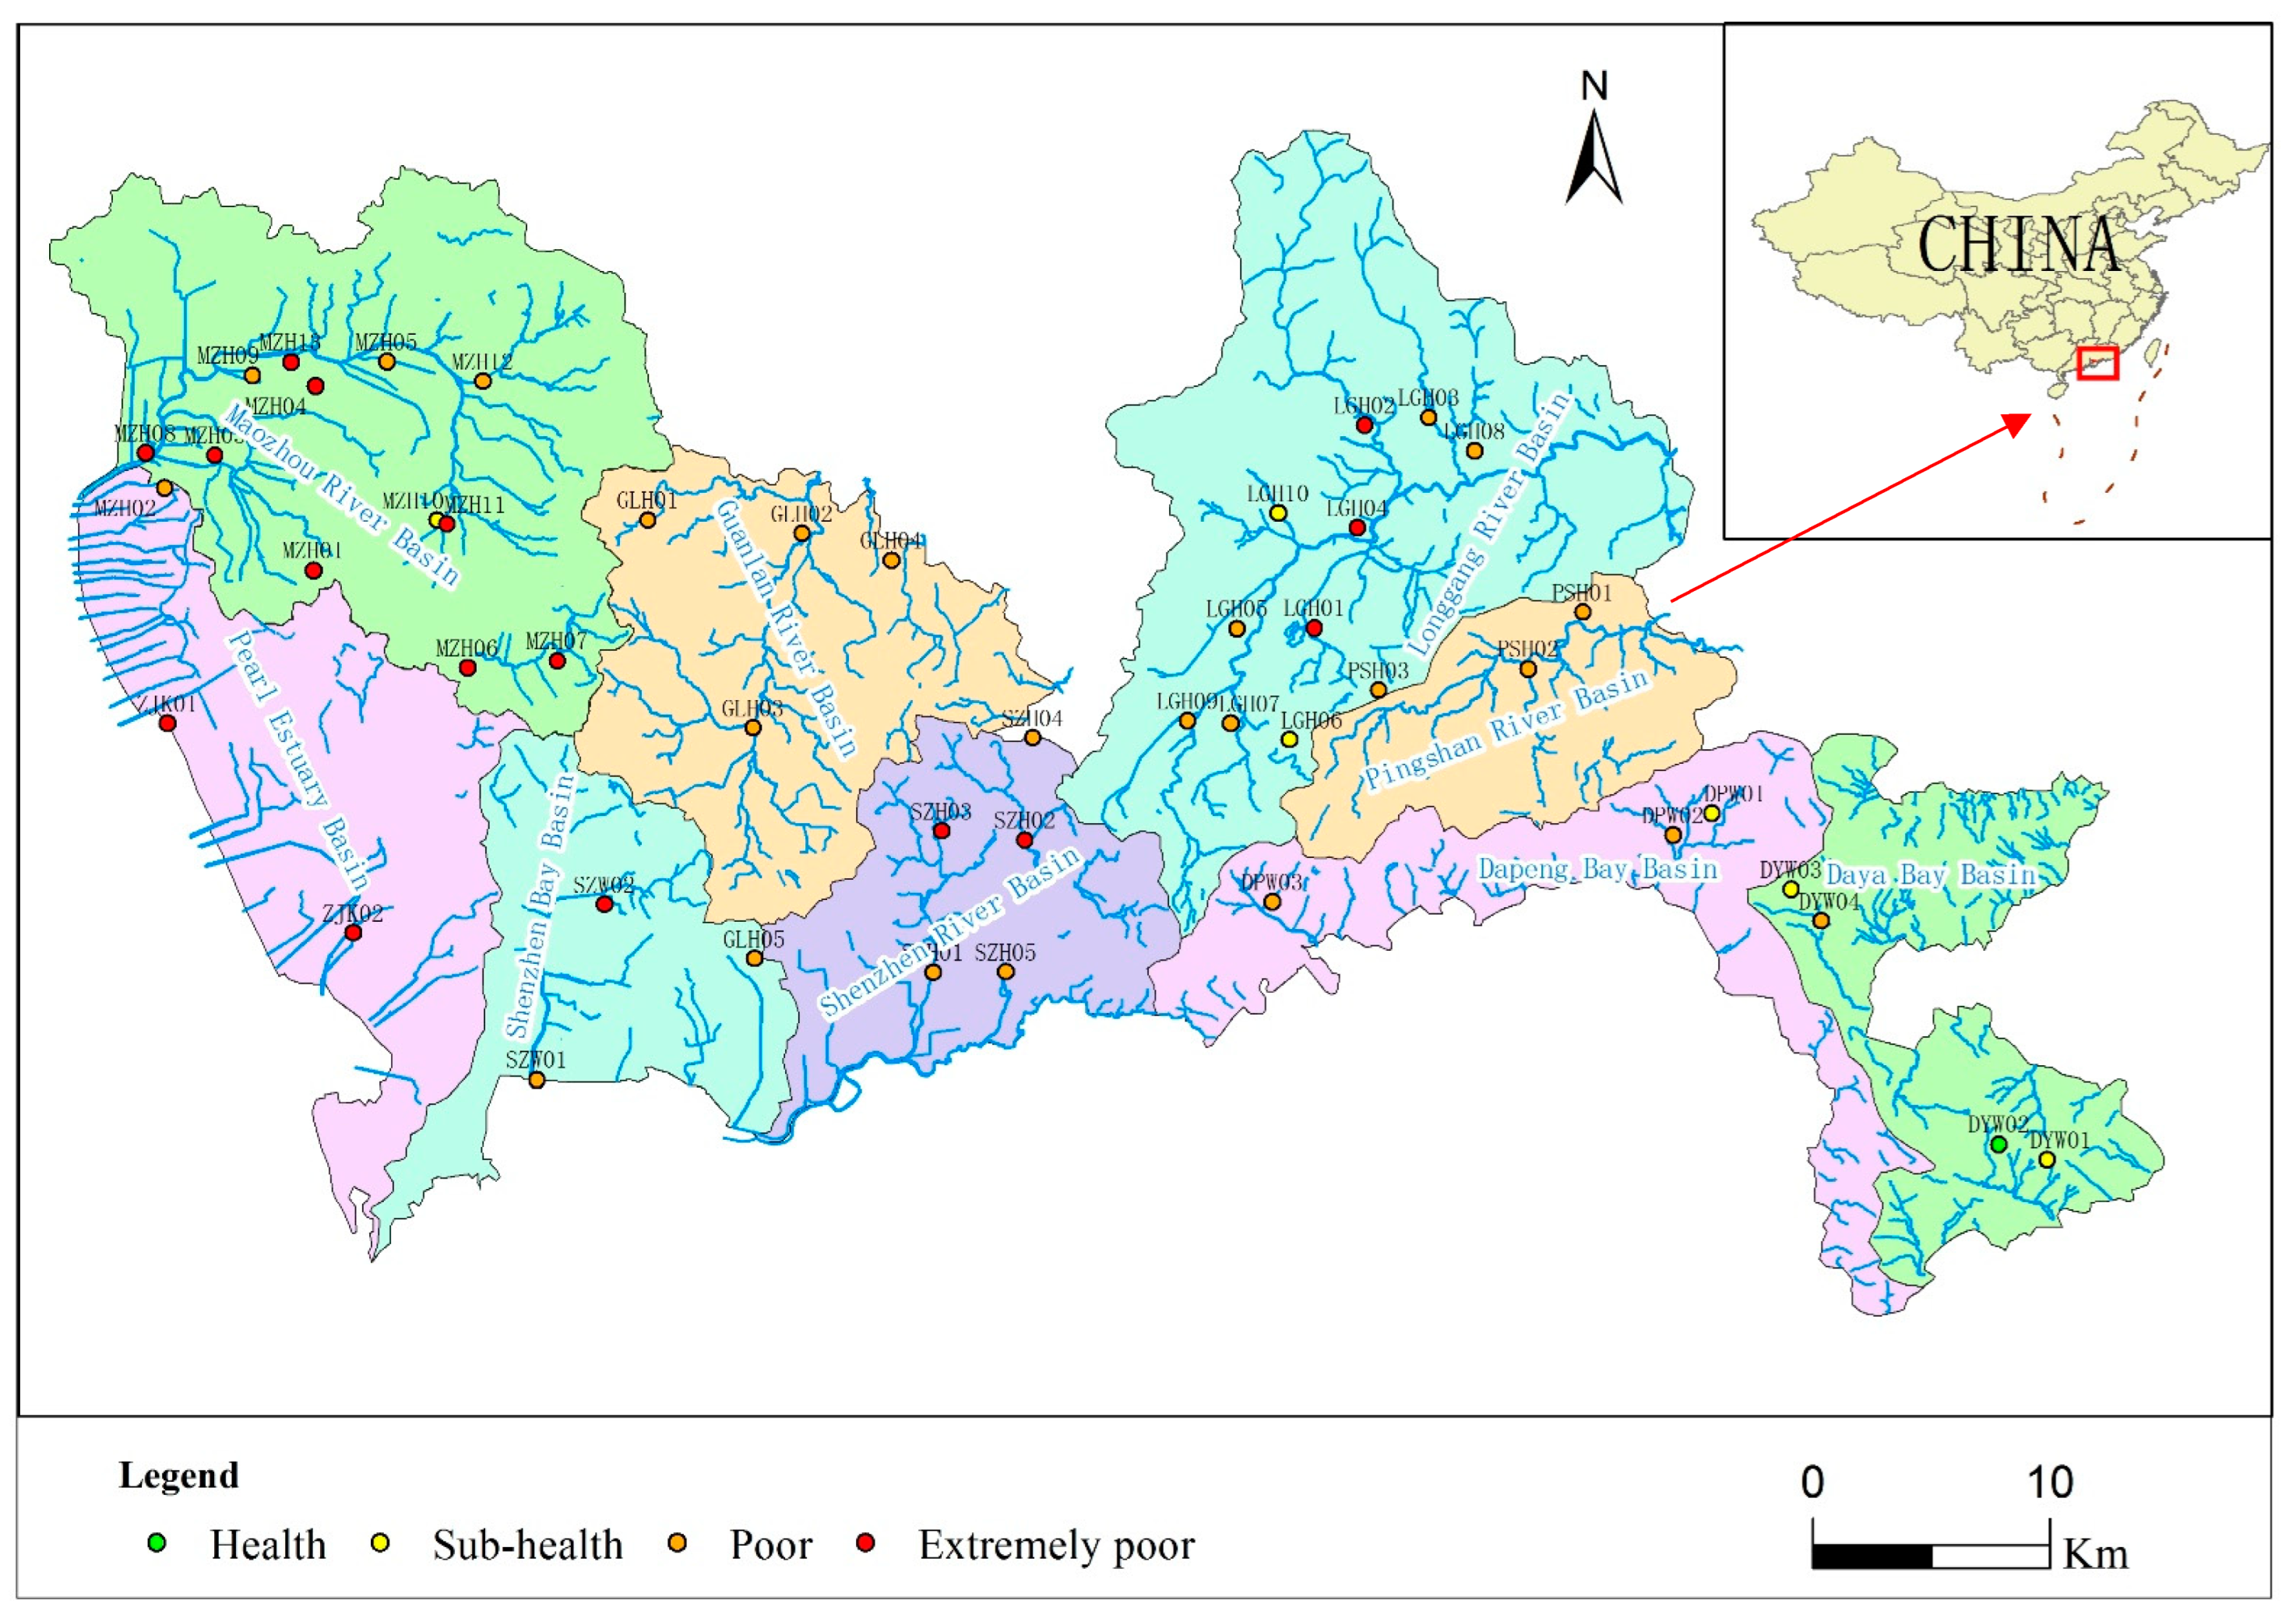
Shenzhen, which is located in the south of Guangdong Province, is bordered by Dapeng Bay and Daya Bay in the east, the mouth of the Pearl River in the west, Dongguan and Huiyang in the north, and Hong Kong in the south. The geographical shape is a narrow and long shape, which is wide from east to west and narrow from north to south. There are 310 rivers with a basin area of 1 square kilometer. The city is divided into nine major river basins: Shenzhen River, Shenzhen Bay, Maozhou River, Guanlan River, Longgang River, Pingshan River, Pearl Estuary, Dapeng Bay, and Daya Bay (Figure 1). Long-term human activities and land use development, especially the development of urbanization, directly or indirectly change the river water environment, resulting in serious degradation of river ecosystems. Despite making substantive efforts in river ecological restoration projects, the biodiversity is still low, and the biological integrity and ecosystem balance of the rivers have not been significantly restored.
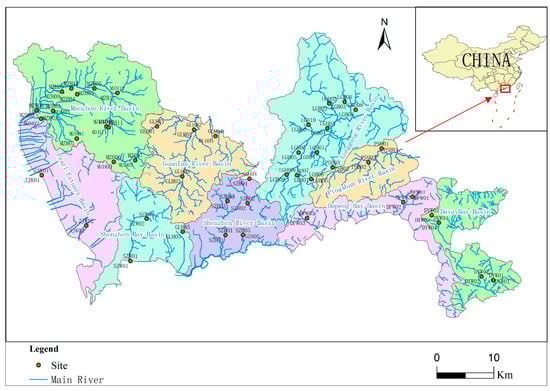
Figure 1.
Distribution of rivers and sampling points in Shenzhen.
2.2. Collection and Analysis
2.2.1. Sampling Points
The sampling sites, which are selected as widely distributed and have special ecological significance in the water ecosystem of the river basin, mainly involve three types of river sections: upstream mountain stream river section, middle urban river section, and downstream tidal river section. For this aim, a total of 47 sampling sites were selected for investigation during the dry period in 2019 (Figure 1). We focused on collecting water samples, planktonic algae samples, and macroinvertebrate samples. The investigation of habitat indicators mainly includes altitude, slope, river width, water depth, flow rate, and substrate type.
2.2.2. Sample Collection
Water sample collection was carried out concerning “Water Quality and Wastewater Monitoring and Analysis Methods (Fourth Edition)”, and parameters such as pH, dissolved oxygen, water temperature, and conductivity were determined by portable water quality parameter meter (YSI-5100 [YSI Inc., Yellow Springs, USA], METTLER-SG2 [Mettler-Toledo Instruments (Shanghai) Co., Ltd., Shanghai, China], METTLER-SG3 [Mettler-Toledo Instruments (Shanghai) Co., Ltd. Shanghai, China]) on site. The water velocity was measured near the riverbed for 60 s using a hydrometric propeller (LS1206B, Nanjing, China). Algae sampling was carried out following the Technical Code for Freshwater Biological Resources Survey (DB43/T 432-2009) [18], while benthic animals were sampled following the “composite habitat sampling method” in the Rapid Assessment Guidelines (RBPs) in the United States. The total sampling area of each sample is approximately 3 m2. D-shaped mesh (40 mesh yarn, 0.3 m width) and Sauber net (40 mesh yarn, 0.09 m2) were collected according to the type of river substrate. A 60-mesh screen is used for sieving and washing. The selected benthic animals are immediately fixed in a 75% alcohol solution.
2.2.3. Sample Analysis and Identification
At each site, water samples were collected below the water surface prior to macroinvertebrate sampling for measuring the physical and chemical conditions. For nutrient analyses, water samples were transported to the laboratory at 4 °C. Total nitrogen, ammoniacal nitrogen, nitrate nitrogen, and total phosphorus were analyzed using a UV spectrophotometer immediately upon the arrival of the samples at the laboratory. Algae samples were identified and counted under a 400-multiplier microscope [19,20]. Benthic algae are dominated by diatoms, which are calculated as the sum of algae at each sample and converted to the density of stones per unit area (ind./m2), while macroinvertebrates were identified in the laboratory using identification keys [21,22].
2.3. Construction of Assessment System
2.3.1. Principles of Evaluation Index Selection
The selection of indicators must meet three objectives: (1) It can completely reflect the structure, function, and health status of various urban river systems; (2) It can reflect the impact of human activities and the decline of river health; (3) It can be used for long-term monitoring, so as to regularly provide reports with river status, changes and trends, and make management decisions promptly for government. In order to meet the above objectives, the selection of evaluation indicators should follow the following principles: (1) Objectives. This study closely focuses on the goal of river bioremediation, and indicators should reflect the biological community structure, functional status, and ecosystem health status of the river; (2) Representativeness and pertinence. In consideration of the special geographical location of the river system in Shenzhen and the background of strong human activity, local conditions indicators and the major stress factors are strengthened; (3) Combining qualitative and quantitative analysis. Quantitative indicators shall be selected first, and each indicator shall be classified as quantitatively as possible to reduce the error caused by subjective judgment. Some difficult quantitative evaluation needs to be combined with qualitative and quantitative comprehensive evaluation.
2.3.2. Index System Construction
The index system was constructed based on the WFD and relevant research on river health assessment in Shanghai, Chongqing, Tianjin, and other large cities in China [23,24,25]. The Pearson correlation coefficient of all optional indicators did not have a significant correlation (p > 0.6). The river ecosystem health assessment system of Shenzhen, with a total of 20 indicators from 6 criteria layers, was established (Appendix A).
Hydrographic Features
The hydrological characteristics of rivers are of great significance to river water quality, morphology, composition of biological communities, and riparian vegetation. This is important given the characteristics of Shenzhen rivers, which are mostly artificially modified, with small surface runoff, poor river storage conditions, and a large number of tidal rivers. Therefore, the flow rate, water depth, and water volume are used to reflect the water regime of manually controlled urban rivers.
River Morphology
According to the field survey, hardened three-sided river channels in Shenzhen are relatively common, the diversity of the bottom material is poor, and various restoration projects lead to large differences in the stability of the riverbanks. Moreover, we focus on the assessment under the guidance of bioremediation objectives, so we hope to construct the index system to have a direct impact on aquatic organisms. Consequently, four indicators, including bottom material, river bend degree, river channel change degree, and bank stability are mainly selected. Taking macroinvertebrates for example, these indicators are critical to their survival and recovery.
Riparian Zone Index
The width of the riverbank buffer zone in the Shenzhen urban area is insufficient. The vegetation and habitat are relatively simple, and most of them are ecologically fragile zones. Consequently, this item selects habitat complexity, riparian buffer zone width, riparian habitat type, and riparian vegetation diversity to reflect the riparian zone status.
Physical and Chemical Indicators
Based on the characteristics of water pollution in the basin and the authors’ previous studies’ results [26,27], the key physical and chemical indicators of water quality (dissolved oxygen, total nitrogen, ammonia nitrogen, and total phosphorus) affecting the distribution of river aquatic biological communities were selected.
Aquatic Biological Indicators
According to the preliminary analysis results of algae and macrobenthos communities and the related study of biological evaluation indexes [28,29,30,31], three algae indexes (the number of algae taxa, the Shannon–Wiener diversity index of algae, and the Berger–Parker dominance index of algae) and three benthos indexes with prominent indicative significance for river ecological conditions are selected, and the calculation formula is as follows:
The Shannon–Wiener index was adopted for algae and macrobenthos:
whereby H’ is the Shannon–Wiener index; Ni is the density of species i (or genus i); N is the total density of planktonic algae or macroinvertebrates or the density of attached algae cells per unit area in a 1 L water sample of sample point; S is the number of species (or genera).
Algae Berger–Parker dominance:
whereby D is the Berger–Parker dominance index; Nmax is the cell density of the most abundant group; N is the total cell density of all planktonic algae in a 1 L water sample or the total density of living algae per unit area.
The number of EPT taxons of macrobenthos: the sum of the number of family-level taxons of Ephemeroptera, Plecoptera, and Trichoptera (EPT) of macrobenthos.
Oligochaeta proportion: the proportion of Oligochaeta macrobenthos density to the total species density at the sampling point.
For a comprehensive index of algae diversity, three indicators were standardized first, and then the arithmetic mean sum of the three indicators was calculated.
Interference Intensity
Due to the high population density, frequent human activities, large invasive species, and high interference intensity in the region, human interference in rivers needs to be considered emphatically. Two secondary indicators, biological invasion interference and river body interference intensity, are selected for this item.
2.3.3. Determination of Weight
The weights of indicators at all levels of the system are determined by the “Analytic Hierarchy Process” (AHP), which is divided into the following four steps: (a) establish the hierarchical structure of the evaluation indicator system; (b) invite several experts to compare the structural elements in pairs and construct a matrix for each level of indicator elements; (c) calculate the weight value of hierarchy indicators; (d) calculate the maximum characteristic root of the judgment matrix and check the consistency. When the random consistency ratio CR < 0.1, the consistency of the judgment matrix is considered acceptable; otherwise, the judgment matrix should be adjusted until it meets the consistency result of CR < 0.1. The weight value obtained from each judgment matrix is the separation weight value of each level index relative to its upper-level corresponding index. Finally, the average value of each expert’s judgment results is taken as the weight of the criteria layer and the indicator layer. This study closely focuses on river bioremediation objectives, so the highest weight value of 0.32 is given to the criteria layer of aquatic organisms, followed by water quality of 0.24 and interference intensity of 0.20. The weight value of hydrology, morphology, and riparian zone indicators is relatively low.
In order to calculate simply and intuitively, the total evaluation score of the whole indicator system is determined as 100 score, and the indicators at all levels are given different scores according to different weights. The evaluation system has carried out a detailed hierarchical description of each indicator at the indicator level and has specified different evaluation scores for the corresponding description levels. After fine-tuning, 0.25 is the minimum progressive unit (Appendix A). In order to reduce the error and the uncertainty of grading in the assessment, each point is scored twice as a whole, and the average of the highest and lowest scores is taken as the final result.
2.3.4. Assessment Standards
The evaluation results are divided into four grades: “health”, “sub-health”, “poor”, and “extremely poor”. Table 1 shows the health assessment grade and the corresponding ecological degradation degree.

Table 1.
Health Assessment Grade Standards.
3. Results
3.1. Water Quality and Aquatic Organism Community
The water quality of some rivers in Daya Bay and Dapeng Bay reaches Class III–IV, while the water quality of other basins is mainly inferior to Class V, accounting for 86.7% (Table 2). In general, due to various human activities and land use types, the organic pollution of ammonia nitrogen and total phosphorus seriously exceeded the standard.
Table 2.
Water Quality Monitoring Grade and Biological Index of each Watershed in Shenzhen.
Through statistical identification, there are 99 species (genera) of planktonic algae and 92 species (genera) of epiphytic algae in the whole basin (Appendix B and Appendix C). It can be seen from Table 2 that the biodiversity index of algae in the Maozhou River is relatively high, and it varies slightly between other watersheds. There are 53 taxa of macrobenthos in total (Appendix D). The diversity of benthos in each basin is generally low, and there are few clean indicator species. The diversity of the EPT species of the Daya Bay watershed is relatively high. The water bodies of sampling sections in Guanlan River Basin, Longgang River Basin, Pingshan River Basin, and Shenzhen River Basin are mostly Class V and inferior to Class V, with a high proportion of Oligochaeta. The indicator species mainly consisted of Limnodrilus hoffmeisteri, Limnodrilus udekemianus, and Chironomus sp. which indicated eutrophication.
3.2. Results of Water Ecological Health Assessment
3.2.1. Evaluation of Criterion Level
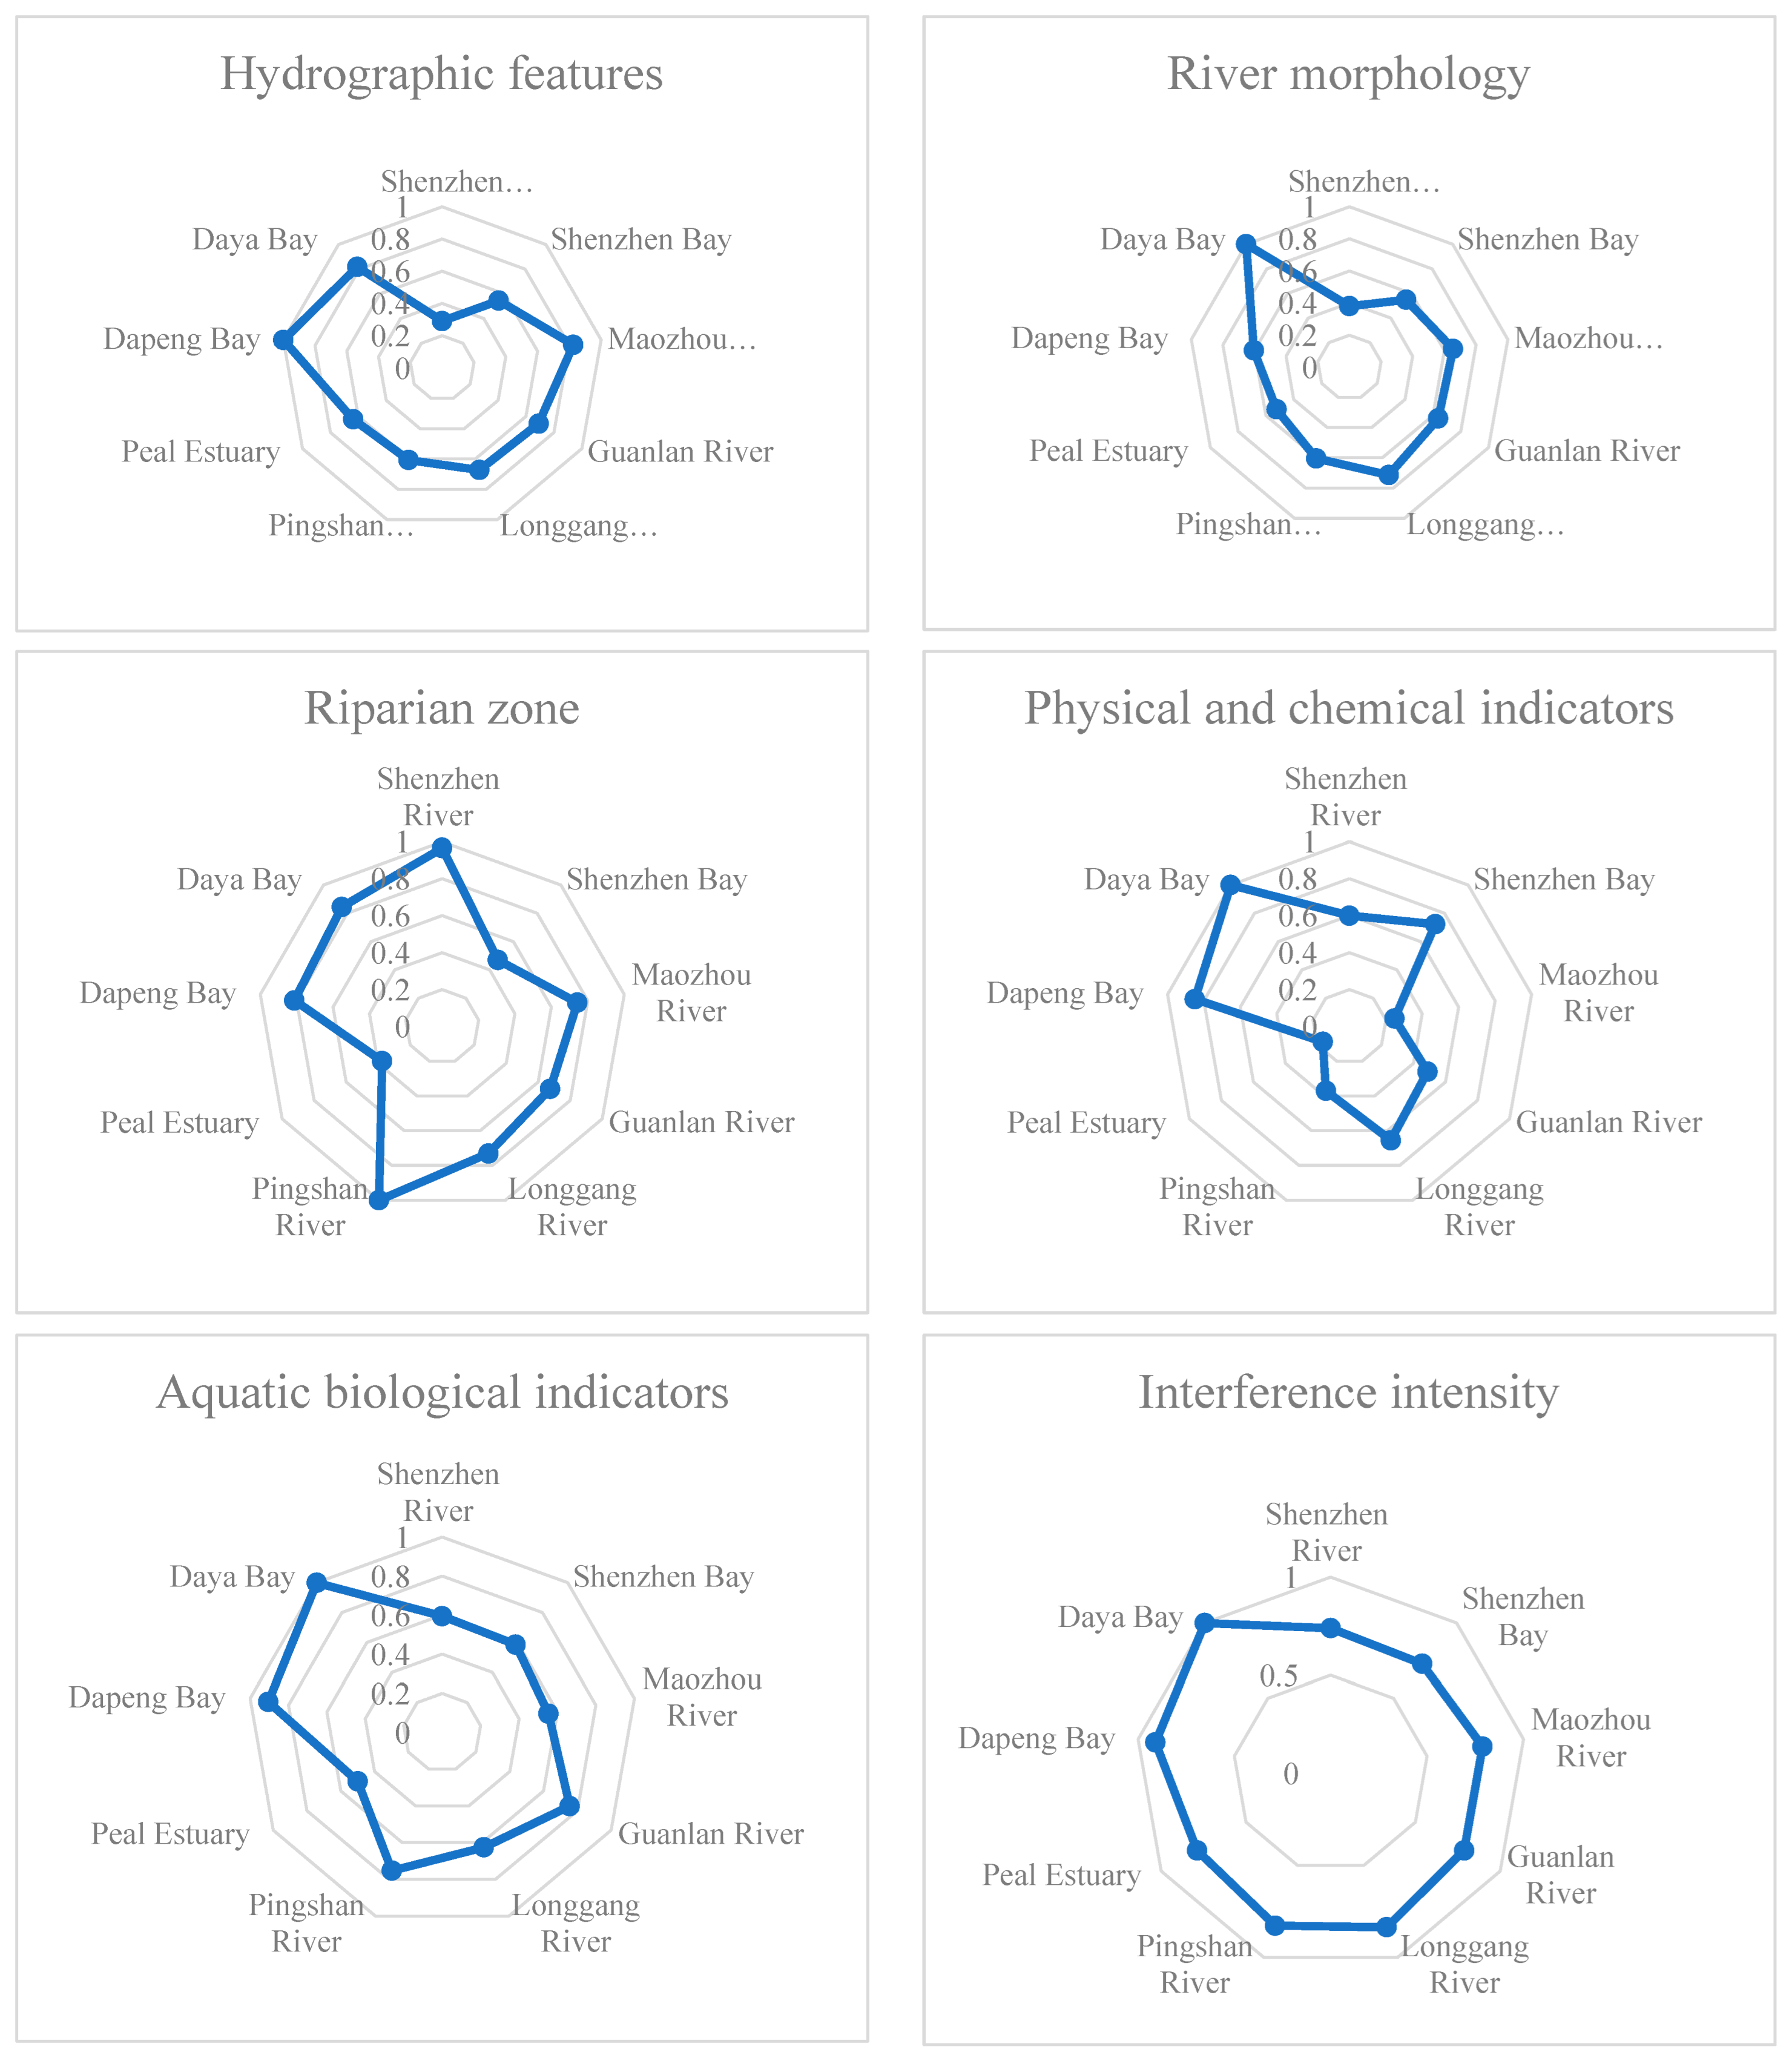
The average value of each criterion level index evaluation score of the nine major basins is normalized to the maximum value, and the analysis results are shown in Figure 2. In general, the assessment results of river hydrology, morphology, aquatic organisms, physical and chemical properties of the water body, and disturbance intensity of Daya Bay and Dapeng Bay basin, both in the east of Shenzhen, are obviously better than those of other basins. Specifically, the normalized scoring range of river hydrological criteria layer indicators is 0.29~1.00, with an average of 0.66. The relative score of the Dapeng Bay basin is the highest, and that of the Shenzhen River basin is the lowest. The normalized score range of the river form criterion layer index is 0.38~1.00, with an average of 0.63. The relative score of the Daya Bay basin is higher, while that of the Shenzhen River basin is the lowest. The normalized score range of the riparian zone criterion layer index is 0.38~1.00, with an average of 0.74. The relative score of the Pingshan River basin is the highest. The relative scores of the Pearl River Estuary and Shenzhen Bay are low. The normalized score range of indicators in the physical and chemical criteria layer of the water body is 0.16~1.00, with an average of 0.57. The relative score of the Daya Bay basin is the highest, the relative score of the Pearl River Estuary and the Maozhou River basin is low, and the water quality is generally poor. The normalized score range of interference intensity criterion level indicators is 0.73~1.00, with an average of 0.82. The relative score of the Daya Bay basin is the highest, the relative scores of Shenzhen Bay and the Shenzhen River Basin are relatively low, and the interference of human activities is relatively strong.
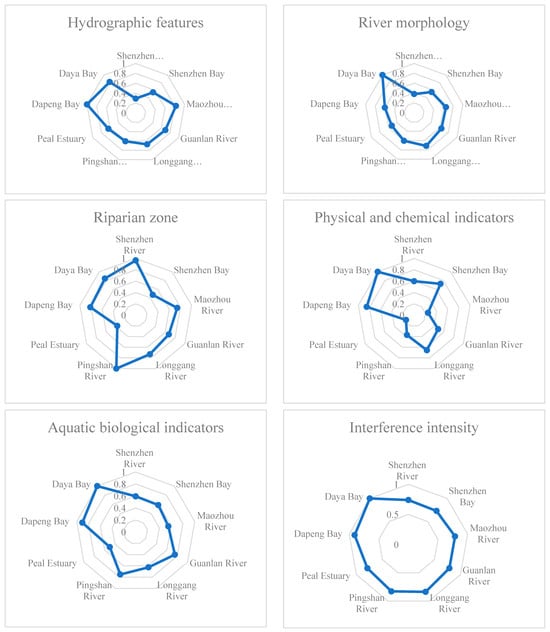
Figure 2.
The health assessment result of criterion level.
The Spearman correlation analysis results are shown in Table 3. The aquatic biological indicators show a significant correlation between the river morphology and the physical-chemical indicators (correlation coefficient 0.667 and 0.730, respectively); as well as a strong correlation with interference intensity (correlation coefficient 0.863). In addition, river hydrology and river morphology show a significant correlation with the disturbance intensity, with correlation coefficients of 0.678 and 0.827. The organic pollution degree of water quality, sediment condition, and human activity interference have a strong impact on aquatic organisms.
Table 3.
Correlation Analysis Results of Criteria Level Indicators.
3.2.2. Comprehensive Evaluation Results
The overall evaluation results show that there is only one sample point of “health” level and six sample points of “sub-health”, accounting for 15% of the total sample points. There are twenty-four “poor” sampling points, accounting for 51%. The number of “extremely poor” samples is sixteen, accounting for 34% (Figure 3). From the perspective of spatial distribution, the water ecological status of the Daya Bay basin is good, which is at the level of “health sub-health”. Dapeng Bay basin is rated as “sub-health poor”, while the Guanlan River basin, Maozhou River basin, Shenzhen Bay basin, Pingshan River basin, and most sites of the Longgang River basin are in the “poor very poor” level, and the Pearl River Estuary basin is classified as “extremely poor”.
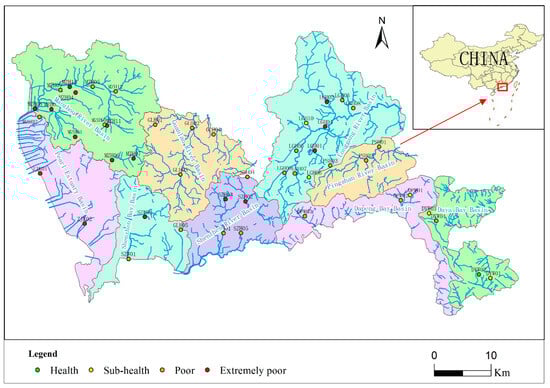
Figure 3.
Evaluation grade of river ecological health in Shenzhen.
4. Discussion
4.1. Heterogeneity Analysis of River Ecological Health
The assessment results indicated that the Dapeng Bay and Daya Bay basins in the east of Shenzhen are relatively less disturbed by human activities, and the health status of the aquatic ecosystem is generally good. Rivers in the central and western basins are greatly disturbed by human activities, and the health of water ecosystems is poor (Figure 3). The above conclusions are consistent with the relevant research results of typical river ecosystem health in Shenzhen [32,33].
The evaluation results of each criteria layer are basically consistent with the overall evaluation results, and the indicators of different criteria layers affect each other (Table 3 and Figure 2). It can be seen that all media in the river ecosystem, especially the aquatic community’s status in the river, are affected by human activities to varying degrees, which needs to be widely concerned. Among them, the aquatic biological indicators in the central and western basins scored significantly lower. On the one hand, the indicators of aquatic organisms are not only affected by the water quality, but also restricted by the living space. For example, the small discharge, low flow rate, and small water area of the tributaries in the Maozhou River are very unfavorable for the survival of aquatic organisms. On the other hand, comprehensive restoration projects have been carried out in many river sections, such as river channel reconstruction, riverbank flood control, sludge removal, introduction of external water bodies, and other measures. These measures have improved water quality, but the complexity of biological habitats has not been taken into account, so the coverage rate of aquatic vegetation is low, the niche is single, the riverbed and bank slope are gradually hardened, and the exchange of water and soil nutrients is cut off. The aquatic habitat of the river has been damaged, resulting in the inability to restore the aquatic community in a short time. Third, even though ecological restoration measures have been taken for some river sections, the physical habitat is good from the perspective of habitat, including bank slope shaping, ecological island construction, greenway construction, and other restoration measures. However, the water quality has slightly improved but has been in a very poor state for a long time. It is difficult to achieve the effect of water ecological restoration in the short term, the aquatic organisms are single, and the biological integrity is extremely low.
The evaluation score of the riparian zone in the Pearl River Estuary and Shenzhen Bay coastal basins is relatively low, mainly because the lower reaches of the basin are greatly affected by tides, the inverted seawater has seriously damaged the river habitat, and the riparian zone is in poor condition [34].
4.2. Correlation between Water Environment Quality and Water Ecological Health
Comparing the results of the aquatic biological assessment and physical and chemical assessment of the water body, it is found that the physical and chemical state of the water body cannot fully reflect the integrity and health of the water ecosystem. In this investigation, it was found that the water quality of some water sample points in the Longgang River basin reached Level III standards, but the river channel was seriously channelized, the sediment type was single, the aquatic biodiversity was low, the density and biomass were low, and there were fewer indicative species. The water quality reached the standard, but the aquatic ecosystem was in poor condition. The degradation of physical habitat conditions may be an important reason that may potentially affect the degradation of aquatic communities, which should be paid attention. Achnanthes exigua and Achnanthes bisolettiana are clean indicator species, indicating good water mobility; Stigsocllonium sp., Schizothrix sp., Microcystis sp., Scenedesmus sp., etc., mostly appear in eutrophic water bodies, indicating organic pollution. However, most algae can widely exist in all kinds of water bodies, and their indicative nature is not as clear as that of benthic indicator species for water quality.
4.3. Bioremediation Suggestions
In the 1980s, the river continuum concept (RCC) was a framework describing the gradually changing gradient of physical characteristics and the resulting communities’ responses from headwaters to river mouth in natural water [35]. The RCC considers a river system in its entirety; it considers the system not only as a geographical continuum but also as a continuum linking function and ecological process. Our assessment result showed that urbanization disrupted river continuity, and the macroinvertebrate’s integrity was destroyed, especially in the middle reaches and river mouth water (Table 2 and Figure 3).
How to enhance the diversity and integrity of organisms in urban cities? Following the concept of a “nature-based solution” is an important theoretical basis for river ecosystem restoration and protection [36,37]. At present, the stage of non-biological restoration of the urban river water ecosystem in the Guangdong-Hong Kong-Macao Greater Bay Area has basically ended, and the use of various biological restoration technologies to carry out river water ecological restoration has become the mainstream trend [38]. Aquatic plants play an important role in maintaining the function of river ecosystem and aquatic biodiversity [39]. For one thing, the stems and leaves of submerged or emergent plants can effectively absorb heavy metals, persistent organic substances, antibiotics, and other emerging pollutants on suspended solids particles, so as to improve water transparency and water quality [40,41]. For another, they can increase the habitat area of aquatic organisms in the vertical direction and stabilize the sediment, and provide habitat and refuge for climbing and camp burrowing benthos [42]. In the limited urban river space, the ecological function can be maintained and improved to the maximum extent through the reconstruction of aquatic plant communities or small wetlands [43]. Aquatic plants, benthos, and microorganisms can synergistically degrade nutrients and organic matter in sediments, and improve the self-purification capacity of urban rivers [44]. The morphological complexity of aquatic macrophytes is positively related to the richness and diversity of macrobenthos community structure. Therefore, increasing the morphological complexity of aquatic plants can become one of the strategies for river ecosystem restoration [45].
5. Conclusions
- A comprehensive survey of the river ecosystem in Shenzhen was carried out by setting up 47 sampling points. The results show that the proportion of heavily polluted water body sections was extremely high, with 39 sampling points inferior to Class V water quality, accounting for 86.7%. There are 99 species (genera) of planktonic algae, 92 species (genera) of epiphytic algae, and 53 taxa of macrobenthos in the whole river basin.
- The river ecosystem health assessment in Shenzhen showed that there was one sample point of “health” level and six “sub-health” sample points, accounting for 15%. A total of forty “poor” and “extremely poor” were sample points, accounting for 85%. In general, except for the Dapeng Bay and Daya Bay basins in the east, the water ecosystems in other basins are seriously degraded, and it is urgent to improve ecological functions and restore aquatic communities.
- The integrity of the water ecosystem of the Shenzhen River is seriously damaged, and the water ecosystem management system needs to be improved and strengthened. It is suggested to vigorously carry out the urban river water ecological restoration technology and strengthen the application of bioremediation technology with the goal of restoring aquatic communities.
- It is crucial to adopt the importance of shared international policy protocols (e.g., WFD) for investigating the state of river ecosystems. As future scope for research, long-term monitoring to evaluate the influence of urbanization on river ecological health is necessary. Additionally, more biological indicators (e.g., fish or macroaquatic plants) could be possible assessment indicators.
Author Contributions
Conceptualization, L.F. and F.S.; methodology, L.F.; software, L.F.; validation, X.D. and F.S.; formal analysis, L.F.; investigation, H.S. and T.Z.; resources, L.F. and F.S.; data curation L.F.; writing—original draft preparation, L.F.; writing—review and editing, F.S.; visualization, L.F.; supervision, F.S.; project administration, F.S.; funding acquisition, L.F. All authors have read and agreed to the published version of the manuscript.
Funding
This research was funded by the Fundamental Research Funds for the Central Universities grant number 3012200028 awarded to Lan Fu.
Data Availability Statement
The data that support the findings of this study are available from the corresponding author upon reasonable request.
Acknowledgments
The authors also thank the anonymous reviewers for their helpful comments and suggestions.
Conflicts of Interest
The authors declare that they have no known competing financial interests or personal relationships that could have appeared to influence the work reported in this paper.
Appendix A
Table A1.
River ecosystem health assessment system of Shenzhen.
Table A1.
River ecosystem health assessment system of Shenzhen.
| Criterion Layer (Weight) | Indicator Layer (Weight) | Evaluation Description | Score |
|---|---|---|---|
| Hydrographic features (0.05) | Flow rate and depth (0.030) | There are three or more type cases: “slow deep”, “slow shallow”, “fast deep”, and “fast shallow” | 3 |
| There are only two cases | 2 | ||
| There is only one case | 1 | ||
| Almost no flow rate | 0 | ||
| Water volume (0.020) | The water volume is large, and the river submerges about 75% of the riverbank | 2 | |
| The water volume is relatively large, and the river submerges about 50% of the riverbank | 1.5 | ||
| The water volume is average, and the river submerges 25–50% of the riverbank | 1 | ||
| The water is small and the river is dry | 0.5 | ||
| River morphology (0.07) | Substratum (0.041) | More than 50% are gravels, cobbles, boulders, and the rest are fine sand and other sediments | 3 |
| 30–50% are gravels, cobbles and boulders, and the rest are fine sand and other sediments | 2 | ||
| 10–30% are gravels, cobbles, boulders, and the rest are fine sand and other sediments | 1 | ||
| Fine sand or hard substrate | 0 | ||
| Channel curvature (0.003) | The number of significant river bends in the field of vision ≥3 | 1 | |
| The number of significant river bends in the field of vision is 2 | 0.75 | ||
| The number of significant river bends in the field of vision is 1 | 0.5 | ||
| The river course is straight | 0.25 | ||
| Channel change degree (0.013) | Channelization does not occur or rarely occurs, and the river channel maintains normal mode | 2 | |
| There is less channelization, usually around the pier, which has little impact on aquatic organisms | 1.5 | ||
| The channelization is relatively extensive. Embankments or bridge pillars appear on both banks, which has an impact on aquatic organisms | 1 | ||
| Three sides hardened channel | 0.25 | ||
| Bank stability (0.013) | The riverbank is stable, with erosion in a few areas (<25%) | 1 | |
| The riverbank is relatively unstable and moderately eroded (25~50%) | 0.75 | ||
| The riverbank is unstable, with serious erosion (50~75%), and there is risk of flood | 0.5 | ||
| The riverbank is extremely unstable, and most areas are eroded (>75%) | 0.25 | ||
| Riparian zone (0.12) | Habitat complexity (0.030) | There are aquatic vegetation, pools, sunken embankments, boulders, and other small habitats | 3 |
| The above 2–3 niches | 2 | ||
| The above 1–2 niches | 1 | ||
| Single river habitat without change | 0 | ||
| Width of riparian buffer zone (0.030) | >20 m | 3 | |
| 10–20 m | 2 | ||
| 5–10 m | 1 | ||
| <5 m | 0 | ||
| Land use type around riparian zone (0.030) | Forest, wetland, or park green space | 3 | |
| farmland | 2 | ||
| Municipal roads | 1 | ||
| Residential areas or factories | 0 | ||
| Vegetation of riparian zone (0.030) | More than 50% of embankments are covered with vegetation | 3 | |
| 50~25% of the embankment is covered with vegetation | 2 | ||
| Below 25% of the embankment is covered with vegetation | 1 | ||
| There is hardly any vegetation around the riverbank | 0 | ||
| Physical and chemical indicators (0.24) | Dissolved oxygen (0.060) | >6 | 6 |
| 5–6 | 4 | ||
| 4–5 | 2 | ||
| <4 | 0 | ||
| Total nitrogen (0.060) | <0.1 | 6 | |
| 0.1–0.2 | 4 | ||
| 0.2–0.3 | 2 | ||
| >0.3 | 0 | ||
| Ammonia nitrogen (0.060) | <0.5 | 6 | |
| 0.5–1 | 4 | ||
| 1–1.5 | 2 | ||
| >1.5 | 0 | ||
| Total phosphorus (0.060) | <0.1 | 6 | |
| 0.1–0.2 | 4 | ||
| 0.2–0.3 | 2 | ||
| >0.3 | 0 | ||
| Aquatic biological indicators (0.32) | Algae diversity index (0.096) | 0.75–1 | 10 |
| 0.5~0.75 | 7 | ||
| 0.25~0.5 | 4 | ||
| <0.25 | 1 | ||
| Shannon Wiener diversity index of macrobenthos (0.064) | >3 | 6 | |
| 2–3 | 4 | ||
| 1–2 | 2 | ||
| <1 | 0 | ||
| Number of EPT classification units (0.080) | >4 | 8 | |
| 3–4 | 5 | ||
| 1-2 | 3 | ||
| No EPT type | 1 | ||
| Proportion of Oligochaeta (0.080) | <10% | 8 | |
| 10–30% | 5 | ||
| 30–50% | 3 | ||
| >50% | 1 | ||
| Interference intensity (0.20) | Biological invasion interference (0.080) | No invasive organisms | 7 |
| The coverage area of invasive species in river channel and riparian zone is about 0~30% | 5 | ||
| The coverage area of invasive species in river channel and riparian zone is about 30–60% | 3 | ||
| The coverage area of invasive species in river and riparian zone exceeds 60% | 1 | ||
| River interference intensity (0.120) | No obvious human interference | 7 | |
| Play with water, fishing, boating, etc. | 5 | ||
| Garbage, sewage outlet, or shipping channel | 3 | ||
| River dredging or river sand mining | 1 |
Appendix B
Table A2.
List of planktonic algae in the study sites.
Table A2.
List of planktonic algae in the study sites.
| Phylum | Taxa | Phylum | Taxa | Phylum | Taxa |
|---|---|---|---|---|---|
| Cyanophyta | Pseudoanabaena sp. | Chlorophyta | Coelastrum sp. | Bacillariophyta | Navicula graciloides |
| Microcystis sp. | Westella sp. | Navicula dicephala | |||
| Spirulina sp. | Closterium sp. | Navicula verecunda | |||
| Oscillatoria sp. | Chlamydomonas sp. | Cymbella ventricosa | |||
| Anabeana sp. | Polyedriopsis sp. | Cymbella delicatula | |||
| Chroococcus sp. | Selenastrum sp. | Gomphonema sp. | |||
| Sanvageau sp. | Pandorina sp. | Gomphonema parvulum | |||
| Aphanothece sp. | Actinastrum | Pinnularia interrupte | |||
| Gomphosphaeria sp. | Eudorina sp. | Achnanthes sp. | |||
| Merismopedia sp. | Coelastrum reticulatum | Achnanthes exigua | |||
| Raphidiopsis sp. | Micractinium sp. | Achnanthes biasolettiana | |||
| Phormidium sp. | Schroederia nitzschioides | Nitzschia palea | |||
| Aphanizomenon sp. | Chodatella quadriseta | Nitzschia stagnorum | |||
| Chlorophyta | Scenedesmus quadricauda | Crucigenia tetrapedia | Nitzschia sigmoidea | ||
| Scenedesmus dimorphus | Crucigenia quadrata | Surirella robusta | |||
| Scenedesmus armatus | Crucigenia apiculata | Pyrrophyta | Glenodinium gymnodinium | ||
| Scenedesmus denticulatus | Tetraedron minimum | Cryptophyta | Komma caudata | ||
| Scenedesmus arcuatus | Tetraedron caudatum | Cryptomonas obovata | |||
| Scenedesmus ecornis | Tetraedron trilobulatum | Cryptomonas erosa | |||
| Pediastrum tetras | Dictyosphaerium ehrenbergianum | Cryptomonas marssonii | |||
| Dicloster acuatus | Bacillariophyta | Cyclotella sp. | Campylomonas reflexa | ||
| Ulothrix sp. | Tabellaria fenestrata | Aphanocapsa sp. | |||
| Kirchneriella sp. | Melosira granulata | Euglenophyta | Trachelomonas sp. | ||
| Kirchneriellacontorta | Melosira granulata var. angustissima | Trachelomonas allia | |||
| Ankistrodesmus falcatus | Melosira varians | Phacus acuminatus | |||
| Ankistrodesmus spiralis | Cocconeis placentula | Phacus granum | |||
| Gomphosphaeria sp. | Diatoma vulgare | Euglena deses | |||
| Oocystis sp. | Fragilaria brevistriata | Euglena acus | |||
| Golenkinia sp. | Synedra acus | Euglena viridis | |||
| Schroederia setigera | Synedra ulna | Lepocinclis sp. | |||
| Nephrocytium agardhianum | Gyrosigma sp. | Chrysophyta | Dinobryon sp. | ||
| Chlorella sp. | Cymatopleura sp. | Kephyrion littorale | |||
| Cosmarium bioculatum | Stauroneis anceps | Xanthophyceae | Gonyostomun sp. |
Appendix C
Table A3.
List of epiphytic algae in the study sites.
Table A3.
List of epiphytic algae in the study sites.
| Phylum | Taxa | Phylum | Taxa | Phylum | Taxa |
|---|---|---|---|---|---|
| Cyanophyta | Pseudoanabaena sp. | Chlorophyta | Closterium acerosum | Bacillariophyta | Cymbella parva |
| Spirulina sp. | Characium sp. | Cymbella delicatula | |||
| Anabeana sp. | Stigsoclonium sp. | Gomphonema sp. | |||
| Microcystis sp. | Hyalotheca dissiliens | Gomphonema angustatum | |||
| Schizothrix sp. | Hyalotheca swartzii | Gomphonema parvulum | |||
| Lyngbya sp. | Actinotaenium sp. | Gomphonema parvulum | |||
| Leptoiyngbya sp. | Gonatozygon sp. | Gomphonema gracile | |||
| Lyngbya perelegans | Bacillariophyta | Cyclotella sp. | Gomphonema intricatum | ||
| Calothrir sp. | Tabellaria flocculosa | Gomphonema abbreviatum | |||
| Phormidium sp. | Melosira granulata | Gomphonema olivaceum | |||
| Chlorophyta | Scenedesmus quadricauda | Melosira granulata var. angustissima f. spiralis | Pinnularia nobilis | ||
| Scenedesmus dimorphus | Melosira varians | Pinnularia microstauron | |||
| Scenedesmus obliquus | Cocconeis placentula | Pinnularia interrupte | |||
| Scenedesmus denticulatus | Diatoma vulgare | Achnanthes sp. | |||
| Scenedesmus perforatus | Fragilaria capucina | Achnanthes linearis | |||
| Spirogyra sp. | Fragilaria brevistriata | Achnanthes biasolettiana | |||
| Ulothrix zonata | Synedra amphicephala | Achnanthes exigua | |||
| Ulothrix variabilis | Synedra ulna | Nitzschia palea | |||
| Mougeotia sp. | Synedra ulna var.biceps | Nitzschia stagnorum | |||
| Ankistrodesmus falcatus | Gyrosigma sp. | Nitzschia linearis | |||
| Ankistrodesmus spiralis | Cymatopleura ellptice | Nitzschia amphibia | |||
| Schizomeris sp. | Cymatopleura solea | Nitzschia sigmoidea | |||
| Gongrosira sp. | Navicula viridula | Surirella linearis | |||
| Sphaerocystis schroetri | Navicula graciloides | Surirella robusta | |||
| Schroederia setigera | Navicula dicephala | Diploneis purlla | |||
| Crucigenia quadrata | Navicula verecunda | Hantzschia amphioxys | |||
| Klebsormidium scopulinum | Navicula oblonga | Coscinodiscus lacustris | |||
| Klebsormidium fluitans | Navicula pupula | Eunotia arcus | |||
| Chlamydomonas braunii | Cymbella sp. | Pyrrophyta | Cryptomonas obovata | ||
| Chlamydomonas globosa | Cymbella perpusilla | Euglenophyta | Euglena viridis | ||
| Golenkinia sp. | Cymbella ventricosa |
Appendix D
Table A4.
List of macroinvertebrtes in the study sites.
Table A4.
List of macroinvertebrtes in the study sites.
| Phylum | Class | Family | Taxa |
|---|---|---|---|
| Annelida | Oligochaeta | Tubificidae | Branchiura sowerbyi |
| Spirosperma nikolskyi | |||
| Limnodrilus hoffmeisteri | |||
| Limnodrilus claparedeianus | |||
| Limnodrilus udekemianus | |||
| Aulodrilus limnobius | |||
| Aulodrilus pluriseta | |||
| Naididae | Nais variabilis | ||
| Nephtyidae | Nephtys oligobranchia | ||
| Hirudinea | Glossiphoniidae | Glossiphonia complanata | |
| Erpobdellidae | Erpobdella octoculata | ||
| Hirudinidae | Hirudo nipponia | ||
| Whitmania pigra | |||
| Mollusca | Gastropoda | Hydrobiidae | Oncomelania hupensis |
| Aillpullaridae | Pomacea canaliculata | ||
| Viviparidae | Bellamya purificata | ||
| Bellamya aeruginosa | |||
| Planorbidae | Gyraulus convexiusulus | ||
| Hippeutis umbilicalis | |||
| Melaniidae | Simisulcospira cancellata | ||
| Physidae | Physa foncinalis | ||
| Physa acuta | |||
| Lymnaeidae | Radix ovata | ||
| Radix swinhoei | |||
| Neritidae | Nerita yoldi | ||
| Bivalvia | Corbiculidae | Corbicula fluminea | |
| Arthropoda | Crustacea | Palaemonidae | Palaemonetes sinensis |
| Macrobrachium sp. | |||
| Macrobrachium nipponense | |||
| Atyoidae | Neocaridina denticulata | ||
| Gammaridae | Gammarus sp. | ||
| Insecta | Ephemeroptera | Baetidae | Baetis sp. |
| Trichoptera | Hydropsychidae | Hydropsyche sp. | |
| Polycentropidae | Neureclipsis sp. | ||
| Rhyacophilidae | Rhyacophilia sp. | ||
| Leptoceridae | Leptocerus sp. | ||
| Odonata | Libellulidae | Aeschna | |
| Coenagrionidae | Agriocnemis femina | ||
| Corduliidae | Epitheca marginata | ||
| Comphidae | Comphidae sp. | ||
| Coleoptera | Elmididae | Elmididae sp. | |
| Megalogtera | Corydalidae | Neochauliodes sp. | |
| Diptera | Tipulidae | Antocha sp. | |
| Chironominae | Polypedilum sp. | ||
| Chironomus sp. | |||
| Orthoclade | Orthocladius sp. | ||
| Cricotopus sp. | |||
| Eukiefferiella sp. | |||
| Parakiefferilla sp. | |||
| Tanypodinae | Tanypus sp. | ||
| Paramerina cingulata | |||
| Arctopelopia sp. | |||
| Ceratopogonidae | Psychoda sp. |
References
- Sun, R.H.; Wei, L.R.; Zhang, H.P.; Chen, L.D. Current study and prospect of the river ecosystem health research- based on bibliometric research. Acta Ecol. Sin. 2020, 40, 3526–3536. [Google Scholar]
- Wang, Q.; Pang, X.; Wang, Z.J.; Yuan, X.Z.; Zhang, Y.G. Advances in research on the influence of urbanization on stream benthic macroinvertebrate communities. Acta Ecol. Sin. 2017, 37, 6275–6288. [Google Scholar]
- LIU, Q.; JIANG, Y.; Tian, Y.L.; Hou, Z.J.; He, K.J.; Fu, L.; Xu, H. Impact of land use on the DOM composition in different seasons in a subtropical river flowing through a region undergoing rapid urbanization. J. Clean. Prod. 2019, 212, 1224–1231. [Google Scholar] [CrossRef]
- Wang, Z.H.; Zhang, S.; Peng, Y.R.; Wu, C.H.; Lv, Y.P.; Xiao, K.X.; Zhao, J.; Qian, G.R. Impact of rapid urbanization on the threshold effect in the relationship between impervious surfaces and water quality in shanghai, China. Environ. Pollut. 2020, 267, 115569. [Google Scholar] [CrossRef]
- Lin, Q.Y.; Zhang, Y.X.; Marrs, R.; Sekar, R.; Luo, X.; Wu, N.C. Evaluating ecosystem functioning following river restoration: The role of hydromorphology, bacteria, and macroinvertebrates. Sci. Total Environ. 2020, 743, 140583. [Google Scholar] [CrossRef]
- Mohanavelu, A.; Shrivastava, S.; Naganna, S.R. Streambed pollution: A comprehensive review of its sources, eco-hydro-geo-chemical impacts, assessment, and mitigation strategies. Chemosphere 2022, 300, 134589. [Google Scholar] [CrossRef]
- Smith, M.J.; Kay, W.R.; Edward, D.H.D.; Papas, P.J.; Richardson, K.S.T.J.; Simpom, J.C.; Pinder, A.M.; Cale, D.J.; Horitz, P.H.J.; Davis, J.A. AusRivAS: Using macroinvertebrates to assess ecological condition of rivers in Western Australia. Freshw. Biol. 1999, 41, 269–282. [Google Scholar] [CrossRef]
- Wright, J.F.; Sutcliffe, D.W.; Furse, M.T. Assessing the Biological Quality of Fresh Waters: RIVPACS and Other Techniques; The Freshwater Biological Association: Ambleside, UK, 2000. [Google Scholar]
- Barbour, M.T.; Gerritsen, J.; Snyder, B.D.; Stribling, J.B. Rapid Bioassessment Protocols for Use in Streams and Wadeable Rivers: Periphyton, Benthic Macroinvertebrates and Fish, 2nd ed.; U.S. EPA, Office of Water: Washington, DC, USA, 1999.
- European Commission. Directive 2000/60/EC of the European Parliament and of the Council of 23 October 2000 Establishing Aframework for Community Action in the Field of Water Policy; European Commission: Brussels, Belgium, 2000. [Google Scholar]
- Voulvoulis, N.; Arpon, K.D.; Giakoumis, T.; Giakoumis, T. The EU water framework directive: From great expectations to problem with implementation. Sci. Total Environ. 2017, 575, 358–366. [Google Scholar] [CrossRef]
- Kim, S.; Lee, S.W.; Park, S.R.; Shin, Y.; An, K. Socioeconomic risks and their impacts on ecological river health in south korea: An application of the analytic hierarchy process. Sustainability 2021, 13, 6287. [Google Scholar] [CrossRef]
- Bao, Y.L.; Tian, B.; Zhang, Y.; Qu, K.Y.; Qian, J.P. River health assessment in Xiong’an New Area. Acta Ecol. Sin. 2021, 41, 5988–5997. [Google Scholar]
- El-Anwar, E.A.; Salman, S.A.; Asmoay, A.; Ahmed, E. Geochemical, mineralogical and pollution assessment of River Nile sediments at Assiut Governorate, Egypt. J. Afr. Earth Sci. 2021, 180, 104227. [Google Scholar] [CrossRef]
- Xu, F.; Wang, Y.G.; Wang, X.; Wu, D.Y.; Wang, Y.Y. Establishment and Application of the Assessment System on Ecosystem Health for Restored Urban Rivers in North China. Int. J. Environ. Res. Public Health 2022, 19, 5619. [Google Scholar] [CrossRef] [PubMed]
- Su, X.Y.; Wang, Y.D.; Xiong, X.Y.; Cheng, C.Y.; Du, Y.C. Study on the variation and influence factors on river water quality in Shenzhen over the last forty years. Environ. Sci. Technol. 2021, 44, 259–263. [Google Scholar]
- Gao, W.Q.; Lu, Y.; Qu, X.; Liu, H.; Xin, W.; Yu, W.J.; Zhou, W.Q.; Wang, W.M.; Chen, Y.S. River habitat assessment under urbanization: A case study in Shenzhen. Acta Ecol. Sin. 2021, 41, 8783–8793. [Google Scholar]
- Technical Code for Freshwater Biological Resources Survey (DB43/T 432-2009), China. 2009. Available online: https://max.book118.com/html/2020/0620/5102313021002310.shtm, (accessed on 1 November 2023).
- Hu, H.J.; Wei, Y.X. Freshwater Algae in China: System, Ecology and Classification; Science Press: Beijing, China, 2006. [Google Scholar]
- Editorial Board of Aquatic Biological Monitoring Manual of the State Environmental Protection Administration. Aquatic Biological Monitoring Manual; Southeast University Press: Nanjing, China, 1993. [Google Scholar]
- Thorp, J.H.; Covich, A.P. Ecology and Classification of North American Freshwater Invertebrates; Academic Press: New York, NY, USA, 2009. [Google Scholar]
- Morse, J.C.; Yang, L.F.; Tian, L.X. ; Aquatic Insects of China Useful for Monitoring Water Quality; Hohai University Press: Nanjing, China, 1994. [Google Scholar]
- Wen, K.J.; Ma, J.; Wu, L.P.; He, Y.J.; Jiang, X.F. Establishment of an urban river ecological health evaluation system. Water Resour. Prot. 2008, 24, 50–52+60. [Google Scholar]
- Zhang, C. Study on Construction and Assessment of Health River Index System of Chongqiong. Master’s Thesis, Chongqing Jiaotong University, Chongqing, China, 2012. [Google Scholar]
- Wang, Y.; Zhao, S.; Sun, M.D.; Lv, X.B.; Cai, W.Q.; Xu, X.Q.; Ge, H.X.; Lei, K. Assessment of river ecosystem health in Tianjin City, China: Index of ecological integrity and water comprehensive pollution approach. Front. Earth Sci. 2021, 15, 936–946. [Google Scholar] [CrossRef]
- Fu, L.; Jiang, Y.; Ding, J.; Liu, Q.; Peng, Q.Z.; Kang, M.Y. Impacts of Land Use and Environmental Factors on Macroinvertebrate Functional Feeding Groups in the Dongjiang River Basin, Southeast China. J. Freshw. Ecol. 2016, 31, 21–35. [Google Scholar] [CrossRef]
- Fu, L.; Jiang, Y.; Ding, J.; Liu, Q.; Peng, Q.Z.; Kang, M.Y.; Wang, L.Z. Spatial variation of macroinvertebrate community structure and associated environmental conditions in a subtropical river system of south-eastern China. Knowl. Manag. Aquat. Ecosyst. 2015, 416, 2015013. [Google Scholar]
- Wang, B.X.; Yang, L.F. Bioassessment of Qinhuai River using a river biological index. Acta Ecol. Sin. 2003, 23, 2082–2091. [Google Scholar]
- Zhou, S.B.; Yuan, X.Z.; Liu, H.; Zhang, Y.W.; Ren, H.Q. River health assessment based on different biological indicators: A review. Chin. J. Ecol. 2013, 32, 2211–2219. [Google Scholar]
- Fu, L.; Jiang, Y.; Liu, Q.; Hou, Z.J. Eco-health assessment of Dongjiang RiverBasin based on index of biotic integrity (B-IBI) of macroinvertebrates. Ecol. Environ. Sci. 2018, 27, 1502–1511. [Google Scholar]
- Liu, Y.Y.; Ayi, Q.L.; Zhang, S.R.; Wu, X.R.; Wan, B.N.; Zhang, X.P.; Zeng, B. Comparative study on the suitability of periphytic algae and phytoplankton in river health assessment. Acta Ecol. Sin. 2020, 40, 3833–3843. [Google Scholar]
- Zhang, Y.; Zheng, B.H.; Liu, H.L.; Wang, X.Q. Health indicators and assessment of typical river ecosystems in Shenzhen. Water Resour. Prot. 2006, 5, 13–17. [Google Scholar]
- He, J.Y.; Wen, Z.P. Analysis of Water Environment Problems in Shenzhen Rivers and Discussion on Countermeasures. Environ. Prot. 2009, 6, 53–55. [Google Scholar]
- Chen, J.; Wu, J.C.; Song, L.X.; Li, B.; Ji, D.B.; Ran, Z.; He, J.Y.; Xu, Y.; Shi, H.Y.; Li, H. Health Assessment of River Ecosystem in the Shenzhen Maozhou River. J. Chin. Three Gorges Univ. (Nat. Sci.) 2021, 43, 1–5+64. [Google Scholar]
- Vannote, R.L.; Minshall, G.W.; Cummins, K.W.; Sedell, J.R.; Cushing, C.E. The river continuum concept. Can. J. Fish Aquat. Sci. 1980, 37, 130–137. [Google Scholar] [CrossRef]
- Wang, W.J. Research Progress of River Restoration Research at Home and Abroad. J. Hydroecology 2012, 33, 142–146. [Google Scholar]
- Mazur, K. River Re-naturalization—A Nature-based Solution for Climate Change in Urban Areas. IOP Conf. Ser. Mater. Sci. Eng. 2021, 1203, 022044. [Google Scholar] [CrossRef]
- Zhao, L.L.; Xia, J.; Yang, F.; Yang, L.; Xu, F. Current situation, framework, problems and prospect of water ecological restoration in Guangdong-Hong Kong-Macao Greater Bay Area. Acta Ecol. Sin. 2021, 41, 5054–5065. [Google Scholar]
- Warfe, D.M.; Barmuta, L.A. Habitat structural complexity mediates the foraging success of multiple predator species. Oecologia 2004, 141, 171–178. [Google Scholar] [CrossRef]
- Favas, P.J.C.; Pratas, J.; Rodrigues, N.; D’Souza, R.; Varun, M.; Paul, M.S. Metal (loid) accumulation in aquatic plants of a mining area: Potential for water quality biomonitoring and biogeochemical prospecting. Chemosphere 2018, 194, 158–170. [Google Scholar] [CrossRef] [PubMed]
- Xiao, H.; Jia, J.; Chu, Q.; Liu, L. Effect of river ecological restoration by symbiotic system of aquatic plants. IOP Conf. Ser. Earth Environ. Sci. 2021, 621, 012086. [Google Scholar] [CrossRef]
- Walker, P.D.; Wijnhoven, S.; Van, D.V.G. Macrophyte presence and growth form influence macroinvertebrate community structure. Aquat. Bot. 2021, 104, 80–87. [Google Scholar] [CrossRef]
- Ecke, F.; Hellsten, S.; Jan, K.; Armin, W.L.; Jaana, R.; Sabine, S.; Joel, S.; Annette, B. The response of hydrophyte growth forms and plant strategies to river restoration. Hydrobiologia 2016, 769, 41–54. [Google Scholar] [CrossRef]
- Fritz, K.M.; Feminella, J.W. Substratum stability associated with the riverine macrophyte Justicia americana. Freshw. Biol. 2003, 48, 1630–1639. [Google Scholar] [CrossRef]
- do Nascimento Filho, S.L.; Gama, W.A.; Ariadne, D.N.M. Effect of the structural complexity of aquatic macrophytes on epiphytic algal, macroinvertebrates, and their interspecific relationships. Aquat. Sci. 2021, 83, 57. [Google Scholar] [CrossRef]
Disclaimer/Publisher’s Note: The statements, opinions and data contained in all publications are solely those of the individual author(s) and contributor(s) and not of MDPI and/or the editor(s). MDPI and/or the editor(s) disclaim responsibility for any injury to people or property resulting from any ideas, methods, instructions or products referred to in the content. |
© 2023 by the authors. Licensee MDPI, Basel, Switzerland. This article is an open access article distributed under the terms and conditions of the Creative Commons Attribution (CC BY) license (https://creativecommons.org/licenses/by/4.0/).