Article

Recreational Fishery Environmental Suggestions of Sandu Island, Ningde, Fujian Province Based on KANO Model and Expert Verification

1
Fisheries College, Jimei University, Xiamen 361021, China
2
Fujian Provincial Key Laboratory of Marine Fishery Resources and Eco-Environment, Xiamen 361021, China
3
Fisheries Research Institute of Fujian, Xiamen 361021, China
*
Authors to whom correspondence should be addressed.
These authors contributed equally to this work.
Water 2023, 15(20), 3668; https://doi.org/10.3390/w15203668
Submission received: 15 September 2023 / Revised: 15 October 2023 / Accepted: 16 October 2023 / Published: 20 October 2023

Abstract

:
Tourist satisfaction is an important reference in destination management decisions, but on-site validation is often lacking. By exploring the relationship between the current situation of recreational fishery and tourism satisfaction evaluation, we can accurately understand tourists’ consumption preferences and obtain product/service quality information. After on-site verification, such validation is conducive to promoting the high-quality development of regional recreational fisheries. The study area is located on Sandu Island, Ningde City, Fujian Province. This study examines how each item of service quality may exhibit different impacts on customer satisfaction by using a questionnaire survey of consumers in the recreational fisheries. This study combines the Kano model and the Better–Worse index method to investigate the critical service quality. The results show that among the 19 quality indicators of visitor satisfaction, environmental and landscape quality elements are the most important. In addition, through expert verification, it can be confirmed that the improvement of the water environment is of great help to the industry. To improve and maintain customer satisfaction, the above attributes are combined with underlying quality attributes as strategic weapons to highlight competitive advantages.

1. Introduction

After the 1970s, recreational fisheries became popular in the United States, Japan, Europe and Taiwan, China [1,2,3]. They are also globally recognized as having a high social, economic and food security importance and generating significant economic benefits [4,5]. In recent years, recreational fisheries have gradually developed into an important socio-economic activity in China, becoming a new direction for the transformation and development of traditional fishing [6,7].
According to the “China Recreational Fisheries Development Monitoring Report” (2021), a recreational fishery is defined as a comprehensive fishery industry that integrates primary, secondary and tertiary industries through optimal allocation of resources, integrating leisure and entertainment, ornamental tourism, ecological construction, cultural inheritance, popular science, catering and fishery. As a rapidly developing industry in the process of fishery structural adjustment, it is not only a new highlight of China’s fishery economic growth in recent years but has played a positive role in expanding fishery functions, optimizing fishery industry structure, promoting fishery quality and efficiency, and driving fishermen employment and income growth [8,9,10]. At this time, with the rapid development of China’s fishery economy, problems such as environmental pollution and overexploitation of fishery resources in coastal areas have become increasingly prominent. Therefore, as an emerging sustainable development model that balances economic development and environmental protection, it has developed into a pillar industry of modern fisheries [11,12].
Obviously, the “2020 Key Points for Fishery and Fisheries Administration Work” emphasizes the outstanding importance of recreational fishery development and promotes the extension and integrated development of the fishery industry [13]. Since 2012, the output value of recreational fisheries in China has grown steadily year by year, and the development momentum is strong. However, due to the impact of COVID-19, the production value has declined since 2020. According to the “2020 National Fisheries Economic Statistics Bulletin”, the output value of recreational fisheries in 2020 was 82.572 billion yuan, a year-on-year decrease of 14.32% [14]. In recent years, with the gradual recovery of social production and consumption, recreational fisheries are recovering. In 2022, the output value of recreational fishery reached 84.74 billion yuan, an increase of 1.42% year-on-year [15]. In addition, according to China Fisheries Daily, China’s recreational fishery industry recovered rapidly in the first half of 2023, with a total output value of 30.11 billion yuan, a year-on-year increase of 17.15%.
Although the scale of China’s recreational fishery industry has developed rapidly, there are still some problems, such as unreasonable resource utilization, insufficient water environmental protection, low matching between product supply and demand, insufficient transformation of cultural value, and lack of unified planning guidance [16,17]. At this time, consumers are showing higher demand for innovative products and services. Therefore, how to accurately identify tourist consumption preferences and better meet the new needs of consumption have become the focus of current recreational fishery management [18,19,20].
In the 1970s, customer satisfaction was applied to tourism management [21]. Factor analysis is used to determine the assessment factors that affect visitor satisfaction. Afterwards, from the perspective of tourist satisfaction, tourism management research developed service-quality evaluation models, represented by Kano, GM, and GAP models, which were applied to tourism quality evaluation, strengthening the guiding role of structured models [22,23]. With the continuous deepening of research, later models such as QFD, SERVQUAL, IPA and ACSI were proposed [24,25]. In terms of recreational fisheries, many scholars have also conducted research on satisfaction with recreational fisheries from different perspectives, mainly focusing on research on satisfaction and fishing motivation, satisfaction and recreational fisheries policies, and the impact of tourism destination attributes on satisfaction [26,27,28,29].
Some studies focus on basic theoretical research and supply research on recreational fisheries, and less on tourism-demand research. In addition, after exploring the factors influencing demand, the improvement suggestions put forward are even more lacking in verification and confirmation of factors. Therefore, this study aims to study the satisfaction of tourists from Sandu Island in Ningde City and adopts the Kano model for service-quality evaluation and the coefficient of superiority and the Better–Worse index method. By exploring the needs of recreational fishery tourists and combining them with expert verification, the findings of the study can provide theoretical and empirical support to improve visitor experience satisfaction and promote high-quality development.

2. Materials and Methods
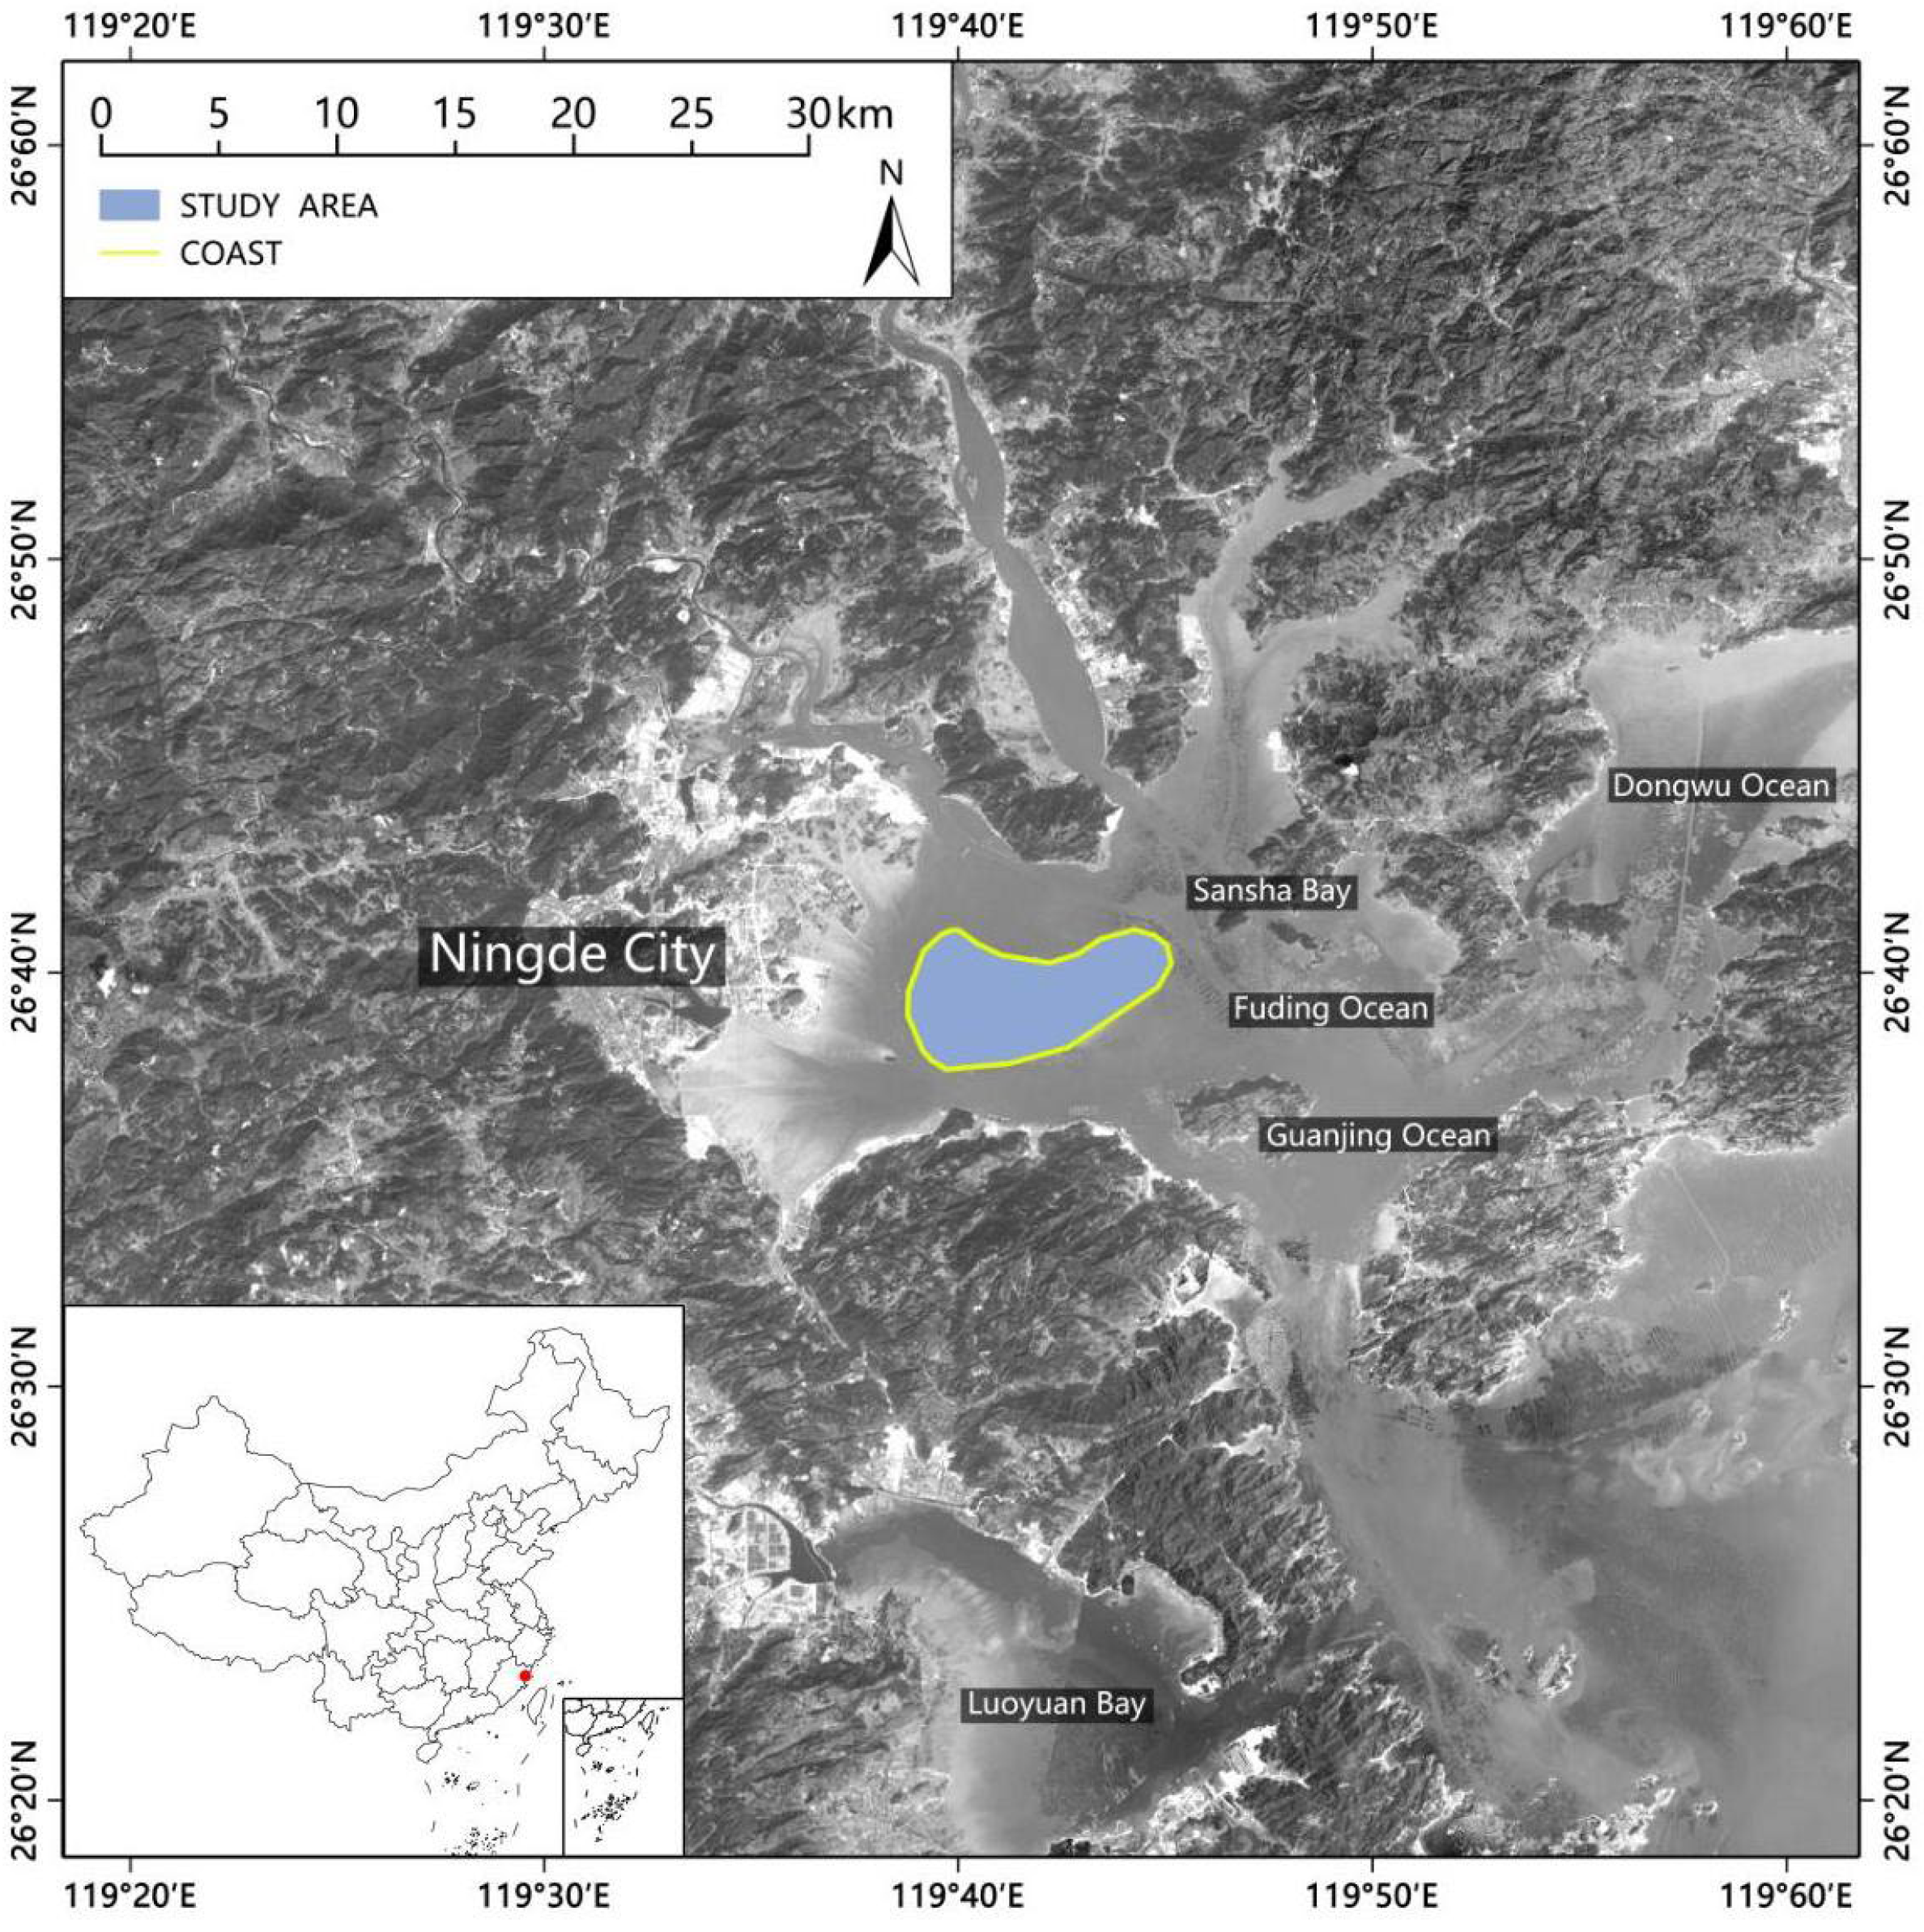
2.1. Study Area

In this study, Sandu Island, Ningde City, Fujian Province was selected as the research site (Figure 1). Sandu Island is located in the central area of the Sandu Gulf, known as the “Sea Lake”. The whole area of Sandu Island is 26.9 km2, the surrounding sea area is 120 km2, and the deep bay is wide [30,31]. Most of the residents live in the southwest corner of Sandu Island. The deep-water area is located in the south of the island, and there are large sandy beaches in the southeast and northwest of the island.
In 1898, Sandu Island was designated as a foreign trade port, and 13 countries, including the United States and the United Kingdom, set up offices here. Its profound cultural heritage has created a unique island scenery. Also, it has abundant recreational fishery resources and scenery, including concave bays, deep-water ports, marine fishing rafts and aquaculture farms, the Fuguan ruins, and the “most beautiful fishing village”, Liukeng Village [32,33]. The perfect blend of modern economic style and rare natural scenery makes Sandu Island a vibrant island away from the city center. In recent years, Sandu Island has been actively integrated into the policy of “Developing Sandu Bay and Building a new Ningde”. Moreover, the “Combination of fishing and tourism, the development concept of the port to promote the industry” policy sets out actively to create ecological breeding sites, marine fishery, and recreational fishing. These policies provide opportunities and improvements for Sandu Island to realize a recreational fishing industry.

2.2. Study Design

The purpose of this study is to understand the satisfaction of tourists in Sandu Island, Ningde City and to make suggestions for improvement. Therefore, this study design not only uses the model to evaluate the service quality and explore the needs of recreational fishery tourists, but also combines expert verification to confirm the needs and improvement factors. First of all, by combing and comparing relevant literature and consulting experts and practitioners in related fields, the relevant influencing factors of recreational fishery service quality are determined. Then, combining the Kano model and the Better–Worse index method, the service quality attributes of a recreational fishery were classified, and four-quadrant diagrams of the Better–Worse index were established to determine the quadrantal distribution of each service attribute. The core response strategy and priority of a recreational fishery service quality attribute are obtained. Furthermore, expert verification is used to identify requirements and improvement factors. Finally, the evaluation results of Sandu Island recreational fishery service quality were analyzed and discussed, and the improvement strategies were put forward.

2.3. Questionnaire Design and Data Collection

This study aims to explain the attributes that affect customer satisfaction. It also lists 19 attributes that affect customer satisfaction, as shown in Table 1. The Tourist Satisfaction Questionnaire was designed to incorporate quality-of-service attributes. The first part mainly includes basic information such as gender, age, long-term residence, education level, occupation, etc., of the respondent. The second part is about quality-of-service factors as a Kano model analysis. as shown in Appendix A.
During the period from 29 April to 25 June 2023, a total of 230 questionnaires were obtained using a combination of on-site visits and online visits using the Questionnaire Star software (https://www.wjx.cn/, accessed on 12 August 2023). During the questionnaire interview, full consideration was given to whether the on-site respondents had enough time to answer the questions and whether the online respondents had personally visited Sandu Island. Research was conducted on respondents of different age groups, career directions, income levels, and other factors to ensure the feasibility of the questionnaire data. At the same time, based on the time taken by the respondents to answer the questions, questionnaires with a response time of less than 1 min were considered invalid. A total of 224 valid questionnaires were obtained, with a validity rate of 97.4%, and an average survey time of about 20 min.

2.4. Service Quality Attributes for Recreational Fisheries
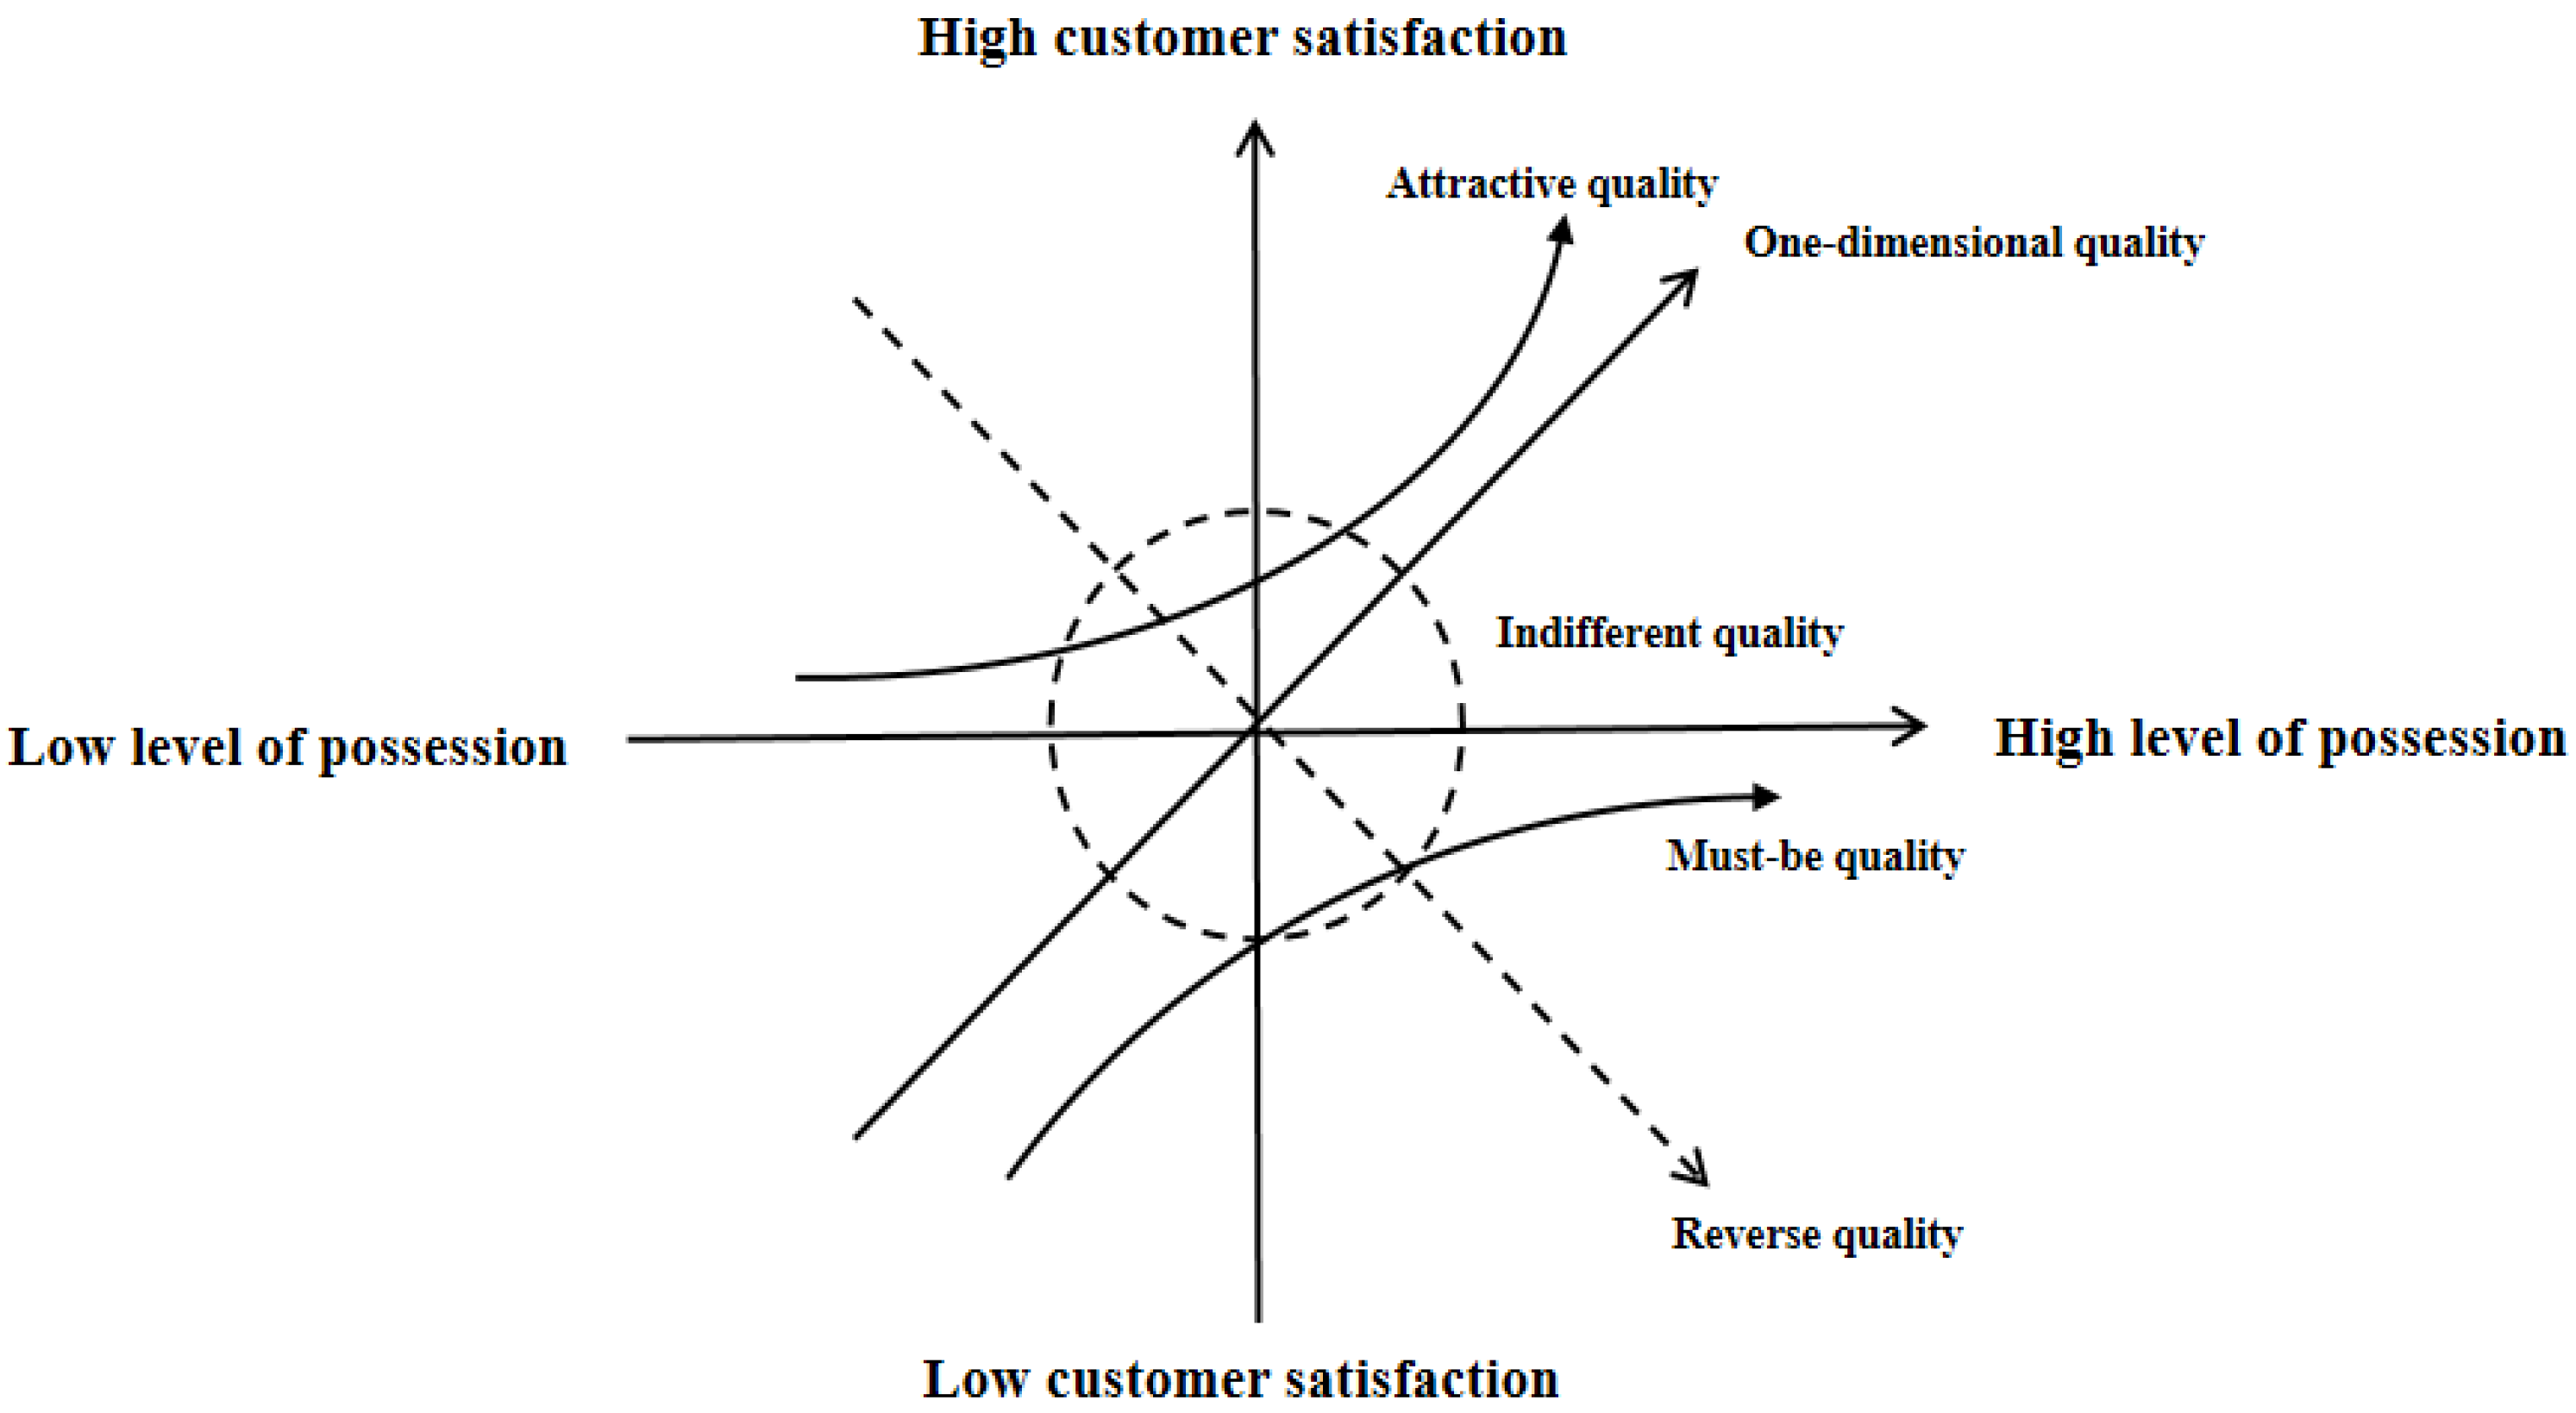
The construction of tourist service quality indicators is mainly divided into two categories: one is based on the SERVQUAL model, and the other is based on the six elements of tourism (food, accommodation, transportation, tourism, shopping and entertainment) [26,34,35,36,37]. Therefore, after reviewing and comparing the relevant literature on such topics, as well as consulting experts and practitioners in related fields, combined with the actual characteristics of recreational fisheries on Sandu Island, this study extracts 7 main indicators affecting the quality of recreational fishery services and sets 19 secondary indicators (Table 1).

2.5. Kano Model

The Kano model is an effective tool for classifying service quality elements proposed by Professor Noriaki Kano of the Tokyo Institute of Technology in Japan [38]. Kano connects customer satisfaction with product quality and functionality [39,40] and uses a questionnaire survey to portray customer satisfaction and dissatisfaction by a graphical representation. The horizontal axis of the graph represents the fulfillment of the functionality of a feature, and the vertical axis represents customer satisfaction that is due to the fulfillment of the functionality of that feature. Kano believes that the relationship between customer satisfaction and service quality elements is not all one-dimensional linear. So, Kano divided them into three ways that they affect customer satisfaction: must-be quality, one-dimensional quality, and attractive quality [41]. According to Avikal et al. [40], there are two more dimensions of customer perceptions of products and/or service quality: indifferent quality and reverse quality. Many researchers have discussed these five perspectives of product characteristics (Table 2) [39,42,43]. Figure 2 shows the two-dimensional Kano model [44,45].
Data based on the responses to the functional and dysfunctional questions for each attribute were collected and analyzed to categorize the attributes of retail stores, using the Kano evaluation table. A Kano evaluation matrix was established using the references of [49,51,52]. The format of a pair of questions and the Kano evaluation matrix are shown in Table 3.

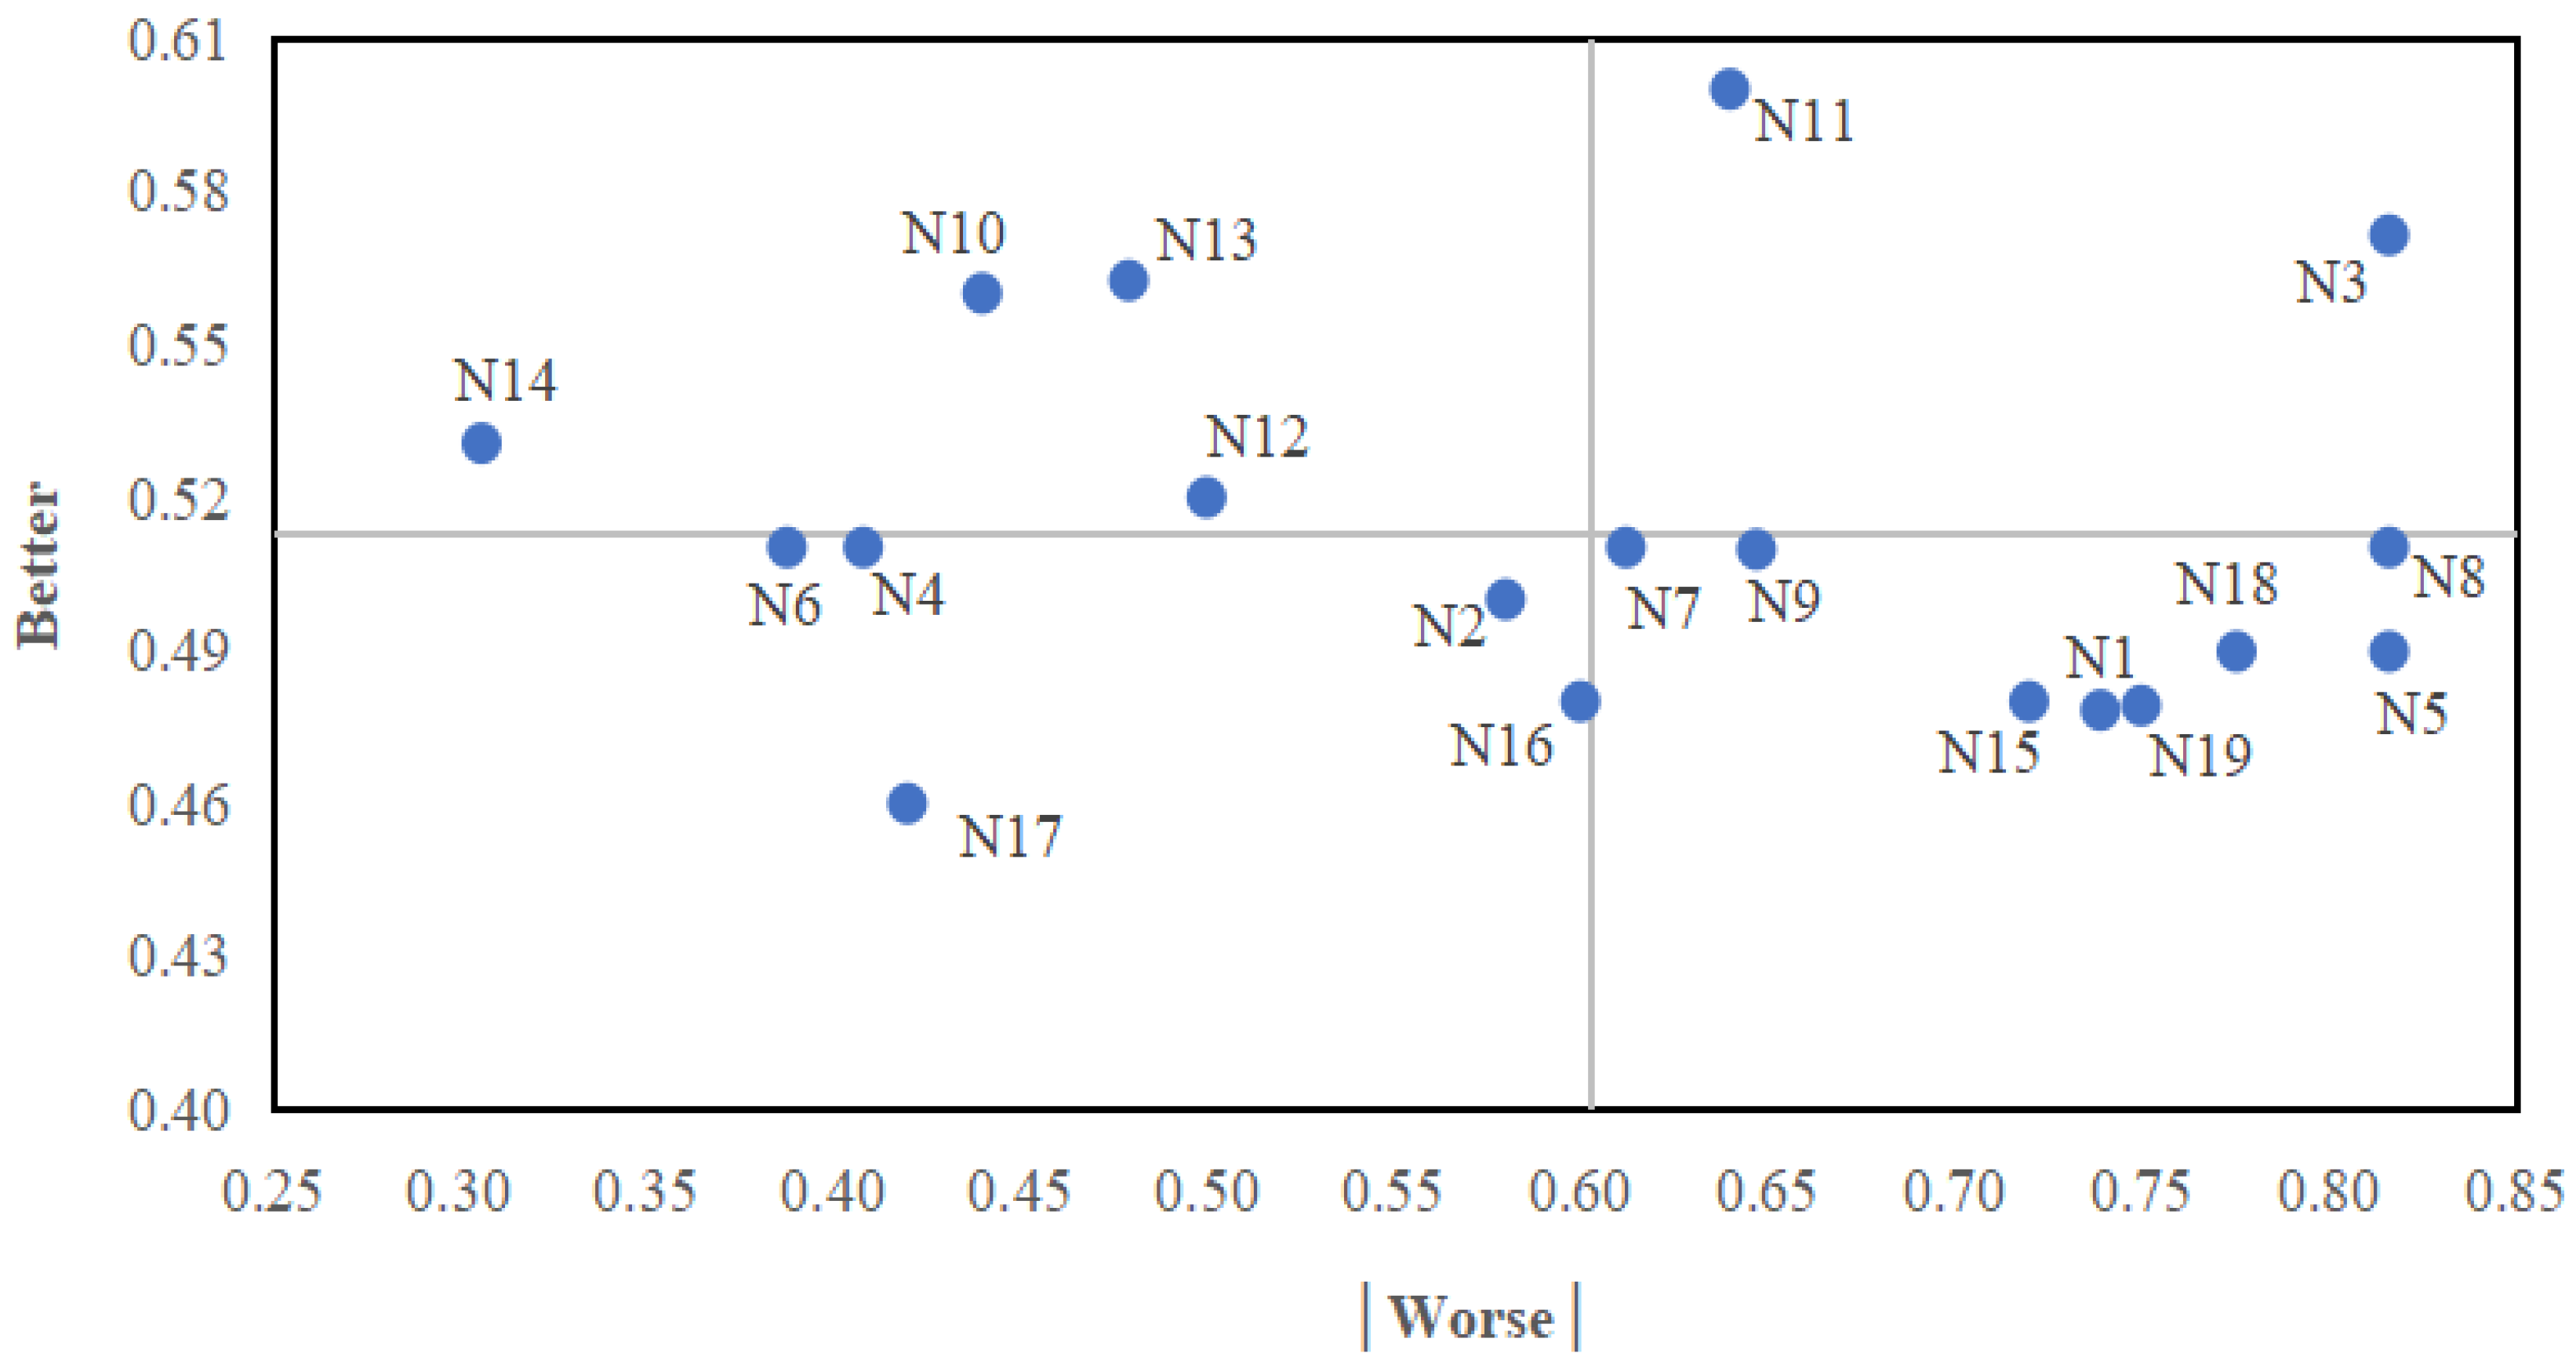
2.6. The Better–Worse Index Method

Kano categories have a definite hierarchical rule: Must-be quality attributes > One-dimensional quality attributes > Attractive quality attributes > Indifferent quality attributes. Hence, it is important to acknowledge all of the responses when evaluating and categorizing the attributes. However, the traditional Kano model generally uses the maximum value as the evaluation criterion for determining the types of service quality attributes, thus ignoring the distribution status of other types, which can lead to deviations in identifying consumer needs. In order to address the drawbacks of the traditional Kano model, this study combines the Better–Worse index method to more accurately partition quality attributes.
According to the Kano model, the Better–Worse index method proposed by Berger [52] was adopted to calculate the coefficient of two indicators such as degree of satisfaction and degree of dissatisfaction, used for measuring the degree of the impact of the quality element on customer satisfaction or dissatisfaction.
The formulas for calculating the coefficient of Better, Worse, average value of the Better, and average value of the |Worse| are as follows:
Better i = A i + O i A i + O i + M i + I i
Worse i = ( 1 ) * M i + O i A i + O i + M i + I i
Better ¯ = 1 n i = 1 n Better i
Worse ¯ = 1 n i = 1 n Worse i ¯
where A is the number of Attractive quality attributes; O is the number of One-dimensional quality attributes; M is the number of Must-be quality attributes; and I is the number of Indifferent quality attributes.

2.7. Reliability and Validity

2.7.1. Reliability

Reliability analysis is usually used to study the reliability and accuracy of quantitative data responses, using Cronbach’s α coefficient as an indicator for testing questionnaire reliability. The reliability coefficients of the functional and dysfunctional questions in the questionnaire are 0.981 and 0.985 (Table 4), both of which are greater than 0.9. This indicates that the questionnaire has high reliability quality and can be used for measurement and further analysis.

2.7.2. Validity

Validity analysis is mainly used to study the rationality of quantitative data design. The KMO values of the functional and dysfunctional questions in the questionnaire are 0.847 and 0.880, respectively. Values greater than 0.8, with a significance of 0.000, indicate a high validity of the questionnaire (Table 5).

2.8. Expert Verification

Expert verification is used to identify visitor satisfaction needs and improvement factors. In order to further verify the attributes of influencing factors on visitor satisfaction with recreational fisheries in Sandu Island, this study invited five scholars and experts from different research directions, such as recreational fisheries, fishery resource management, marine environmental monitoring and marine tourism. The expert information is shown in Table 6. Expert scoring was conducted from 22 to 24 June 2023, based on the experts’ various services and experiences. The experts scored each satisfaction element on a scale of 100 points, using the average method to obtain the most important elemental scores.

3. Results

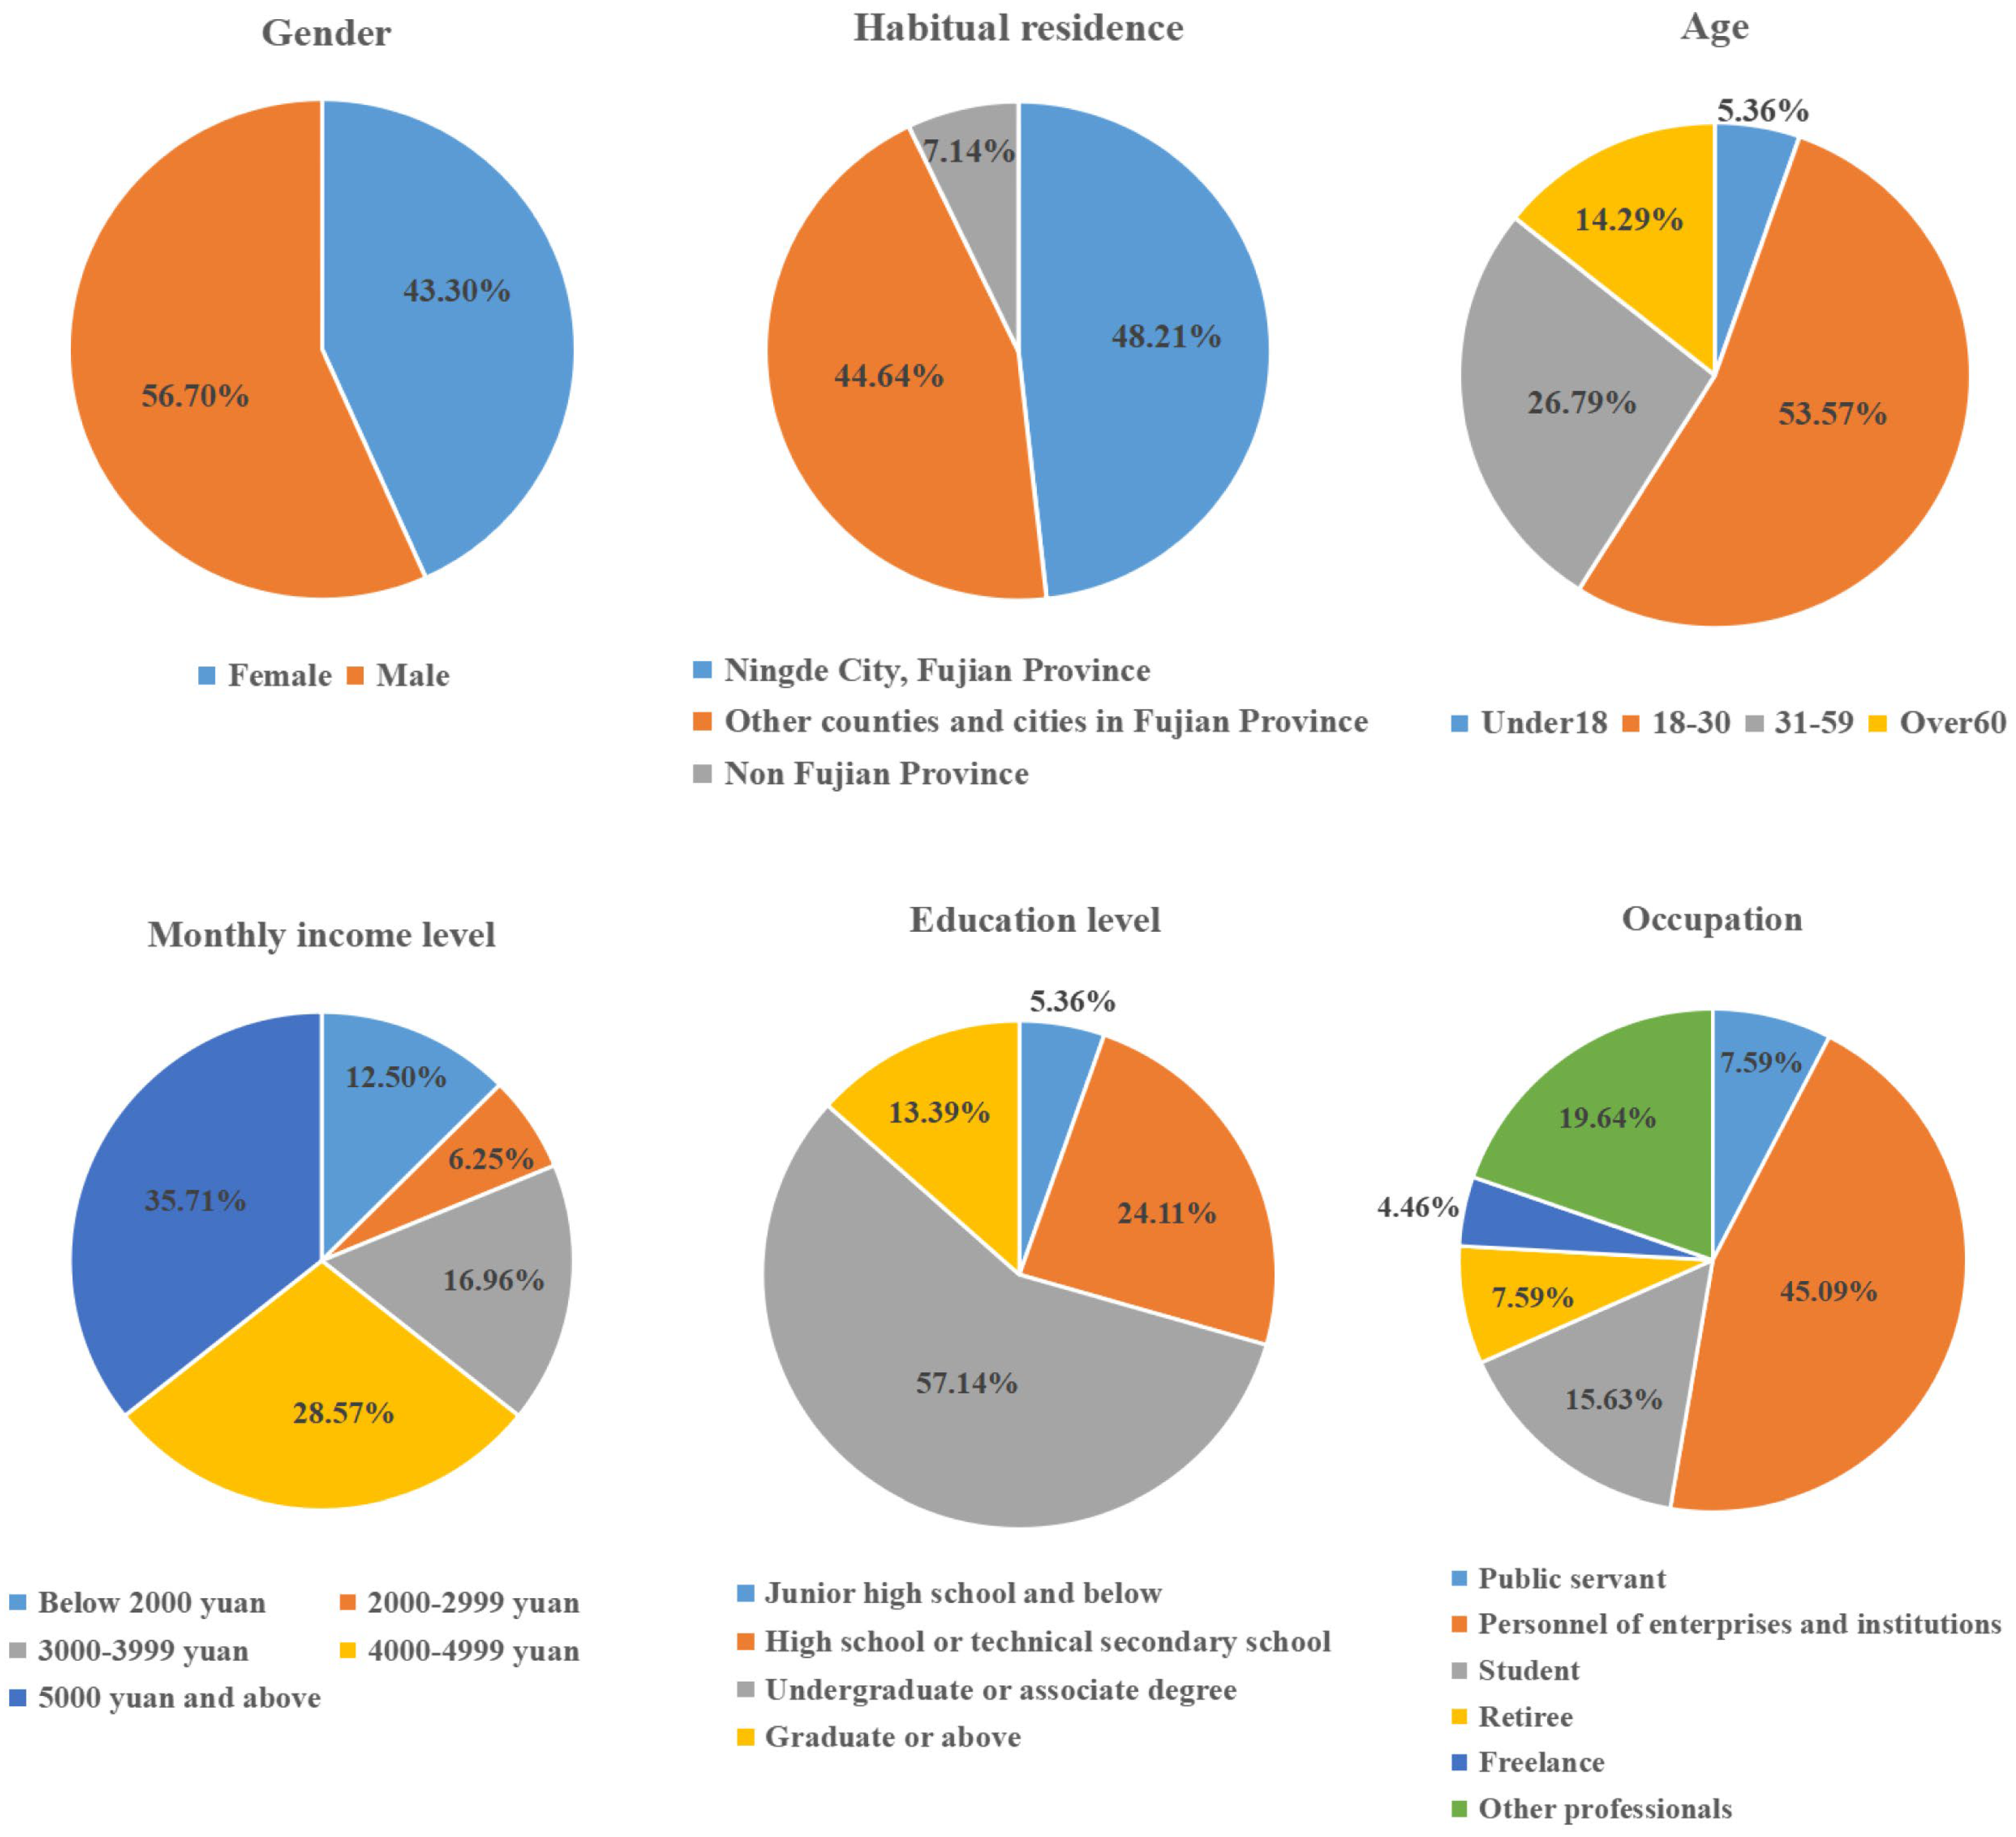
3.1. Analysis of Tourists

The basic information of the tourists interviewed includes gender, age, long-term residence, education level, occupation, monthly income level, etc. The specific data results are shown in Figure 3. The gender ratio of tourists is relatively balanced, with men accounting for 56.70% of the total sample and women 43.30%. In terms of age, those aged 18–30 account for the highest proportion, accounting for 53.57%. This shows that young people have a strong interest in recreational fishing, which may be closely related to the increased pressure in daily work and life and the urgent need to seek leisure and entertainment activities. Analysis of long-term residence shows that tourists mainly come from Ningde and other counties in Fujian Province, accounting for 48.21% and 44.64%, respectively. The spatial distance between the two is short, and tourists have a strong tendency to travel. In terms of education level, the majority are undergraduate/college students, accounting for 57.14%. In terms of profession, most of the tourists work in enterprises and institutions. The income level of the tourists is mainly above RMB 5000, accounting for 35.71%.

3.2. Tourist Satisfaction Analysis

Using a tourist user-satisfaction coefficient, we can understand the tourist satisfaction after a certain element is added and the user dissatisfaction after a certain element is eliminated (Table 7); both of them can be used as the reference for service improvement. Using the average values of the Better coefficients (51.33%) and the absolute values of the Worse coefficients (60.28%) of 19 service quality elements as the coordinate origin, a four-quadrant matrix diagram (Figure 4) of the absolute values of the Better coefficients and Worse coefficients is constructed to partition the attributes of each service quality element.
The fourth quadrant is characterized by a lower Better index and a higher Worse index, suggesting that the presence of these factors does not do much to improve user satisfaction, but causes extreme dissatisfaction if they are absent. The characteristics of the first quadrant are the high Better index and high Worse index, indicating these elements must be paid high attention, whichever is the one improving user satisfaction or the one preventing user dissatisfaction. Among the factors that affect tourist satisfaction in Sandu Island’s recreational fisheries industry, there are eight factors located in the fourth quadrant, namely N1 (Convenient transportation), N5 (Sanitary and comfortable accommodation with reasonable prices), N7 (Modernization and adequacy of infrastructure), N8 (Marine fishery environment is clean and hygienic), N9 (Landscape preservation and maintenance state is intact), N15 (Friendly and enthusiastic staff), N18 (Food safety and hygiene), and N19 (Fishing experience activity safety). This type of demand belongs to the Must-be quality element and must be provided to tourists; otherwise, it will cause dissatisfaction among recreational fisheries tourists.
In the second part, N3 (Catering with a wide variety and reasonable prices) and N11 (Reasonable arrangement of tourist routes) are One-dimensional quality elements, indicating that tourists are not satisfied with the current supply of these elements and that they need to be further improved to bring a better recreational fisheries experience. The two elements belong to the high value-added quality elements, and enterprises must input more resources to meet the demands therein.
Furthermore, N10 (Landscape is unique and attractive), N12 (Rich and diverse fishing activities), N13 (Strong participation in fishing activities), and N14 (Rich variety of tourist souvenirs/seafood specialties) are classified as Attractive quality elements, indicating that their presence will bring unexpected surprises to tourists, improve their experience perception, promote consumption upgrading, and make tourists very satisfied.
Finally, N2 (Comfortable transportation), N4 (Provide Fishery Specialty Catering), N6 (Accommodation facilities with fisherman characteristics), N16 (Strong staff handling skills), and N17 (Equipped with dedicated instructors) are indifferent quality elements, indicating that the presence or absence of these five elements will not affect tourist satisfaction.
In summary, visitor satisfaction, demand and improvement factors show that the environment and landscape factors are particularly important.

3.3. Expert Verification

Five experts scored and verified the service quality factors of the above model on site (Table 8).
According to the results of the expert scores, the safety and security facilities, environment and landscape quality elements are relatively high. For the N19 (Fishing experience activity safety) element of the “Safety assurance index”, the average score of the five experts was as high as 90.6. Because of the high potential risk factor of “Marine island water environment”, the “Safety of visitors” should be ensured first when the region organizes recreational fishery activities. In addition, the N9 (Landscape preservation and maintenance state are intact), N10 (Landscape is unique and attractive) and N8 (Marine fishery environment is clean and hygienic) scores in the “Marine fishery environment” element are high, and the ranking is also high. It can be seen that for “Marine island recreational fisheries”, the quality of the water and ecological environment have a high influence on visitor satisfaction.

4. Discussion

Using the Kano model to draw a Four-quadrant diagram of the Better–Worse index has become an important analysis method for researchers to identify the focus of consumer demand [23,34,35,36,53]. From the above analysis results, it can be seen that environment and landscape quality are the core elements affecting tourist satisfaction. The dissatisfaction coefficient of N8 (Marine fishery environment cleanliness and hygiene) is as high as 81.63%, ranking first, from which it can be seen that tourists attach importance to the landscape environment, which is the focus of tourist demand. Research shows that environmental health is the key factor affecting the quality of a recreational fishery service [35]. The marine fishery environment, as an important scene for Sandu Island to realize the spatial expansion of recreational fisheries and promote the integrated development of business forms, plays an important role in realizing the sustainable development and utilization of resources. Marine environmental pollution will directly lead to the coastal cities that rely on marine landscape tourism and fishery as important economic pillars experiencing difficulty in carrying out ocean-related economic activities [54,55]. China is a big country with a high demand for resources. As a region rich in resource reserves, the development of a marine economy and industry mainly depends on the quality of the marine environment. Therefore, in order to ensure the healthy development of marine fishery resources, it is necessary to strengthen the protection of the marine environment, so as to achieve the strategic goal of sustainable development of the ecological environment and economic construction [55]. In addition to strengthening the protection of the landscape and water environment, Sandu Island also needs to strengthen publicity and education in marine protection, popularize the importance of the marine environment to tourists and local residents, improve the environmental awareness of Sandu Island residents, reduce the discharge of domestic garbage, maintain a good island environment, and then eliminate the dissatisfaction of tourists.
Public service facilities have always been an important factor affecting tourists’ choice of tourism activities [56]. A marine environment is a complex corrosive environment; in this environment, the sea water itself is a corrosive medium, at the same time, the wave tide and the metal produce low-frequency reciprocating forces and impacts; moreover, marine microorganisms, attachments and their metabolites have a direct or indirect acceleration effect on the corrosion process. Therefore, the equipment and facilities in the unique environment of the island will age in advance compared with a normal environment, and there are more security risks [57]. When Kwon and Lim used the Kano model to explore the impact of demand for marine tourism services, they found that the most critical service was project safety [58]. Therefore, it can be seen from the analysis results of this study that basic support and safety support facilities are divided into Must-be quality elements, which play a key role in the service quality of recreational fisheries. At present, the main means of transportation to Sandu Island is small speedboats, and the way of entry is single. In the tourist season, in order to meet the needs of local islanders and foreign tourists wishing to enter the island, there is an overload phenomenon of speedboats, which aggravates the hidden danger of tourism safety. The relevant departments should strengthen the supervision of the safety of marine facilities and carry out regular inspections of recreational fishing facilities.
The landscape is unique and attractive, which can improve tourists’ satisfaction in Sandu Island. With the upgrading of people’s needs for cultural consumption, such as content identity, fun and playability, and interactive experiences, experiencing a unique cultural landscape environment can deliver unexpected surprises to tourists. Culture (marine culture, fishing culture, etc.), as the resource and connotation of a recreational fishery, plays an important role in promoting the integrated development of fishing and tourism in Sandu Island. By creating a fishery culture and tourism consumption scenes, the cultural potential can be continuously released. At the same time, the living space and landscape can be rendered with a fishery culture atmosphere, and unique tourism cultural products can be developed, so as to fully mobilize the enthusiasm of tourists in a cultural experience [59]. In addition, Sandu Island will expand the development of recreational fishery projects, constantly innovate recreational fishery experience scenes, enhance tourist participation and enthusiasm, meet tourists’ quality, personalized and characteristic consumption needs, and adapt to the transformation and upgrading trend of tourists’ consumption structure.
As a new field of the service industry against the background of the integration of three industries, most of the management and service subjects are from the local traditional fishermen, with a low educational level and lack of necessary understanding of the importance of providing quality services [60]. However, tourists are very sensitive to the factor of “Friendly and enthusiastic staff”, and the dissatisfaction coefficient is 70%. Therefore, in order to eliminate the dissatisfaction of tourists, it is necessary to strengthen the development of regional human resources, invite professional talents for training, and improve the overall service level. The second is to establish a recreational fishery service management organization, strengthen the supervision of service quality, create a communication platform between tourists and operators, understand in good time the feedback information from tourists on service quality, and improve the evaluation of tourist satisfaction with Sandu Island.
In summary, how to evaluate and improve the quality of recreational fishery services has received increasing attention from the government, academia and industry [61,62,63,64]. Areas such as islands and coastal cities are particularly rich in fishery resources and are the core areas for the development of recreational fisheries in my country. Although my country’s recreational fishery has achieved considerable industrial benefits, the development level of recreational fishery service quality varies across regions [65,66], and industrial development still faces many deficiencies.

5. Conclusions

This study examines how each item of service quality may exhibit different impacts on customer satisfaction by using a questionnaire survey on consumers in the recreational fisheries. The Kano model combined with the Better–Worse index method is used to study critical service quality. The 19 quality elements that affect the satisfaction of recreational fishery tourists on Sandu Island are divided into eight Must-be quality elements, two One-dimensional quality elements, five Indifferent quality elements and four Attractive quality elements. Among the 19 quality indicators of visitor satisfaction, environmental and landscape quality elements are the most important. In addition, through expert verification, it can be confirmed that the improvement of the water environment is of great help to the industry. To improve and maintain customer satisfaction, the above attributes are combined with underlying quality attributes as strategic weapons to highlight competitive advantages.

Author Contributions

Conceptualization, C.-R.W., L.-M.H. and T.-J.C.; methodology, C.-R.W. and T.-J.C.; software, C.-R.W., L.-M.H. and J.-D.C.; validation, C.-R.W. and L.-M.H.; formal analysis, C.-R.W. and L.-M.H.; investigation, C.-R.W., L.-M.H. and T.-J.C.; resources, C.-R.W., L.-M.H. and J.-Y.Y.; data curation, C.-R.W., L.-M.H. and J.-Y.Y.; writing—original draft preparation, C.-R.W. and L.-M.H.; writing—review and editing, C.-R.W. and L.-M.H.; visualization, C.-R.W., L.-M.H. and T.-J.C.; supervision, L.-M.H. and T.-J.C.; project administration, L.-M.H. and T.-J.C.; funding acquisition, L.-M.H. All authors have read and agreed to the published version of the manuscript.

Funding

This research was funded by the National Key Research and Development Plan, grant number 2018YFC1406302; and Monitoring of important economic species resources in Marine fisheries in Fujian Province–social survey (S22085); and the Fujian Provincial Department of Science and Technology basic research projects of public research institutes (2022R1013004). The funders had no role in the study design, data collection, analysis, the decision to publish, or the preparation of the manuscript.

Data Availability Statement

Not applicable.

Acknowledgments

All authors would like to thank to the reviewers for their constructive criticism and improvement of the manuscript.

Conflicts of Interest

The authors declare no conflict of interest.

Appendix A. Sandu Island Recreational Fisheries Satisfaction Questionnaire

Table A1. Socio-demographic characteristics of tourists.
Part 1. Socio-Demographic Characteristics of Tourists
Gender
  • Female
  • Male
Age
  • Under 18
  • 18–30
  • 31–59
  • Over 60
Education level
  • Junior high school and below
  • High school or technical secondary school
  • Undergraduate or associate degree
  • Graduate or above
Habitual residence
  • Ningde City, Fujian Province
  • Other counties and cities in Fujian Province
  • Non Fujian Province
Occupation
  • Public servant
  • Personnel of enterprises and institutions
  • Student
  • Retiree
  • Freelancer
  • Other professionals
Monthly income level
  • Below 2000 yuan
  • 2000–2999 yuan
  • 3000–3999 yuan
  • 4000–4999 yuan
  • 5000 yuan and above
Table A2. Kano questionnaire section for each attribute.
LikeMust BeNeutralLive-withDislike
TransportationIf Sandu Island has convenient transportation, how would you feel?
If Sandu Island doesn’t have convenient transportation, how would you feel?
If Sandu Island has comfortable transportation, how would you feel?
If Sandu Island doesn’t have comfortable transportation, how would you feel?
Food and AccommodationIf Sandu Island has catering with a wide variety and reasonable prices, how would you feel?
If Sandu Island doesn’t have catering with a wide variety and reasonable prices, how would you feel?
If Sandu Island provides fishery specialty catering, how would you feel?
If Sandu Island doesn’t provide fishery specialty catering, how would you feel?
If Sandu Island has sanitary and comfortable accommodation with reasonable prices
If Sandu Island doesn’t have sanitary and comfortable accommodation with reasonable prices, how would you feel?
If Sandu Island has accommodation facilities with fisherman characteristics, how would you feel?
If Sandu Island doesn’t have accommodation facilities with fisherman characteristics, how would you feel?
Marine fishery environmentIf Sandu Island has modern and adequate infrastructure, how would you feel?
If Sandu Island doesn’t have modern and adequate infrastructure, how would you feel?
If Sandu Island has clean and hygienical marine fishery environment, how would you feel?
If Sandu Island doesn’t have clean and hygienical marine fishery environment, how would you feel?
Landscapeif Sandu Island’ landscape was well protected and maintained, how would you feel?
if Sandu Island’ landscape was not well protected and maintained, how would you feel?
If Sandu Island has cunique and attractive landscape, how would you feel?
If Sandu Island doesn’t have cunique and attractive landscape, how would you feel?
If Sandu Island has reasonable arrangement of tourist routes, how would you feel?
If Sandu Island doesn’t have reasonable arrangement of tourist routes, how would you feel?
Fishing activitiesIf Sandu Island has rich and diverse fishing activities, how would you feel?
If Sandu Island doesn’t have rich and diverse fishing activities, how would you feel?
If Sandu Island has highly participatory fishing activities, how would you feel?
If Sandu Island doesn’t have highly participatory fishing activities, how would you feel?
If Sandu Island has rich variety of tourist souvenirs/seafood specialties, how would you feel?
If Sandu Island doesn’t have rich variety of tourist souvenirs/seafood specialties, how would you feel?
Staff ServicesIf Sandu Island has friendly and enthusiastic staff, how would you feel?
If Sandu Island doesn’t have friendly and enthusiastic staff, how would you feel?
If Sandu Island has strong staff handling skills, how would you feel?
If Sandu Island doesn’t have strong staff handling skills, how would you feel?
If Sandu Island has dedicated instructors, how would you feel?
If Sandu Island doesn’t have dedicated instructors, how would you feel?
SecurityIf Sandu Island has safety and hygiene food, how would you feel?
If Sandu Island doesn’t have safety and hygiene food, how would you feel?
If Sandu Island has safety fishing experience activity, how would you feel?
If Sandu Island doesn’t have safety fishing experience activity, how would you feel?

References

  1. Zhao, C. A review of overseas recreational fishery management. North. Chin. Fish. 2021, 40, 36–38. (In Chinese) [Google Scholar]
  2. Fang, H.; Xie, Y.L.; Li, L.N. Status of sustainable management of foreign recreational fisheries and management countermeasure for recreational fisheries in China. Fish. Inf. Strategy 2008, 10, 16–18. (In Chinese) [Google Scholar]
  3. Wang, Z.F.; Chen, W.J.; Qiu, K.C.; Bao, H.W.; Zhao, W.W. Discussion on the experience and enlightenment of recreational fisheries development in Taiwan, China. China Fish. 2020, 10, 52–54. (In Chinese) [Google Scholar]
  4. Arlinghaus, R.; Aas, Ø.; Alós, J.; Arismendi, I.; Bower, S.; Carle, S.; Czarkowski, T.; Freire, K.M.F.; Hu, J.; Hunt, L.M.; et al. Global participation in and public attitudes toward recreational fishing: International perspectives and developments. Rev. Fish. Sci. Aquac. 2021, 29, 58–95. [Google Scholar] [CrossRef]
  5. Crisafulli, B.; Afrifa-Yamoah, E.; Mueller, U.; Ryan, K.; Fairclough, D.; Lo, J. Using intervention analysis to evaluate the trends in release rates of recreational fisheries following extensive management changes. Fish. Res. 2023, 267, 106818. [Google Scholar] [CrossRef]
  6. Zhao, Q.L.; Chen, G.Y.; Qi, S.Q.; Chen, X.J. Research progresses of recreational fishery economy. Trans. Oceanol. Limnol. 2022, 44, 176–184. (In Chinese) [Google Scholar]
  7. Zhao, Q.L.; Chen, X.J.; Chen, G.Y.; Qi, S.Q. The socioeconomic contribution of the recreational fishery based on input-output analysis: The case of China. Mar. Pol. 2022, 143, 105177. [Google Scholar] [CrossRef]
  8. Tian, P.; Li, J.L.; Cao, L.D.; Liu, Y.C.; Zhang, H.T. Evaluation of fishery economic efficiency and development trend forecast in China. Chin. J. Agric. Resour. Reg. Plann. 2023, 44, 160–172. (In Chinese) [Google Scholar]
  9. Le, J.H.; Li, M.J. An empirical study on the relationship between recreational fisheries development and fishery economic growth. Chin. Fish. Econ. 2019, 37, 27–34. (In Chinese) [Google Scholar]
  10. Wang, L.X.; Ping, Y. Study on contribution of leisure fishery to the high quality development of fishery economy. Ocean. Dev. Manag. 2021, 38, 32–36. (In Chinese) [Google Scholar]
  11. Huang, Y.X.; Zhou, H.R.; Ying, J.D. Analysis of influencing factors on the development of recreational fisheries in China: An empirical test based on literature visualization and econometric methods. Chin. Fish. Econ. 2023, 41, 94–103. (In Chinese) [Google Scholar]
  12. Zhao, L.; Liu, H.M.; Yang, Z.J. The exploration of recreational fishery development from the perspective of fishery culture. J. Ocean. Univ. China 2014, 1, 45–49. (In Chinese) [Google Scholar]
  13. Yang, Y.; Song, H. Evaluation system of sustainable development of recreational fisheries: Based on WSR methodology. J. Beijing Univ. Aeronaut. Astronaut. 2023, 36, 137–144. (In Chinese) [Google Scholar]
  14. 2020 National Fisheries Economic Statistics Bulletin. Available online: http://www.yyj.moa.gov.cn/gzdt/202107/t20210728_6372958.htm (accessed on 1 September 2023).
  15. 2022 National Fisheries Economic Statistics Bulletin. Available online: http://www.yyj.moa.gov.cn/kjzl/202306/t20230628_6431131.htm (accessed on 1 September 2023).
  16. Dong, Z.W.; Liu, N.N. An analysis and evaluation of current leisure fishery situation in our country. J. Fujian Fish. 2015, 37, 485–494. (In Chinese) [Google Scholar]
  17. Liu, X.C. Analysis on the current situation and countermeasures of China’s fishery economy development. China Mark. 2023, 8, 43–45. (In Chinese) [Google Scholar]
  18. Chai, S.S.; Long, C.F. Research on the development of marine recreational fishery under the perspective of consumer behavior. J. Shandong Univ. 2019, 1, 136–144. (In Chinese) [Google Scholar]
  19. Peng, L.W.; Jiang, Q.J. Analysis on product types and market positioning of leisure fishery from the perspective of consumer preference. Chin. Fish. Econ. 2020, 38, 67–76. (In Chinese) [Google Scholar]
  20. Yang, Z.J. Study on development pattern of China’s recreational fishery based on experiencing economy. J. Shanghai Ocean Univ. 2007, 5, 470–477. (In Chinese) [Google Scholar]
  21. Fu, Q.S. Progress in visitor satisfaction of tourist destination: A literature review. Geogr. Geo-Inf. Sci. 2005, 5, 90–94. (In Chinese) [Google Scholar]
  22. Liu, H. Research on Service Quality Improvement of Hongtong Dahuaishu Ancestor Memorial Garden Based on Kano-IPA Model. Master’s Thesis, Shanxi University, Taiyuan, China, 2021. (In Chinese). [Google Scholar]
  23. Zong, Y.; Zhang, X.M.; Li, S.M. Analysis of consumer demand for ski tourism in Heilongjiang Province based on Kano model. Bus. Econ. 2023, 3, 22–25. (In Chinese) [Google Scholar]
  24. Ji, P.; Jin, J.; Wang, T.; Chen, Y.Z. Quantification and integration of Kano’s model into QFD for optimising product design. Int. J. Prod. Res. 2014, 52, 6335–6348. [Google Scholar] [CrossRef]
  25. Yang, X. Research on The Evaluation and Improvement of Tourism Service Quality in Yan’an Based on IPA Method. Master’s Thesis, Yan’an University, Yan’an, China, 2022. (In Chinese). [Google Scholar]
  26. Qiu, Y.Y.; Wang, E.D.; Yu, Y. Analyzing recreational fishery satisfaction based on bayesian multiple ordered Probit model. Res. Miner. Manag. Sci. 2021, 30, 147–152. (In Chinese) [Google Scholar]
  27. Young, M.A.L.; Foale, S.; Bellwood, D.R. Why do fishers fish? A cross-cultural examination of the motivations for fishing. Mar. Pol. 2016, 66, 114–123. [Google Scholar] [CrossRef]
  28. Arlinghaus, R.; Bork, M.; Fladung, E. Understanding the heterogeneity of recreational anglers across an urban–rural gradient in a metropolitan area (Berlin, Germany), with implications for fisheries management. Fish Res. 2008, 92, 53–62. [Google Scholar] [CrossRef]
  29. Arlinghaus, R.; Mehner, T. Determinants of management preferences of recreational anglers in Germany: Habitat management versus fish stocking. Limnologica 2005, 35, 2–17. [Google Scholar] [CrossRef]
  30. Shen, D.F.; Zhang, G.Y. Fujian island location of the development of tourist resources in Sandu Gulf. Territ. Nat. Resour. Study 2013, 6, 49–50. (In Chinese) [Google Scholar]
  31. Zhang, Q. Cooperative governance strategies for the bay area co-environment under the guidance of Land-Sea Coordination: Taking the Sandu’ao Ring area of Fujian Province as an example. J. Anhui Agric. Sci. 2020, 48, 108–112. (In Chinese) [Google Scholar]
  32. Zhang, P. SWOT analysis and countermeasures for recreational fisheries in Sandu Gulf. N. Chin. Fish. 2009, 2, 36–39. (In Chinese) [Google Scholar]
  33. Zhang, S.X. A preliminary study on coastal tourism in the San Du Gulf region. J. Ningde Norm. Univ. 2017, 2, 33–37. (In Chinese) [Google Scholar]
  34. Li, P.; Ruan, L.C. Research on improving the quality of leisure fishery services based on Kano model: Taking Qingdao Red Island recreational fishing village as an example. J. Anhui Vocat. Tech. Coll. 2014, 13, 35–40. (In Chinese) [Google Scholar]
  35. Ruan, L.C. The Research of Recreational Fisheries Service Quality Based on QFD Theory and Kano Model. Master’s Thesis, Ocean University of China, Qingdao, China, 2015. (In Chinese). [Google Scholar]
  36. Zhao, S.H. Research on tourist satisfaction of leisure agriculture based on KANO model. Jiangsu Commer. Forum. 2013, 12, 28–31. (In Chinese) [Google Scholar]
  37. Lu, F. Study of Recreational Fishery Experience Based on Satisfaction: A Case Study of Ganshui Bay Recreational Fishery Folk Village. Master’s Thesis, Ocean University of China, Qingdao, China, 2009. (In Chinese). [Google Scholar]
  38. Kano, N.; Seraku, N.; Takahashi, F.; Tsuji, S. Attractive quality and must-be quality. J. Jpn. Soc. Qual. Control 1984, 14, 39–48. [Google Scholar]
  39. Ek, F.İ.; Cıkış, Ş. Integrating the Kano model into architectural design: Quality measurement in mass-housing units. Total Qual. Manag. Bus. Excell. 2015, 26, 400–414. [Google Scholar] [CrossRef]
  40. Avikal, S.; Jain, R.; Mishra, P.K. A Kano model, AHP and M-TOPSIS method-based technique for disassembly line balancing under fuzzy environment. Appl. Soft Comput. 2014, 25, 519–529. [Google Scholar] [CrossRef]
  41. Matzler, K.; Hinterhuber, H.H.; Bailom, F.; Sauerwein, E. How to delight your customers. J. Prod. Brand. Manag. 1996, 5, 6–18. [Google Scholar] [CrossRef]
  42. Shahin, A.; Shahiverdi, S.M. Estimating customer lifetime value for new product development based on the Kano model with a case study in automobile industry. Benchmarking Int. J. 2015, 22, 857–873. [Google Scholar] [CrossRef]
  43. Salehzadeh, R.; Shahin, A.; Kazemi, A.; Barzoki, A.S. Is organizational citizenship behavior an attractive behavior for managers? A Kano model approach. J. Manag. Dev. 2015, 34, 601–620. [Google Scholar] [CrossRef]
  44. Madzı´k, P. Increasing accuracy of the Kano model—A case study. Total Qual Manag. Bus Excell. 2018, 29, 387–409. [Google Scholar] [CrossRef]
  45. Shahin, A.; Pourhamidi, M.; Antony, J.; Park, S.H. Typology of Kano models: A critical review of literature and proposition of a revised model. Int. J. Qual. Reliab. Manag. 2013, 30, 341–358. [Google Scholar] [CrossRef]
  46. Llinares, C.; Page, A.F. Kano’s model in Kansei Engineering to evaluate subjective real estate consumer preferences. Int. J. Ind. Ergon. 2011, 41, 233–246. [Google Scholar] [CrossRef]
  47. Xu, Q.L.; Jiao, R.J.; Yang, X.; Helander, M.; Khalid, H.M.; Opperud, A. An analytical Kano model for customer need analysis. Des. Stud. 2009, 30, 87–110. [Google Scholar] [CrossRef]
  48. Matzler, K.; Hinterhuber, H.H. How to make product development projects more successful by integrating Kano’s model of customer satisfaction into quality function deployment. Technovation 1998, 18, 25–38. [Google Scholar] [CrossRef]
  49. Shahin, A.; Mohammadi, S.; Harsij, H.; Qazi, M.R.R. Revising satisfaction and dissatisfaction indexes of the Kano model by reclassifying indifference requirements: A case study of the presidential elections. TQM J. 2017, 29, 37–54. [Google Scholar] [CrossRef]
  50. Brandt, D.R. How service marketers can identify value-enhancing service elements. J. Serv. Mark. 1988, 2, 35–41. [Google Scholar] [CrossRef]
  51. Go, M.; Kim, I. In-flight NCCI management by combining the Kano model with the service blueprint: A comparison of frequent and infrequent flyers. Tour. Manag. 2018, 69, 471–486. [Google Scholar] [CrossRef]
  52. Berger, C.; Blauth, R.; Boger, D. Kano’s methods for understanding customer-defined quality. Cent. Qual. Manag. J. 1993, 2, 3–36. [Google Scholar]
  53. Jingwen, T. Empirical Analysis on Market Prospect of Video Platform’s PVOD. In Proceedings of the Fifth International Conference on Economic and Business Management, Sanya, China, 17 October 2020. [Google Scholar]
  54. Pan, Z.Q. The effect of marine pollution on fishery: A case study of Dalian City around Bohai Bay. Clean World 2023, 39, 126–128. (In Chinese) [Google Scholar]
  55. Fu, Y.Y. Analysis of marine pollution and marine fishery resources protection. Sci. Technol. Style J. 2020, 4, 133. (In Chinese) [Google Scholar]
  56. Wang, M.L. Coastal Tourism in Haikou West Coast Based on Tourist Satisfaction Research on Public Service Enhancement. Master’s Thesis, Hainan Tropical Ocean University, Sanya, China, 2022. (In Chinese). [Google Scholar]
  57. Xu, Y.E. Exploration on the Application of Contactless Tourism Services in Island Fishing Villages under Digital China—Take Sanya West Island as an Example. Master’s Thesis, Hainan Tropical Ocean University, Sanya, China, 2023. (In Chinese). [Google Scholar]
  58. Kwon, J.; Lim, K. Using Kano model to understand an effect of specialization and perceived risk on demand for services in marine tourism. Sustainability 2023, 15, 11180. [Google Scholar] [CrossRef]
  59. Lu, M.Y. Reflection and development path analysis of China’s marine culture industry. Mar. Econ. China 2022, 7, 159–180. (In Chinese) [Google Scholar]
  60. Wang, Z.H.; Zhou, Y.D.; Huang, B.; Wang, Z.M.; Xu, K.D. Grey system theory analysis of Zhoushan recreational fishery economic development. China Fish. 2022, 9, 59–64. (In Chinese) [Google Scholar]
  61. Zhou, Y.D.; Wu, F.X.; Zhang, H.L.; Xu, K.D.; Zhu, W.B.; Wang, Z.M.; Wang, Z.H. Comparative analysis of economic efficiency of experiential recreational fishery in Zhejiang Province. J. Zhejiang Ocean Univ. 2020, 39, 59–64. (In Chinese) [Google Scholar]
  62. He, Z.G. Management strategy based on experiential recreational fishing. Hunan Feed. 2013, 5, 27–29. (In Chinese) [Google Scholar]
  63. Zhang, L.; Yu, Y. Analysis of the development status of recreational fisheries in Dalian based on tourist satisfaction. Agric. Technol. 2020, 40, 154–156. (In Chinese) [Google Scholar]
  64. Ye, J.; Lai, P.D.; Deng, J.Y. Analysis on the development of recreational fisheries in Hailing Island from the perspective of consumer preferences. Agric. Dev. Equip. 2022, 10, 108–110. (In Chinese) [Google Scholar]
  65. Liu, Y. Study on the Development Status, Potential and Countermeasures of Fuzhou Recreational Fishery. Master’s Thesis, Jimei University, Xiamen, China, 2013. (In Chinese). [Google Scholar]
  66. Tang, X.M. Research on the Development of Recreational Fishery in Guangdong Province. Master’s Thesis, Guangdong Ocean University, Zhanjiang, China, 2016. (In Chinese). [Google Scholar]
Figure 1. Study area.
Water 15 03668 g001
Figure 2. Two-dimensional Kano model.
Water 15 03668 g002
Figure 3. Socio-demographic characteristics of tourists.
Water 15 03668 g003
Figure 4. Four-quadrant diagrams of Better–Worse index.
Water 15 03668 g004
Table 1. Service quality indicators and attributes in recreational fisheries.
Primary IndicatorsVariableSecondary Indicators and Attributes
TransportationN1Convenient transportation
N2Comfortable transportation
Food and AccommodationN3Catering with a wide variety and reasonable prices
N4Provide Fishery Specialty Catering
N5Sanitary and comfortable accommodation with reasonable prices
N6Accommodation facilities with fisherman characteristics
Marine fishery environmentN7Modernization and adequacy of infrastructure
N8Marine fishery environment is clean and hygienic
LandscapeN9Landscape preservation and maintenance state are intact
N10Landscape is unique and attractive
N11Reasonable arrangement of tourist routes
Fishing activitiesN12Rich and diverse fishing activities
N13Strong participation in fishing activities
N14Rich variety of tourist souvenirs/seafood specialties
Staff ServicesN15Friendly and enthusiastic staff
N16Strong staff handling skills
N17Equipped with dedicated instructors
SecurityN18Food safety and hygiene
N19Fishing experience activity safety
Table 2. Explanation of the five categories for service quality attributes in Kano model.
Attribute CategoryExplanation
Must-be quality attributes (M)Must-be qualities considers whether the product or service is complete [41]. While they do not contribute to customer satisfaction, their absence can cause a high level of dissatisfaction. They are sometimes referred to as basic expectations or basic attributes [43,46].
One-dimensional quality attributes (O)One-dimensional qualities refer to quality that is directly proportional to the level of satisfaction of consumers and vice versa. The level increases with the improvement of the quality of the product/service and vice versa [41]. The attributes are often referred to as performance characteristics [43] or linear properties [46].
Indifferent quality attributes (I)Indifferent qualities refer to the degree of customer satisfaction that does not affect satisfaction [39].
Attractive quality attributes (A)Attractive qualities are often referred to as exciting attributes [46] or motivational attributes [43]. They are unexpected [42,47] and are proportional to customer satisfaction. The absence of these qualities does not upset consumers because they are unforeseeable [48,49,50].
Reverse quality attributes IReverse qualities are those states that make consumers quite unsatisfied [39].
Questionable quality attributes (Q)Questionable qualities are those that indicate a contradictory or confusing response to a need [49].
Table 3. Comparison matrix of Kano quality attribute classifications.
Service Quality AttributesDysfunctional
DislikeLive-withNeutralMust-BeLike
FunctionDislikeQRRRR
Live-withMIIIR
NeutralMIIIR
Must-beMIIIR
LikeOAAAQ
Table 4. Reliability test results.
Cronbach α Coefficient of Function QuestionCronbach α Coefficient of Dysfunction Question
0.9810.985
Table 5. Validity test results.
KMO and Bartlett’s Test
Question ItemsFunction QuestionDysfunction Question
KMO value0.8470.880
Bartlett´s test of sphericityApproximate chi-square1728.6825097.688
df171171
p value0.0000.000
Table 6. Expert verification participants.
ParticipantsGenderAgeOccupation
AMale50’sProfessor of recreational fisheries research
BFemale20’sMaster’s degree in recreational fisheries research
CFemale30’sMaster’s degree in Marine pasture research
DMale40’sMarine environmental monitoring
EMale50’sMarine tourism
Table 7. Analysis results of the Better and Worse coefficients in Kano model.
Service IndicatorsAOMIRQBetter│Worse│Service Quality Attributes
N12068682843647.83%73.91%Must-be quality
N23664524802450.00%58.00%Indifferent quality
N34108523242457.14%81.63%One-dimensional quality
N44456247202851.02%40.82%Indifferent quality
N5492683242448.98%81.63%Must-be quality
N64852247242451.02%38.78%Indifferent quality
N72476445242451.02%61.22%Must-be quality
N8496643242451.02%81.63%Must-be quality
N92084485202050.98%64.71%Must-be quality
N104468206802456.00%44.00%Attractive quality
N1116104245602460.00%64.00%One-dimensional quality
N124064366042052.00%50.00%Attractive quality
N134068246082456.25%47.92%Attractive quality
N146044167682053.06%30.61%Attractive quality
N151284604442048.00%72.00%Must-be quality
N162472485642048.00%60.00%Indifferent quality
N173656288081646.00%42.00%Indifferent quality
N18096564442448.98%77.55%Must-be quality
N19092524882447.92%75.00%Must-be quality
Table 8. Expert ratings based on visitor satisfaction needs.
Service IndicatorsExpert AExpert BExpert CExpert DExpert EAverageRank
N1808275847879.8012
N2807878757076.2015
N3858880838584.208
N4758080787277.0014
N5706076838875.4016
N6706268607867.6019
N7858880868584.807
N8908892908589.003
N9859090929590.402
N10928286859087.005
N11706574658672.0017
N12849080808283.209
N13858088859085.606
N14706065658569.0018
N15808083858482.4010
N16758280857880.0011
N17857085708579.0013
N18858292909087.804
N19908890909590.601
Disclaimer/Publisher’s Note: The statements, opinions and data contained in all publications are solely those of the individual author(s) and contributor(s) and not of MDPI and/or the editor(s). MDPI and/or the editor(s) disclaim responsibility for any injury to people or property resulting from any ideas, methods, instructions or products referred to in the content.

