Article

Estimating Water Transparency Using Sentinel-2 Images in a Shallow Hypertrophic Lagoon (The Albufera of Valencia, Spain)

by
Juan V. Molner
1,
Juan M. Soria
1,*,
Rebeca Pérez-González
1 and
Xavier Sòria-Perpinyà
2
1
Cavanilles Institute of Biodiversity and Evolutionary Biology (ICBiBE), Universitat de València, 46980 Valencia, Spain
2
Image Processing Laboratory (IPL), Universitat de València, 46980 Valencia, Spain
*
Author to whom correspondence should be addressed.
Water 2023, 15(20), 3669; https://doi.org/10.3390/w15203669
Submission received: 20 September 2023 / Revised: 13 October 2023 / Accepted: 18 October 2023 / Published: 20 October 2023

Abstract

:
Water transparency, a crucial environmental indicator, was assessed during fieldwork via Secchi disk depth (ZSD) measurements. Three optical models (R490/R560, R490/R705, and R560/R705) were explored to establish a robust algorithm for ZSD estimation. Through extensive field sampling and laboratory analyses, weekly data spanning 2018 to 2023 were collected, including water transparency, temperature, conductivity, and chlorophyll-a concentration. Remote sensing imagery from the Sentinel-2 mission was employed, and the images were processed using SNAP 9.0 software. The R560/R705 index, suitable for turbid lakes, proved to be the most optimal, with an R2 of 0.6149 in calibration and 0.916 during validation. In contrast, the R490/R705 and R490/R560 indices obtained R2 values of 0.2805 and 0.0043 respectively. The algorithm calibrated in the present study improved the pre-existing algorithm, with an NRMSE of 17.8% versus 20.7% of the previous one for estimating the Secchi disk depth in the Albufera de Valencia, highlighting the importance of developing specific algorithms for specific water body characteristics. The study contributes to improved water quality assessment and resource management, underscoring the value of remote sensing in environmental research.

Graphical Abstract

1. Introduction

Water clarity is the first characteristic of water that humans perceive, related to water transparency and turbidity [1]. Water transparency could be defined as the extinction of light along the water column, conventionally estimated by Secchi disk depth (ZSD) [2]. Using this instrument, what is measured is the distance it travels vertically until it is no longer visible to the human eye [3,4], with this measurement being a good indicator of the depth at which sunlight penetrates the water [5].
An important symptom of eutrophication is a reduction in light penetration through the water column via elevated phytoplankton and sediment biomass [6], and it can profoundly affect photosynthesis and photorespiration [7]. Thus, ZSD is inversely related to the average amount of inorganic and organic material in the water [4].
One of the tools that has proven to be very useful in monitoring these variables is remote sensing [8], with water transparency or ZSD being one of the variables that is usually estimated using remote sensing data for monitoring water bodies [9]. In addition, ZSD is one of the variables that allows for the establishment of the trophic status of water bodies [10] and the ecological status according to the criteria of the Water Framework Directive [11].
Through remote sensing studies, it has been shown that water transparency decreases with increasing reflectivity in the red region of the spectrum due to light scattering by coarse suspended particles [1]. Furthermore, as mentioned by Caballero et al. [12], the near-infrared region is also sensitive to high concentrations of suspended solids.
In this sense, remote sensing data, with their ability to obtain a synoptic view and repetitive coverage with sensors calibrated to detect changes and observations at different resolutions, offer a better alternative for natural resource management compared to traditional methods [13]. However, work on water transparency by remote sensing has been scarce. Subsequently, Sentinel-2 arrived, an ESA mission consisting of the S2A and S2B satellites, which generate images with better spatial resolution (up to 10 m) and shorter revisit time (5 days) than previous satellites [14].
In this context, the “Ecological Status of Aquatic Systems with Sentinel Satellites” (ESAQS) project was approved in 2016, with the main objective of developing and validating algorithms for the estimation of ecological indicators of quality in inland waters, including chlorophyll-a [Chl-a] concentration, transparency, dissolved organic matter and suspended solids, from S2 images in different lakes and reservoirs of the Jucar basin [15].
In the framework of this project, Pereira-Sandoval et al. [15] developed an algorithm, based on the ratio between the reflectance at 490 nm and 705 nm, to estimate the ZSD in turbid waters with Sentinel-2 images, calibrated from data from the Albufera and different reservoirs in the Valencian community. Delegido et al. [16] obtained a new algorithm for obtaining the ZSD but this time, it was based on the ratio between the reflectance at 490 nm and 560 nm. Subsequently, Sòria-Perpinyà et al. [17] validated a preliminary algorithm to estimate the ZSD, based on the ratio between the reflectance at 560 and 705 nm, calibrated for the Albufera of Valencia from S2 images from 2017 only. However, with the progressive decrease in water clarity in the Albufera of Valencia due to the advance of eutrophication, the estimations of this algorithm deviate by 20% from the real values measured in situ.
Accordingly, with this line of research, the main objective of this study was to develop a new algorithm to estimate the Secchi disk depth (ZSD) in the Albufera lagoon, with the innovation of improving a previous algorithm and the purpose of contributing to the achievement of broader objectives related to the sustainable management of water resources and the conservation of aquatic ecosystems in the Albufera lagoon in a climate change context. This initiative is directly aligned with Sustainable Development Goal number 6 (SDG 6), which promotes the availability and sustainable management of water and sanitation for all.

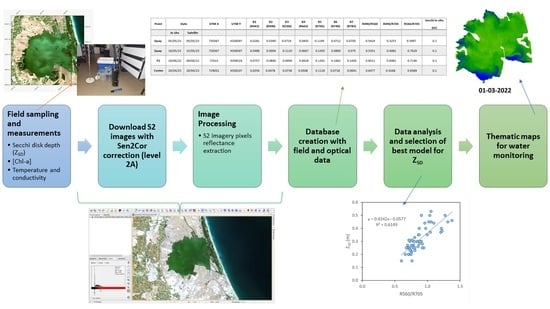
2. Materials and Methods
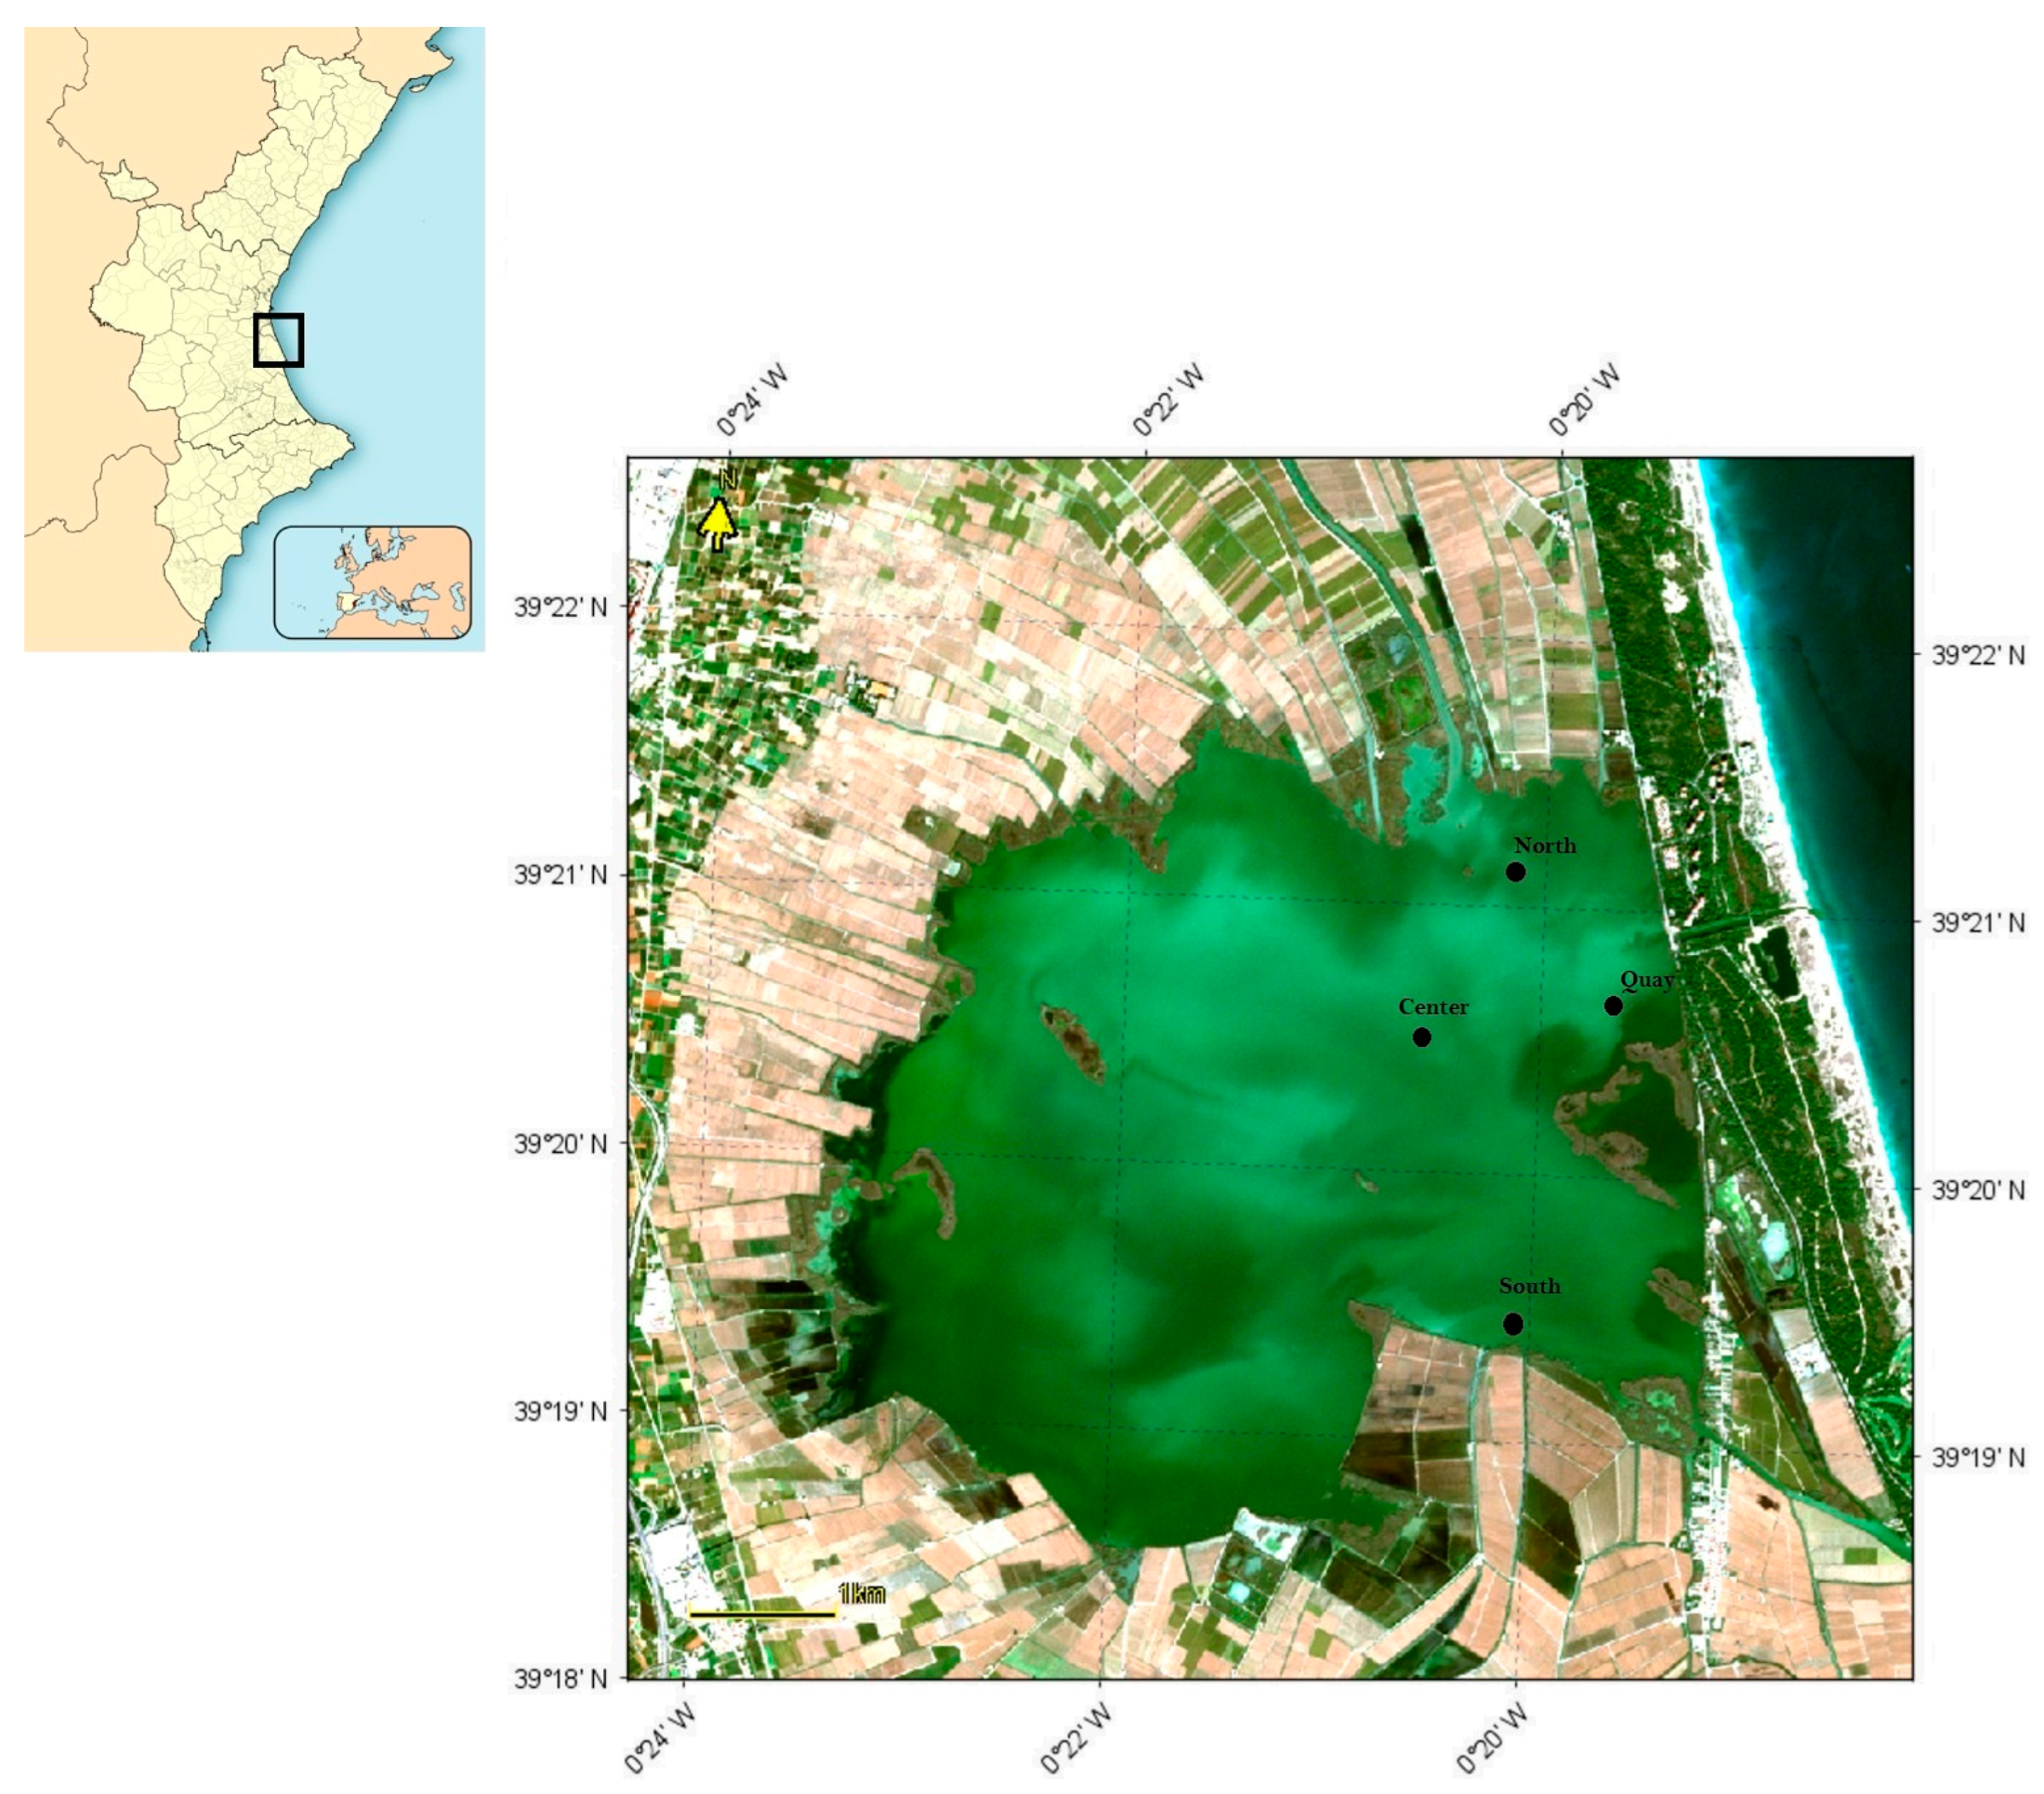
2.1. Study Area

The Albufera of Valencia is a Mediterranean coastal lagoon located at 39.335° N, −0.335° W, known for its oligohaline nature with a salinity of 1–2‰ and shallow depth of 1.2 m [18,19]. This unique environment boasts significant biodiversity and holds immense historical, cultural, and scenic value warranting conservation efforts. Recognized as the first natural park designated in the Valencian community in 1986, it also forms an integral part of the Natura 2000 Network, designated as a “Site of Community Importance” (SCI) since 2006, and has held the status of a “Special Protection Area for Birds” (SPA) since 1990.
The hydrological cycle of the lagoon is influenced by precipitation and regulated by the Albufera Drainage Board, which dedicates its management to the demands of the surrounding rice cultivation [19].
Nonetheless, beginning in the 1970s, the introduction of nutrients through the canals contributed to eutrophication processes. This led to an increase in phytoplankton biomass, a decline in water transparency, and ultimately the disappearance of macrophyte meadows [20,21,22]. Assessments by Onandia et al. [23] reveal that the lagoon exhibits an average chlorophyll-a concentration ([Chl-a]) of 167 μg/L (ranging from 4 to 322 μg/L), a Secchi disk depth (ZSD) of 0.34 m (ranging from 0.18 to 1.0 m), a total phosphorus concentration of 155 μg/L (ranging from 41 to 247 μg/L), and a total nitrogen concentration of 3.9 mg/L (ranging from 1.8 to 6.6 mg/L).
According to Romo et al. [24], the lagoon has notably transitioned into a turbid phase as conceptualized within Scheffer et al. [25]’s model of alternative states. Eutrophication emerges as the key factor driving this shift, attributed to the influx of nutrients through irrigation channels [21]. Consequently, this has resulted in pronounced degradation of the wetland area [25].

2.2. Sampling and Laboratory Methods

During July and August 2018, July and November 2021, in the period between March and December 2022, and between February and May 2023, weekly sampling was carried out in the Albufera of Valencia lagoon. During days with favorable weather conditions, boat trips were made to obtain samples at four specific points of the lake: the “North”, “Center”, “South”, and “Quay” (Figure 1). In addition, other points, such as P1 and P2, were sampled on occasion, depending on sampling interests.
These samplings were scheduled to coincide on dates close to the acquisition of images by the S2A satellite, with a temporal difference of no more than 3 days, following the method proposed by Kutser [26]. During field sampling, measurements of water transparency, temperature, and conductivity were performed, and samples were taken for subsequent calculation of [Chl-a] in the laboratory. Sampling was concentrated in these specific locations due to logistical complications associated with obtaining samples in the westernmost areas of the lagoon. Factors such as difficult access or the considerable time and financial cost associated with these areas limited the ability to conduct comprehensive sampling.
Water transparency was assessed by Secchi disk visibility depth, calculating the average between the depth at which the disk ceases to be visible from the surface and the depth at which it becomes visible again [27]. Water temperature and conductivity were measured using a portable handheld conductivity meter (Hanna Instruments, Smithfield, RI, USA). Water samples collected in the field were filtered using 0.47 mm Whatman GF/F glass fiber filters. Chl-a was extracted from the filtered samples using a solvent solution prepared with dimethyl sulfoxide and 90% acetone following the method of Shoaf and Lium [28]. The amount of extracted pigment was measured using a spectrophotometer (Beckman DU600, Beckman Coulter, Brea CA, USA), and the calculation methodology proposed by Jeffrey and Humphrey [29] was used to determine [Chl-a].

2.3. Remote Sensing Imagery

The images employed for this research were sourced from the database of the European Space Agency (ESA) S2 mission. This mission is executed by two satellites, denoted as S2A and S2B, both outfitted with a multispectral instrument (MSI) sensor. The MSI sensor captures the Earth’s reflected radiation across 13 distinct spectral bands (as detailed in Table 1), encompassing wavelengths from the visible spectrum to the near and shortwave infrared. These bands feature varying spatial resolutions of 10, 20, and 60 m [14].
Even though the primary objective of the mission was to investigate vegetation, urban areas, and terrestrial ecosystems, the newly introduced red edge bands, enhanced radiometric quality, and the high spatial resolution of the MSI sensor have proven highly valuable for the analysis of inland waters [17].
We utilized images from the years 2018, 2021, 2022, and 2023, sourced from the ESA Copernicus Open Access Hub portal. We carefully selected images devoid of cloud cover that corresponded to lagoon field data. Our selection focused on images with the Sen2Cor atmospheric correction (level 2A), known to provide optimal reflectivity results in eutrophic waters, as exemplified in the case of the Albufera of Valencia [17,30]. A total of 21 images were considered suitable for subsequent analysis, comprising 5 from 2018, 3 from 2021, 9 from 2022, and 4 from 2023.
The processing of the selected 21 images was executed using Sentinel Application Program (SNAP 9.0) software (Brockmann Consult, Hamburg, Germany). Given the diverse resolution requirements of algorithms utilized in subsequent phases, it was necessary to resample the images to a 10-m resolution through the interpolation tool integrated within SNAP 9.0. Consequently, we calculated reflectivity for each sampling point using a 3 × 3 pixel grid [26], utilizing the first seven bands of S2A (B1 to B7).

2.4. Algorithm Retrieval

To calibrate the algorithms, first, optical models must be selected from which to perform operations with the S2 spectral bands and correlate these with the field data to develop an algorithm to validate them. These models are based on the way in which solar radiation reflects on the water surface depending on the substances it contains (phytoplankton, suspended inorganic material, and dissolved organic matter), since each of them scatters and reflects light differently [31].
When estimating Secchi disk depth, it is essential to recognize that transparency and other variables like chlorophyll-a and turbidity are inversely related. The impact of turbidity on the light intensity of water bodies is observable across the entire spectrum due to the absorption caused by optically active elements like chlorophyll-a, colored dissolved organic matter (CDOM), and other compounds [31]. The models selected to estimate the ZSD in the previous studies (Table 2) were R490/R560, R490/R705, and R560/R705, so we need to understand the optical behavior of each of these bands.
In the blue band (R490), the main phenomenon is the reflectivity of water, which decreases with the presence of suspended matter [34]. Then, in the green band (R560), there is minimum absorption of the combination of photosynthetic pigments [35], suspended particles, and CDOM [36]. Finally, in the red band (R705), [Chl-a] has a reflectivity peak at 700 nm, which will be higher with the higher its concentration, related to light scattering and absorption by phytoplankton [37] and its fluorescence maximum at 683 nm [38]. However, the impact of pigments is minimal at 705 nm, where the primary phenomenon is the backscattering caused by phytoplankton [35]. This is also influenced by near-infrared scattering originating from suspended particles, even though water absorption continues within this wavelength band [12].
Following the completion of image processing and the calculation of mean values for each spectral band at every sampling point, these outcomes were utilized in conjunction with an Excel spreadsheet (Microsoft Corporation, Redmond, WA, USA). This allowed for the execution of the required operations using the pre-selected model. Some figures were generated using R 4.2.1 and RStudio 2023.06.2+561 (PBC, Boston, MA, USA).
Outliers were subsequently eliminated, and 70% of the data was randomly allocated for the calibration process, with the remaining 30% preserved for validation purposes. Throughout the model calibration phase, a linear regression analysis was conducted between each optical model and the ZSD data obtained during field measurements. The calculation of Pearson’s coefficient of determination (R2) was performed, and the equation of the regression line was established. This equation indicates the adjusted algorithm, which will subsequently be used for validation purposes.

2.5. Data Analysis

Once the algorithm with the highest R2 was selected, and its validity in the estimations was evaluated by means of a new linear regression between the values estimated by this algorithm for ZSD and the data obtained in the field. It was plotted on a 1:1 graph, and the p-value and the root mean square error (RMSE), normalized root mean square error (NRMSE), mean absolute error (MAE), and normalized mean absolute error (NMAE) were calculated. In addition, thematic maps of ZSD were generated by applying the validated equation to 4 of the 21 cloud-free images of the period considered using SNAP 9.0 software to show the spatiotemporal evolution of the lagoon. Finally, a boxplot was generated that compares the values of all the pixels of the processed images corresponding to the Albufera lagoon with the mean of these pixels, as well as with the mean of the points sampled in the field.

3. Results

3.1. Field and Laboratory Data

The average temperature recorded was 23.3 °C, ranging from 11.5 °C at the “quay” point on 4 April 2022 to 30.3 °C on 11 July 2022, also at the same point. The standard deviation of the temperature was 5.8 °C. For conductivity, the average was 1870 µS/cm, with a range that varied between 1031 µS/cm on 10 May 2022, at the “P1” point and 3040 µS/cm at the “north” point on 15 July 2018. The standard deviation was 575 µS/cm.
Regarding the ZSD, an average of 0.31 m was observed, with it fluctuating between 0.15 m on 5 May 2023, at the “quay” point, and on 16 May 2023, at the “north”, “quay” and “P2” points, and 0.55 m on 15 July 2018, at the “P1” point. The standard deviation was 0.09 m.
Regarding chlorophyll-a concentration, a mean value of 164.3 mg/m3 was obtained, with a range that varied between 21.0 mg/m3 detected on 20 April 2022, at the “south” point, and 376.0 mg/m3 detected on 6 June 2022, at the “center” point. The standard deviation was 88.5 mg/m3, indicating high spatiotemporal variability in the values.

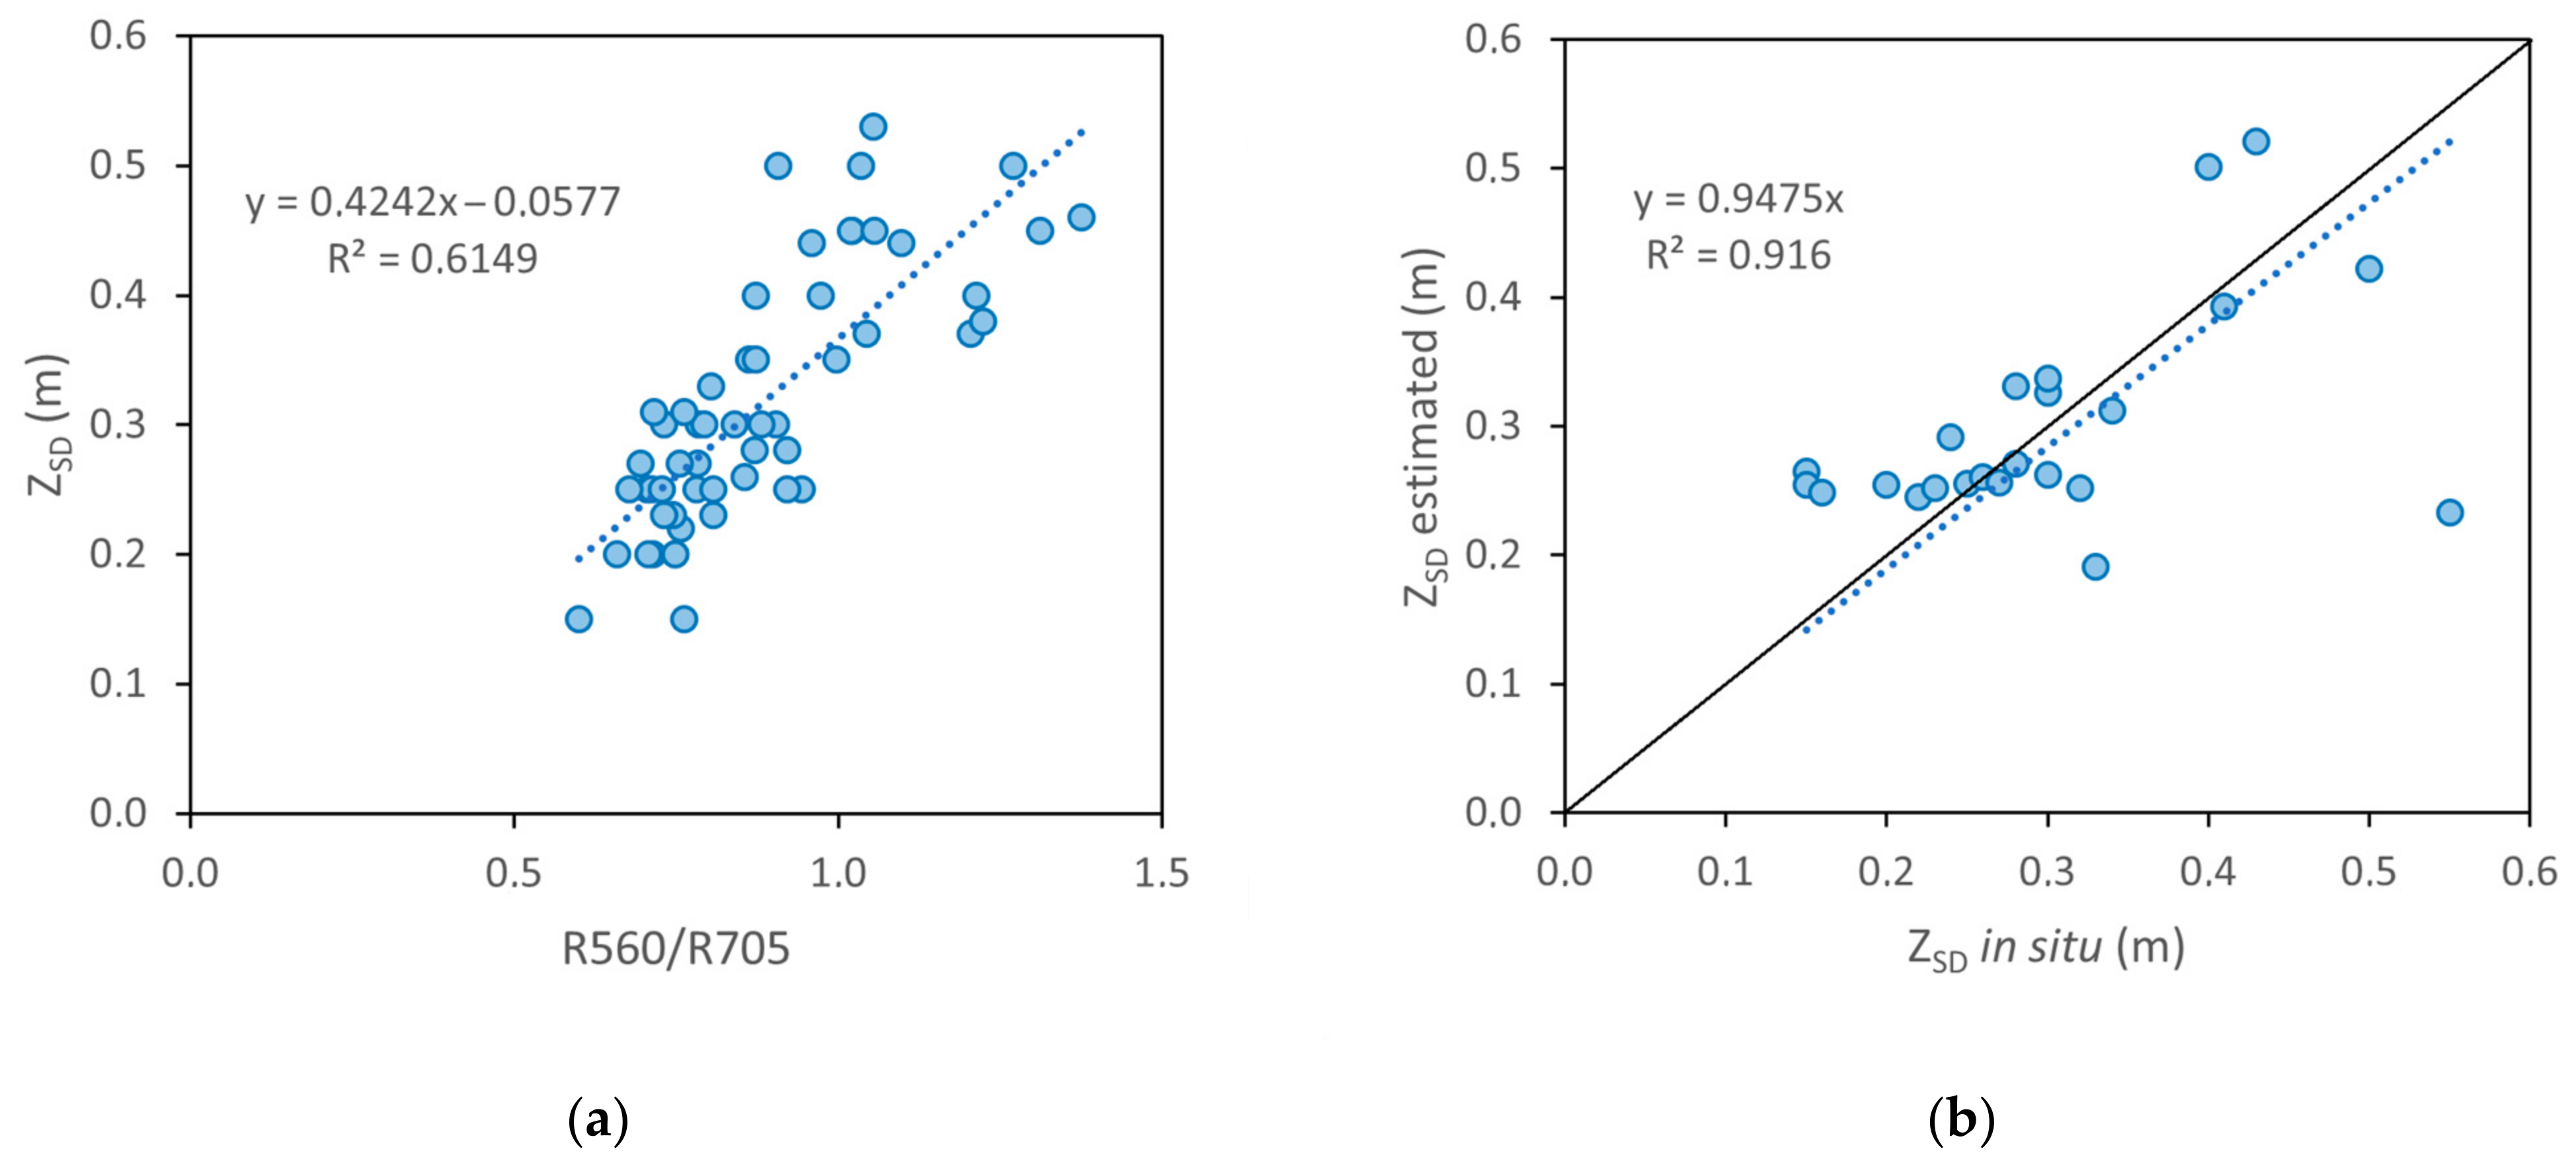
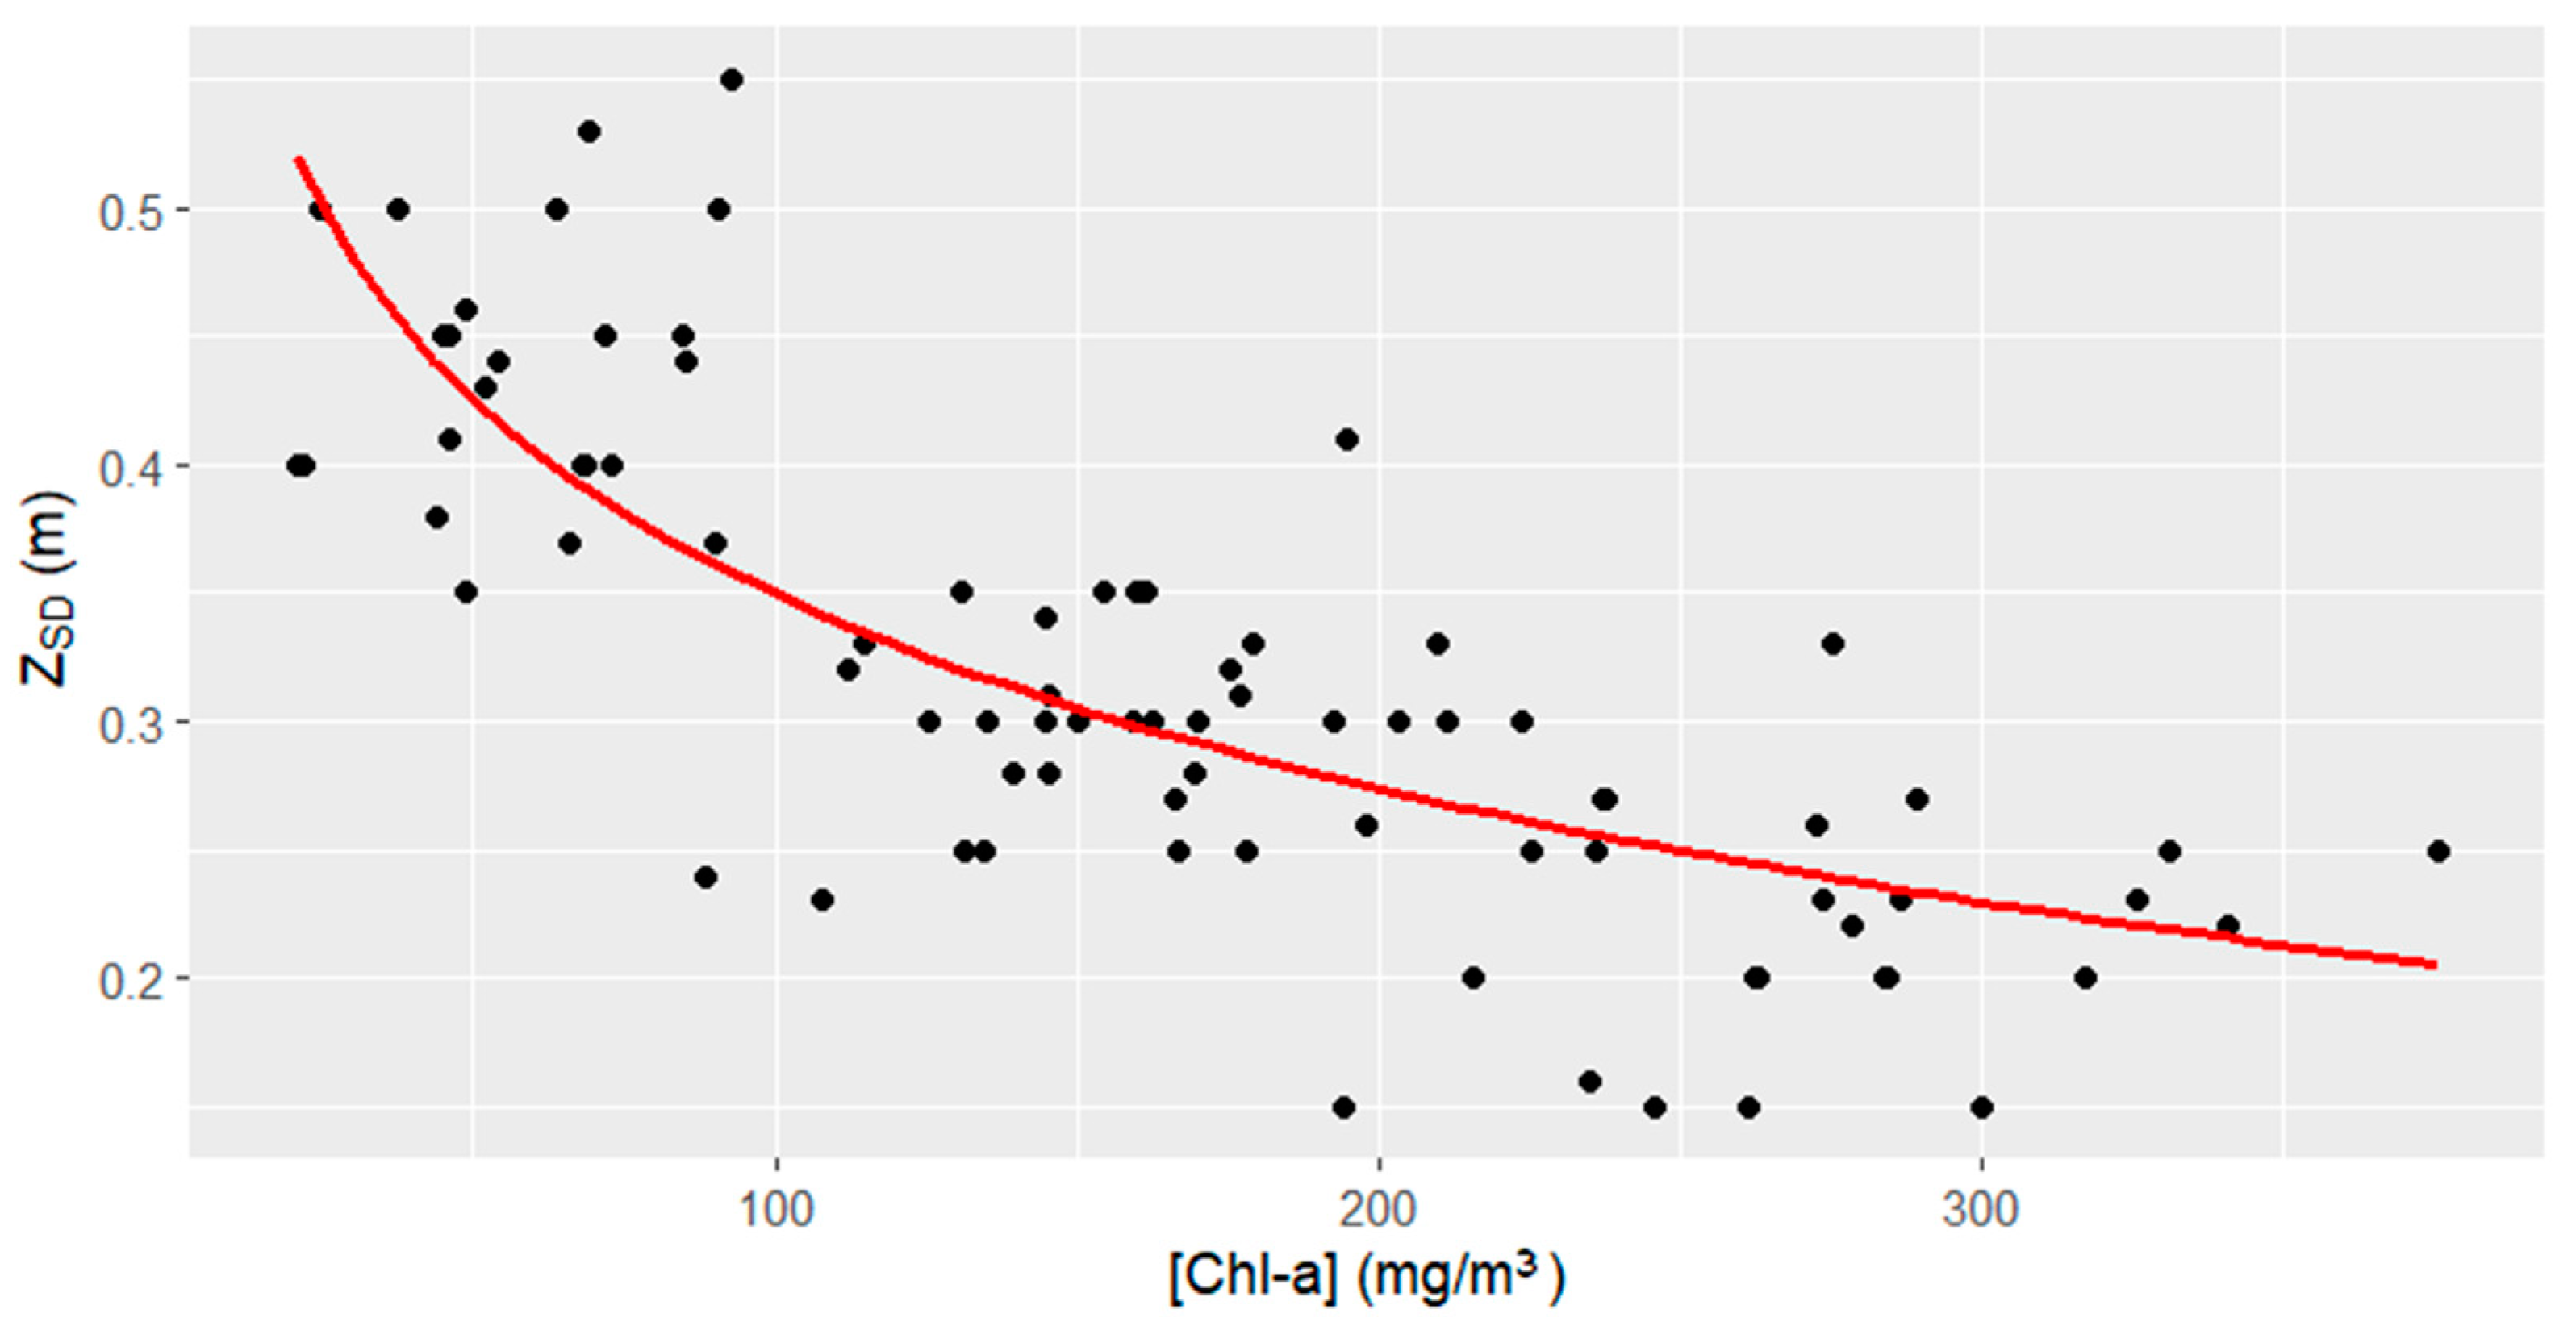
3.2. Algorithm Retrieval and Validation

Table 3 shows the equations resulting from the calibration of the models for the ZSD variable. The equation that was selected due to its high correlation coefficient is the first one.
In the table above, we observe how the R490/R560 model, which was originally designed for clear water does not reach an R2 greater than 0.1. The R490/R705 and R560/R705 models, which are more suitable for more turbid waters, obtain higher values of this statistic. The R560/R705, which has the highest value, as shown in Figure 2, where the graphs of the calibration and validation of the selected algorithm, are presented. As we can see in Figure 2a, a coefficient of determination of 0.6149 was obtained in the calibration and 0.916 in the validation with the field data (Figure 2b), showing a clear correlation between the estimated and field data. A p-value < 0.001 was obtained.
Therefore, the equation obtained for the estimation of the ZSD in the Albufera using the S2 images is as follows:
ZSD (m) = 0.4242 × R560/R705 − 0.0577
Table 4 shows the statistics compared with the previous algorithm, obtained from the 2017 Albufera ZSD data, and that of the present study, obtained with data from 2018 to 2023. In both cases, errors were calculated from estimations made for images from 2018 to 2023.
Therefore, the algorithm developed in the present study has demonstrated its validity for estimating the ZSD (m) of the Albufera of Valencia, reducing the RMSE in its estimations to below 20%, thus proving to be more accurate than the previously developed algorithm.

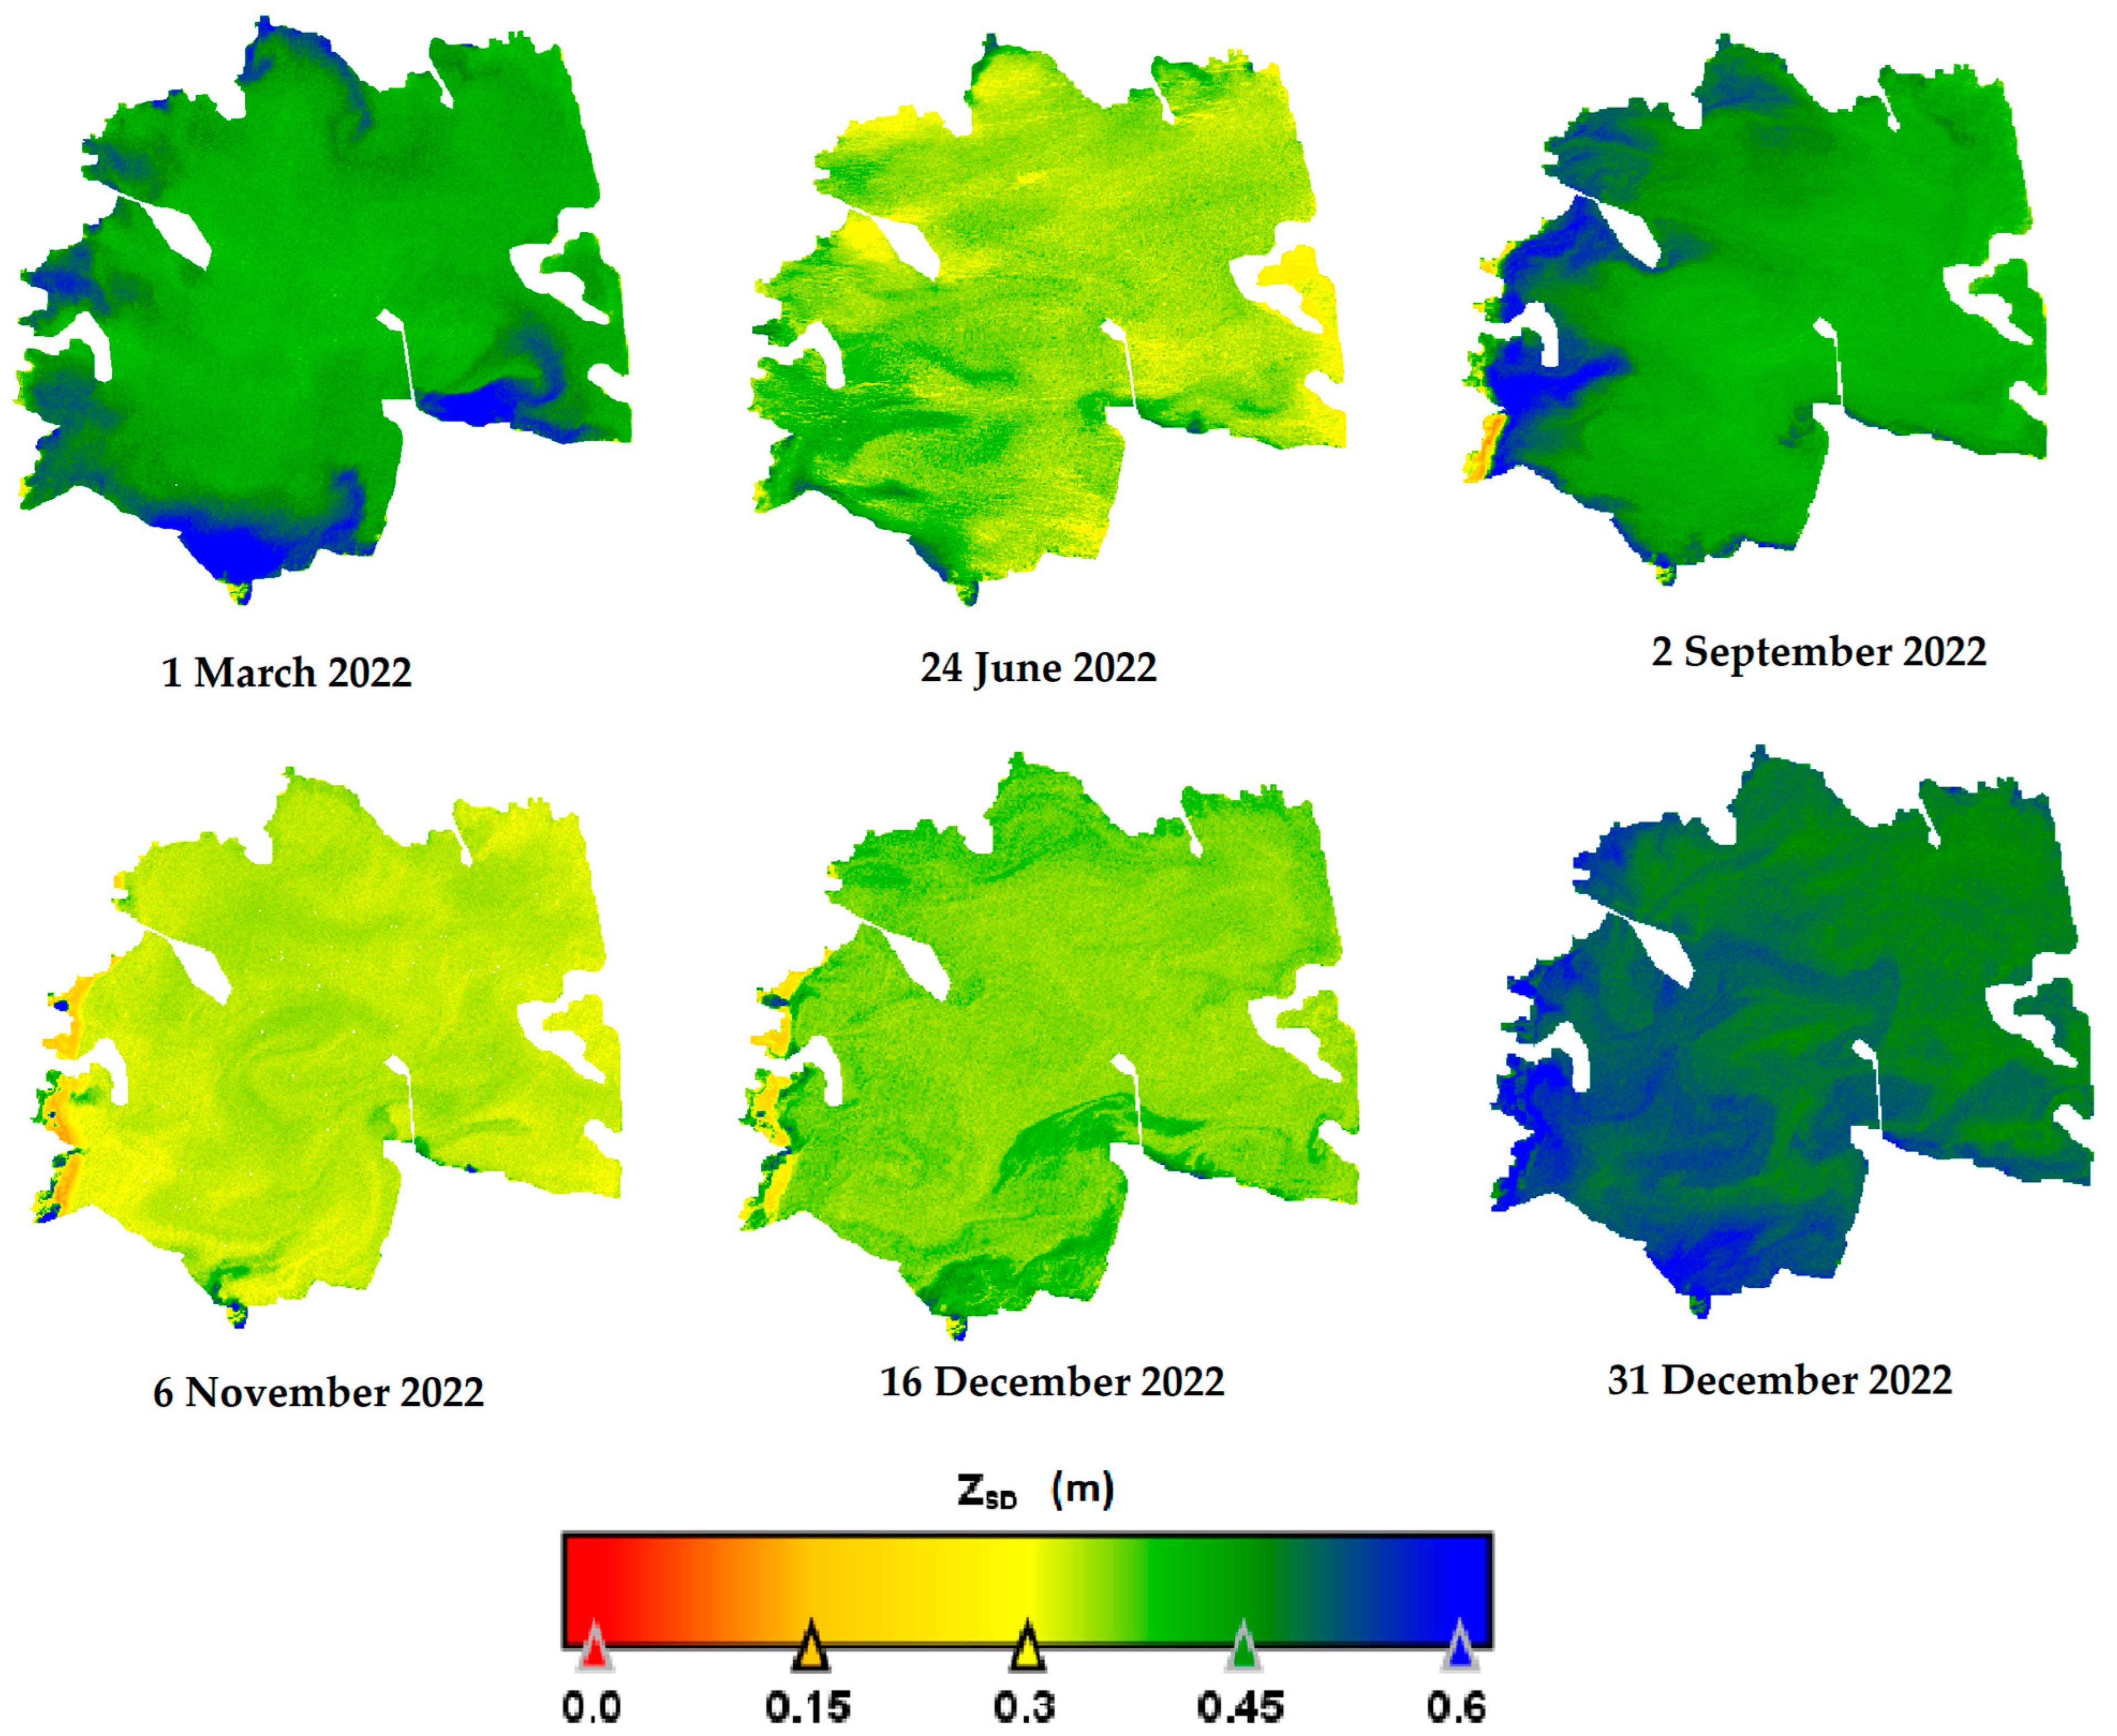
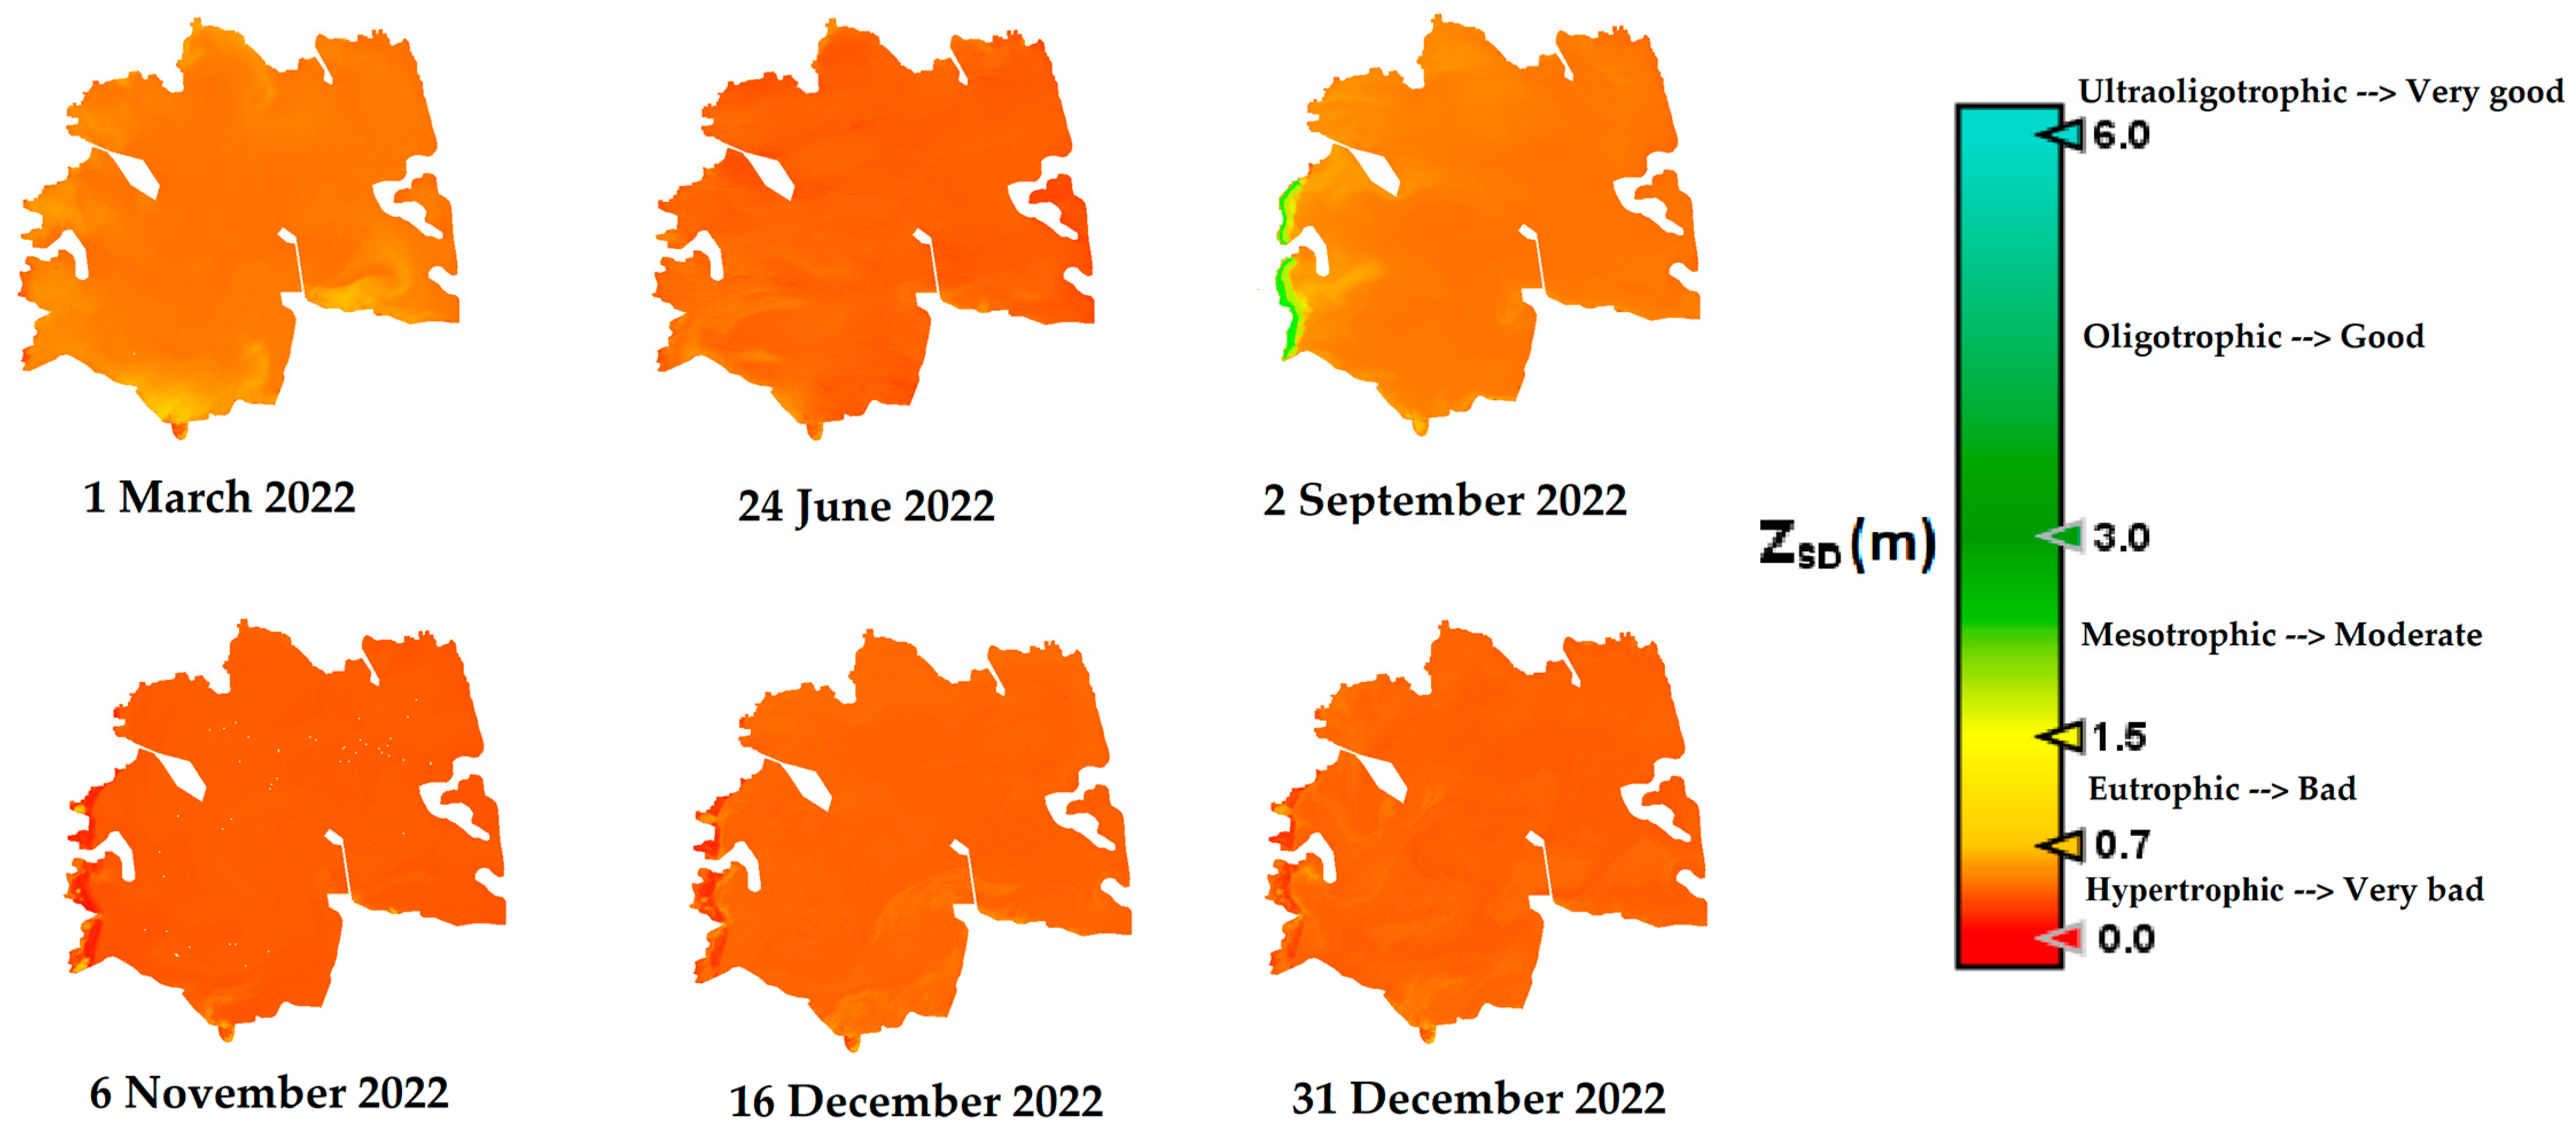
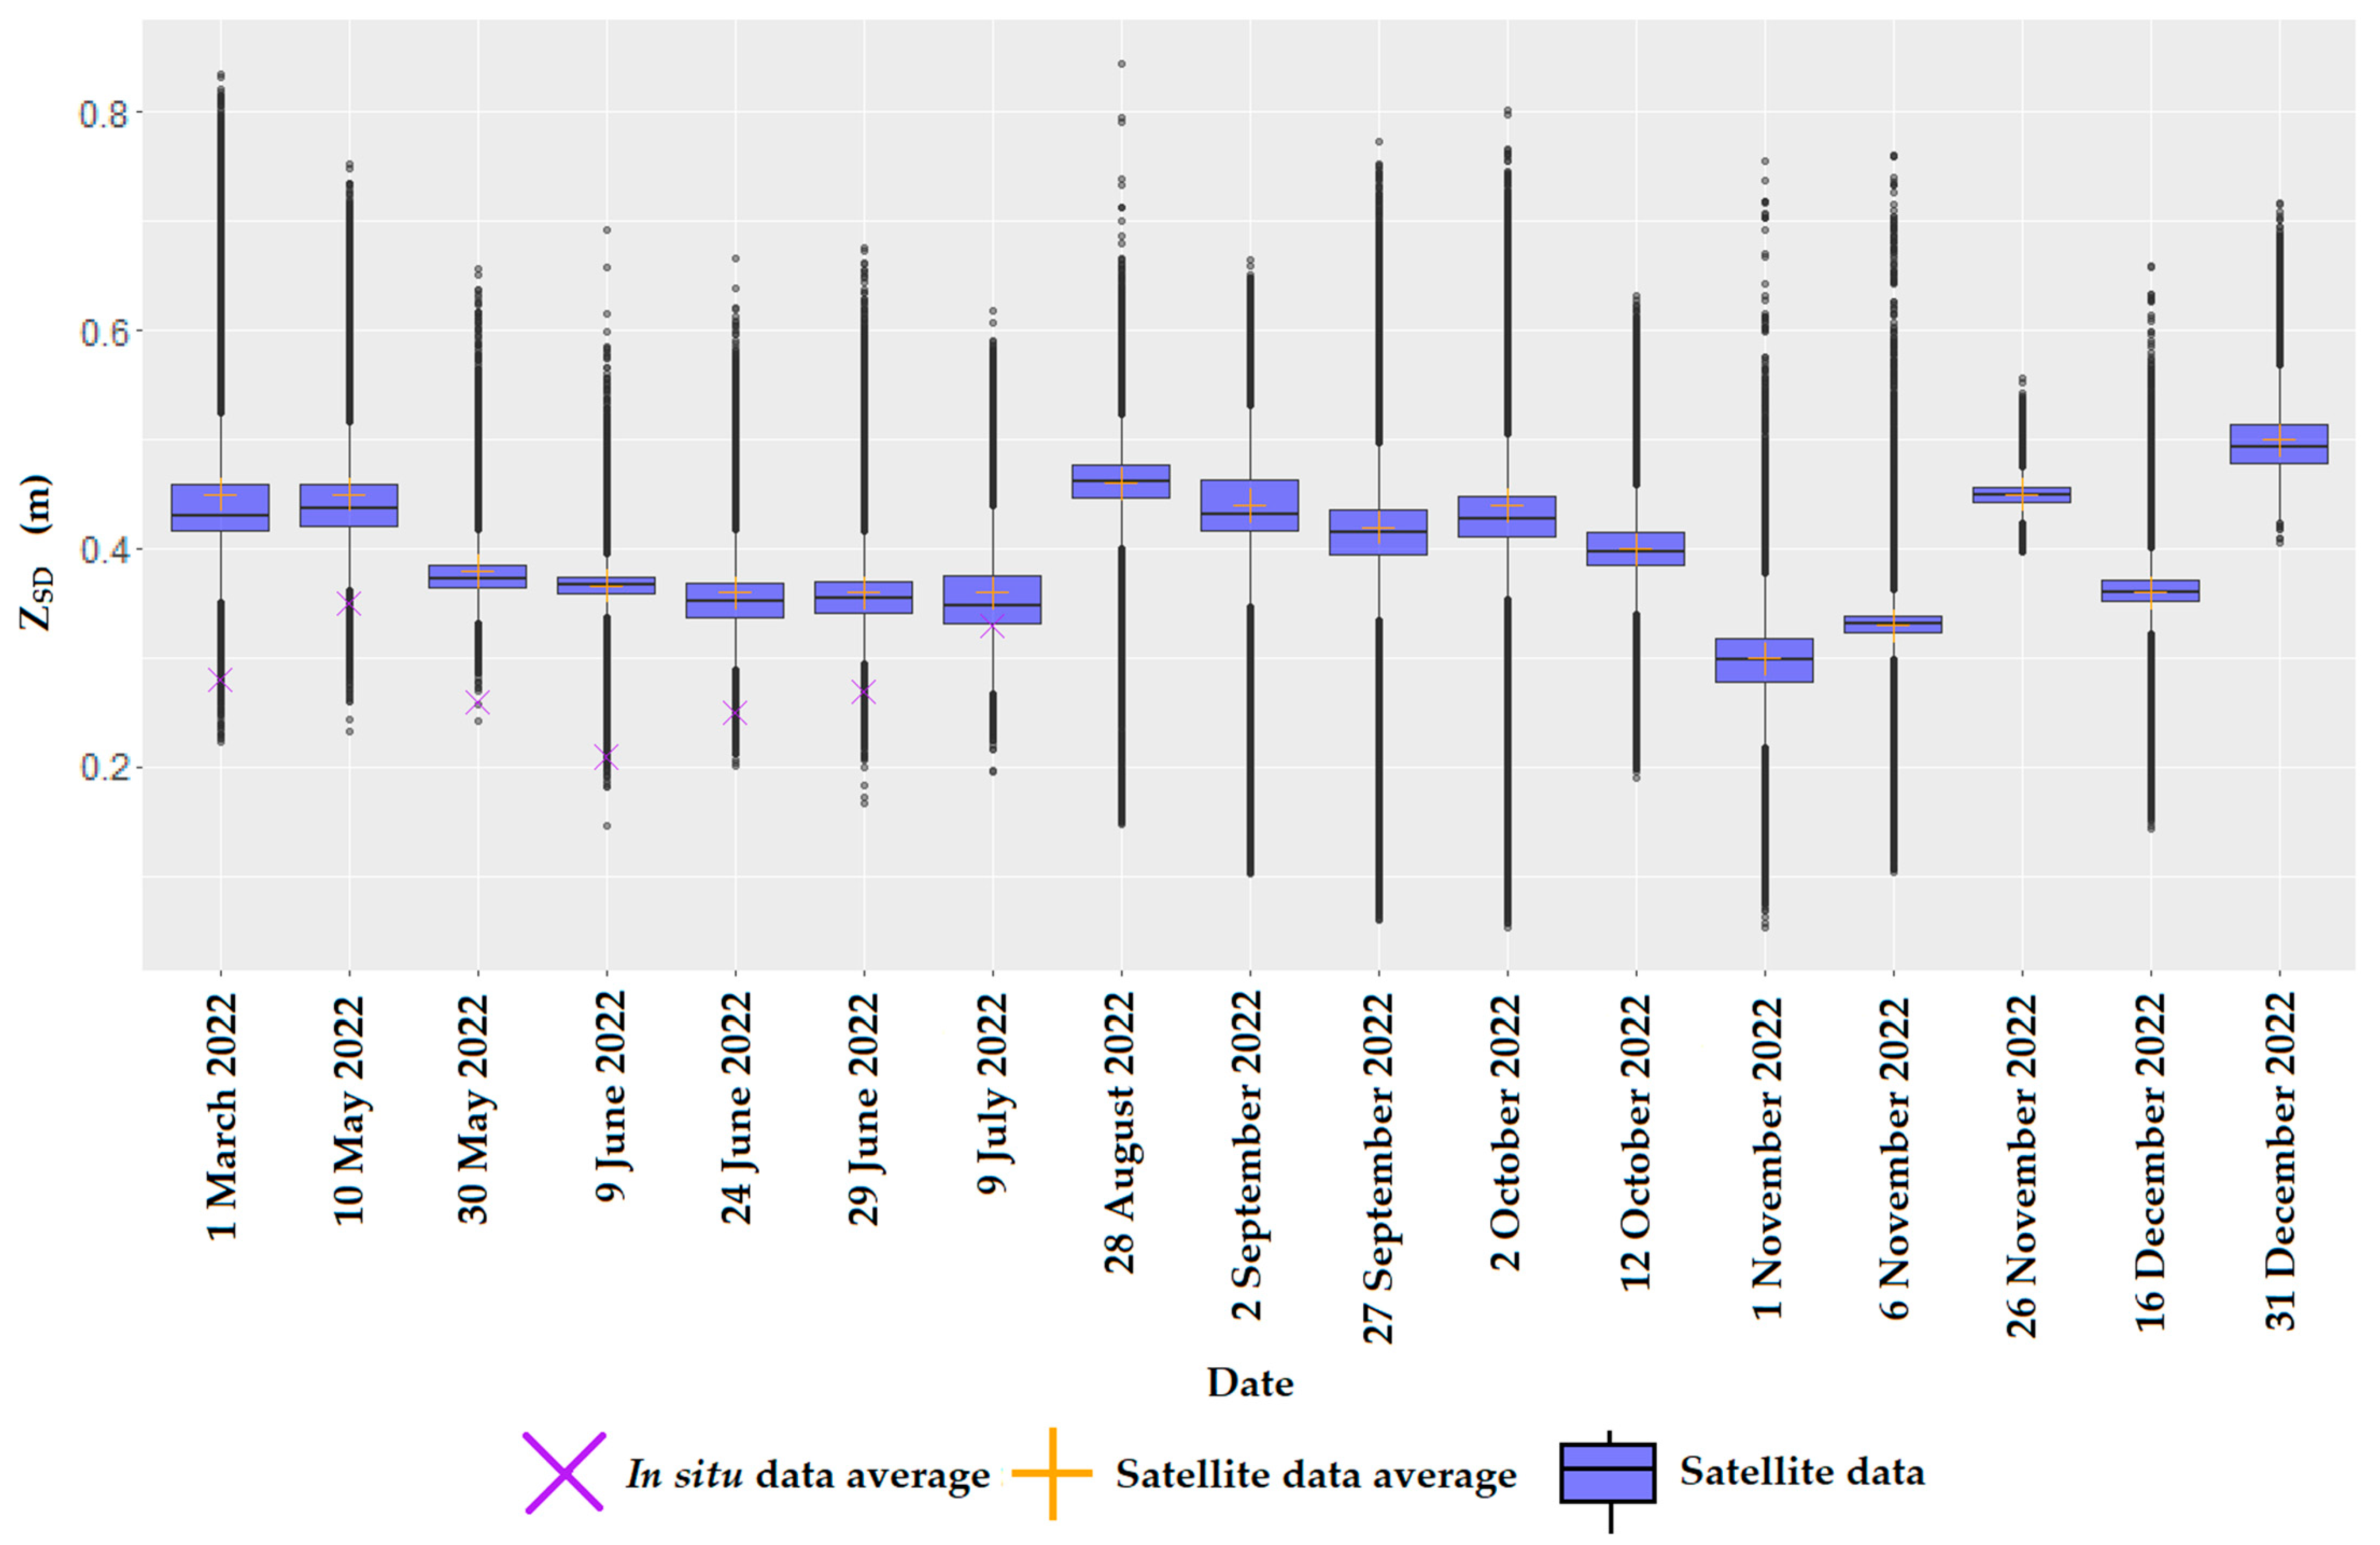
3.3. Thematic Maps and Annual Monitoring

Applying Equation (1) derived in the present study, we analyzed images representing the study period (2018−2023). By processing them, we generated thematic maps illustrating the evolution of the variable under study (Figure 3). Additionally, a boxplot was generated which compares the values of all the pixels of the processed images corresponding to the Albufera lagoon with the mean of these pixels, as well as with the mean of the points sampled in the field during the year.
Figure 3 presents maps of ZSD at key moments in 2022, exposing its seasonal variation. Lower ZSD values, associated with periods of higher chlorophyll-a, indicate lower transparency. In contrast, increases in ZSD are related to decreases in chlorophyll-a, highlighting the inverse relationship between these variables throughout the year.
As we can observe in Figure 3, the highest ZSD values are observed between January and March, when water clarity increases due to the reduced chlorophyll-a concentration resulting from the drainage of rice fields at the end of winter. These water inputs to the lagoon and the opening of floodgates intensify aquatic renewal. From May to June, there is decreasing transparency due to the first seasonal peak of chlorophyll-a, which is due to the decrease in the renewal rate due to rice water inputs during planting and the closing of floodgates that connect to the Mediterranean Sea.
During the end of summer, transparency increases again, coinciding with the second annual minimum amount of chlorophyll-a due to nutrient depletion, starting at the shores, where the water volume is lower, expanding later towards the center. In this zone the transparent water extends through a narrow band that allows observation of the bottom and corresponds to an oligotrophic zone of brief extension and duration.
Between November and the beginning of December, water clarity decreases again due to the increase in algal turbidity due to the contribution of nutrient waters from the rice field, which is flooded as a wetland. This process begins on the shores and spreads towards the interior of the lagoon. At the end of December, the water clarity increases again to return to the initial situation.
Following the OECD criteria according to Vollenweider and Kerekes [10] adapted by the WFD [39], the determination of the trophic state of the lagoon can be based on the ZSD as an indicator of water quality. Figure 4 illustrates the evolution of the trophic state along the series of thematic maps presented previously in Figure 3. It was observed that the Albufera predominantly exhibits a hypertrophic state in most of its points throughout the year, indicating a very poor ecological status according to the WFD [39]. Some points with a slightly eutrophic state are identified in certain locations, mainly in the southeast and during brief times during the end of summer and winter, when the water clarity is greater can be mesotrophic. However, the water quality in the Albufera, according to the water transparency, always achieves a bad or very bad status.
This inverse relationship between chlorophyll-a concentration and water transparency (ZSD) observed throughout the annual cycle is confirmed in Figure 5, which shows a logarithmic regression between ZSD and chlorophyll-a (Chl-a) concentration, with a coefficient of determination (R2) of approximately 0.6, indicating a significant correlation. The statistical significance of these results, supported by a p-value of less than 0.01, underlines the robustness of this association.
Figure 6 reveals a discrepancy between the average transparency of the points sampled in the field and the average of the pixels of the satellite image, calculated through the formula derived from the correlation of the measurements at these sampling points with the reflectivity captured by the satellite. This observation corroborates what is illustrated in the thematic maps in Figure 3, where it is evident that the areas corresponding to the sampling points in the lagoon (see Figure 1) exhibit lower transparency compared to the areas on the western and southern shores, which have higher transparency than the areas located in the north, center, and east of the lagoon. This disparity explains the wide range of ZSD values recorded in the image pixels, whose variability is reflected in the extent of the boxplots in Figure 6 and shows the spatial heterogeneity of the lagoon on some dates.

4. Discussion

Starting with the mathematical adjustments of the algorithms for the ZSD variable, it is important to highlight the inadequacy of the R490/R560 model, calibrated by Mueller [32] and Giardino et al. [33] for very clear marine waters, in the context of the Albufera. This lagoon is characterized as hypertrophic, which implies the presence of high levels of nutrients and suspended matter in the water. Therefore, it is not surprising that this model does not work properly, since it was designed for very different marine environments in terms of transparency.
Likewise, the R490/R705 model, which has shown good results in previous studies in Nordic lakes, coastal areas of the Baltic Sea, and reservoirs of the Valencian community, does not obtain such a high coefficient in the study carried out in the Albufera. The difference lies in the fact that the previous studies covered a wide range of lakes, from oligo-trophic to eutrophic, while in the case of the Albufera, it is exclusively a hypertrophic lagoon. This distinction is relevant because of the differences in water composition and quality between these different types of water bodies, which affects the accuracy of the models.
One aspect to consider is the reflectivity of the water in the 490 nm band, which decreases with the presence of suspended solids and high turbidity values, a common phenomenon in the Albufera. Sebastiá-Frasquet et al. [34] highlighted this fact in their study, which explains why models based on the R490 band as a numerator do not obtain good results in this lagoon. These results support the need to select more appropriate models for estimating ZSD in turbid and highly eutrophic waters such as the Albufera.
In the study carried out in the Albufera, the R560/R705 model, successfully calibrated for Finnish turbid lakes in the work of Koponen et al. [31], shows better coefficients, in agreement with the results obtained by Sòria-Perpinyà et al. [17]. The choice of this model is based on the similarity of the Albufera with the lakes where the original calibration was carried out, in terms of eutrophication. In addition, the use of the 560 nm band in this model is advantageous because in this band, there is a minimum level of light absorption by pigments, colored dissolved organic matter (CDOM), and suspended solids. This has been confirmed by previous studies such as those by Delegido et al. [35] and Gurlin et al. [36], who found less influence of absorption in the 560 nm band due to the presence of these components in water.
In addition, a reduction in the statistical error of the estimation values of the algorithm calibrated and validated in the present study was obtained compared to those obtained by the algorithm developed in the research of Sòria-Perpinyà et al. [17], with respect to the field data of the period 2018–2023. This discrepancy can be explained by two reasons. Firstly, it can be explained by the amount of data; in this study, we used data from the period 2018–2023, while the previous study only considered data from 2017. Secondly, this can be explained by the fact that the previous algorithm was calibrated based on in situ ZSD data collected in 2017 in the Albufera, which presented a range between 0.19 and 0.62 m with an average of 0.33 m, while in the present study, values between 0.15 and 0.52 m were obtained, with an average of 0.31 m. Consequently, it was concluded that water transparency in the Albufera experienced a marginal reduction during the period 2018–2023 compared to 2017, leading to a reduction in ZSD. This reduction has consequently contributed to a loss of accuracy for the previous algorithm in favor of the new one.
This result has several ecological implications. As shown in the present study, the future of the Albufera will be characterized by the load of suspended organic matter and the proliferation of phytoplankton. This eutrophication process will inevitably translate into reduced water transparency. This situation implies that the traditional phenomenon of clear phases in the lagoon, as reported by several studies such as Miracle and Sahuquillo [40], will inevitably decrease, with a direct impact on the dynamics and biodiversity of the aquatic ecosystem. It is imperative to address this paradigm shift with effective management strategies and environmental policies to preserve the integrity and functionality of the Albufera de Valencia.
In summary, as an evaluation of the progress achieved in this work, the algorithm developed in this study has demonstrated its usefulness in performing a diagnosis of the spatiotemporal evolution of the ecological state in the Albufera lagoon and thus in assessing the quality of its waters throughout the year. This underlines its potential and innovation as an ecological management tool for lake habitats within this protected area. Also, this work serves as a starting point for the assessment of water clarity in other eutrophic water bodies, such as reservoirs used for human consumption.
Nevertheless, despite the results reached with the algorithm developed in this study, which has reduced the estimation errors to less than 20% (an already acceptable margin), a slight improvement of approximately 3% was observed. On the one hand, this suggests that there is still a wide margin for optimization in the estimation of the ZSD in the coming years. This becomes particularly relevant in the context of a trend towards further eutrophication of the system, which will continue to lead to a progressive decrease in ZSD. Moreover, the reported differences between field values and estimates are largely due to logistical and temporal limitations in sampling. It is important to note that the lack of data in the western lagoon area, due to logistical constraints, may have contributed to these discrepancies. In addition, weather conditions limited sampling to a specific period between September and March.
In this sense, it is crucial for future work to focus on refining the estimates made in this study. First of all, starting with our study area, the Albufera de Valencia. Given the predicted trend of eutrophication of the system, which foresees a gradual decrease in the ZSD of the lagoon, together with the discrepancies observed between in situ means and estimated values due to spatial variability in different areas of the lake, it becomes crucial to consider several strategies. A first step would be to expand the data set or incorporate information with higher temporal resolution [41,42]. These approaches would not only improve the accuracy of the estimates but also provide a more robust basis for land management authorities.
In parallel with the improvement in the accuracy in the specific study of the Albufera of Valencia, broadening of the spectrum of applications of the algorithm conceived is envisioned. This expansion will be supported by machine learning techniques, which will allow more accurate classification of other water bodies, such as reservoirs, according to their trophic state (from oligotrophic to eutrophic) and optical characteristics. The most suitable technique for working with this type of image is with deep learning models using convolutional neural networks (CNNs) [43], as they better adapt to the architecture of satellite images, and with this, we can train a model focused on continental water bodies. This model should be based on the adjustment and validation of satellite and in situ data, from which complex patterns of reflectivity in different bands can be extracted with the aim of discerning between trophic states [44,45]. To evaluate these models, specific validation thresholds should be defined for each trophic state, ensuring robust validation of the algorithm’s performance in possible different scenarios [46]. These results can be useful and serve as an advanced tool for the monitoring and accurate classification of continental water bodies according to their ecological status. To this end, reflectivity in the R490 and R560 bands will be explored. In the case of bluer (more oligotrophic) reservoirs, calibration of a specific model based on the R490 band will be carried out. The applicability of the model will be evaluated using a predetermined validation threshold for class change. On the other hand, for reservoirs showing higher reflectivity in the R560 band (eutrophic), the validity of the algorithm previously calibrated for the Albufera in the present study will be tested.
Finally, focusing on the advantages of remote sensing over traditional methods, the selection of specific sampling points, as observed through the maps (Figure 3) and box plots (Figure 5), ultimately did not provide a meaningful and reliable representation of the variability of water quality in the Albufera. This highlights the superior capability of remote sensing as a tool for the comprehensive assessment of aquatic ecosystems [47]. As demonstrated in this study, remote sensing provides a holistic view of the spatiotemporal dynamics in water bodies such as the Albufera lagoon [22]. Its ability to collect continuous and extensive data over time allowed the detection of subtle variations in ZSD and their correlation with the evolution of the lagoon’s condition. In contrast, traditional point sampling methods would have been costly and limited in coverage, as demonstrated in the present study. This comprehensive approach improves our understanding of seasonal and spatial trends and provides important insights for environmental monitoring. These results highlight the critical role of remote sensing in the effective management of natural areas.

5. Conclusions

The results of this study highlight the inadequacy of the R490/R560 and R490/R705 models, originally designed for clear ocean waters and lakes of different trophic states, respectively, for estimating the ZSD in the Albufera, a hypertrophic lagoon with high levels of suspended solids and turbidity. In contrast, the R560/R705 model, calibrated for turbid lakes like the Albufera, presents better coefficients and a higher correlation between estimated data and field data. These results support the need to select appropriate models and consider the specific characteristics of water bodies when developing algorithms for estimating the ZSD. The final equation obtained in this study for estimating the ZSD in the Albufera is an improvement on the previous algorithm, with a higher coefficient of determination and a lower statistical error compared to the previous approach. However, future research should focus on achieving an even more substantial improvement in the estimation of ZSD in the Albufera of Valencia, given the continuing trend towards increased eutrophication and the observed differences in transparency between different zones. In parallel, a future extension of the study is proposed to train a deep learning model to determine water transparency in a wider range of water bodies, from oligotrophic to eutrophic. The study has contributed to a more accurate assessment of the water quality of the Albufera lagoon by improving the accuracy of water transparency estimations, highlighting the importance of remote sensing in trophic state studies. Finally, the application of remote sensing in this study has provided a broad perspective of the spatiotemporal variability of water transparency in the Albufera lagoon, as opposed to traditional sampling methods, and has demonstrated its potential as an environmental management tool.

Author Contributions

Conceptualization and methodology design, R.P.-G., J.V.M. and J.M.S.; field and laboratory work, X.S.-P. and J.V.M.; data curation, J.V.M. and J.M.S.; writing—original draft preparation, J.V.M.; writing—review and editing, R.P.-G., J.M.S. and X.S.-P. All authors have read and agreed to the published version of the manuscript.

Funding

REmote Sensing Spectroscopy for wetlands BIOdiversity (RESSBIO) is a Regional Government Scientific Project 2021 CIPROM/2021/049 with a grant for X.S.-P.

Data Availability Statement

Images are available through the ESA Copernicus Hub and the data presented are available from the corresponding author upon request.

Conflicts of Interest

The authors declare no conflict of interest.

References

  1. Matthews, M.W. A current review of empirical procedures of remote sensing in inland and near coastal transitional waters. Int. J. Remote Sens. 2011, 32, 6855–6899. [Google Scholar] [CrossRef]
  2. French, R.H.; Cooper, J.J.; Vigg, S. Secchi Disc Relationships. J. Am. Water Resour. Assoc. 1982, 18, 121–123. [Google Scholar] [CrossRef]
  3. Duntley, S.Q. The Visibility of Submerged Objects; Final Report to Office of Naval Research; Visibility Laboratory: Massachusetts Institute of Technology: Cambridge, MA, USA, 1952. [Google Scholar]
  4. Preisendorfer, R.W. Secchi disk science: Visual optics of natural waters. Limnol. Oceanogr. 1986, 31, 909–926. [Google Scholar] [CrossRef]
  5. Lee, Z.; Shang, S.; Hu, C.; Du, K.; Weidemann, A.; Hou, W.; Lin, J.; Lin, G. Secchi disk depth: A new theory and mechanistic model for underwater visibility. Remote Sens. Environ. 2015, 169, 139–149. [Google Scholar] [CrossRef]
  6. Testa, J.M.; Lyubchich, V.; Zhang, Q. Patterns and trends in Secchi disk depth over three decades in the Chesapeake Bay estuarine complex. Estuaries Coasts 2019, 42, 927–943. [Google Scholar] [CrossRef]
  7. Doron, M.; Babin, M.; Hembise, O.; Mangin, A.; Garnesson, P. Ocean transparency from space: Validation of algorithms using MERIS, MODIS and SeaWiFS data. Remote Sens. Environ. 2011, 115, 2986–3001. [Google Scholar] [CrossRef]
  8. Lindell, T.; Pierson, D.; Premazzi, G. Manual for Monitoring European Lakes Using Remote Sensing Techniques; Office for Official Publications of the European Communities: Luxembourg, 1999; p. 164. [Google Scholar]
  9. Olmanson, L.G.; Bauer, M.E.; Brezonik, P.L. A 20-year Landsat water clarity census of Minnesota’s 10,000 lakes. Remote Sens. Environ. 2008, 112, 4086–4097. [Google Scholar] [CrossRef]
  10. Vollenweider, R.A.; Kerekes, J. Eutrophication of Waters: Monitoring. Assessment and Control; OECD: Paris, France, 1982; p. 154. [Google Scholar]
  11. Alikas, K.; Kratzer, S. Improved retrieval of Secchi depth for optically-complex waters using remote sensing data. Ecol. Indic. 2017, 77, 218–227. [Google Scholar] [CrossRef]
  12. Caballero, I.; Roca, M.; Santos-Echeandía, J.; Bernárdez, P.; Navarro, G. Use of the Sentinel-2 and Landsat-8 Satellites for Water Quality Monitoring: An Early Warning Tool in the Mar Menor Coastal Lagoon. Remote Sens. 2022, 14, 2744. [Google Scholar] [CrossRef]
  13. Navalgund, R.R.; Jayaraman, V.; Roy, P.S. Remote sensing applications: An overview. Curr. Sci. 2007, 93, 1747–1766. [Google Scholar]
  14. European Spacial Agency (ESA). Sentinel-2: ESA’s Optical High-Resolution Mission for GMES Operational Services; Fletcher, K., Ed.; ESA Communications: Noordwijk, The Netherlands, 2012; p. 77. [Google Scholar]
  15. Pereira-Sandoval, M.; Urrego, E.P.; Ruiz-Verdu, A.; Tenjo, C.; Delegido, J.; Soria-Perpinya, X.; Vicente, E.; Soria, J.M.; Moreno, J. Calibration and validation of algorithms for the estimation of chlorophyll-a concentration and Secchi depth in inland waters with Sentinel-2. Limnetica 2019, 38, 471–487. [Google Scholar] [CrossRef]
  16. Delegido, J.; Urrego, P.; Vicente, E.; Sòria-Perpinyà, X.; Soria, J.M.; Pereira-Sandoval, M.; Ruiz-Verdú, A.; Peña, R.; Moreno, J. Turbidez y profundidad de disco de Secchi con Sentinel-2 en embalses con diferente estado trófico en la Comunidad Valenciana. Rev. Teledec. 2019, 54, 15–24. [Google Scholar] [CrossRef]
  17. Sòria-Perpinyà, X.; Urrego, E.P.; Pereira-Sandoval, M.; Ruiz-Verdú, A.; Soria, J.M.; Delegido, J.; Vicente, E.; Moreno, J. Monitoring Water Transparency of a Hypertrophic Lake (The Albufera of València) Using Multitemporal Sentinel-2 Satellite Images. Limnetica 2020, 39, 373–386. [Google Scholar] [CrossRef]
  18. Soria, J.; Vicente, E.; Miracle, M. The Influence of Flash Floods on the Limnology of the Albufera of Valencia Lagoon (Spain). Int. Ver. Theor. Angew. Limnol. Verh. 2000, 27, 2232–2235. [Google Scholar] [CrossRef]
  19. Soria, J.; Vera-Herrera, L.; Calvo, S.; Romo, S.; Vicente, E.; Sahuquillo, M.; Sòria-Perpinyà, X. Residence Time Analysis in the Albufera of Valencia, a Mediterranean Coastal Lagoon, Spain. Hydrology 2021, 8, 37. [Google Scholar] [CrossRef]
  20. Martín, M.; Oliver, N.; Hernández-Crespo, C.; Gargallo, S.; Regidor, M.C. The use of free water surface constructed wetland to treat the eutrophicated waters of lake L’Albufera de Valencia (Spain). Ecol. Eng. 2013, 50, 52–61. [Google Scholar] [CrossRef]
  21. del Barrio Fernández, P.; Gómez, A.G.; Alba, J.G.; Díaz, C.Á.; Cortezón, J.A.R. A model for describing the eutrophication in a heavily regulated coastal lagoon. Application to the Albufera of Valencia (Spain). J. Environ. Manag. 2012, 112, 340–352. [Google Scholar] [CrossRef] [PubMed]
  22. Martín, M.; Hernández-Crespo, C.; Andrés-Doménech, I.; Benedito-Durá, V. Fifty years of eutrophication in the Albufera lake (Valencia, Spain): Causes, evolution and remediation strategies. Ecol. Eng. 2020, 155, 105932. [Google Scholar] [CrossRef]
  23. Onandia, G.; Gudimov, A.; Miracle, M.R.; Arhonditsis, G. Towards the development of a biogeochemical model for addressing the eutrophication problems in the shallow hypertrophic lagoon of Albufera de Valencia, Spain. Ecol. Inf. 2015, 26, 70–89. [Google Scholar] [CrossRef]
  24. Romo, S.; García-Murcia, A.; Villena, M.J.; Sanchez, V.; Ballester, A. Phytoplankton trends in the lake of Albufera de Valencia and implications for its ecology, management, and recovery. Limnetica 2008, 27, 11–28. [Google Scholar] [CrossRef]
  25. Scheffer, M.; Hosper, S.H.; Meijer, M.L.; Moss, B.; Jeppesen, E. Alternative equilibria in shallow lakes. Trends Ecol. Evol. 1993, 8, 275–279. [Google Scholar] [CrossRef] [PubMed]
  26. Kutser, T. The possibility of using the Landsat image archive for monitoring long time trends in coloured dissolved organic matter concentration in lake waters. Remote Sens. Environ. 2012, 123, 334–338. [Google Scholar] [CrossRef]
  27. Wetzel, R.G.; Likens, G.E. Limnological Analyses, 3rd ed.; Springer: New York, NY, USA, 2000; p. 429. [Google Scholar]
  28. Shoaf, W.T.; Lium, B.W. Improved extraction of chlorophyll a and b from algae using dimethyl sulfoxide. Limnol. Oceanogr. 1976, 21, 926–928. [Google Scholar] [CrossRef]
  29. Jeffrey, S.T.; Humphrey, G.F. New spectrophotometric equations for determining chlorophylls a, b, c1 and c2 in higher plants, algae and natural phytoplankton. Biochem. Physiol. Pflanz. 1975, 167, 191–194. [Google Scholar] [CrossRef]
  30. Ruescas, A.B.; Pereira-Sandoval, M.; Tenjo, C.; Ruiz-Verdú, A.; Steinmetz, F.; Keukelaere, L.D. Sentinel-2 Atmospheric Correction inter-comparison over two lakes in Spain and Peru-Bolivia. In Proceedings of the Colour and Light in the Ocean from Earth Observation (CLEO), ESA-ESRIN, Frascati, Italy, 6–8 September 2016. [Google Scholar]
  31. Koponen, S.; Pulliainen, J.; Kallio, K.; Hallikainen, M. Lake water quality classification with airborne hyperspectral spectrometer and simulated MERIS data. Remote Sens. Environ. 2002, 79, 51–59. [Google Scholar] [CrossRef]
  32. Mueller, J.L. SeaWIFS algorithm for the diffuse attenuation coefficient, k(490), using water-leaving radiances at 490 and 555 nm. In SeaWiFS Postlaunch Calibration and Validation Analyses; BiblioGov: Columbus, OH, USA, 2000; Volume 3, pp. 24–27. [Google Scholar]
  33. Giardino, C.; Bresciani, M.; Cazzaniga, I.; Schenk, K.; Rieger, P.; Braga, F.; Matta, E.; Brando, V.E. Evaluation of multi-resolution satellite sensors for assessing water quality and bottom depth of lake Garda. Sensors 2014, 14, 24116–24131. [Google Scholar] [CrossRef] [PubMed]
  34. Sebastiá-Frasquet, M.-T.; Aguilar-Maldonado, J.A.; Santamaría-Del-Ángel, E.; Estornell, J. Sentinel 2 Analysis of Turbidity Patterns in a Coastal Lagoon. Remote Sens. 2019, 11, 2926. [Google Scholar] [CrossRef]
  35. Delegido, J.; Tenjo, C.; Ruiz-Verdú, A.; Peña, R.; Moreno, J. Modelo empírico para la determinación de clorofila-a en aguas continentales a partir de los futuros Sentinel-2 y 3. Validación con imágenes HICO. Rev. Teledetec. 2014, 41, 37–47. [Google Scholar] [CrossRef]
  36. Gurlin, D.; Gitelson, A.A.; Moses, W.J. Remote sensing of chl-a concentration in turbid productive waters—Return to a simple two-band NIR-red model? Remote Sens. Environ. 2011, 115, 3479–3490. [Google Scholar] [CrossRef]
  37. Morel, A.; Prieur, L. Analysis of variations in ocean color. Limnol. Oceanogr. 1977, 22, 709–722. [Google Scholar] [CrossRef]
  38. Smith, R.C.; Baker, K.S. Optical classification of natural waters. Limnol. Oceanogr. 1978, 23, 260–267. [Google Scholar] [CrossRef]
  39. Official Journal of the European Communities (OJEC). Directive 2000/60/EC of the European Parliament and of the Council of 23 October 2000 establishing a framework for Community action in the field of water policy. OJEC L 2000, 327, 1–73. [Google Scholar]
  40. Miracle, M.R.; Sahuquillo, M. Changes of life-history traits and size in Daphnia magna during a clear-water phase in a hypertrophic lagoon (Albufera of Valencia, Spain). Int. Ver. Theor. Angew. Limnol. Verh. 2002, 28, 1203–1208. [Google Scholar] [CrossRef]
  41. Yang, H.; Kong, J.; Hu, H.; Du, Y.; Gao, M.; Chen, F. A Review of Remote Sensing for Water Quality Retrieval: Progress and Challenges. Remote Sens. 2022, 14, 1770. [Google Scholar] [CrossRef]
  42. Chen, T.; Song, C.; Zhan, P.; Yao, J.; Li, Y.; Zhu, J. Remote sensing estimation of the flood storage capacity of basin-scale lakes and reservoirs at high spatial and temporal resolutions. Sci. Total Environ. 2022, 807, 150772. [Google Scholar] [CrossRef] [PubMed]
  43. Kiranyaz, S.; Avci, O.; Abdeljaber, O.; Ince, T.; Gabbouj, M.; Inman, D.J. 1D Convolutional Neural Networks and Applications—A Survey. arXiv 2019, arXiv:1905.03554. [Google Scholar] [CrossRef]
  44. Yu, L.; Wang, Z.; Tian, S.; Ye, F.; Ding, J.; Kong, J. Convolutional Neural Networks for Water Body Extraction from Landsat Imagery. Int. J. Comput. Intell. Appl. 2017, 16, 1750001. [Google Scholar] [CrossRef]
  45. James, T.; Schillaci, C.; Lipani, A. Convolutional Neural Networks for Water Segmentation Using Sentinel-2 Red, Green, Blue (RGB) Composites and Derived Spectral Indices. Int. J. Remote Sens. 2021, 42, 5338–5365. [Google Scholar] [CrossRef]
  46. Lei, F.; Yu, Y.; Zhang, D.; Feng, L.; Guo, J.; Zhang, Y.; Fang, F. Water remote sensing eutrophication inversion algorithm based on multilayer convolutional neural network. J. Intell. Fuzzy Syst. 2020, 39, 5319–5327. [Google Scholar] [CrossRef]
  47. Cheng, C.; Zhang, F.; Shi, J.; Kung, H.-T. What Is the Relationship between Land Use and Surface Water Quality? A Review and Prospects from Remote Sensing Perspective. Environ. Sci. Pollut. Res. 2022, 29, 56887–56907. [Google Scholar] [CrossRef]
Figure 1. Location of field sampling points in the Albufera lagoon. Sentinel-2 image date 1 November 2022.
Water 15 03669 g001
Figure 2. (a) Calibration of the R560/R705 model to estimate transparency in the Albufera and (b) Validation of the R560/R705 model for transparency in the Albufera.
Water 15 03669 g002
Figure 3. Thematic maps showing spatiotemporal variation of Secchi disk depth (ZSD) over six dates during 2022 in the Albufera lagoon.
Water 15 03669 g003
Figure 4. Thematic maps showing spatiotemporal variation of trophic state and its equivalence in ecological potential [10,39] over six representative dates during 2022 in the Albufera lagoon.
Water 15 03669 g004
Figure 5. Logarithmic regression between ZSD (m) and [Chl-a] (mg/m3) (R2 ≈ 0.6, p < 0.01).
Water 15 03669 g005
Figure 6. Graphical representation of the ZSD (m) values when applying the algorithm developed in this study. The blue boxes represent all pixels of the Albufera lagoon, the purple × symbol (in situ data average) indicates the mean values of the points sampled in the field, and the orange + symbol (satellite data average) represents the means of the pixels in each image.
Water 15 03669 g006
Table 1. Sentinel-2A spectral bands. Data from ESA [14].
BandSpectral RegionWavelength (nm)Spatial Resolution (m)
CentralWide
B1VisibleDeep blue4436060
B2Blue4901010
B3Green5601010
B4Red6651010
B5Red edge7052020
B67402020
B77832020
B8Near-infrared (NIR)84211510
B8a8652020
B99452060
B10Short wavelength infrared (SWIR)13802060
B1116109020
B12219018020
Table 2. Review of proposed models for estimating Secchi disk depth (ZSD) in inland and coastal waters. Own elaboration and mathematical models obtained from the cited bibliography.
ModelReferences
R490/R560Originally Mueller [32] and Giardino et al. [33]. Used by Delegido et al. [16] in reservoirs of the Jucar basin.
R490/R705Originally Alikas and Kratzer [11]. Employed by Pereira-Sandoval et al. [15] in the Albufera of Valencia and reservoirs of the Jucar basin.
R560/R705Originally Koponen et al. [31]. Sòria-Perpinyà et al. [17] in the Albufera of Valencia.
Table 3. Results of the calibration of the algorithms for the estimation of the Secchi disk depth in the Albufera. In the equations, “y” represents the ZSD, and “x” is the corresponding index. The selected index with a higher coefficient of determination is indicated with *.
IndexAlgorithmR2
R560/R705y = 0.4242x − 0.0577 *0.6149
R490/R705y = 0.3944x + 0.12460.2805
R490/R560y = −0.0455x + 0.34260.0043
Table 4. Comparative statistics of the validation of the algorithms developed in the present study and the previous study. Statistics were calculated from 2018−2023 field data.
AlgorithmRMSENRMSEMAENMAEReference of the Algorithm
y = 0.4242 × R560/R705 − 0.05770.07 m17.8%0.05 m13.37%This study
y = 0.224 × R560/R705 + 0.08360.08 m20.7%0.06 m14.92%Sòria-Perpinyà et al. [17]
Disclaimer/Publisher’s Note: The statements, opinions and data contained in all publications are solely those of the individual author(s) and contributor(s) and not of MDPI and/or the editor(s). MDPI and/or the editor(s) disclaim responsibility for any injury to people or property resulting from any ideas, methods, instructions or products referred to in the content.

