Article

Twenty-Eight Years of Plant Community Development and Dynamics in the Balize Mississippi River Delta, Louisiana, USA

by
David A. White
1,* and
Jenneke M. Visser
2
1
Department of Biological Sciences and Program in the Environment, Loyola University New Orleans, New Orleans, LA 70118, USA
2
Environmental Sciences, School of Geosciences, University of Louisiana at Lafayette, Lafayette, LA 70504, USA
*
Author to whom correspondence should be addressed.
Water 2023, 15(19), 3481; https://doi.org/10.3390/w15193481
Submission received: 22 July 2023 / Revised: 17 August 2023 / Accepted: 23 August 2023 / Published: 3 October 2023
(This article belongs to the Special Issue Aquatic Plant Ecology: Biodiversity and Ecological Processes)

Abstract

:
Deltaic landscapes go through cycles of birth, growth, decline, and death governed by intertwined geological, biological, and ecological processes. In this study, we tracked deltaic lobes in the Balize Mississippi River Delta, Louisiana, USA, over 28 years (1984–2012). Hydrologic and geomorphic patterns as well as sustained patterns of wetland plant richness, diversity, and biomass are described. Plant diversity and biomass were modeled by nMDS ordination. Taxa (53) were harvested and dried (116,706 g) from 965 (0.25 m2) plots and divided into three groups: I. four foundation species, corresponding to 78.9% of the total harvest; II. nine pioneer species, corresponding to 13.6% of the total harvest; and III. all other taxa, corresponding to 7.5% of the total harvest (eight miscellaneous grasses, eight miscellaneous sedges, and twenty-four miscellaneous herbs). Autogenic/allogenic processes (sedimentation, subsidence, plant colonization, and succession events) affected composition and biomass. Eleven important species were identified. Taxon richness increased on mudflats during primary succession (fifteen to twenty-five taxa per site), then declined to fewer than five taxa per site. The niche space theory explained patterns of community change, with a similar total biomass/yr (~500 g/m2/yr) at all study sites. Quantile regression analyses showed that the water quality and quantity of the Mississippi River influenced biomass, especially in springtime waters. Stochastic events (storms, herbivory, salt burn, and flood pulses) impacted biomass. Long-term studies like this are required in a future of climate unknowns.

1. Introduction

Deltaic lands are intriguing ecological environments comprising only 0.57% of the world’s land area [1]. Such lands are wetland ecotone environments between terrestrial and fully aquatic environments [2]. For such wet terrestrial ecosystems, primary plantsuccession begins with aerial biotic life on virgin mud substrates. Their vegetative life is forced, especially by abiotic filtering, as the ecosystem assembles (sensu lato [3,4]) into communities shaped by substrate feedback over an extended period of time. Delta environments are existentially water-driven [5] and especially dynamic because the life-supporting river’s qualities are far from static [6]. The details of how deltaic wetland plant communities are created, maintained, and even environmentally impacted by their river source are particularly relevant to their ecology [7,8,9]. Deltas are highly threatened [10]. Knowledge about the parameters central to their nature is important for their protection [8], and gaps in such knowledge represent a restorative impediment [7,9,10]. Humanity has generally impacted deltas in two opposing ways: by upstream deforestation, adding erosional sediment, and sediment deprivation by damming, which drives land loss [11]. However, a few of the largest deltas contribute to global net land gain [11]. Significant increases in river discharge also caused by human activities have had impacts [12] that continue to this day.
Many river deltas exist worldwide, both freshwater and coastal/estuarine [10]. Deltas form when sediments are dropped as a river’s water slows upstream from its terminus; more so in its receiving basin. Deltas can be defined using a suite of major abiotic attributes, including size, age, discharge, channel sinuosity, substrate quality, and elevation, all of which are seasonally and spatially variable. An obvious geological feature of deltas is that the dropped sediment creates land that is, at times, suitable for plant colonization to eventually form plant communities. Deltas vary considerably worldwide, but all have cycles with births, lives, and deaths dependent upon the geology of the local environment [13]. Delta plant communities support a food chain that the river translates into systems of high productivity. Beyond the overall ecological importance of deltas, humanity has ties to them. Deltas are buffers for coastal marine storms and transportation byways, and they create human food. Deltaic land has considerable worth to humans [14].
One of the largest deltaic areas of coastal land in the world, created by the Mississippi River (MR), is within the State of Louisiana, USA (Figure 1). Much of the theory and modeling of a general delta cycle from geological, biological, and human perspectives is based on an enormous synthesis of work on such lands [15,16]. Large coastal deltaic landscapes consist of multiple large land lobes, their sublobes, and even interior splays (essentially mini deltas) and go through cycles created by the accumulating sediments [13]. Individual lobes supporting wetlands are established, grow, are maintained, and retrograde to open water as the receiving pond’s elevation gradients decrease due to a lack of sediment buildup and subsidence. The same process occurs at multiple temporal and spatial levels (Figure 1). With the reduction in gradient, the sediment supply channels to individual splays shift location through small (a few meters across) “crevassing” events to events of river scale (avulsion), moving towards a steeper, more energy-favorable gradient. The cycle repeats over wide-ranging time scales: many centuries for large deltas, when the main river radically changes course many times [17,18], or over considerably less time, spanning just decades, years, months, or portions thereof, for a single lobe or a splay of multiple lobes.
To fully describe the details of the wetland complexes associated with any deltaic region like the MR Delta coastal area requires a blend of basic knowledge of both geological and botanical processes. The geology of the region concerns the balance between periods of sediment delivery (increased elevation, i.e., accretion) [19] and periods of its absence (decrease in elevation), coupled with persistent shallow belowground to deeper platform subsidence [20]. The durations between accretion and subsidence in shallow estuarine waters produce mud platforms for plant communities to take hold according to their particular elevation requirements [20]. Below the threshold is a mudflat, whereas above it is a wetland. Wetland types are categorized by both duration and plant makeup, as dictated by the abiotic and biotic environment [20,21,22].
The establishment and maintenance of vegetation on new wetland substrate platforms are known to be driven by both allogenic and autogenic processes, which often act in concert, particularly during early succession and even over longer periods of considerable vegetation stability [23]. Riverine wetlands are especially known for the dominance of allogenic processes because of the river’s dynamic nature and the fact that patterns of seasonality force vegetation to respond, although the local vegetation (autogenic processes) often plays a minor but still important role [24]. The mud (mineral and organic) platform substrates that support the emergent growing-season vegetation are defined as a biotic attribute [20]. Clear allogenic processes are often visible in large rivers from “pulsing events” [25,26], as demonstrated by the river forcing a sudden vegetation regime shift, a “change-in-state” event from a large pulse of flood waters with an often-linked sedimentation event [27]. Riverine wetlands can even return to an earlier vegetation stage after such an event, especially after a significant disturbance.
Figure 1. Louisiana’s southern coastline: a landscape of nested deltaic patterns. Panel I: The entire Louisiana coast, the coastal plain, and its 3 geomorphological west-to-east divisions—the Chenier Plain [28]; the Delta Plain [13]; and, lastly, the easternmost Pearl Plain (advocated for in [29]). The largest is the Delta Plain, made up of seven geologically distinct deltaic regions formed sequentially (youngest to oldest: “A” through “G”, with “B” essentially an extension of delta “C” (Plaquemines Delta)) over the past ~7500 yrs [30]. The newest delta region (A) in the Delta Plain is the region around the terminus of the Atchafalaya River, which is composed of both the Atchafalaya and Wax Lake Deltas [31,32]. The Balize Delta (B), the focus of this study, is shown in Panel II (modified from [33]). The Balize Delta began its growth ~550 yrs ago and is composed of four distinct, smaller-scale subdeltas identified sequentially by age (“a, b, c, and d”). Panel III: Embedded within the four subdeltas of the extant Balize Delta are many smaller “inner deltaic splays”, filling in shallow ponds, indicative of a senescing Balize Delta. Panel IV: Inner deltaic splays are “mini deltas”, each composed of multiple lobes; each lobe likewise has its own birth, growth, and decline phases. The study splay and location of the study sites are marked with stars. Panel V: An individual lobe; the BSn site during winter in a later year of growth from Panel IV. Note 1: Panel IV clearly shows the shoreline crevasse through Octave Pass, which created the eventual WSc splay. Panel IV also labels four nascent “natural” splays: two active (AS) and two senescing (SS). Note 2: The NASA images of Panels IV and V clearly indicate an attenuated gradual slope down and away from the lobe shoreline feeder pass, as represented by the near-white color of the most elevated exposed mud, with the shallowest mud represented by the darker blue color of the receiving pond. Note 3: The border colors of Panels II through V correspond to the increasingly larger ovoid outlines around the green dot representing the study location.
Water 15 03481 g001
The actual vegetation dynamics of splays or any deltaic complex, from wetland birth to death, have never been fully tracked in detail. However, the importance of sediment budgets (the overall elevation dynamics) for wetland growth, maintenance, and dynamics in young Louisiana deltaic landscapes has been widely studied for years [34]. The growing Atchafalaya Delta [35], the adjacent Wax Lake deltas [32], and the much smaller inner Mississippi Balize Delta lobes/splays [36] all show similarities in wetland plant establishment and general community dynamics.
The overarching complex question addressed by this unprecedented long-term study is: How do plant communities assemble themselves from birth (colonization), early development, and establishment (primary succession), through a relatively stable existence, to their decline and disappearance (death)? This complex question was answered by a series of incremental questions: Are there common patterns of plant species richness among different sites? Do patterns exist in the annual study-wide plant community’s productivity according to particular species or groups thereof? Do the river water attributes affect the deltaic wetland’s quality and quantity? Can infrequent stochastic events have significant impacts on the phytosociology of a delta? Tied to these questions, significant contributions of specific plant species during the delta cycle were identified.

2. Materials and Methods

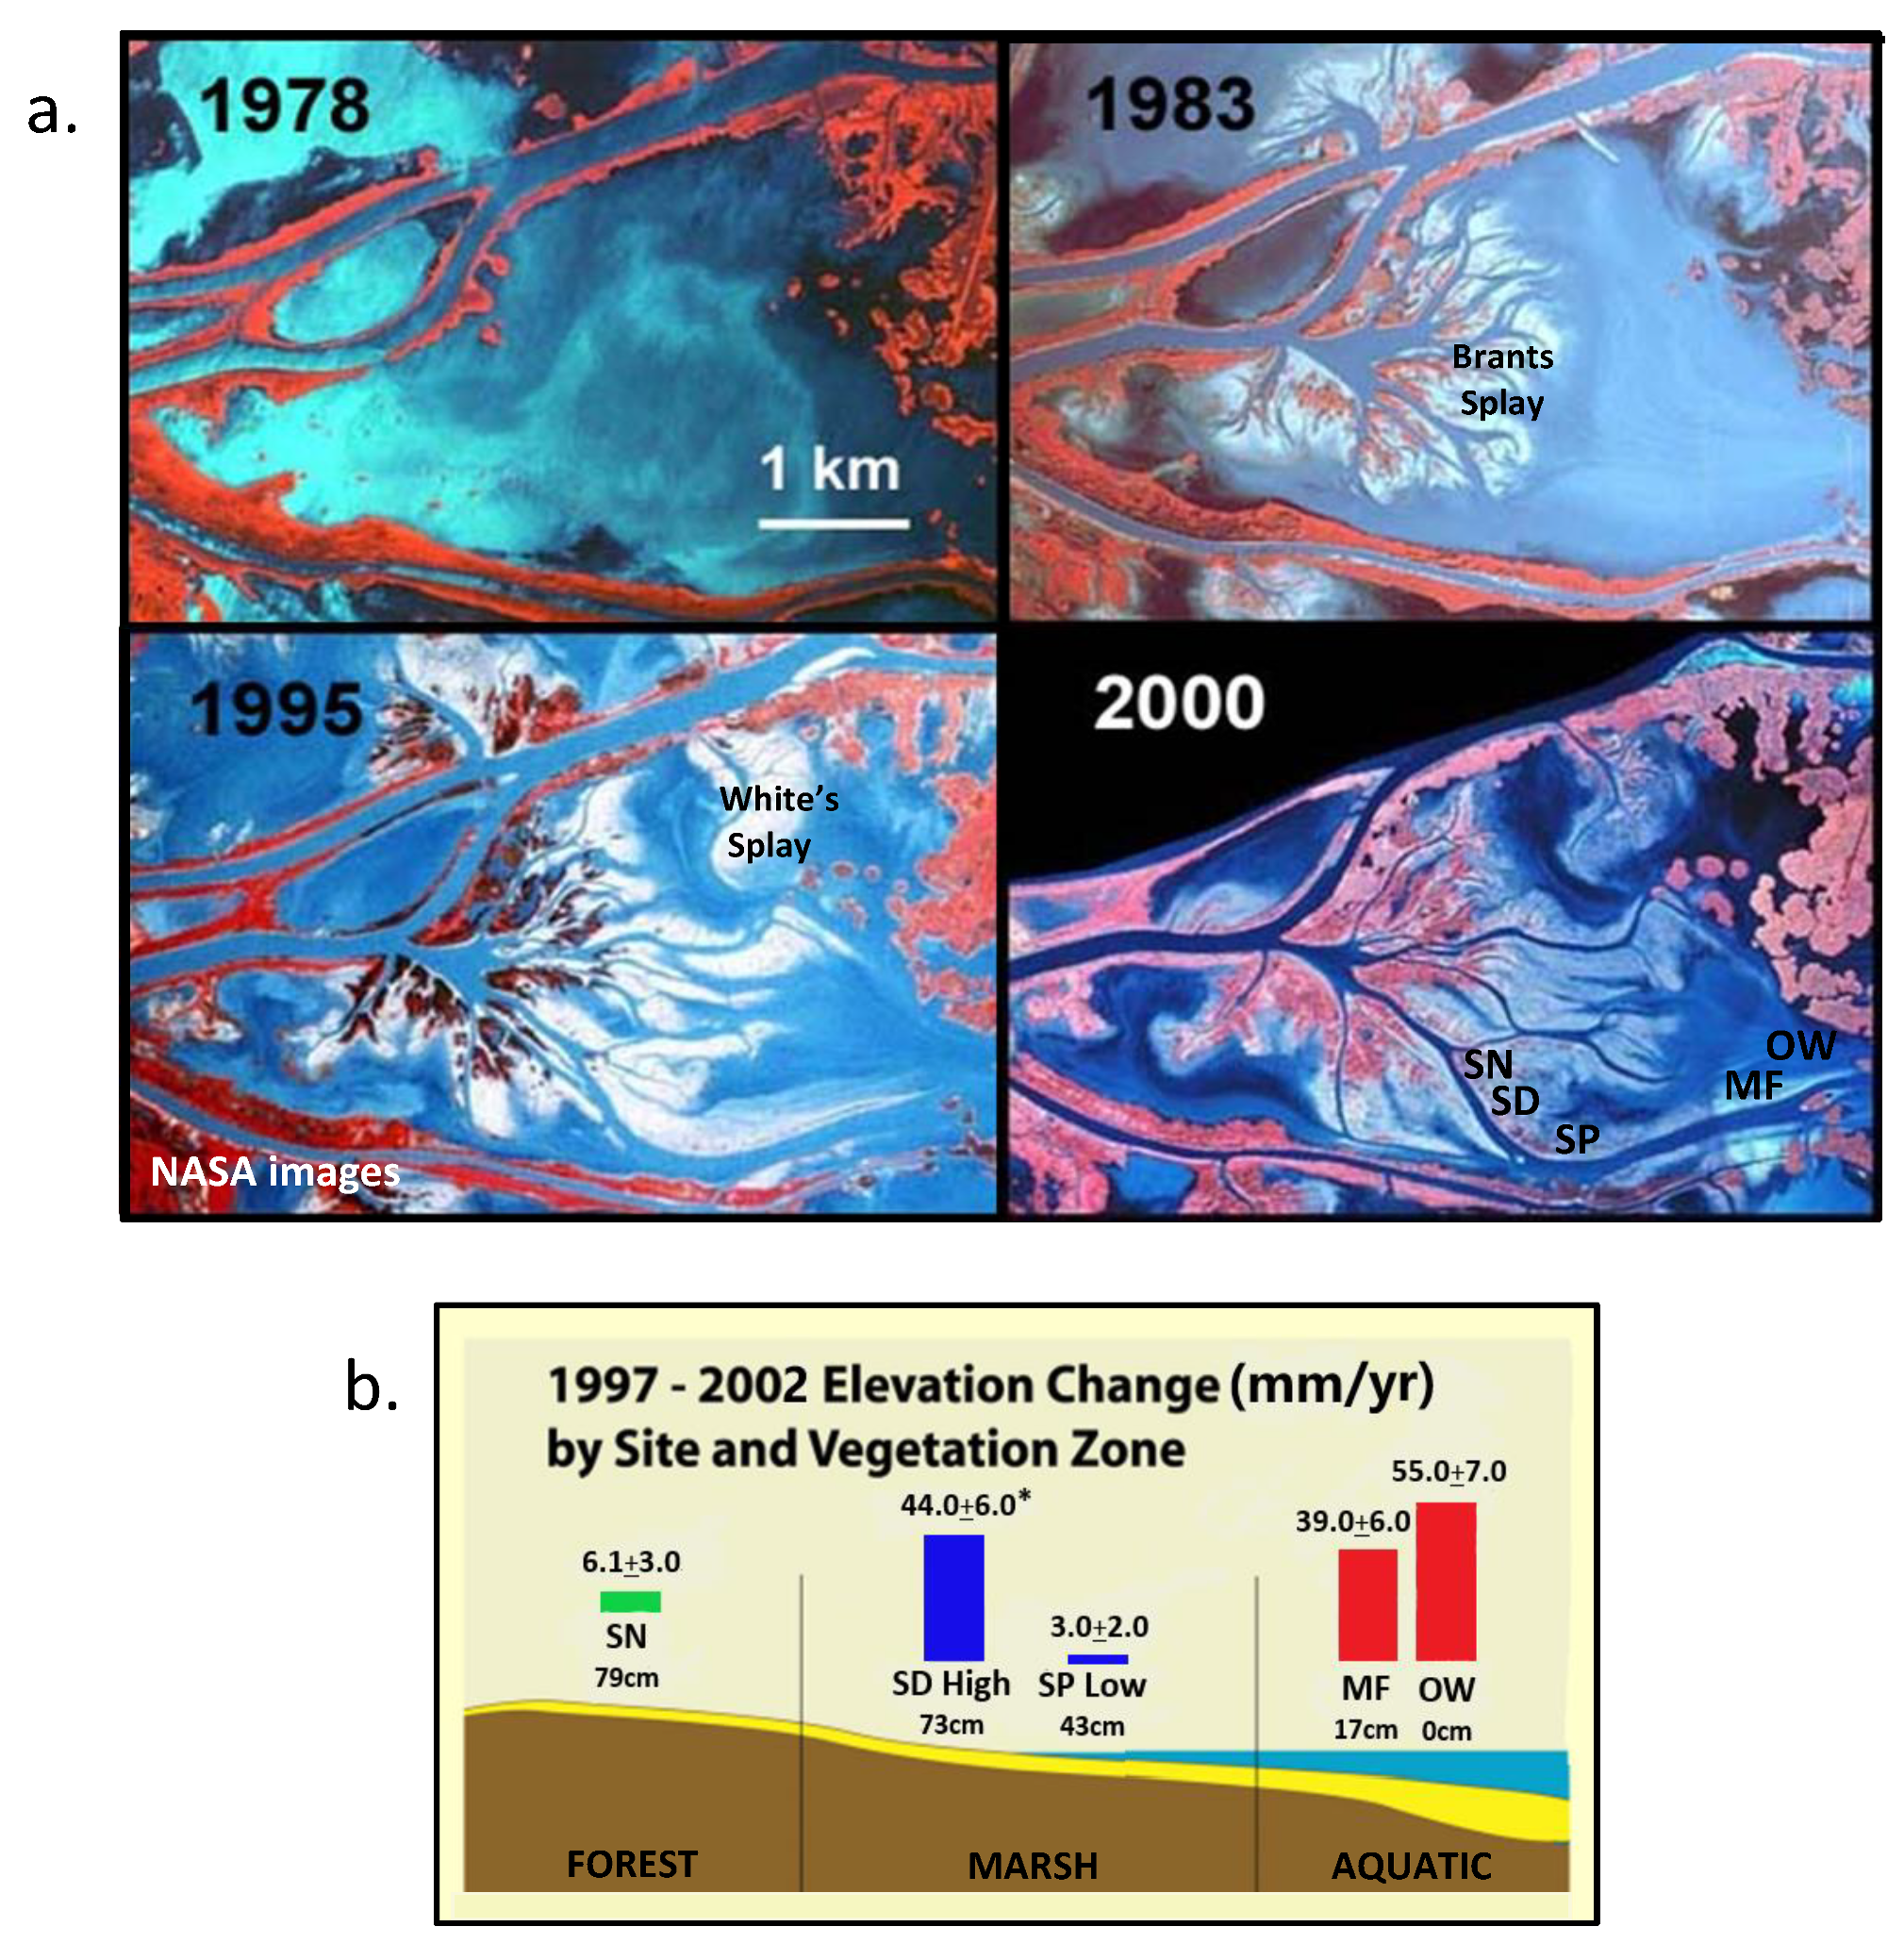
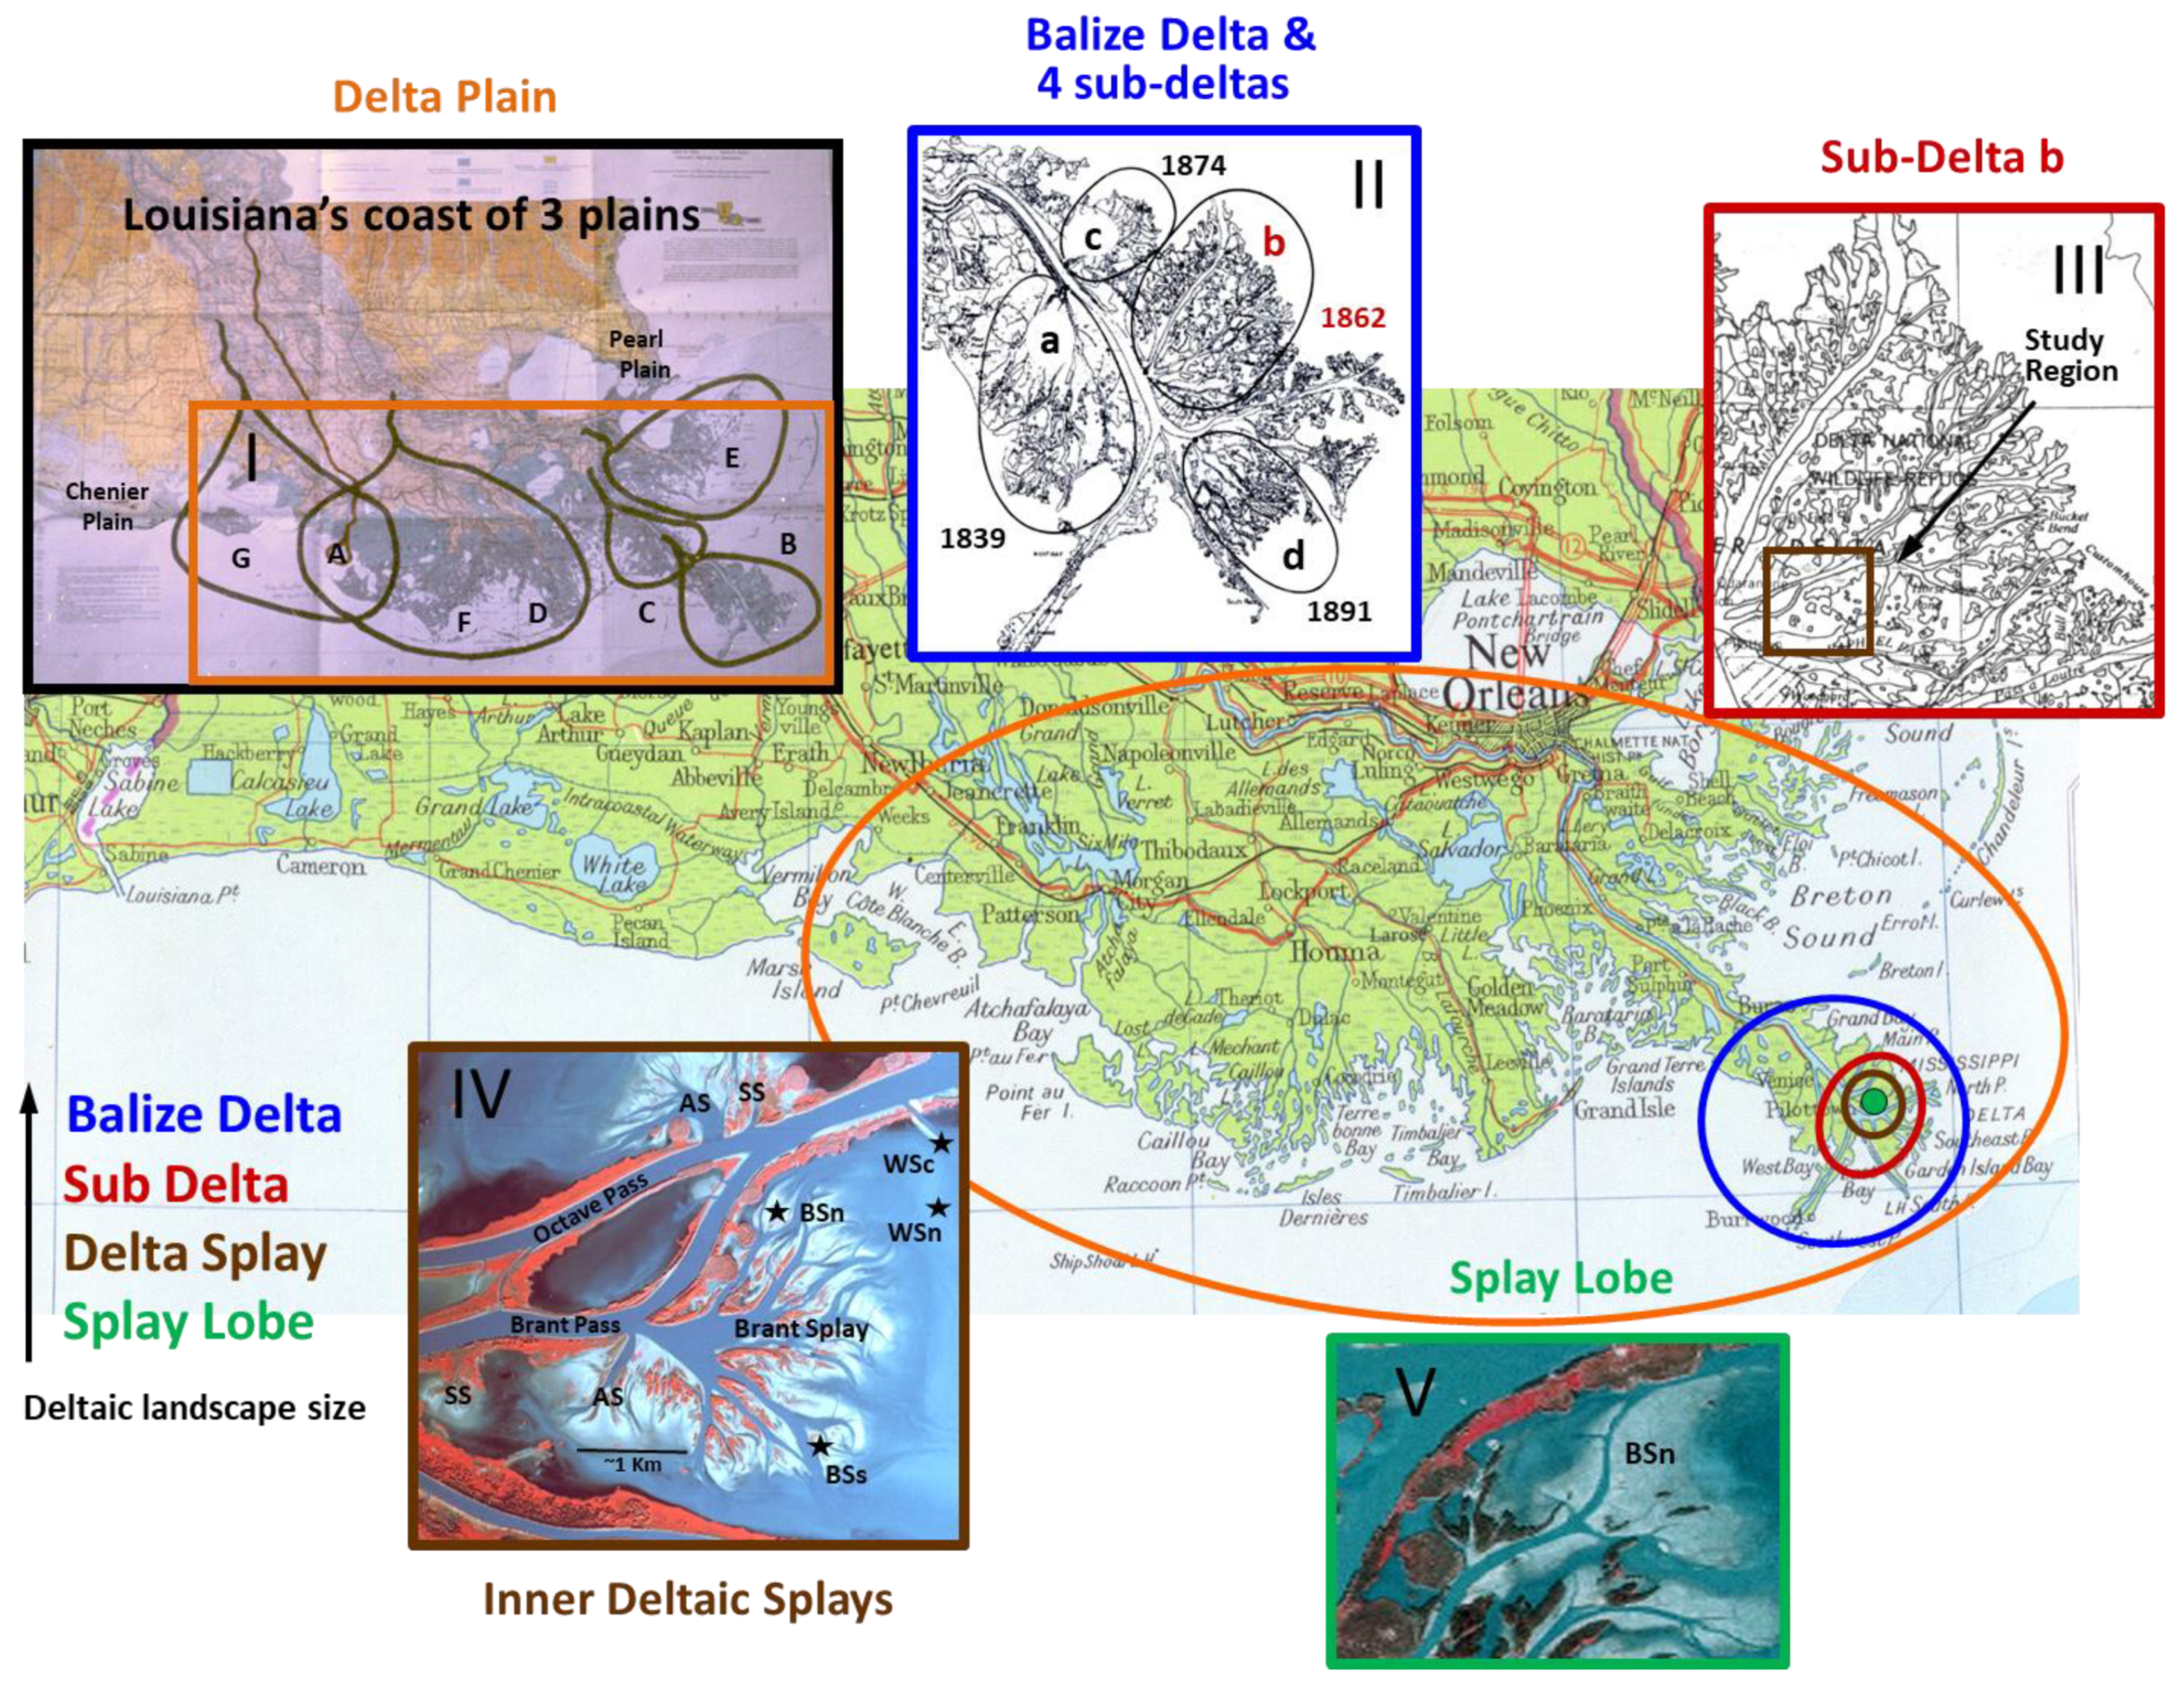
2.1. Study Region and Sites

This field study was designed close to 4 decades ago as a simple descriptive project focused on wetland establishment on new mud substrate platforms within the Balize Delta. Such substrates were particularly rare at the time in the far greater Louisiana coastal landscape experiencing wetland loss [37]. Federal efforts to increase wetland areas had begun, and some had been completed [38]. Within the Balize Delta, an area of numerous splays of different ages, sizes, and origins was identified in 1984 to monitor wetland plant colonization, community establishment, and community change over time (Figure 1) [36]. Each splay developed down-current from crevasses along the area’s many kilometers of shoreline. Lobes within these splays have a considerably attenuated elevation gradient down <1 m to the platform surface (Figure 2) [20]. In addition, lobes decline in elevation perpendicular to the shore of the sediment supplying feeder pass and are typically assumed to be delineated at the emergent vegetation boundary, although the lobe’s substrate continues to slope towards the bottom of the receiving pond, often over considerable distance [39]. The entire elevation change across a lobe only in the vegetated areas is rarely more than 50 cm. Because splay lobes can be 1 km or more in length and usually not more than 100 m in width, the elevation gradients are imperceptible without biotic markers. Therefore, defining the precise width of a lobe is difficult because of its gradual transition to unvegetated flooded muck. The vegetated width of lobes grows far slower compared to the length axis because of the location of the more stable and coarser (sandier) sediment along the feeder pass edge.
The largest splay in all of the Balize Delta was one chosen for our study: the Brant Splay (BS). This area was documented by substantial NASA aerial photographic records as a shallow pond prior to 1978, the year its crevasse opened along the eastern shore of Brant Pass. MR water has flowed into this large (~10 km2), shallow receiving pond. The cyclical vegetative nature of the area is demonstrated by the fact that in the early 20th century, the exact area supported freshwater wetlands described, drawn, and pictured [40] as vast areas of Typha spp. The exotic, Alternanthera philoxeroides was reported (authorship for all species collected in the study is provided in Table 1), and in the interspersed lower, more watery areas, Eichornia crassipes (Mart.) Solms was reported. The lands were all bordered by higher ridge/natural levees of Panicum repens L., Zizaniopsis miliacea, and Salix nigra. Interspersed within the wetlands were significant ponds—remnants of the original vast sediment-receiving areas. This historical wetland disappeared because of reduced sediment input coupled with the generally high subsidence rates [33,38].
The White’s Splay (WS) area began as a linear region of mudflat associated with a man-made (1982) crevasse along Octave Pass. The artificially created (not natural) mudflat was at grade with neighboring wetland areas northeast of the BS in the receiving pond, into which the dredging extended ~500 m away from the pass as a channel to accept sediment-laden water. The event engineered by the United States Fish and Wildlife Service was the first major attempt to build significant wetlands within Louisiana’s Delta Plain by construction of an artificial crevasse [38].
In 1984, three sites were chosen for study. Two sites were established on 2-year-old (determined from NASA photographic records) rapidly elongating lobes of the BS: a north site (BSn) and a south site (BSs; Figure 1, panel IV). A third site was established ~150 m inland from Octave Pass on the east side of the southeasterly dredged channel. This constructed or created WSc site was originally a designed test location for wetland development to monitor the two natural sites on BS. Years later, another lobe showed potential for growth on the same growing splay down from WSc but was not influenced by the dredged material from a decade before. In 1994, the area was designated as the new WSn site (Figure 1, Panel IV) and subsequently grew southwest, splitting off the then-most distal end of the WSc’s southernmost, still growing lobe. Its sediment filled more of the northern portion of the same large receiving pond south of both Brant and Octave Passes. A few years into the growth of the WSn lobe, a declining phase began, caused by channel sediment backfilling enabled by high statured wetland plant invasion into the shallow feeder channel, considerably reducing the flow of water (see below). The elevated and most proximal mud substrates of the WSn lobe initially supported wetland communities similar, when of the same age, to those on the two natural BS lobes in previous years.
At BSs, BSn, and WSc in 1984 and at WSn in 1994, study site transect locations for plant collection on the newly emerged sites were marked by permanent stakes in the mid-summer near the shore at the most-distal growing ends of each site’s lobe. The transect locations were down gradient from earlier deposited aerial land substrates, which supported more mature wetlands on the same lobe. The area of interface elevation between the previously deposited substrate of new mud arises when late-spring highly sediment-laden MR water recedes to expose the accommodating substrate for plant growth. The growth rates of the splays were determined in previous years from birth to 2000. With each year of substantial accretion (which forced elongation of the lobes), additional transects were added: two by 1986 at WSc and BSn and two by 1989 at BSs. All lobes had to have elongated ~50 m or more for a new transect. No further transects were deemed necessary after sufficient plots were established to describe the lobe plant community (see below; usually three transects with five plots each).
Later, in 1994, at the start of the WSn study, two transects were placed on substrates of two ages: a distal mudflat of just accreted land and an upslope, i.e., proximal large, area observed to have emerged the previous summer and colonized later that summer by a typical pioneer plant community similar to those found at the other sites [36]. The WSn lobe grew no further after the establishment year. Coincidentally, the relative homogeneity of the developed wetland community meant that only two transects of harvest data were sufficient to be fully representative of the area’s wetlands.
At the time of usual flowering (late August to early September), the peak plant standing crop (referred to as aboveground biomass (AGB)) along each transect was clipped in five 0.25 m2 (50 cm × 50 cm) plots ~5 to 10 m apart. The distance between plots was gauged by lobe width coupled with the diversity of the immediate community so as to represent the plants of the general transect area. For a few transects in a few years, the widths of the wetlands across a lobe increased further into the downslope mud (muck) area at their far edge which supported sparse vegetation (Figure 1; Note 2). Throughout the study, the distant edge community was always of the same species as the most inland harvested transect plot. With confidence that the harvested plants along all transects represented the majority of the wetland vegetation of the complete lobe area each year (the specific plot locations were determined by D.W. for all years).
The harvested AGB of plants/plots were sorted to the lowest taxonomic group possible, i.e., species, in all years except the summer of 1984. During the year of site establishment that was not sampled, the mudflats at the first three sites were not recognized as first-summer wetlands because they were sparsely vegetated. The fortuitously captured 1984 and 1985 site photographs confirmed the 1984 areas as nascent months-old wetlands. Therefore, additional plant harvesting took place in 1985 from similar nascent areas at the three sites to capture the early wetland AGB total, although not at the taxon level, then hind-casted for the assumed 1984 total.
All plant material, including unidentifiable dead material, was dried to constant weight and entered into Excel spreadsheets. Voucher material was deposited in the herbarium of Tulane University, New Orleans, LA, USA and has since been moved to the collections at Louisiana State University, Baton Rouge, LA, USA. The transect-by-transect, plot-by-plot data were used to document and decipher the wetland community events over the 28-year study period. Events included plant colonization; primary succession; and other significant phytosociological processes, such as declines in coverage, wetland disappearances, and plausible causes.

2.2. Study-Wide Harvested Vegetation

Over the course of the study, a total of 53 species or taxonomic groups were harvested, of which 38 were assigned to species (Table 1). All taxa were divided into three major groups: foundation species (FS [41,42,43], four taxa), pioneer species (PIO, nine taxa), and the remaining other species and groups thereof (OTH, 40 sorted into three subgroups: 8 Msc. grasses, 8 Msc. sedges, and 24 Msc. herbs). The 40 other species are a collection of the least-abundant taxa study-wide. The FS are Salix nigra, Sagittaria latifolia, Sagittaria platyphylla, and Schoenoplectus deltarum. Salix nigra was the only fully woody species harvested (only as saplings) study-wide.
The group labeled PIO included Ammannia coccinea, Bacopa monnieri, Cyperus difformis, Cyperus erythrorhizos, Echinochloa walteri, Eclipta prostrata, Leptochloa panicoides, Panicum dichotomiflorum, and Sphenoclea zeylanica. The PIO species were chosen generally using a set of criteria including site abundance (AGB) and frequency (evenness, an aspect of diversity sensu [21]) in the harvested plots during the primary succession year (PSY) of each site following mudflat emergence [36]. The criteria were (a) significant AGB at one site and present in at least three sites; or (b) significant AGB at two sites and present in another site over those PSYs. The total number of PSYs harvested study-wide was 10: 3 years each for the early established sites (WSc, BSs, and BSn) and a single year for WSn. Panicum dichotomiflorum was an exception because analyses showed it should be designated a PIO species (see below).

2.3. Analyses of Splay Lobe Phytosociological Dynamics

First, the major vegetation change at each of the four study sites (lobes) was detailed over the decades by scoring 965 plots according to their most dominant taxa using the AGB metric (sorted from all 53 into 11; one of the four FS, four of the nine PIO species of greatest study-wide AGB: E. walteri, C. difformis, C. erythrorhizos, L. panicoides, or one of the three Msc. groups, i.e., herb, grass, or sedge). The five least abundant PIO species were placed accordingly into their Msc. group, including the study-wide AGB of all species. Only in 23 of the 965 plots was one of the five least abundant PIO species the most dominant in the plot, whereas among 28 other plots, only eight of the other rare taxa within the Msc. groups dominated (see below). Major splay-wide community patterns (including subtle patterns) of species’ presence or absence over time were captured by this method and proved important for the description of the dynamic nature of the MR Balize Delta wetlands.
Nonmetric multidimensional scaling (nMDS) statistical analysis for large datasets [44] was used to further examine vegetation changes. The Bray–Curtis similarity index was applied, with 50 iterations and 1000 permutations used to create a fully integrated ordination of all lobe plant communities over time using species AGB data from the 965 harvested plots. A trajectory ordination plot of the year-by-year vegetation change was then created for each lobe under study in the Balize Delta.
In addition to the nMDS procedure, a distance-based linear model (DistLM [44,45]) was run to determine which species ordinated as statistically significant (p > 0.05) over a complete cycle of the Balize Delta lobe. DistLM is a non-parametric permutation routine used to sort out relationships within a complex multivariate constellation (in this case, comprising the 53 harvested taxa). The marginal test output identifies the taxa of statistical importance to the recorded vegetation change over time (in this case, decades).
Species richness was determined by counting the total number of species in the plots harvested from each lobe. Trends over time were determined using linear regression.
Interlobe patterns common to lobe-wide wetland plant communities and their total aboveground biomass (TAGB) levels were determined by calculating the average AGB for each species on each lobe across all years. To reveal broad-scale similarities and differences in the vegetation communities over time, i.e., annually in each studied wetland, the TAGB values from the previous analysis were parsed by the four FS, the two taxa groups (PIO and OTH species), and the TAGB. Additionally, the yearly totals over common times were statistically compared using correlation analysis between sites to learn whether patterns existed irrespective of the vegetation quality.
Using available high-quality aerial NASA photographs, which covered most of the study period (1983, 1995, and 2000), splay-wide wetland increase was determined using Geographic Information System software (GIS; ArcView 8.3, ESRI—Environmental Systems Research Institute, Redlands, CA, USA). The area coverage of the two prominent wetland regional vegetation types that make up the splays (forest and herbaceous) were calculated to determine rates of growth per year [46].
Finally, quantile regression was employed to address the following question: Does the MR’s water quality and quantity influence the prevalence of the dominant species on the splays under study in the Balize Delta? The regressions might explain some of the large-scale patterns in the observed annual fluctuations in a lobe’s wetland AGB and community change. Quantile regression analyses were performed using SAS 9.2 [47]. For the analyses, the annual AGB values of the most dominant species, Sc. deltarum and Sag. Latifolia, collected from 1989 to 2008 were applied as dependent variables for the following water variables of the MR: (1) spring discharge; (2) growing season nutrient (nitrogen) load; and (3) a specific MR temperature (when cold spring river waters transition to 15 °C and above), which was converted into a metric for growing season length using GDDs (growing degree days [48]). The variables were mined from three public governmental web sources. (1) Most of the water temperature data were obtained from 8AM readings collected by the United States Army Corps of Engineers’ MR gauge in New Orleans (Carrollton Gauge; River km 165.4). The relatively few missing gaps in these data were filled as per [49]. (2) The daily discharge data were obtained from the Corps of Engineers for Tarbert Landing (River km 493), based on which the average discharge for the period of March 1 through May 31 was calculated/yr to quantify the spring flood amount. (3) The nutrient load data were obtained from the Louisiana Department of Environmental Quality from three long-established sites transecting the MR at Pointe a la Hache, LA (River km 78.4). The obtained variables were nitrate + nitrite and TKN monthly concentrations. The average monthly concentrations (ppm) were multiplied by the average discharge (cfs) to obtain a monthly loading. The full summer loads were then calculated as the sum of the average monthly loads from April to August.

3. Results

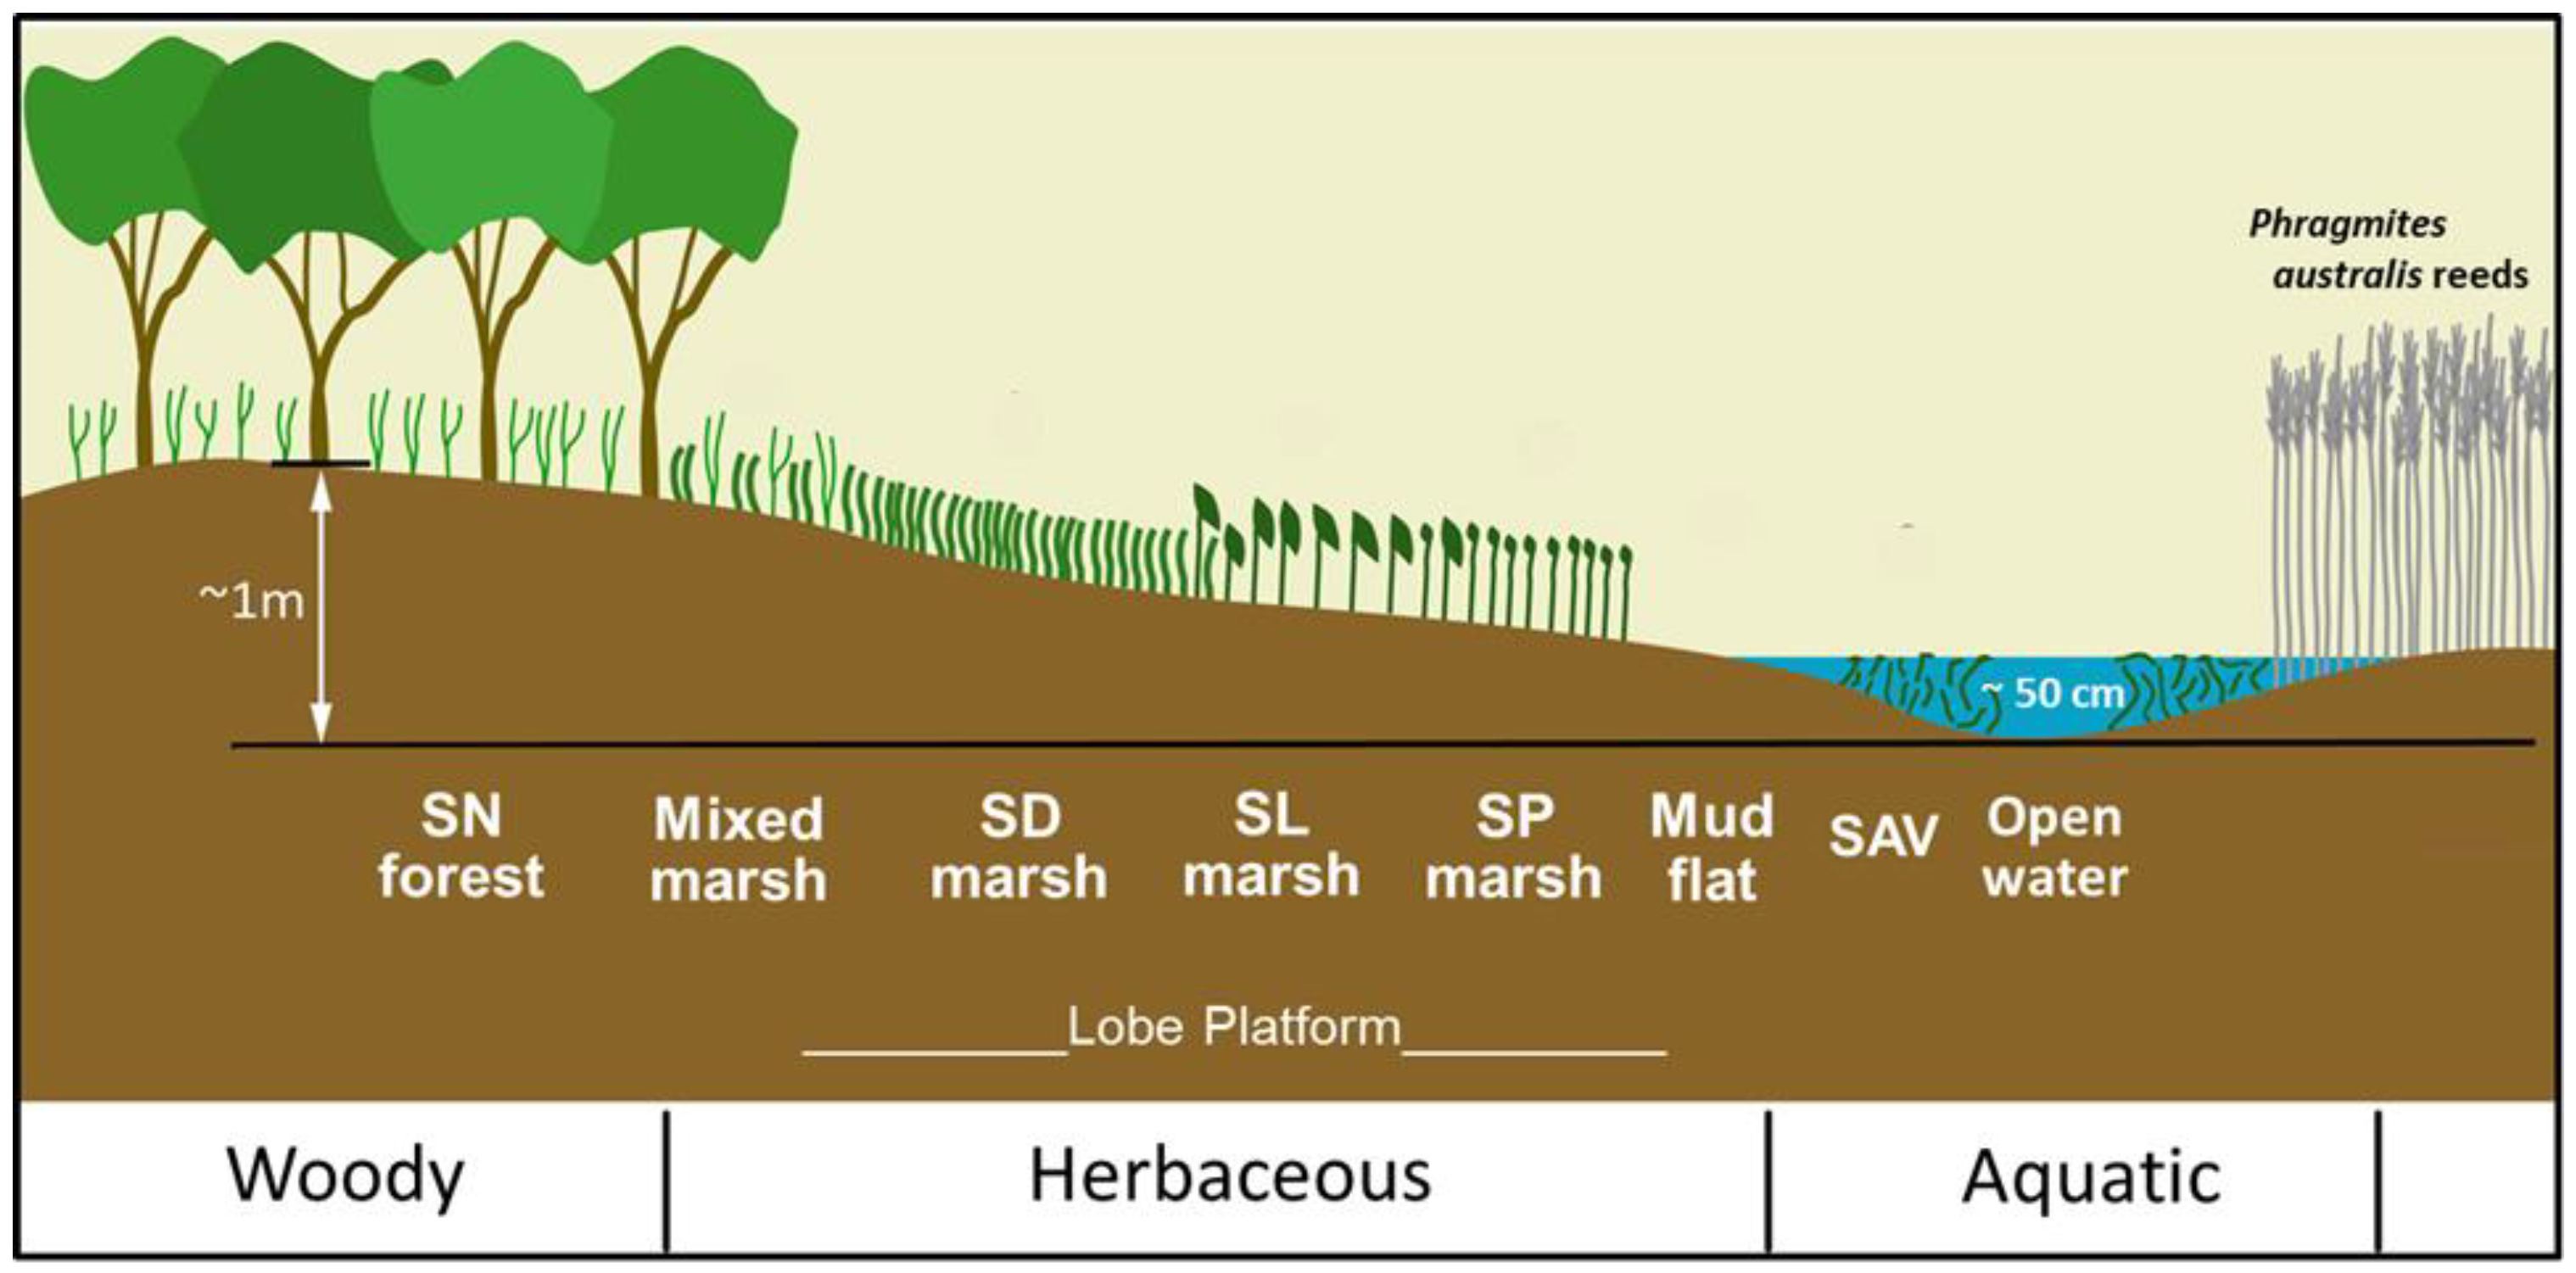
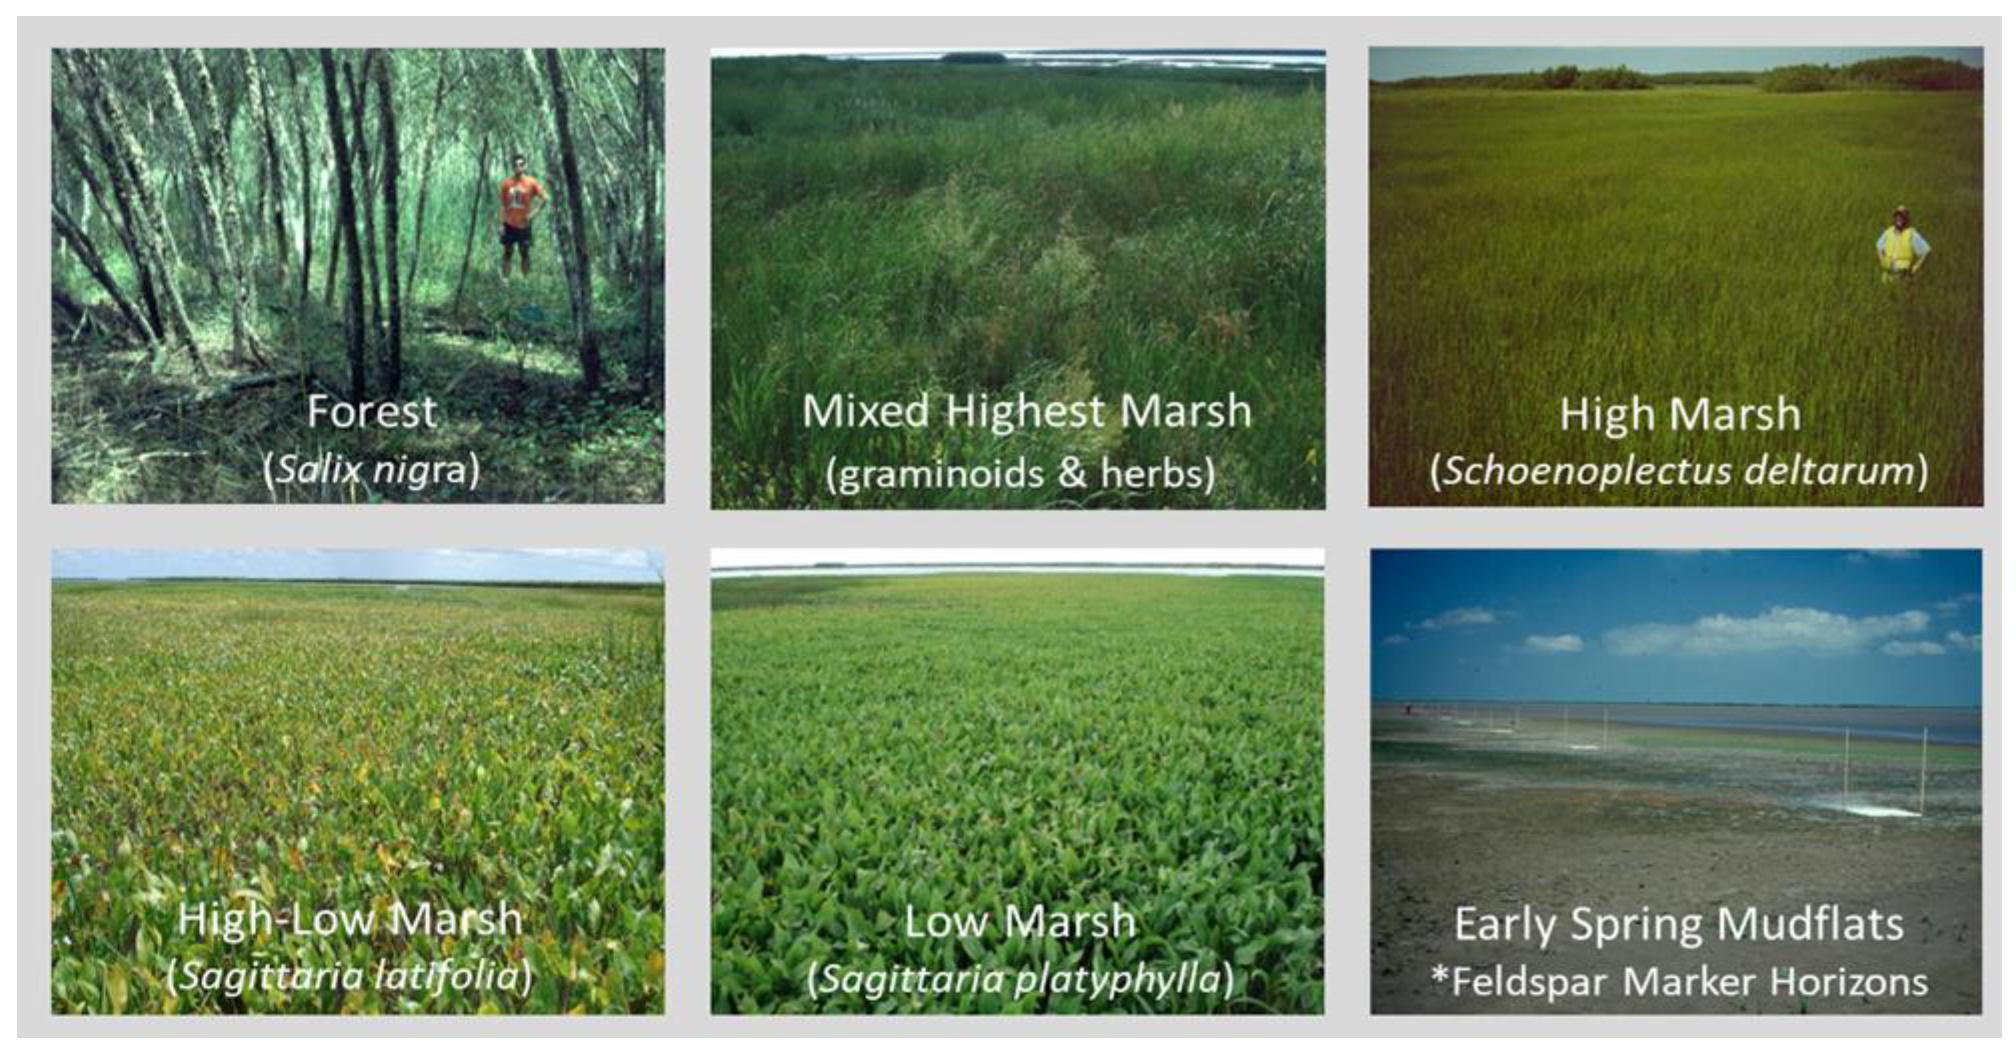
3.1. Splay Lobe General Vegetation

The 53 taxa placed in the three groups (FS, PIO, and OTH species; Table 1) varied considerably in terms of the total harvested AGB. According to the AGB metric, the four FS accounted for 78.9% of the 116,706 g harvested (Sc. deltarum, 56.5%; Sag. latifolia, 15.6%; Sag. platyphylla, 5.6%; and Sal. nigra, 2.3%).
The second group of nine PIO species accounted for only 13.6% of the total harvest. Four of the five PIO graminoids with the highest harvested AGB in this group study-wide (E. walteri, C. difformis, C. erythrorhizos, and L. panicoides) made up 82.4% of the total PIO species. The 12 herbaceous species from the FS and PIO groups (excluding woody FS Sal. nigra) accounted for 90.1% of all harvested AGB (including Sal. nigra, the AGB equals 92.4% study-wide for all FS and PIO). PIO E. walteri, the third most abundant species in this study, had a marginally higher harvested AGB than FS Sag. platyphylla.
Of the last of the three groups, OTH species (eight grasses, eight sedges, and 26 herbs; 42 in total), all but two fully herbaceous species, except the semi-woody Baccharis halimifolia and Sesbania drummondii, were considerably rarer, accounting for only 7.5% of all plants harvested. The three most abundant taxa in OTH species, all Msc. herbs identified at the species level, were Vigna luteola, Polygonum punctatum, and T. domingensis. The combined AGB of the herbs equaled 42.3% of the OTH group’s total but only 3.2% study-wide. A total of 15 taxa included in OTH species listed in Table 1 were not identified to the species level (three grasses, four sedges, and eight herbs = only 3.1% of all harvested; and a dicot group of 3 = <0.3% AGB). The combined AGB of two taxa in this 15-member group (Panicum spp. and Msc. Poaceae) made up 68.7%; thus, the 13 remaining taxa were exceptionally rare. Only 4 of the 40 taxa in the OTH group (Pluchea odorata, Po. punctatum, T. domingensis, and V. luteola) became important in DistLM (see below) because of their relatively large total AGB; two PIO species had a lower study-wide AGB than these four OTH species.

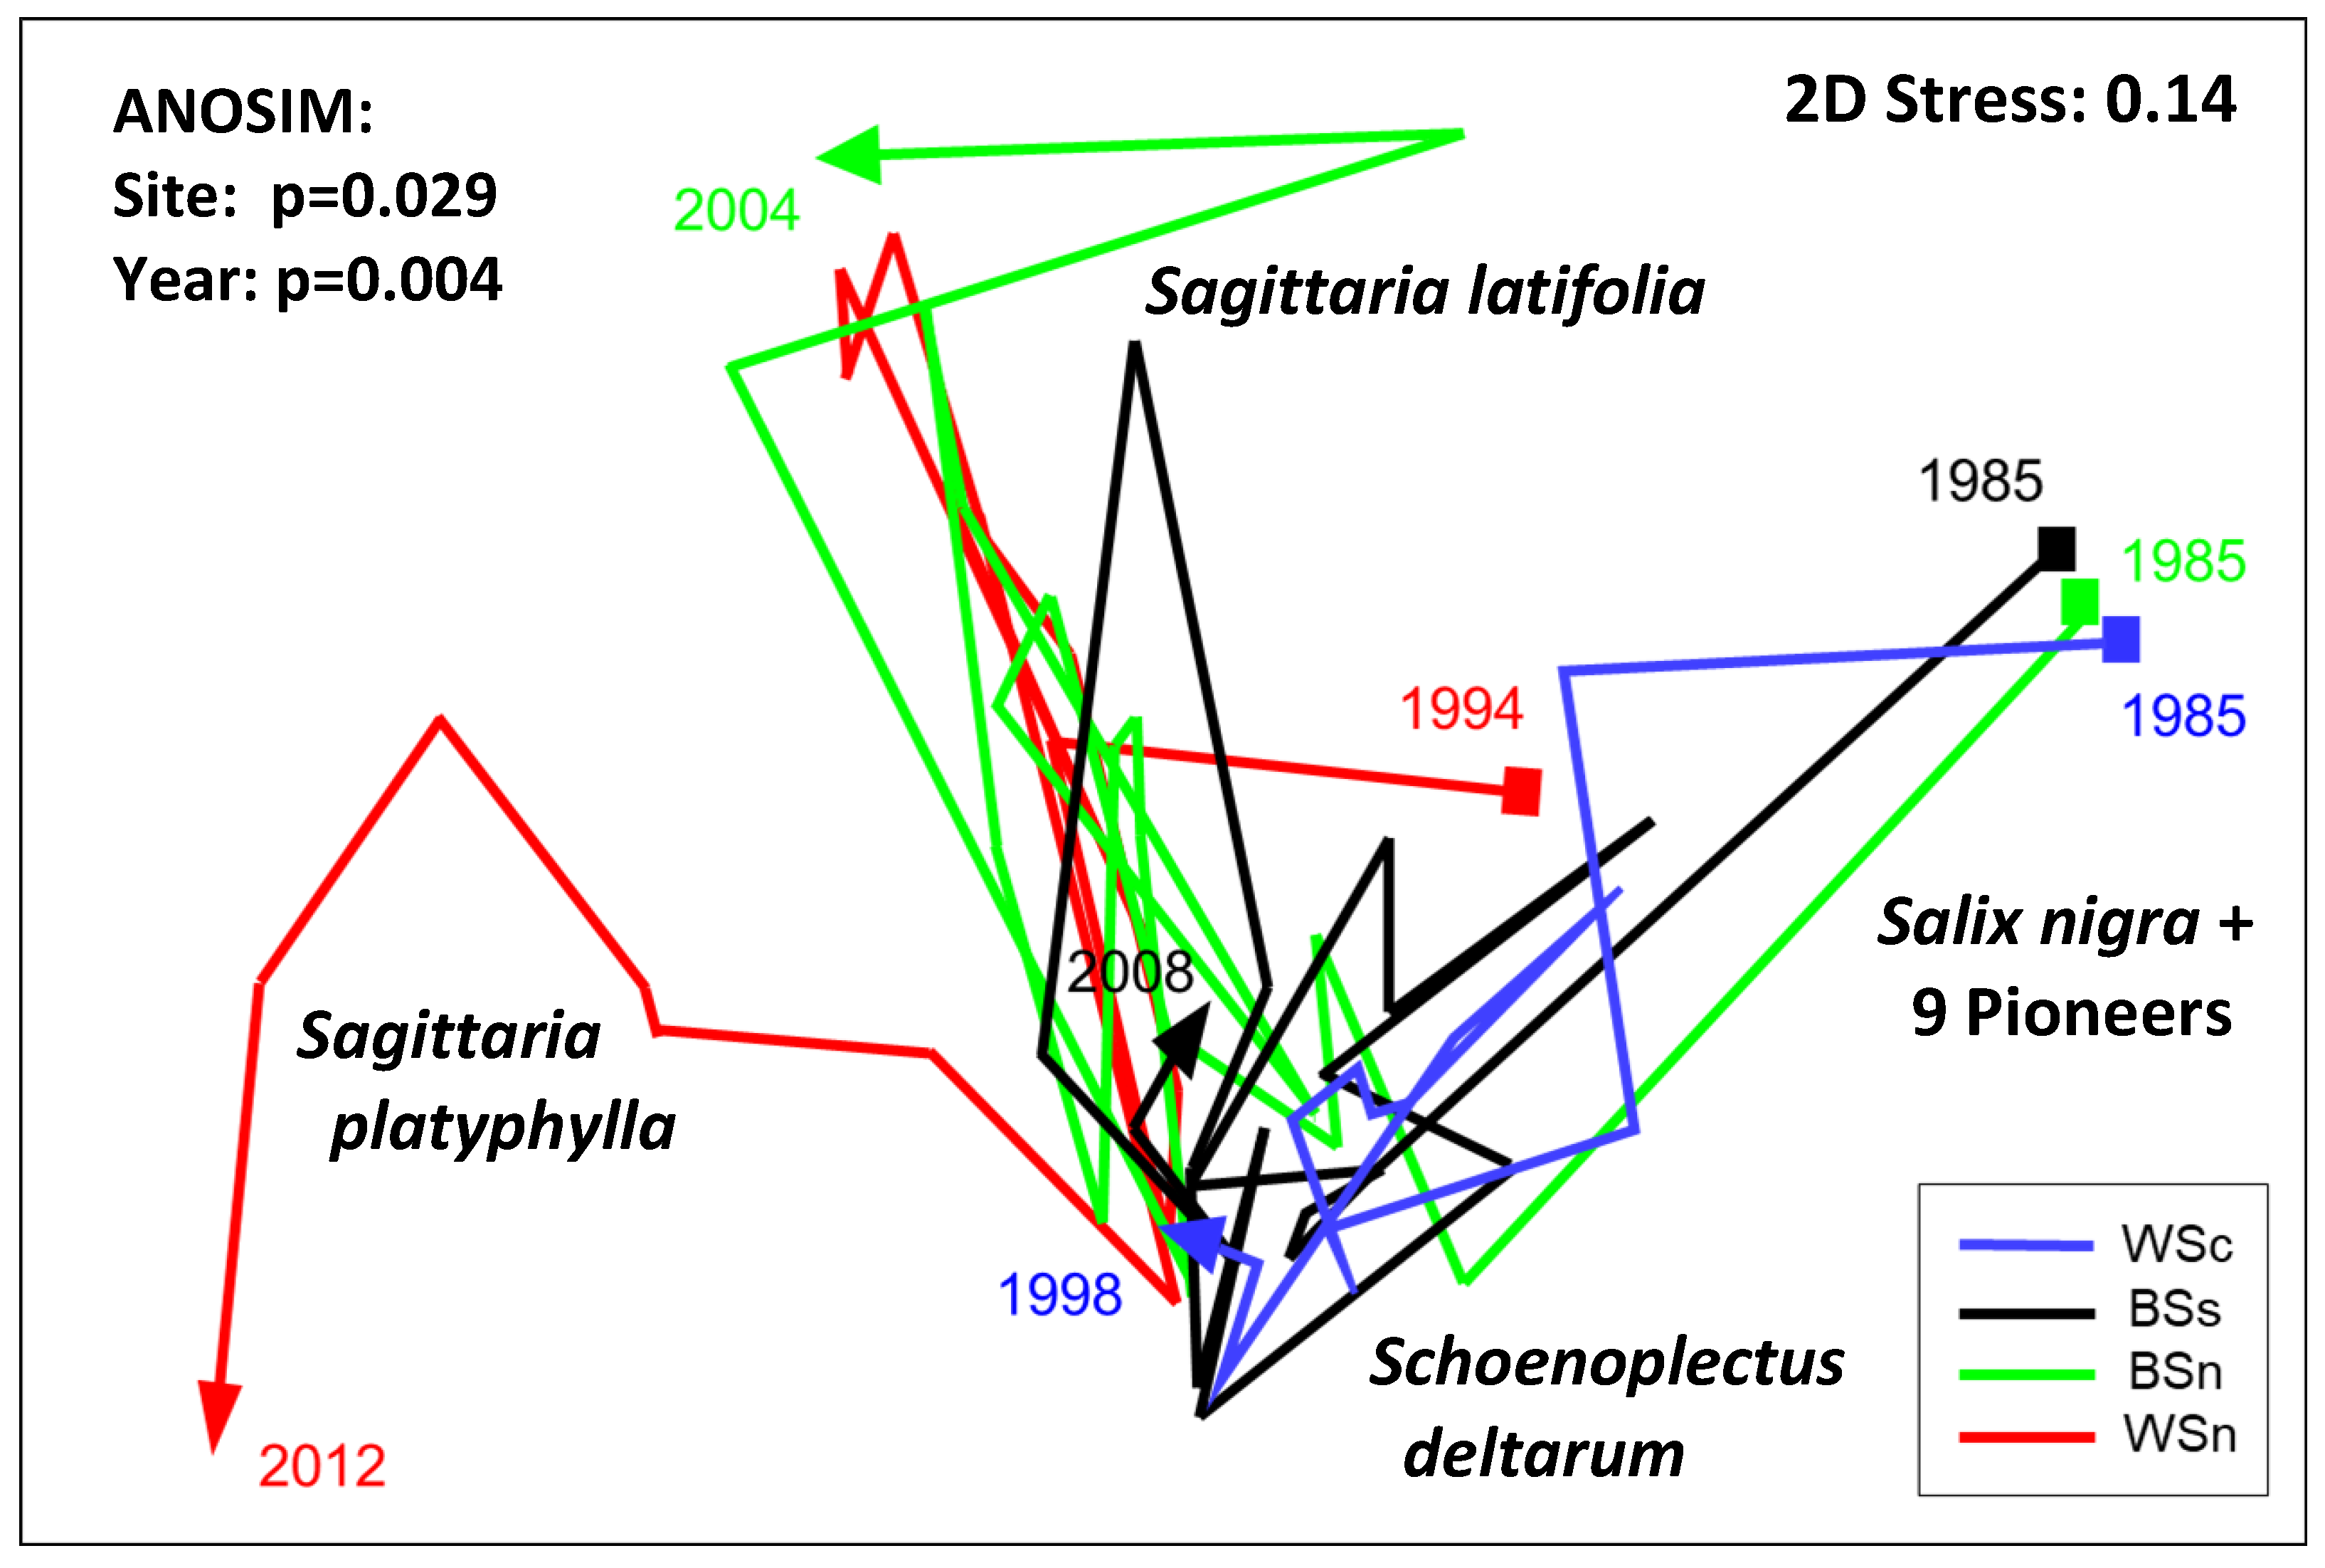
3.2. Phytosociology on Deltaic Lobes

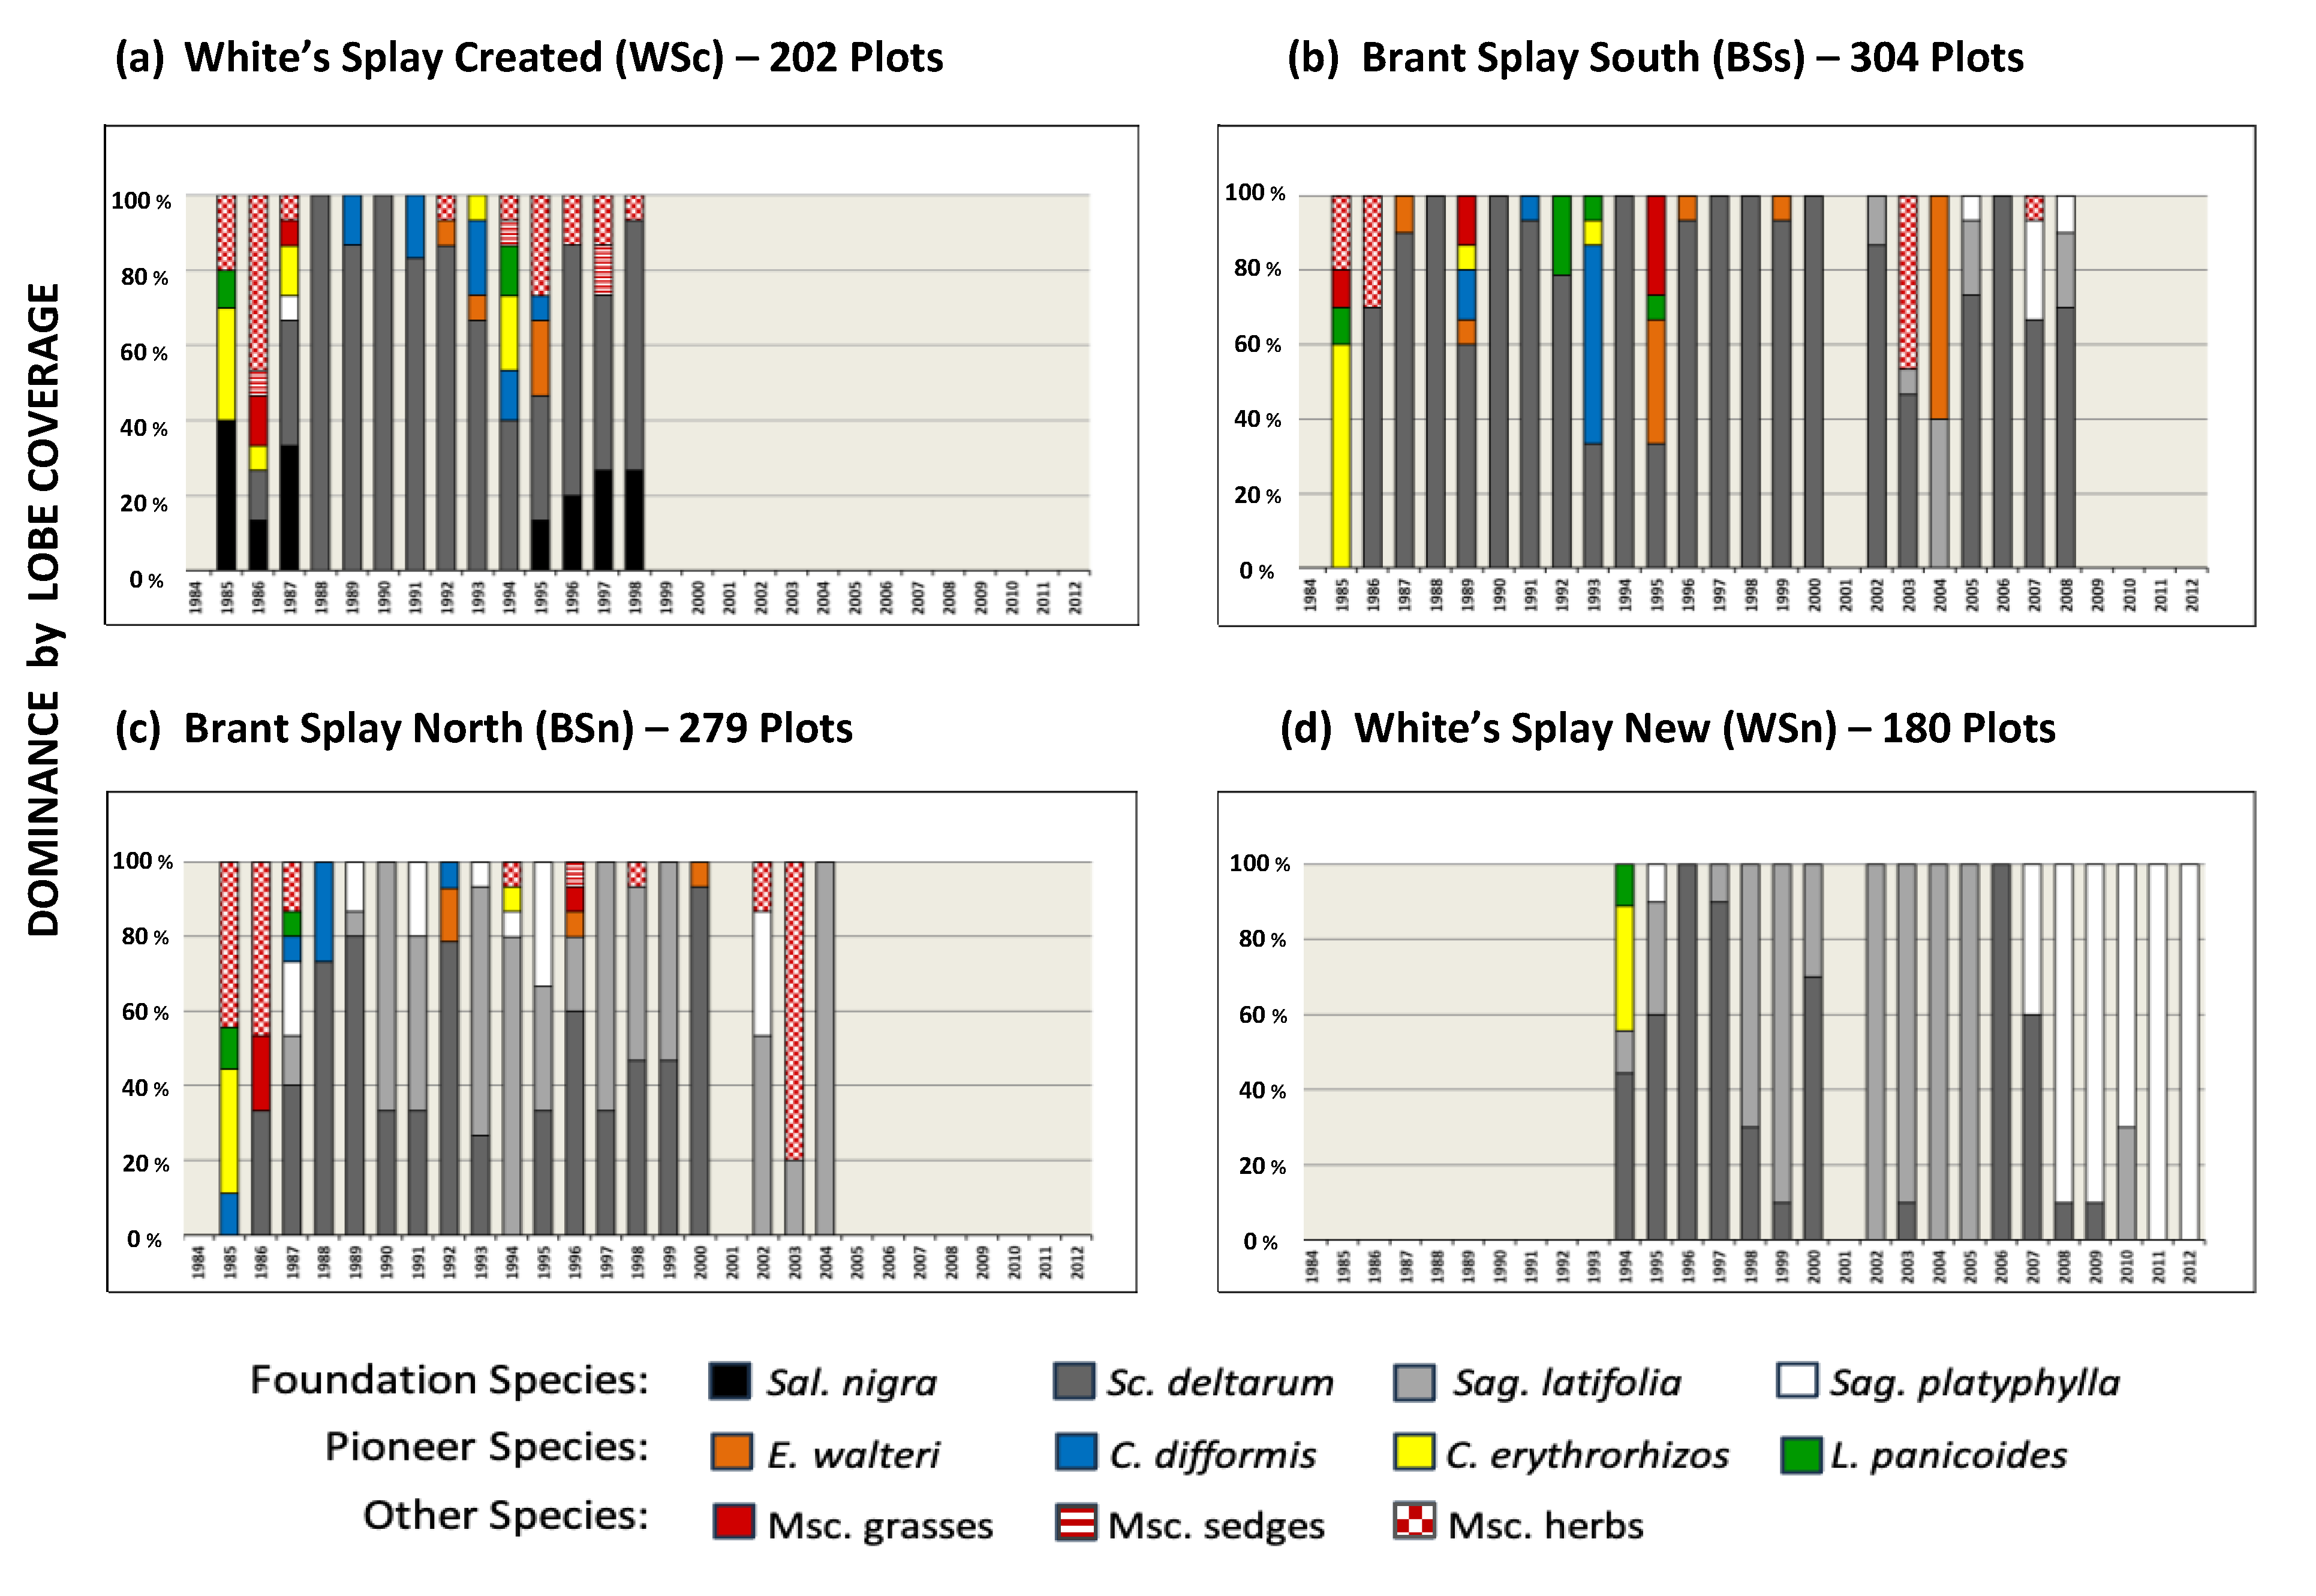
3.2.1. Plot Taxa Dominance over Time

The principal inter- and intra-lobe vegetation differences and variation over time were revealed by our analysis. The harvested AGB captured the vegetation diversity, even within the greater wetland area of each plot (Figure 3), because of the attention focused on the plot’s precise field location along each transect, as previously described, and the relative homogeneity of the vegetation. The three herbaceous FS were the most prevalent on all the splay lobes under study and tended to follow a pattern of increasing dominance after the first year of study (see below). Although several plots are dominated by one species, biomass of other species is still present (Figure 4). A clear example occurred in 2005 at WSn, where four plots contained some SD biomass, but SL was dominant in 100% of the plots.
Figure 3 shows the appearance and subsequent dominance of Sal. nigra in only the WSc plots. In the early years, Sal. nigra grew to seedlings only, then disappeared, returning the following 4 years to grow into a wetland of predominantly small trees. At the three initial sites (WSc, BSs, and BSn), our analysis showed general common colonization and primary succession vegetation during the PSYs based on plot presence during the 3 years after the mudflat’s emergence.
All three sites had the same number of taxa (five) from the seven key PIO species but differed slightly depending on the community. All included C. erythrorhizos, L. panicoides, and Msc. grasses, but E. walteri, C. difformis, and multiple Msc. sedges were found at a single site only. At WSn, at the end of its third growing season (the first year of sampling), 50% of the lobe’s harvested plots along the most distal transect were dominated by just two PIO species (C. erythrorhizos and L. panicoides), and like the other sites during their third PSY, the FS were dominant in the community.
Abundance is more descriptive of the early wetland communities than presence during the PSYs (Figure 4). The top five most abundant of the nine PIO species from the 119 harvested PSY plots were C. erythrorhizos (total = 357 g), L. panicoides (301 g), C. difformis (174 g), E. walteri (140 g), and Sphenoclea zeylanica (114 g) (in order of mean AGB/m2). The total harvested AGB of these species over the PSY (9 combined years) amounted to more than a quarter (27.7%) of the AGB collected across all sites for the 50 combined study years (Table 1). The first-year substrates supported mostly PIO species (75.3% of the total AGB), with a large mix of very few OTH species (6.8%). More specifically, for the first year of the PSY at these sites, the five species averaged 67.8% of the total AGB on the then-nearly bare mudflats. The same year, the last four PIO species (Bacopa monnieri, Panicum dichotomiflorum, Ammannia coccinea, and Eclipta prostrata) made up just 7.5% of the mean site total AGB, and the first two were not harvested at every site. Our validation of early species colonization showed that two members of the PIO group (C. erythrorhizos and S. zeylanica) were most commonly observed mid-summer on newly emerged splay lobes well before their usual harvest in August.
Our analysis also showed that the four PIO species with the largest total study-wide AGB, on occasion, reappeared post-PSY (PPSY) at the three initial sites (Figure 3): C. difformis, particularly in 1993 at BSs in a significant eruption and with a smaller eruption in 1988 at BSn; E. walteri similarly at BSs in 1995/2004; L. panicoides, with a large increase at BSs in 1992; and C. erythrorhizos at the WSc site in 1994. In 2003, Msc. herbs at both BSs and BSn showed considerable eruptions, as well as periodic lower levels during other years at the three sites. Msc. grasses dominated the PSYs in a few plots only at WSc and BSn and for a few PPSYs at BSs. Lastly, Msc. sedges were rare in terms of plot dominance and during isolated PPSYs, which were mostly at WSc but also at BSn (Figure 3).
The percentages of plots/site/study PPSYs that were dominated by species other than FS are listed as follows (from high to low): WSc = ~19.7%; BSs = ~17.4; BSn = ~11.7; and WSn = 0. Sagittaria platyphylla was particularly found along lobe edges (~35% of the edge areas), and Sag. latifolia was often observed in large monospecific stands across the wider lobe at its adapted elevation. The other 65% AGB of Sagittaria platyphylla was observed in areas of either new mudflat growth where seeds were plentiful, well removed from upland species’ seeds, or areas of the same quality with reversion to the lower elevation threshold. The increase in the mudflat edge at the site also became a niche for Sag. latifolia on more firm edge areas of its adapted elevation space. Such edge morphodynamics are an attribute of deltas [50].

3.2.2. Plot Integration over Time

The nMDS analyses created trajectories of vegetation change across and within the wetland lobe areas, which confirmed the common patterns of change on Balize Delta splays. Analyses of variances (ANOSIM) for our large, study-wide efforts first revealed no major plant community differences among years or sites within the created species cloud (ANOSIM: p = 0.323). When the nMDS was run separately for each site, some significant differences were revealed (p = 0.029) in plant communities among sites at the same sampling site/time, especially among years (p = 0.004), as shown in the overlay of the four-site ordination model of trajectory plots presented in Figure 5, but in only two-dimensional space. The four plots along the single x-axis space are a composite of the three phases of vegetation change during the typical delta lobe cycle. Ordered from right to left along each third of the axis are (1) the start of colonization on nascent mudflats through the primary succession autogenic period; (2) a longer, much more dynamic community change period; and (3) a senescent phase culminating in wetland loss at only the site (WSn) with lands reverting to Mudflat.
The two-dimensional space of the nMDS trajectory became definable by the important five-plant taxonomic axis space (Figure 5) because of the known decreasing flood tolerance rankings for the four FS: SP > SL > SD > SN. As well as, the combined nine PIO species implied along the axis (from right to left) over the decades of vegetation change. Two other phytosociological implications demonstrated in the two dimensions of the figure can be described. First, Sal. nigra occurred usually as seedlings in plots associated with the PIO species during the first one to two years among the PSY community; if not, during PPSYs, Sal. nigra occurred on the higher substrates, usually as seedlings. Second, the trending community trajectory for both the WSc and BSs sites (the two most elevated sites) ended close to the same vegetation space (indicated by the arrows) because of the similar vegetation state-change, which resulted in the termination of the field sampling (coincidentally, ten years apart: 1998 and 2008).
A DistLM marginal test identified the 11 top species jointly on the four lobes of significance based on their high AGB among the 53 total taxa (p > 0.05; three herbaceous FS, six PIO, and two OTH; Table 2) using the ordination’s proportion rankings. The rankings define the structural change in the lobe vegetation during the decades of the study of the delta cycle. If only the face value of the AGB metric (abundance) was used in the analysis, taxa with high study-wide harvest values would with statistically significant importance commensurate with the Proportional metric; however, few did in the final derived constellation cloud. The best example was the third most abundant taxa collected and the most abundant PIO species: E. walteri (5566 g; Table 1), with a p-value below that of less abundant taxa. Incongruence was also observed in Sal. nigra, the fourth FS not listed among the 11, although it was the sixth most abundant taxon. Sal. nigra’s p-value = 0.146, which is far below significance, likely because of the presence of its seedlings during PSYs and many PPSYs, not unlike the vast majority of the non-PIO herbs within the explanatory model. Table 2 shows that only the top two species’ AGB metric rankings (Sc. deltarum and Sag. latifolia) align with the proportion and p-value listings, the rankings of which fully match.
The DistLM analysis is mostly reflective of the harvested data for each of the taxa, as well as their study-wide and site-wide abundance, but the AGB metric is apportioned with additional phytosociological data according to year, site, and plot through two other attributes: a taxon’s plot-by-plot presence over wetland area (its ecological evenness) and plot dominance among the 965 total tabulated plots. The combination of these three metrics (abundance, presence, and dominance) summarizes the relative importance of the taxa in the ordination, particularly for those reaching statistical significance.
The three herbaceous FS were highly present across plots and evenly spread over the sampled lobes: Sc. deltarum, with a mean presence (among the four lobes) = 75.1%; Sag. latifolia = 34.9%; and Sag. platyphylla = 9.2%. Salix nigra had a mean presence of 13.5%, which is below that of two of the top-four-ranked PIO species (E. walteri = 14.0% and C. difformis = 22.8%; Table 1). Most of the other taxa that were ranked proportionally high in the top 20 (not 11) DistLM marginal test results (Po. punctatum, T. domingensis, Pl. odorata, Panicum spp., Poaceae, or Cyperaceae—all with a presence > ~5.0) were so only during short eruptions over decades and therefore did not exhibit significant community composition change.
The metric plot dominance (Table 2) is an attribute that represents the area commonality among the taxa—a concept concerning the vegetation in the vicinity of each plot (rather than simply the abundance) but still including each plot. Such a metric is especially informative because each plot was locally area-representative according to its selection criteria (see Methods).
The three herbaceous FS were understandably highly plots, i.e., the lobe wetland area was dominant: Sc. deltarum was found in 53.1% of the 965 plots in the four lobes (the largest proportion); Sag. latifolia = 18.7%; and Sag. platyphylla = 8.2% and nearly fully dominant at WSn in its last 6 yrs (52 of 60 harvested plots = 86.7%). Salix nigra was found in 1.5% and only dominant at WSc, below the mean dominance of two of the top-four-ranked PIO species (E. walteri = 2.4%; and C. difformis = 2.9%). Sc. deltarum and Sag. latifolia are clearly predominant species on the study lobes (Table 2).

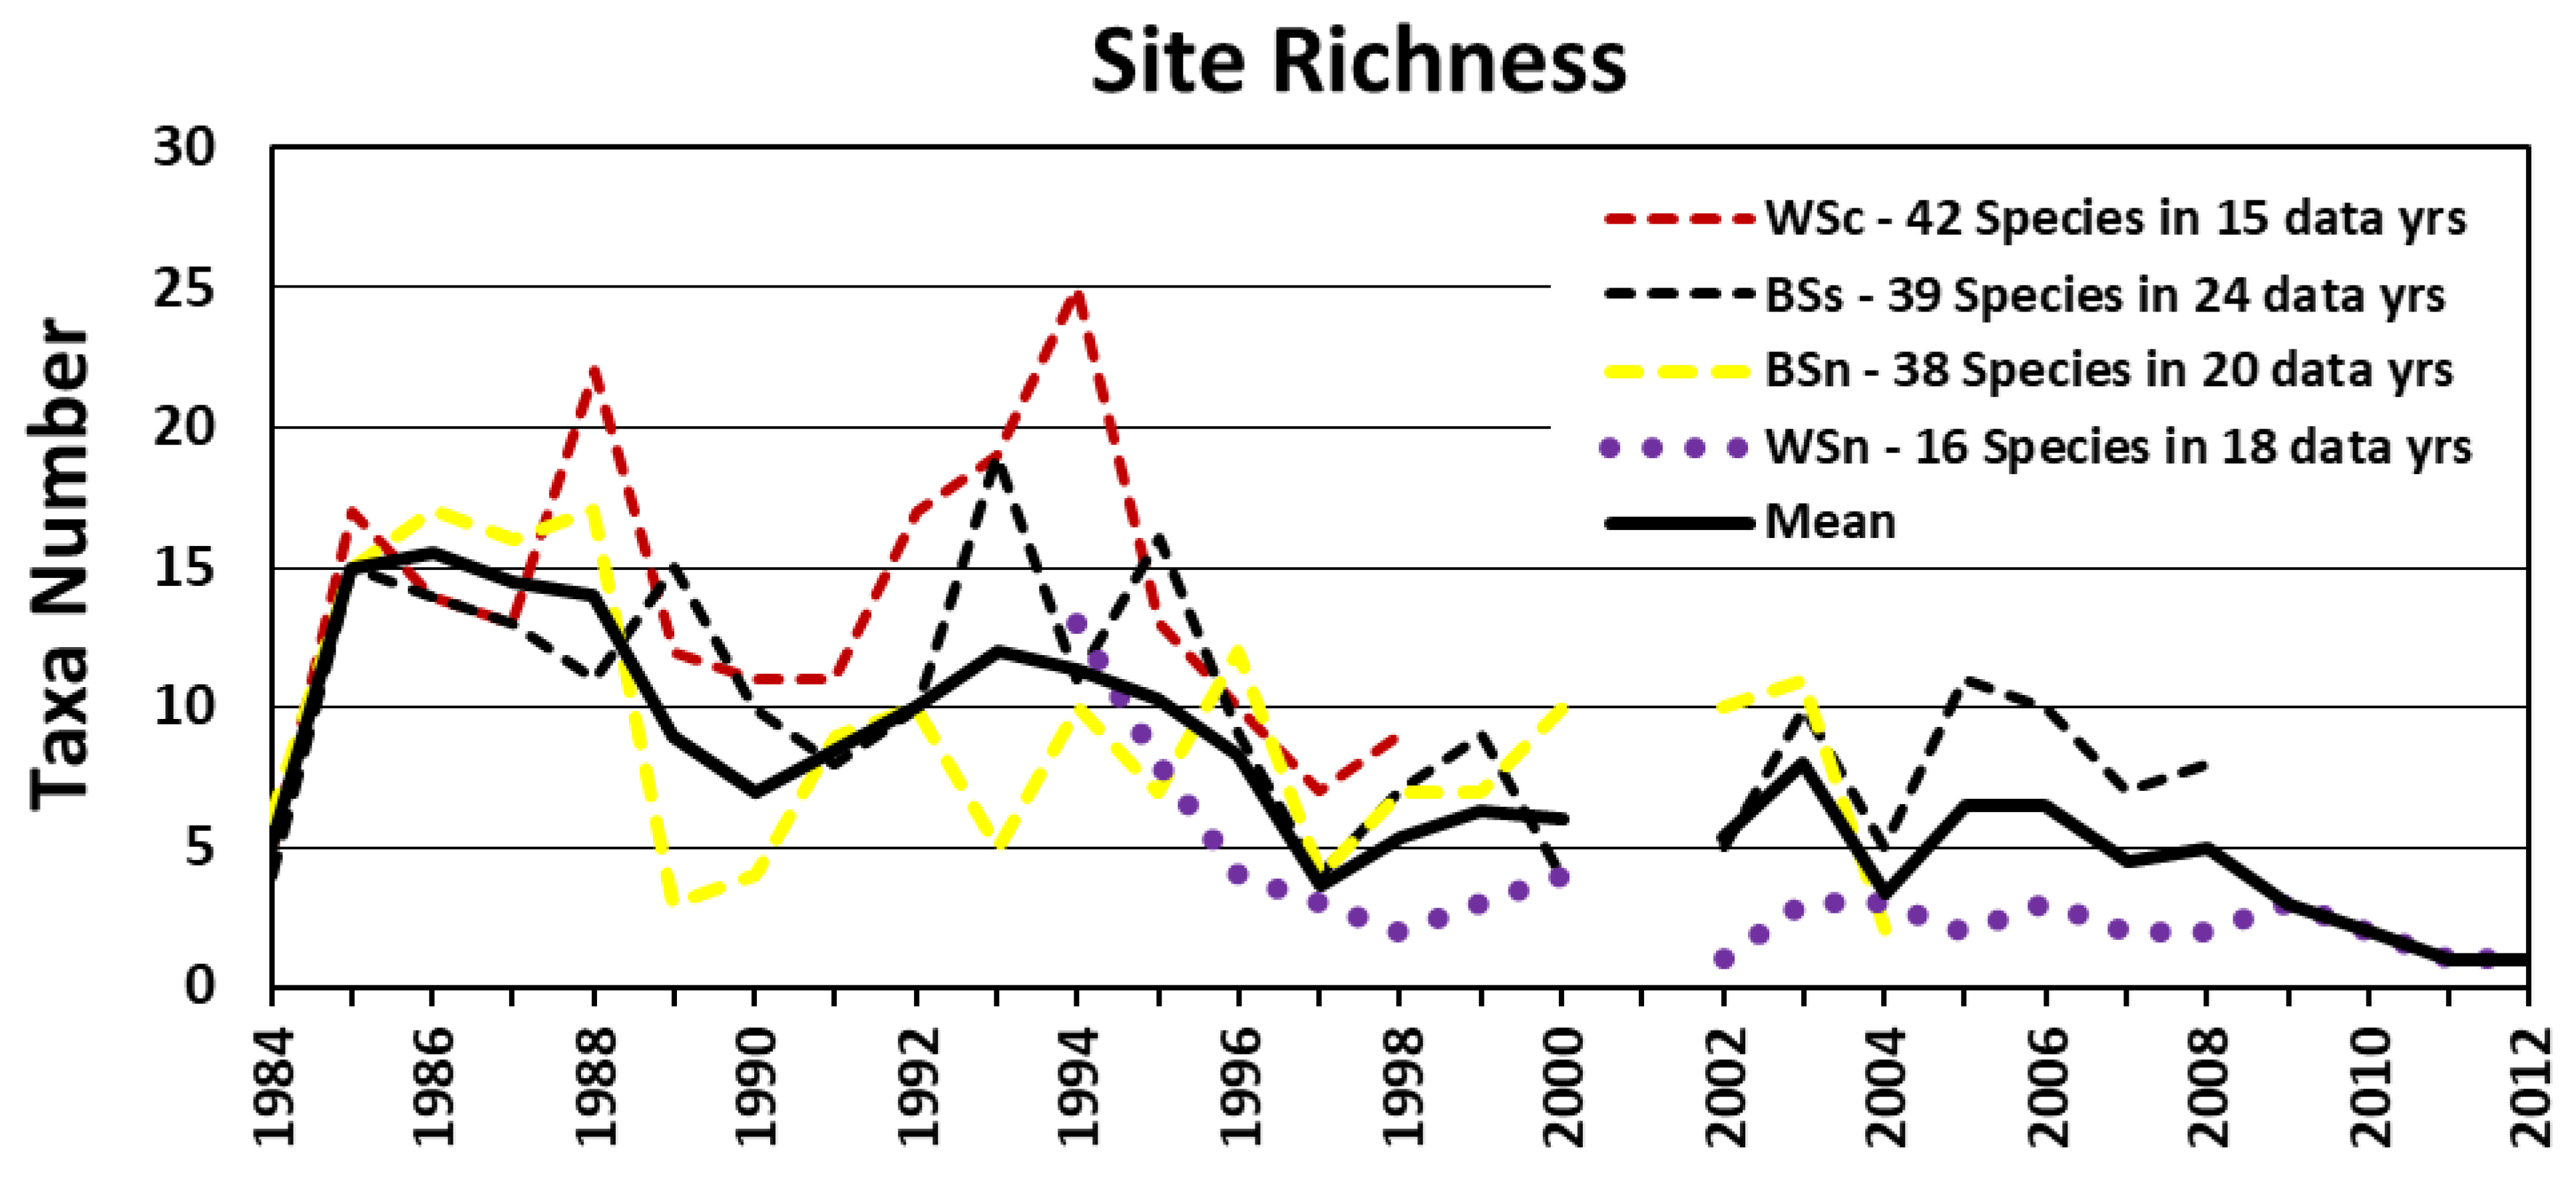
3.2.3. Lobe-Wide Richness Patterns

At the initial three study sites (BSs, BSn, and WSc), the species richness increased considerably between the first and second years of the harvest period (Figure 6). The richness then generally plateaued for a few years near the years 12–16, except for two significant short-term shifts: a large one-year spike to 22 species in 1988 at WSc, and a 2-year dramatic decline at BSn in 1989/1990. A large initial increase in richness at the final site (WSn) in its third year of vegetation establishment (1994) would have been recorded had it been monitored for all of its PSYs. At WSn, no plateau in richness occurred as at the other sites, but a 2-year decrease to a plateau level of +five species through 2008 was observed, followed by a decline to a monospecific stand of Sag. platyphylla in its final year before converting to open water.
Therefore, except for a few short-duration sharp increases in richness during the PSYs, the overall mean study-wide and across the four sites declined significantly (p < 0.001). However, BSn exhibited a precipitous decline in 1989, which resulted from the salt burn impact from tropical winds and an extensive herbivore eat-out, both with likely consequences lasting through collection time the following year.

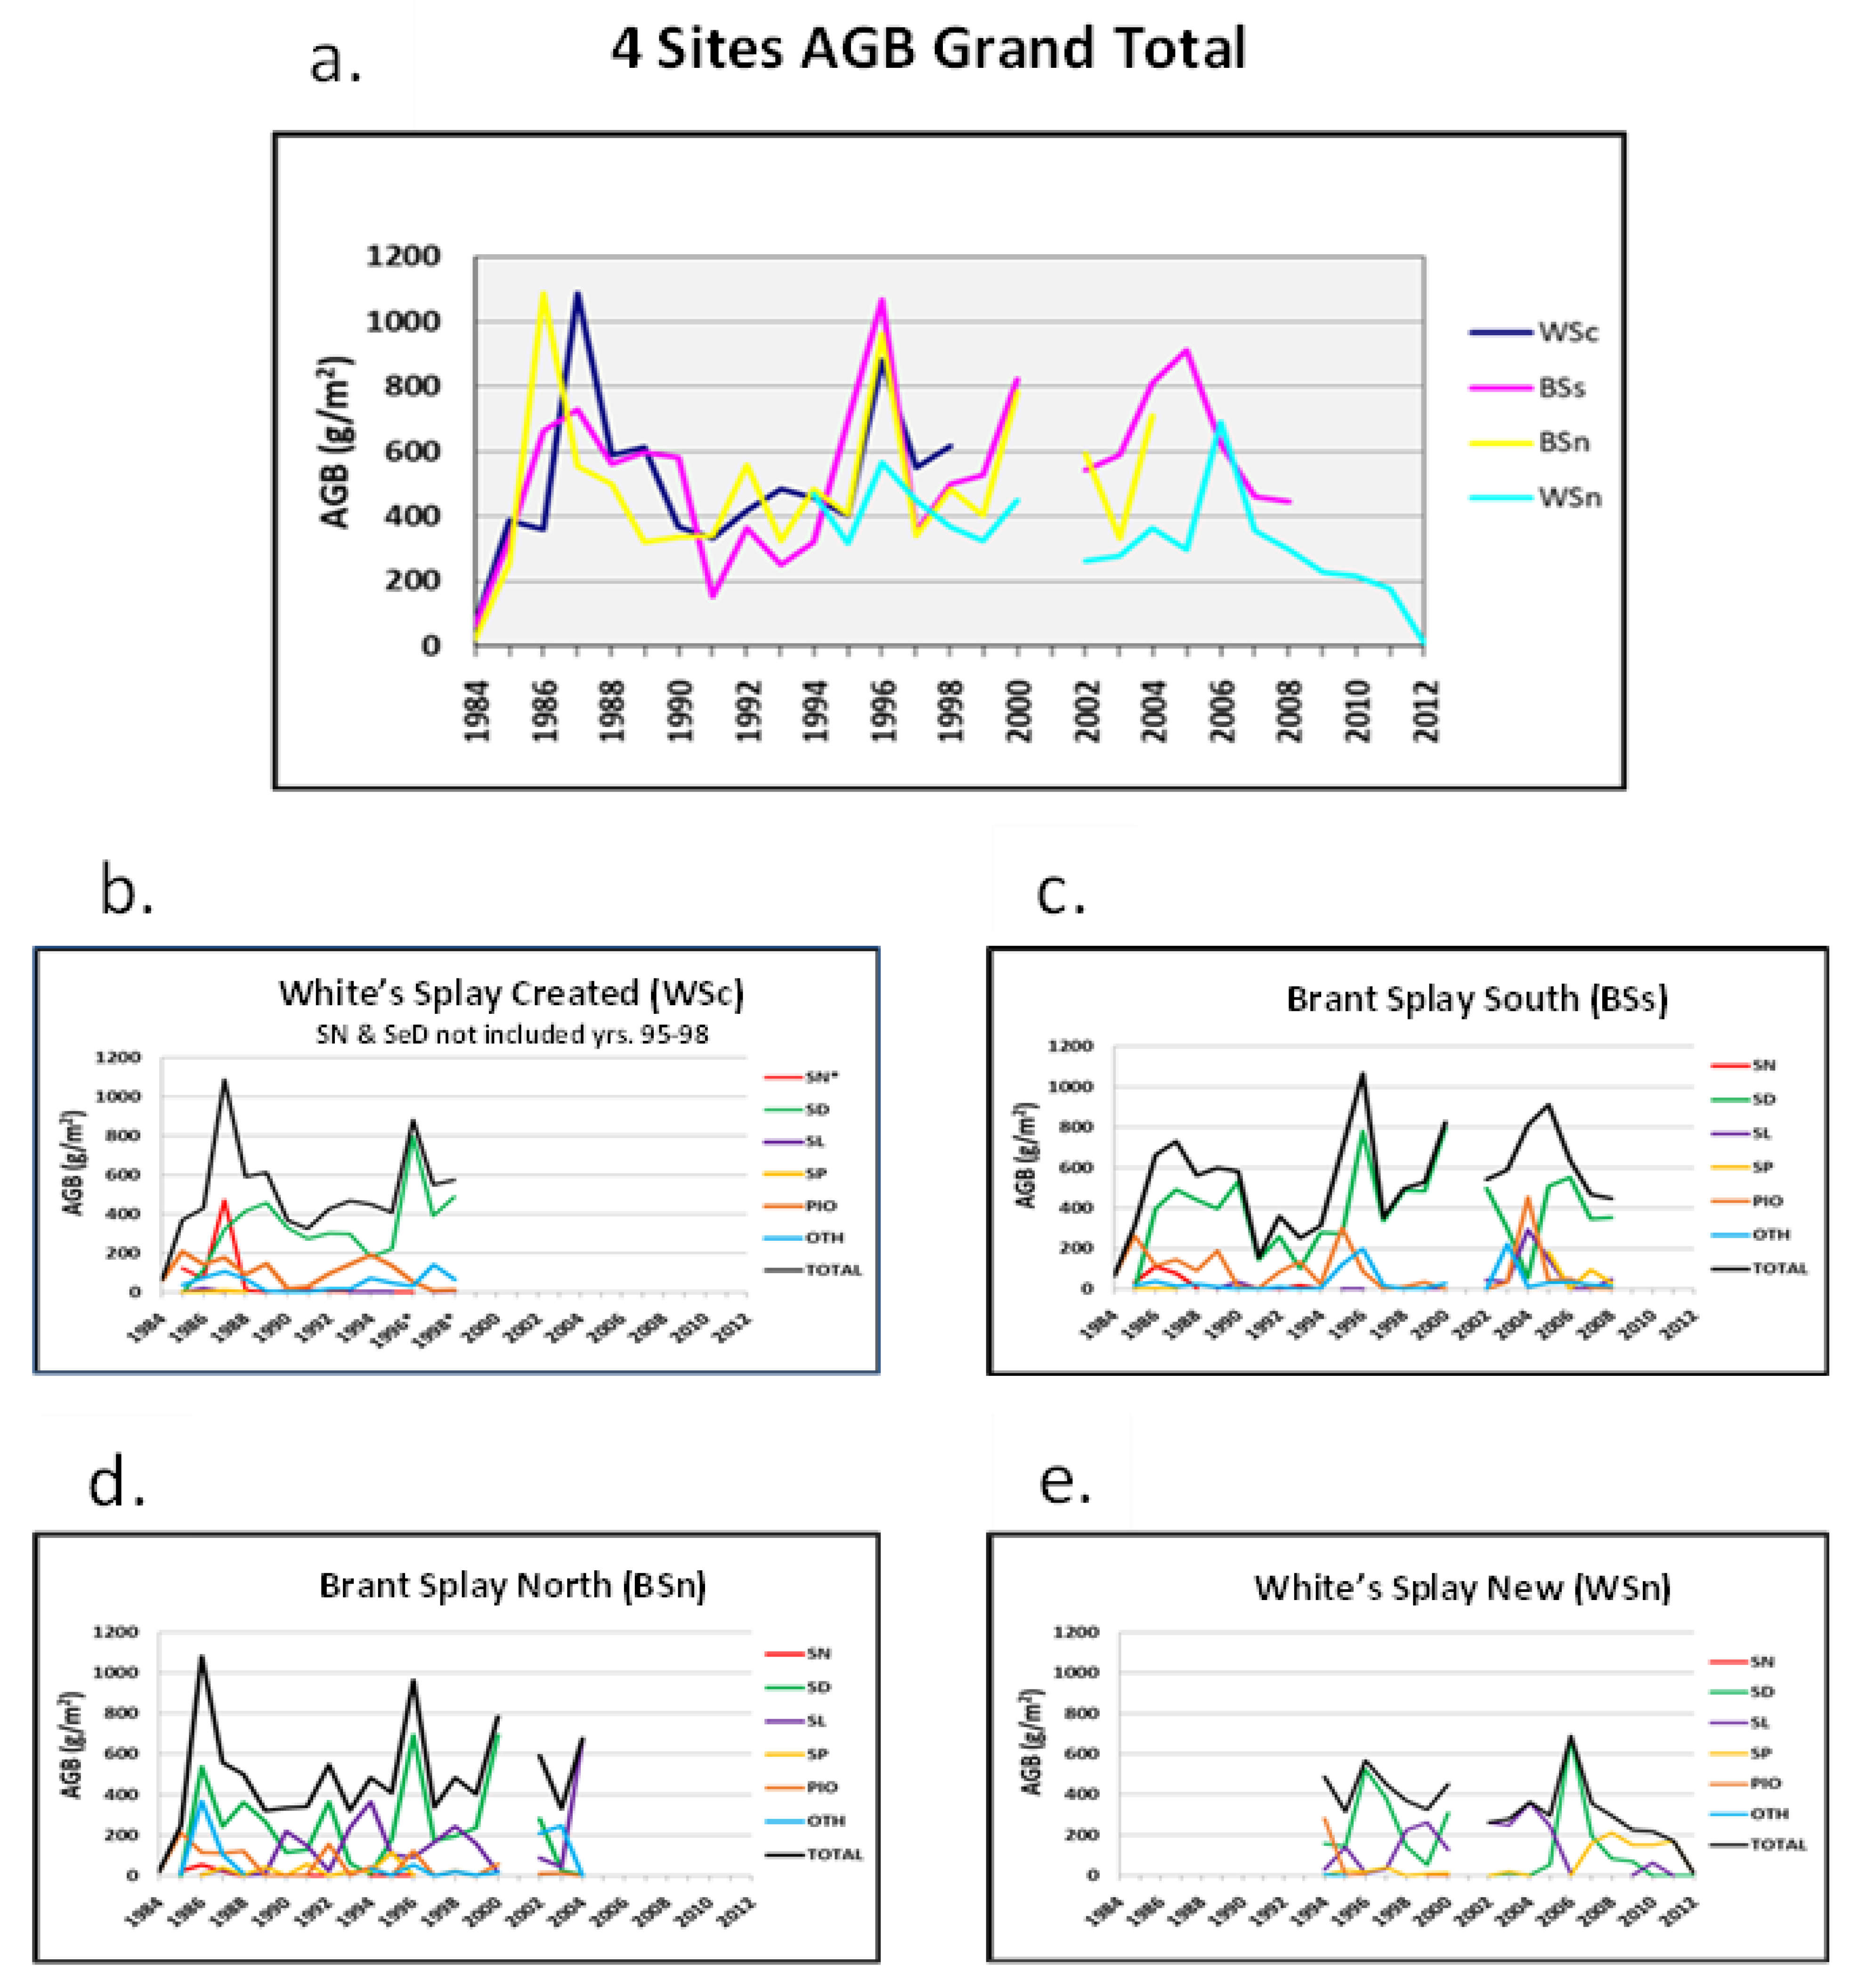
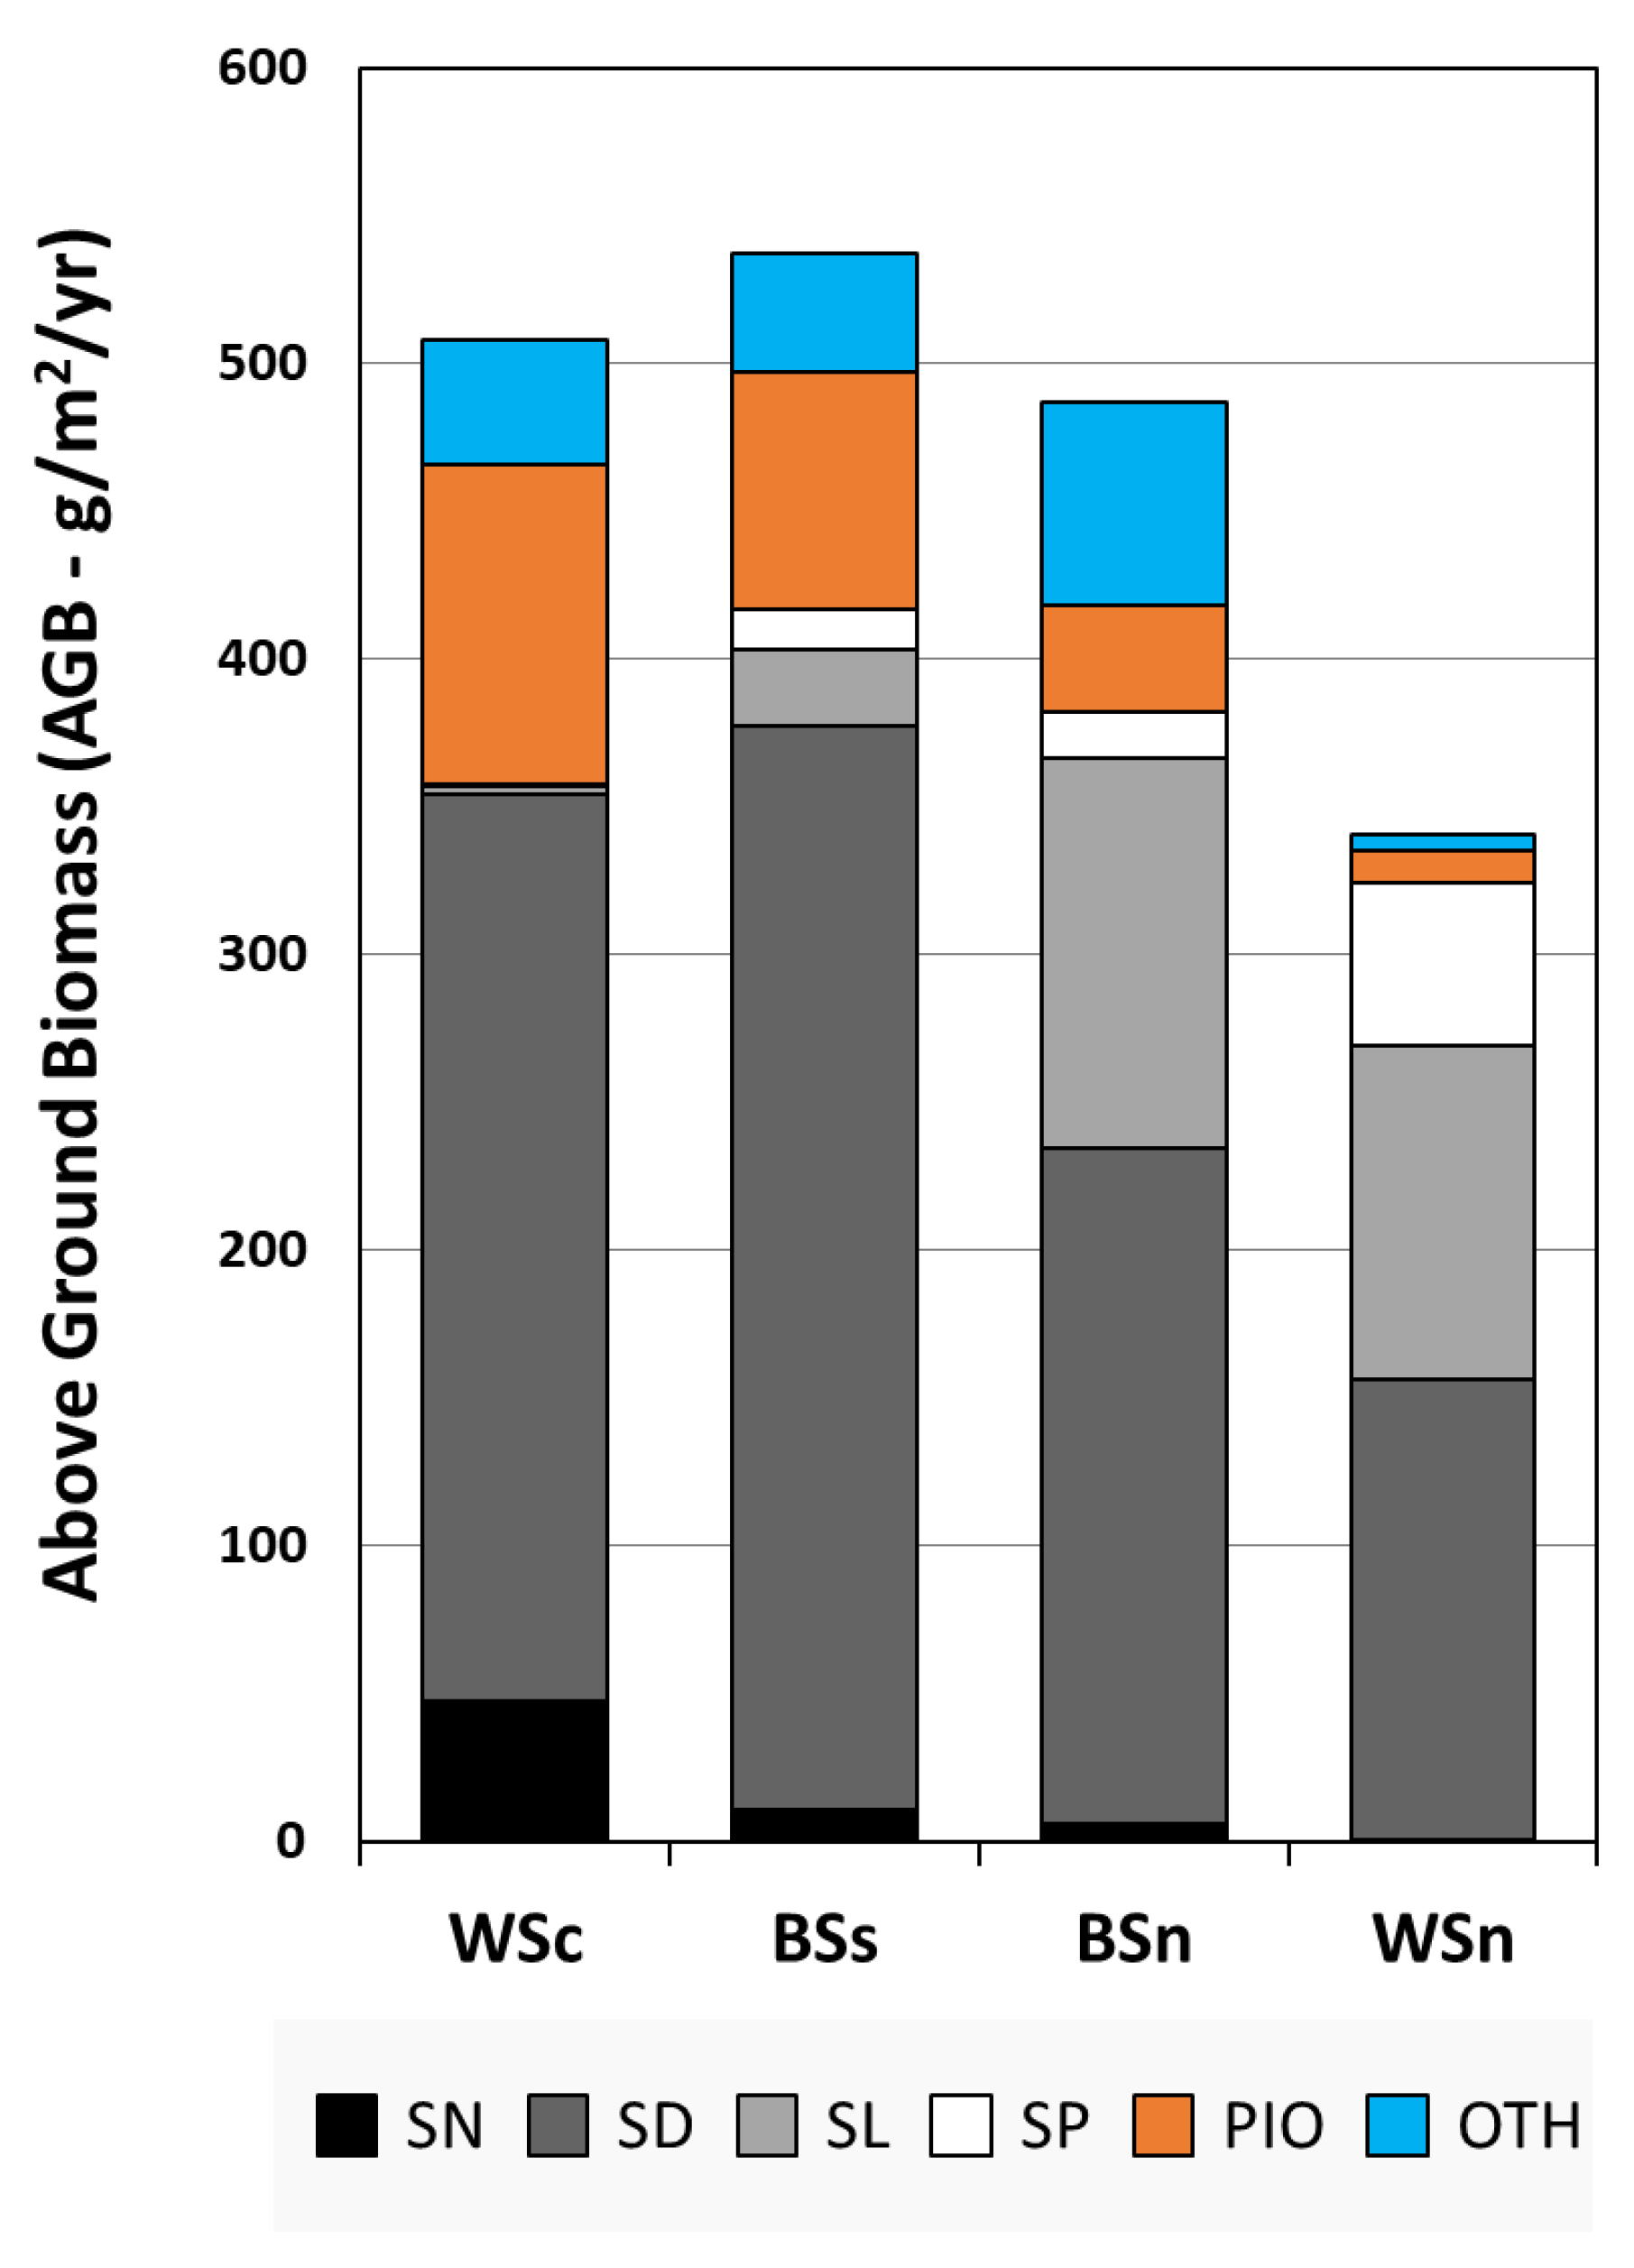
3.2.4. Lobe Total Biomass Patterns

On average, a remarkably similar TAGB (~500 g/m2/study yrs) was harvested at the three initial sites, i.e., WSc, BSs, and BSn (Figure 7). The TAGB of the WSn site was significantly lower over the study period (~350 g/m2/study yrs, p < 0.01). Importantly, when the site totals were parsed by the four FS and two other groups (PIO and OTH; Table 1), inter/intra-site patterns were found, with mean relative elevations as ranked in Figure 7 (WSc > BSs > BSn > WSn). These rankings were determined by coupling the metric of FS dominance/site represented by the area coverage/abundance of the four FS (mean TAGB/total study years) with fidelity to the actual elevation (the metric for flood tolerance; see Figure 2) on the lobes. The total abundance/site of Sal. nigra in Figure 7 tracked the relative elevations of the sites. Note that at WSc, the SN’s 1995–1998 data were not included at Transect 1 because of the state change to a shaded woody community of Sal. nigra plus mature individuals of the semi woody shrub Se. drummondii; thus, harvesting after the first year of seedlings meant no future AGB tracking at WSc Transect 1. At WSc, Sal. nigra was the most abundant usually as first-year seedlings (in 72 of 182 plots) and the least abundant at WSn (found in only four of its 176 plots).
FS Sc. deltarum’s abundance generally mirrored the rankings of Sal. nigra, although the total collected AGB of the species was somewhat higher at BSs compared to that at WSc (Figure 7). Holding true to the elevation fidelity, both Sag. latifolia, the FS of middle substrate elevations, and Sag. platyphylla, the FS common to the lowest lobe elevations, followed the site rankings but conformingly opposite to that of Sal. nigra and Sc. deltarum.
Not only is this fidelity to elevation validated by the FS abundances; it was a wetland splay lobe community attribute that was fully mirrored when combining the total mean/yr AGB of the PIO species of each site with that of its OTH species. The WSc site accounted for 28.6% of the total AGB from these two groups, BSs accounted for 22.9%, BSn accounted for 21.3%, and WSn accounted for 4.8%. The total AGB of these two groups individually matched the site elevation rankings, with the exception of OTH species at BSn. Therefore, lobe elevation (the degree of flooding) is an important index of gross vegetation change.

3.2.5. Lobe Decadal Vegetation Patterns

Tracking the inter- and intra-site AGB yearly totals (Figure 4; Table 3) revealed seven patterns across the common years of harvest of all possible pairings of sites:
  • A highly significant correlation among the three most elevated sites (WSc, BSs, and BSn) when the three common PSYs were included. The one exception was for the 15 common harvest years between WSc and BSn—a period of no significance, although the AGB did show a correlation during the PPSY (i.e., after 1987);
  • The lowest mean elevation site (WSn) paired with the other three sites never showed significance across the common years of study (Table 3);
  • The most striking pattern of the annual total AGB values occurred in 1996, when all lobe sites experienced a sharp one-year increase in community biomass, particularly for the three most elevated sites (Figure 4a);
  • Large single-year increases were common across all sites (in 1986 at BSn, 1987 at WSc, 2005 at BSs, and 2006 at WSn), with matched increases in other years (BSs–BSn in 2000, BSs–BSn in 2004), and likely through 2005 if BSn had been harvested (the channel access was blocked by more than 0.5 km of floating and aquatic vegetation). The yearly trends in the total harvested AGB followed the abundances of Sc. deltarum and Sag. latifolia (Figure 4b–e);
  • An intrasite pattern was statistically substantiated. Over the full study period at BSn, an inverse relationship between the presence of Sc. deltarum and Sag. latifolia occurred (CC = −0.534; p < 0.05). At BSn, Sc. deltarum and the combined members of OTH species showed positive relationships over the study years (CC = 0.551; p < 0.05). An inverse significance was observed among FS at the WSn site: between Sc. deltarum and Sag. latifolia (CC = −0.545; p < 0.05) and at the same site between Sag. latifolia and Sag. platyphylla (CC = −0.584; p < 0.05; Figure 4d). Hints of this pattern were visible at WSn between Sc. deltarum and Sag. latifolia (Figure 4e) but not among herbaceous FS at WSc. Because WSc was the most elevated site, its construction likely had impacts, although Sc. deltarum was common at that site;
  • Several FS experienced eruptions in particular years, such as the 1996 increase in Sc. deltarum at all sites and two large increases of the same species at the three sites that were then under study: BSs, BSn, and WSn in 2000 and BSs and WSn in 2006. In 2004, at the same sites, Sag. latifolia exhibited substantial increases. The fourth and woody FS, Sal. Nigra, showed a massive peak in abundance at WSc during the fourth year of study (1987, its first PPSY) and primarily as seedlings during all years of the study. During the PPSYs, Sal. nigra seedlings were harvested in only 15 plots of the 763 other sites and grew into young shading trees the last 4 years at WSc, along with the semi woody Se. drummondii (Figure 4). Figure 4 does not adequately depict the extensive diversity of understory woody to semi woody shrubs and the occasional other tree taxa.

3.2.6. MRBD Splay Wetland Growth

Winter NASA infrared images (Figure 8) reveal the three unique habitats of the Brant Splay and White’s Splay. The forest community indicated in red is dominated by Sal. nigra, and the white to blueish white colors correspond to bare winter mudflats that transform during the growing season into the herbaceous marsh lands harvested in the study and the generally aquatic water areas mostly dissected interiorly by channel feeder passes to open-water shallow ponds. The areas of the two terrestrial habitats minus any open-water areas among them were used to calculate the splay growth rates of the areas that were at times supportive of submergent vegetation [46]. For 22 years, the two Brant Pass terrestrial habitats grew to 5.87 km2, with forested and herbaceous lands occupying 1.23 km2 and 4.64 km2, respectively. Both land types grew more quickly over the first measured interval (1978–1983), then slowed (1983–1995), followed by an increase in growth (1995–2000). The herbaceous wetlands grew four times faster than the forested areas during each of the three intervals.

3.2.7. River Quality and Wetland Impacts

Quantile regression analyses showed that both the water quality and quantity of the MR influence the prevalence and abundance of the two most ubiquitous herbaceous species (Sc. deltarum and Sag. latifolia), with significant impacts on the total AGB production of the splay lobe wetlands (Table 4). The summer river temperature had no effect on AGB, although the growing season length had a negative effect on both the total and Sc. deltarum AGB (Table 4). Discharge from the MR was identified as the only environmental factor that significantly affected both TAGB and the AGB of each species. The best predictor of AGB was spring discharge. Although both the linear and quadratic relationships were significant based on the likelihood ratio, the parameters for the relationships were only significant for the linear relationship during the spring season. Both the total and Sc. Deltarum AGB generally declined with increasing spring discharge, whereas the Sag. latifolia AGB increased with increasing spring discharge. The total AGB and that of Sc. deltarum were also significantly affected by nutrient loading, with the peak AGB occurring in the middle of the observed range.

4. Discussion

In this detailed long-term study, we followed both abiotic and biotic landscape changes within a delta lobe cycle from open water to open water [51] shaped by the MR. Because such cycles occur on multiple scales, our documentation of these changes can serve as a model for the ecology and phytosociology of Louisiana’s Delta Plain. The four splays studied in the Balize Delta were initially colonized by PIO species, which autogenically modified the area (see [36]). After their colonization, the three herbaceous FS grew to dominate substrate areas according to elevation. Only at WSc, the most elevated site, did FS Sal. nigra persist past the early germinated seedling stage. During its study years, WSc supported this woody species past the seedling stage, although along the shoreline, its numerous seedlings were grazed upon, likely by deer, nutria, and/or wild boar. Away from the shoreline, growth into young trees confirms that WSc is the most elevated site overall. Schoenoplectus deltarum became dominant on the two most elevated lobes over most years of each lobe’s multidecadal existence. Consistently, on the lowest two lobes, Sag. latifolia became dominant or subdominant over many years, despite annually alternating with SD on higher-elevation areas and with SP on the lower lobe areas. Such switches in dominance depended on the inherent accretion/subsidence balance of the yearly substrate growing season along the lobe’s subtle elevation gradient. The last step before submergence was only observed at the lowest mean elevation site, i.e., WSn, where near pure stands of Sag. platyphylla appeared in the last years before the lobe disappeared. The highest species richness occurred during the earliest years of splays. Both the richness and community diversity decreased as the FS became dominant. At the WSc and WSn sites, a general decline in AGB was observed over time, which may have been related to the manmade crevasse being less efficient in delivering sediments and nutrients to the WSc site. At the WSn site, the decline in AGB was related to the silting-in of the channel that delivered sediments and nutrients. White and Visser concluded that the total AGB on Brant’s Splay was negatively affected by river discharge [49]. When considering the two most common FS, the AGB of Sc. deltarum declined with increased discharge, whereas that of Sag. latifolia increased.
Deltaic rivers create abiotic physical landscape changes through seasonal sediment delivery, sediment allocation patterns, and annual flow, all of which alter the physical environment, with considerable ecological impacts [34,52]. Deltaic vegetation responds to the river’s seasonal temperature and nutrient loads and even the biota itself [49,53,54,55]. Vegetation affects flow patterns and sediment deposition [55], and, in turn, elevation change affects the vegetation composition [34]. In addition, abiotic ecological processes of surface sedimentation and deep landform subsidence [56] can be allogenic agents of natural biotic change in all active deltaic areas. Any driver that impacts soil quality can force vegetation change, especially if the vegetation ultimately significantly impacts elevation [34,57]. The phytosociology of each active cycle is not a perfect taxonomic timeline match due to interconnected processes governed by season, climate, geomorphology, and ecological events, each with timeline differences. Every forced taxonomic change is assuredly set by these inherent natural acts governed by the totality of the hydrological conditions that inform the coastal Louisiana delta and other deltas worldwide. For example, Sal. nigra stands grew into shrub-sized, plot-dominant individuals (Figure 3) over several years after an exceptionally high-water late spring in 1995, which brought new sediment that elevated the distal lobe substrates.
The concordant abundance and presence of vegetation changes on each lobe by at least the larger groups (FS and subdominants) confirm that considerable parallel elevation changes occurred on each lobe over decades (Figure 8b and [20]). However, portions of a lobe that remained monospecific over years do not fully preclude some change in elevation as long as they are within the species’ tolerance (ecological niche). Interlobe vegetation dynamism, especially solely as the result of environmental change, is a delta wetland norm. Such common inter-site patterns over both short periods up to years and even longer periods are forced by sedimentation coupled with subsidence, as well as the abiotic impacts of tropical storms on elevation [58,59], which result in similar processes (sediment deposition, erosion, and compaction) common to coastal wetlands [57,60]. All of the most common taxa on mud substrates of the Atchafalaya Delta [32] were harvested in this study. However, the most common FS, Sc. deltarum, has never been found in the Atchafalaya Delta of the Wax Lake Delta [32,57,61,62].
The identification of multiple significant lobe changes in this study brought on after flood pulse events could have only occurred over a long study period. Regional pulse events of different scales (i.e., large events [63,64] and many local events) are a common occurrence in deltaic lands [25,63]. Carle et al. [65] showed the dramatic change in vegetation cover of the Wax Lake Delta following the record flood of 2011 that resulted in 35% of the delta shifting to higher-elevation communities. The largest event of this sort in our study occurred in the mid-1990s, which birthed the WSn site, enabling its detailed 18-year study. Another dramatic vegetation change occurred at the remaining three sites: a state change (sensu [66,67]) to highly statured populations of either cane (Ph. australis) or a woody species. Ph. australis often appeared in and around the study lobes in patches, representing the most common species both in terms of biomass and coverage metrics, growing over hundreds of km2 in the outer Balize Delta, particularly its eastern lobes, for many decades [68].
In the Balize Delta, the highest species richness occurred during the pioneer stages. Both species richness and community diversity decreased as the FS became dominant, generally matching the Atchafalaya Delta community trends [57] related to species numbers and distributions over a 6-year study period. A significant net upward elevation change at the sites with different taxa was also recorded, especially the dominant groups affected by extensive grazing. Our data indicate that lower lobe communities and elevations were far less changed after community establishment, even over nearly three decades of study, partially due to the much higher amount of deep subsidence in the Balize Delta compared to that in the Atchafalaya Delta [69]. Our most commonly harvested species, Sc. deltarum, the superior competitor over a range of elevations, was revealed through its monospecific stands, which likely competitively decreased the richness on the large Balize Delta lobe areas.
The young Atchafalaya Delta colonizing wetlands were studied by Montz [70] using coverage classes (sensu [71]). His permanent quadrat survey collected 241 species, identifying a rich community during colonization. Montz sampled all elevations and labeled two habitats: marshes and ridges, with the ridges about twice as rich [70]. Bevington et al. [62] found a lower level of species diversity compared to 1980s levels reported in the same area and blamed the lack of species diversity on the dominance (“coverage”) of the introduced Colocasia esculenta, a species that is far less prevalent in the Balize Delta than in the Wax Lake Delta [72] and that occurs in areas adjacent to the Sal. nigra community’s lower-down region of mucky substrates without flow.
In this study, the subtle causes of diversity change were impacted by the breadth of the FS monospecific dominance according to site (Figure 9). The plot dominance of FS at WSn after the first study year (1994, a PSY) was not found at the other three more elevated sites after their PSYs. Even later, in their first decade of study, taxa from OTH and PIO species were still present (Figure 3 and Figure 4) and far more often found only near the shoreline, the most elevated and naturally disturbed mud areas of the lobes. They can be labeled as “subordinately opportunistic”; rarely abundant; and, at times, even less common than PIO species. The most elevated site throughout the later study years, WSc, supported far greater quantities of PIO and OTH species than the two medium-elevation sites. Collected examples of these “opportunistic” OTH taxa had fleeting appearances of more than a few species that were occasionally unexplained when large single-season eruptions of a few particular taxa, such as V. luteola, Po. punctatum, and several grasses, especially Panicum spp. (Figure 3), occurred, although all three only accounted for 4.5% of total harvested AGB. Persistent seed rain or propagule drift in the waters seem to be the most likely causes when a colonizable niche area opens for often short-term appearances of such opportunists during the lobe cycle. After the pioneer years, at times only for a year, the opportunists covered only small ephemeral bare substrate patches created by at least four common stochastic events that deltas can experience:
  • Vegetation salt burn resulting from occasional salt intrusion from autumn tropical storms in coastal areas [57,73,74,75,76];
  • Herbivory, in which there are numerous mammals that do have a considerable area impact on the wetland vegetation [57,61,73,77,78,79];
  • Sediment pulses, which are instances of spotty deposition or erosion from small sediment pulse events, which create local patches of ±elevation changes, forcing vegetation changes [80]. They fit into the category of regeneration niches through the re-establishment process after a disturbance [81] and contributed considerably to the increase in the lobe-wide alpha diversity reported in this study, furthering lobe plant community dynamism;
  • Vegetation sediment impact: Some areas were fashioned in more subtle ways than others in this study at the landscape scale by autogenic processes, that is, within the lobe ecosystem itself by the taxa forcing changes in sedimentation [82,83,84]. The clearest example of this did not appear in the sampled plots but in localized lobe areas where particular vegetation (especially tall, introduced haplotypes, mostly of Typha sp., but at times Ph. australis; D.W., pers. obs.) created pockets of substrate elevation differences, often resulting in areas available for secondary establishment and further impacting the wetland’s alpha diversity.
Models have shown that over time, overall vegetation composition (vegetation quality) enhances variability in deltaic mobility (the coevolution of vegetation and delta channel networks), that is, “feedback” [85], which adds to the elevation diversity. Therefore, an increased overall beta diversity corresponds to cumulative vegetation patchiness [82,86], which is a well-understood relationship [32,65,87]. The effects of both sediment pulsing and the vegetation composition are fully integrated into deltaic ecology [55].
Scaling up from the increased local channeling effects, community-wide diversity is generally greater in larger deltas. Larger splays naturally support greater areas of the highest elevation, i.e., the areas of forest and mixed marsh with the highest beta diversity reported in this study. Channel diversions have been shown to impact species richness [88]. Generally, with significantly increased scaling in ecosystems, an uptick in the immigration of additional species logically follows [21]. White and Visser [49] analyzed data from the BSs and BSn sites and found that AGB increased over time, which seemed mostly to be a function of the reported 0.9 °C/decade increase in river water temperature. However, their study only included the years when FS dominated. By adding years in this study, the trend was obscured by the inclusion of the high AGB observed in the second year after colonization, when PIO species dominated and benefitted from local seed input. Carle and Sasser [89] showed that in the Wax Lake Delta, the vegetated area increased over time, as well as the average biomass of the vegetated areas (estimated from NDVI, i.e., satellite imagery of vegetation vigor). They also revealed that the impacts of hurricanes on NDVI were relatively short-lived [89].
At the WSn site, the reduction in AGB was related to the silting-in of the channel that delivered sediments and nutrients, which resulted in a decline in the more elevated substrates with a greater diversity. Carle and Sasser [90] showed that NDVI was positively correlated with the water level along the Louisiana coast. They speculated that the effect was due to tidal flushing and increased soil oxygenation. In this study, no significant effect of flooding on AGB was found, which may be due to the difference in species composition in the two deltas. Biomass in the Balize Delta is dominated by the contributions of Sc. deltarum, whereas in the Wax Lake Delta, biomass was dominated by Sag. latifolia in the 1980s [61] and by Nelumbo lutea Willdenow in the 2000s [50]. Nelumbo lutea is a species usually found on inundated to mucky substrates and seen only occasionally, apart from in our Balize Delta study areas in moderately sized and short-lived stands.
Carle and Sasser [89] showed no significant effect of river discharge on NDVI in the Wax Lake Delta. River discharge is a proxy for the amount of sediment that is deposited on the splays, which can bury tubers from the previous season, possibly delaying the emergence of Sc. deltarum and thereby reducing its biomass, giving a competitive advantage to Sag. latifolia. Such a phenomenon may be most important at the highest-elevation sites near the channels where Sc. deltarum dominates and where sediment deposition is the highest. AGB does not necessarily reflect the total annual productivity [90,91], especially for taxa that have a high level of biomass turnover (e.g., Sag. latifolia), which is common in freshwater marsh species [92].
The histories of all deltaic areas have a scale of growth (Figure 8; for this study, >2 decades = ~0.25 km2/yr), in which each unique land area for particular wetland vegetation is maintained over periods of time, even within short geological time frames if provided with sediment. Such growth was understandably much slower than for the very young Wax Lake Delta (1–3 km2/yr) [93], although far closer to its much higher earlier expected growth rate [31] reported in [93]. Cahoon [59] predicted that a several-kilometers-long SBP lobe would require ~1.4 cm/yr of sediment uniformly deposited over the entire lobe after vegetated marsh establishment for it to remain static, which is an improbable scenario both in terms of supply and distribution. Such a scenario would equate to complete FS dominance to balance subsidence from compaction and deeper geological processes. Therefore, implications related to the quality and quantity of subsidence rates over time and tropical storm impacts do increase deltaic dynamism [59], resulting in vegetation changes. With the additional impacts of potential salinity intrusion for deltas near ocean coastal areas, their dynamism becomes more complex [75]. Soil organic and mineral amendments of the original deposited sediment appear to be the norm below ground, increasing over time as a result of production by the surface plant life, especially during the PSYs, as shown in previous studies of these wetlands [20,36], although likely many years in the future [84,94,95,96]. Such “biogenic accretion” [97], i.e., autogenic impact, contributes to significant elevation and vegetation changes. The general “Fluvial Biogeomorphic Succession Theory” [98] uniquely details the feedbacks that forced the considerable changes observed in our study. The local-to-regional hydrological patterns within the Balize Delta create and support wetland plant composition over decades, as well as the diversity of the larger community. The plants themselves create change based on changes in water as well as where and when they occur [99]. Elevation dynamics are a key driving factor for vegetation dynamics within deltaic regions created mostly by the region’s hydrology [32,62] coupled with its sediment loads in water [1]. When sedimentation is restricted by changes in channel morphology or low river flow and falls out of balance with subsidence (subsidence may dominate), the niche space of the existing vegetation communities/species naturally changes. Finally, when channels silt in or change course, a site, a lobe, or a splay revert to open water.
Niche space theory suggests that the diversity (taxa) and quantity (AGB) of harvested vegetation in a studied wetland convey important information about the deltaic environmental conditions through time. To discover the reasons for the large area dominated by only a few species (FS), even in an ecosystem with considerable species diversity over a delta cycle, a large-scale study such as that reported herein is required, confirming the geological complexity of deltas [100]. The accommodation space for the taxa in all deltaic environments controlled by sedimentation is well established, with a clear impact of climate on sedimentation [101]. Large similar wetland areas have been noted as markers of global climate change [102]. In this study, data on the number of individuals of each species were not collected in our plots, making it impossible to calculate standard dominance indices (e.g., SIMPSON [103] or Berger–Parker [104]). We recommend that future long-term studies include such a measurement. Measurements of stem density, diameter, and height, which are important parameters for hydrologists that model flow through and over vegetated surfaces, are also recommended.
The stochastic nature of colonization and ultimate establishment by deltaic plants impact deltaic patterns, leading to in situ channel formations. Frans et al. [105] showed that in addition to the impacts of climate change on sediment, runoff levels from the replacement of natural cover species to agricultural crops in the upper Mississippi’s drainage area have increased nutrient contents (particularly nitrogen) within the river water. Therefore, impacts on vegetation quantity and diversity are likely to follow.
With major global increases in sediment flux [106], river flow (discharge, not fully considering all other river attributes), and sea levels [107] as a result of climate change [12,108], the future of the Louisiana coastline, with its usual dynamism, will become more important to parse. The inherently short-term, subtle impacts of climate necessitate long-term studies [109]. Scales of change over the decadal time periods reported in this study are illuminating. Hughes et al. [110] put it correctly when they stated: “long-term studies do indeed contribute disproportionately to ecology and environmental science”. Deltaic ecosystems suffer from both natural and human perturbations. Both hinder a full ecological understanding of impactful stochastic events. Past human impacts on freshwater systems including river-dominated deltas indeed have memorable effects [111].

Author Contributions

Conceptualization, D.A.W.; methodology, D.A.W. and J.M.V.; formal analysis, D.A.W. and J.M.V.; investigation, D.A.W.; resources, D.A.W.; data curation, D.A.W. and J.M.V.; writing—original draft preparation, D.A.W.; writing—review and editing, D.A.W. and J.M.V.; visualization, D.A.W.; supervision, D.A.W.; project administration, D.A.W.; funding acquisition, D.A.W. All authors have read and agreed to the published version of the manuscript.

Funding

This work was funded by the Louisiana Sea Grant Program (NOAA) through the earliest work of James Gosselink. The United States Geological Survey (USGS) funded our elevation dynamics efforts directed by Donald Cahoon. Throughout the first decades of this study, the United States Fish and Wildlife (USFW) Service’s Delta National Wildlife personnel provided in-kind boat storage at their Venice, Louisiana headquarters. James Harris and Pons Dixon of the USFW provided this long-term support. They graciously provided unfettered access to Delta National Wildlife Refuge, which permitted year-round access to the refuge and its buildings. Throughout the study, Loyola University, New Orleans, Department of Biological Sciences, and, later, its Program in the Environment provided vehicles, boats, and basic supplies through in-house faculty research grants. Numerous students were awarded funding from the then-well-endowed Mullahy Fund for Undergraduate Research (see pictures below).

Data Availability Statement

Data has been deposited in Dryad and are available to the scientific community. https://doi.org/10.5061/dryad.jq2bvq8fx (accessed on 28 September 2023).

Acknowledgments

D.W. would like to thank the numerous funding sources over the decades of this study. D.W. is indebted to Loyola undergraduate students for their devoted field work and data compilation, 12 of whom earned Honors in Biology. D.W. is also thankful for the many University administrators who backed the policy for this extraordinary work outside their normal study area. Departmental and university staff and technicians showed their full commitment. A special thanks to the many field volunteers over the years (students, local faculty, and friends). All were mesmerized by the beauty of the ecosystems within the Balize Delta. Challenges still exist in maintaining any long-term study. Both D.W. and J.V. are appreciative of Demetra Kandalepas of Southeastern Louisiana University for her statistical modeling and love of it, especially the nMDS ordinating required for the enormous dataset she meticulously worked on. We appreciate the archived paper water quality data provided early in the study by staff at the United States Army Corps of Engineers, New Orleans, LA. Finally, Tulane University’s Stephen Darwin must be acknowledged for his devotion to plant taxonomy; he made this detailed taxonomic study possible.
Water 15 03481 i001

Conflicts of Interest

The authors declare no conflict of interest.

References

  1. Edmonds, D.A.; Caldwell, R.L.; Brondizio, E.S.; Siani, S.M.O. Coastal flooding will disproportionately impact people on river deltas. Nat. Commun. 2020, 11, 4741. [Google Scholar] [CrossRef]
  2. Mitsch, W.J.; Gosselink, J.G. Wetlands; Van Nostrand Reinhold: New York, NY, USA, 1986. [Google Scholar]
  3. Götzenberger, L.; de Bello, F.; Bråthen, K.A.; Davison, J.; Dubuis, A.; Guisan, A.; Lepš, J.; Lindborg, A.; Moora, M.; Pärtel, M.; et al. Ecological assembly rules in plant communities—Approaches, patterns and prospects. Biol. Rev. 2012, 87, 111–127. [Google Scholar] [CrossRef]
  4. Kraft, N.J.B.; Adler, P.B.; Godoy, O.; James, E.C.; Fuller, S.; Levine, J.M. Community assembly, coexistence and the environmental filtering metaphor. Funct. Ecol. 2015, 29, 592–599. [Google Scholar] [CrossRef]
  5. National Research Council (NRC). Wetlands: Characteristics and Boundaries; National Academy Press: Washington, DC, USA, 1995. [Google Scholar]
  6. Fontaine, T.D.; Bartell, S.M. (Eds.) Dynamics of Lotic Ecosystems; Ann Arbor Science: Ann Arbor, MI, USA, 1983. [Google Scholar]
  7. Giosan, L.; Syvitski, J.; Constantinescu, S.; Day, J. 2Climate change: Protect the world’s deltas. Nature 2014, 516, 31–33. [Google Scholar] [CrossRef] [PubMed]
  8. Tessler, Z.D.; Vörösmarty, C.J.; Grossberg, M.; Gladkova, I.; Aizenman, H.; Syvitski, J.P.M.; Foufoula–Georgiou, E. Profiling risk and sustainability in coastal deltas of the world. Science 2015, 349, 638–643. [Google Scholar] [CrossRef] [PubMed]
  9. Stone, G.W.; Donley, J. The World Deltas Conference: A Tribute to the Late Professor J. Plummer Morgan: 1919–1995. J. Coastal Res. 1998, 14, 695–697. [Google Scholar]
  10. Day, J.W.; Boesch, D.F.; Clairain, E.J.; Kemp, G.P.; Laska, S.B.; Mitsch, W.J.; Orth, K.; Mashriqui, H.; Reed, D.J.; Shabman, L.; et al. Restoration of the Mississippi Delta: Lessons from hurricanes Katrina and Rita. Science 2007, 315, 1679–1684. [Google Scholar] [CrossRef]
  11. Nienhuis, J.H.; Ashton, A.D.; Edmonds, D.A.; Hoitink, A.J.F.; Kettner, A.J.; Rowland, J.C.; Törnqvist, T.E. Global–scale human impact on delta morphology has led to net land area gain. Nature 2020, 577, 514–518. [Google Scholar] [CrossRef]
  12. Tao, B.; Tian, H.; Ren, W.; Yang, J.; Yang, Q.; He, R.; Cai, W.; Lohrenz, S. Increasing Mississippi river discharge throughout the 21st century influenced by changes in climate, land use, and atmospheric CO2. Geophys. Res. Lett. 2014, 41, 4978–4986. [Google Scholar] [CrossRef]
  13. Coleman, J.M.; Roberts, H.H.; Stone, G.W. Mississippi River delta: An overview. J. Coastal Res. 1998, 14, 699–716. [Google Scholar]
  14. Batker, D.; de la Torre, I.; Costanza, R.; Day, J.W.; Swedeen, P.; Boumans, R.; Bagstad, K. The threats to the value of ecosystem goods and services of the Mississippi delta. In Perspectives on the Restoration of the Mississippi Delta; Day, J., Kemp, J.G., Freeman, A., Muth, D., Eds.; Springer: Dordrecht, The Netherlands, 2014; pp. 55–173. [Google Scholar] [CrossRef]
  15. Day, J.W.; Kemp, J.G.; Freeman, A.; Muth, D. Introduction: Perspectives on the restoration of the Mississippi Delta. In Perspectives on the Restoration of the Mississippi Delta; Day, J., Kemp, J.G., Freeman, A., Muth, D., Eds.; Springer: Dordrecht, The Netherlands, 2014; pp. 1–7. [Google Scholar] [CrossRef]
  16. Martin, J.F.; Reyes, E.; Kemp, G.P.; Mashriqui, H.; Day, J.W. Landscape modeling of the Mississippi delta: Using a series of landscape models, we examined the survival and creation of Mississippi Delta marshes and the impact of altered riverine inputs, accelerated sea–level rise, and management proposals on these marshes. BioScience 2002, 52, 357–365. [Google Scholar] [CrossRef]
  17. Roberts, H.H. Dynamic changes of the Holocene Mississippi River delta plain: The delta cycle. J. Coastal Res. 1997, 13, 605–627. [Google Scholar]
  18. Sasser, C.E.; Gosselink, J.G.; Holm, G.O.; Visser, J.M. Tidal freshwater wetlands of the Mississippi River deltas. In Tidal Freshwater Wetlands; Barendregt, A., Whigham, D., Baldwin, A., Eds.; Backhuys Publishers: Leiden, The Netherlands, 2009; pp. 167–178. [Google Scholar]
  19. Blum, M.D.; Roberts, H.H. The Mississippi delta region: Past, present, and future. Annu. Rev. Earth Planet. Sci. 2012, 40, 655–683. [Google Scholar] [CrossRef]
  20. Cahoon, D.R.; White, D.A.; Lynch, J.C. Sediment infilling and wetland formation dynamics in an active crevasse splay of the Mississippi River delta. Geomorphology 2011, 131, 57–68. [Google Scholar] [CrossRef]
  21. Barbour, M.G.; Burk, J.H.; Pitts, W.D. Terrestrial Plant Ecology; Benjamin/Cummings: Menlo Park, CA, USA, 1980. [Google Scholar]
  22. Gosselink, J.G. The Ecology of Delta Marshes of Coastal Louisiana: A Community Profile; National Coastal Ecosystems Team, Division of Biological Services, Research Development, Fish and Wildlife Service, US Department of the Interior: Washington, DC, USA, 1984. [Google Scholar]
  23. Van Der Valk, A.G. Succession in wetlands: A Gleasonian approach. Ecology 1981, 62, 688–696. [Google Scholar] [CrossRef]
  24. Gosselink, J.G.; Turner, R.E. The role of hydrology in freshwater wetland ecosystems. In Freshwater Wetlands. Ecological Processes and Management Potential; Good, R.E., Whigham, D.F., Simpson, R.L., Johnson, C.G., Eds.; Academic Press: New York, NY, USA, 1978; pp. 63–78. [Google Scholar]
  25. Day, J.W.; Pont, D.; Hensel, P.F.; Ibañez, C. Impacts of sea-level rise on deltas in the Gulf of Mexico and the Mediterranean: The importance of pulsing events to sustainability. Estuaries 1995, 18, 636–647. [Google Scholar] [CrossRef]
  26. Middleton, B.A. Wetland Restoration, Flood Pulsing, and Disturbance Dynamics; J. Wiley & Sons: New York, NY, USA, 1999. [Google Scholar]
  27. Scheffer, M.; Carpenter, S.R. Catastrophic regime shifts in ecosystems: Linking theory to observation. Trends Ecol. Evol. 2003, 18, 648–656. [Google Scholar] [CrossRef]
  28. Gould, H.R.; McFarlan, E. Geologic history of the Chenier Plain, southwestern Louisiana. Gulf Coast Assoc. Geol. Soc. Trans. 1959, 9, 261–270. [Google Scholar]
  29. White, D.A. The geological and natural history of coastal Louisiana from the perspective of a plant landscape ecologist—And a lover of plants. In Proceedings of the Botanical Society of America Annual Meeting, New Orleans, LA, USA, 27 July–1 August 2013. [Google Scholar]
  30. Frazier, D.E. Recent deltaic deposits of the Mississippi River: Their development and chronology. Gulf Coast Assoc. Geol. Soc. Trans. 1967, 17, 287–315. [Google Scholar]
  31. Van Heerden, I.L.L.; Roberts, H.H. Atchafalaya Delta—Louisiana’s New Prograding Coast. AAPG Bull. 1980, 64, 1568. [Google Scholar]
  32. Johnson, W.B.; Sasser, C.E.; Gosselink, J.G. Succession of vegetation in an evolving river delta, Atchafalaya Bay, Louisiana. J. Ecol. 1985, 73, 973–986. [Google Scholar] [CrossRef]
  33. Wells, J.T.; Coleman, J.M. Wetland loss and the subdelta life cycle. Estuar. Coast. Shelf Sci. 1987, 25, 111–125. [Google Scholar] [CrossRef]
  34. Rejmánek, M.; Sasser, C.E.; Gosselink, J.G. Modeling of vegetation dynamics in the Mississippi River deltaic plain. Vegetatio 1987, 69, 133–140. [Google Scholar] [CrossRef]
  35. Roberts, H.H.; Adams, R.D.; Cunningham, R.H.W. Evolution of the sand–dominated subaerial phase, Atchafalaya Delta, Louisiana. AAPG Bull. 1980, 64, 264–279. [Google Scholar] [CrossRef]
  36. White, D.A. Vascular plant community development on mudflats in the Mississippi River delta, Louisiana, USA. Aquat. Bot. 1993, 45, 171–194. [Google Scholar] [CrossRef]
  37. Boesch, D.F.; Josselyn, M.N.; Mehta, A.J.; Morris, J.T.; Nuttle, W.K.; Simenstad, C.A.; Swift, D.J.P. Scientific assessment of coastal wetland loss, restoration and management in Louisiana. J. Coastal Res. 1994, SI 20, i-103. [Google Scholar]
  38. Boyer, M.E.; Harris, J.O.; Turner, R.E. Constructed crevasses and land gain in the Mississippi River Delta. Restor. Ecol. 1997, 5, 85–92. [Google Scholar] [CrossRef]
  39. Cahoon, D.R.; Marin, P.E.; Black, B.K.; Lynch, J.C. A method for measuring vertical accretion, elevation, and compaction of soft, shallow-water sediments. J. Sediment. Res. 2000, 70, 1250–1253. [Google Scholar] [CrossRef]
  40. O’Neil, T. The Muskrat in the Louisiana Coastal Marshes; Louisiana Department of Wildlife and Fisheries: New Orleans, LA, USA, 1949. [Google Scholar]
  41. Angelini, C.; Altieri, A.H.; Silliman, B.R.; Bertness, M.D. Interactions among foundation species and their consequences for community organization, biodiversity, and conservation. BioScience 2011, 61, 782–789. [Google Scholar] [CrossRef]
  42. Schöb, C.; Butterfield, B.J.; Pugnaire, F.I. Foundation species influence trait-based community assembly. New Phytol. 2012, 196, 824–834. [Google Scholar] [CrossRef]
  43. Clarke, K.R. Non-parametric multivariate analyses of changes in community structure. Aust. J. Ecol. 1993, 18, 117–143. [Google Scholar] [CrossRef]
  44. Anderson, M.J. A new method for non-parametric multivariate analysis of variance. Austral Ecol. 2001, 26, 32–46. [Google Scholar] [CrossRef]
  45. Anderson, M.J.; Gorley, R.N.; Clarke, R.K. Permanova for Primer: Guide to Software and Statistical Methods; PRIMER-E: Plymouth, UK, 2008. [Google Scholar]
  46. Gabler, C.A. Modeling the Growth of a Louisiana Wetland: The Dynamics of the Brant Pass Splay Area. Bachelor’s Honors Thesis, Loyola University, New Orleans, LA, USA, 2004. [Google Scholar]
  47. Visser, J.M.; Sasser, C.E.; Cade, B.S. The effect of multiple stressors on salt marsh end–of–season biomass. Estuaries Coasts 2006, 29, 328–339. [Google Scholar] [CrossRef]
  48. Prentice, I.C.; Cramer, W.; Harrison, S.P.; Leemans, R.; Monserud, R.A.; Solomon, A.M. Special paper: A global biome model based on plant physiology and dominance, soil properties and climate. J. Biogeogr. 1992, 19, 117–134. [Google Scholar] [CrossRef]
  49. White, D.A.; Visser, J.M. Water quality change in the Mississippi River, including a warming river, explains decades of wetland plant biomass change within its Balize delta. Aquat. Bot. 2016, 132, 5–11. [Google Scholar] [CrossRef]
  50. Bevington, A.E.; Twilley, R.R. Island edge morphodynamics along a chronosequence in a prograding deltaic floodplain wetland. J. Coastal Res. 2018, 34, 806–817. [Google Scholar] [CrossRef]
  51. Nyman, J.A. Integrating successional ecology and the delta lobe cycle in wetland research and restoration. Estuaries Coasts 2014, 37, 1490–1505. [Google Scholar] [CrossRef]
  52. Wright, L.D. River Deltas. In Coastal Sedimentary Environments; Davis, R.A., Ed.; Springer: New York, NY, USA, 1978; pp. 5–68. [Google Scholar]
  53. Olliver, E.A.; Edmonds, D.A. Defining the ecogeomorphic succession of land building for freshwater, intertidal wetlands in Wax Lake Delta, Louisiana. Estuar. Coast. Shelf Sci. 2017, 196, 45–57. [Google Scholar] [CrossRef]
  54. Olliver, E.A.; Edmonds, D.A.; Shaw, J.B. Influence of floods, tides, and vegetation on sediment retention in Wax Lake Delta, Louisiana, USA. J. Geophys. Res. Earth Surface 2020, 125, e2019JF005316. [Google Scholar] [CrossRef]
  55. Twilley, R.R.; Day, J.W.; Bevington, A.E.; Castaneda-Moya, E.; Christensen, A.; Holm, G.; Heffner, L.R.; Lane, R.; McCall, A.; Aarons, A.; et al. Ecomorphology of coastal deltaic floodplains and estuaries in an active delta: Insights form the Atchafalaya Coastal Basin. Est. Coast. Shelf Sci. 2019, 227, 106341. [Google Scholar] [CrossRef]
  56. Kulp, M.; Penland, S.; Williams, S.J.; Jenkins, C.; Flocks, J.; Kindinger, J. Geologic framework, evolution, and sediment resources for restoration of the Louisiana coastal zone. J. Coastal Res. 2005, 44, 56–71. [Google Scholar]
  57. Shaffer, G.P.; Sasser, C.E.; Gosselink, J.G.; Rejmánek, M. Vegetation dynamics in the emerging Atchafalaya Delta, Louisiana, USA. J. Ecol. 1992, 80, 677–687. [Google Scholar] [CrossRef]
  58. Morton, R.A.; Barras, J.A. Hurricane impacts on coastal wetlands: A half–century record of storm–generated features from southern Louisiana. J. Coastal Res. 2011, 27, 27–43. [Google Scholar] [CrossRef]
  59. Cahoon, D.R. A review of major storm impacts on coastal wetland elevations. Estuaries Coasts 2006, 29, 889–898. [Google Scholar] [CrossRef]
  60. Jankowski, K.L.; Törnqvist, T.E.; Fernandes, A.M. Vulnerability of Louisiana’s coastal wetlands to present–day rates of relative sea–level rise. Nat. Commun. 2017, 8, 14792. [Google Scholar] [CrossRef]
  61. Evers, D.E.; Sasser, C.E.; Gosselink, J.G.; Fuller, D.A.; Visser, J.M. The impact of vertebrate herbivores on wetland vegetation in Atchafalaya Bay, Louisiana. Estuaries 1998, 21, 1–13. [Google Scholar] [CrossRef]
  62. Bevington, A.E.; Twilley, R.R.; Sasser, C.E. Deltaic floodplain wetland vegetation dynamics along the sediment surface elevation gradient and in response to disturbance from river flooding and hurricanes in Wax Lake Delta, Louisiana, USA. Geomorphology 2022, 398, 108011. [Google Scholar] [CrossRef]
  63. Day, J.; Lane, R.; Moerschbaecher, M.; DeLaune, R.; Mendelssohn, I.; Baustian, J.; Twilley, R. Vegetation and soil dynamics of a Louisiana estuary receiving pulsed Mississippi River water following Hurricane Katrina. Estuaries Coasts 2013, 36, 665–682. [Google Scholar] [CrossRef]
  64. Day, J.W.; Christian, R.R.; Boesch, D.M.; Yáñez-Arancibia, A.; Morris, J.; Twilley, R.R.; Naylor, L.; Schaffner, L. Consequences of climate change on the ecogeomorphology of coastal wetlands. Estuaries Coasts 2008, 31, 477–491. [Google Scholar] [CrossRef]
  65. Carle, M.V.; Sasser, C.E.; Roberts, H.H. Accretion and vegetation community change in the Wax Lake Delta following the historic 2011 Mississippi River flood. J. Coastal Res. 2015, 31, 569–587. [Google Scholar] [CrossRef]
  66. Brinson, M.M.; Christian, R.R.; Blum, L.K. Multiple states in the sea-level induced transition from terrestrial forest to estuary. Estuaries 1995, 18, 648–659. [Google Scholar] [CrossRef]
  67. Jentsch, A.; White, P. A theory of pulse dynamics and disturbance in ecology. Ecology 2019, 100, e02734. [Google Scholar] [CrossRef]
  68. White, D.A.; Hauber, D.P.; Hood, C.S. Clonal differences in Phragmites australis from the Mississippi River delta. Southeast. Nat. 2004, 3, 531–544. [Google Scholar] [CrossRef]
  69. Morton, R.A.; Bernier, J.C. Recent subsidence–rate reductions in the Mississippi Delta and their geological implications. J. Coastal Res. 2010, 26, 555–561. [Google Scholar] [CrossRef]
  70. Montz, G.N. Vegetational characteristics of the Atchafalaya River delta [Louisiana]. Proc. Louisiana Acad. Sci. 1978, 41, 71–84. [Google Scholar]
  71. Weaver, J.E.; Clements, F.E. Plant Ecology; McGraw Hill: New York, NY, USA, 1983. [Google Scholar]
  72. Jensen, D.; Cavanaugh, K.C.; Simard, M.; Christensen, A.; Rovai, A.; Twilley, R. Aboveground biomass distributions and vegetation composition changes in Louisiana’s Wax Lake Delta. Estuar. Coast. Shelf Sci. 2021, 250, 107139. [Google Scholar] [CrossRef]
  73. Gough, L.; Grace, J.B. Effects of flooding, salinity and herbivory on coastal plant communities, Louisiana, United States. Oecologia 1998, 117, 527–535. [Google Scholar] [CrossRef]
  74. Howard, R.J.; Mendelssohn, I.A. Salinity as a constraint on growth of oligohaline marsh macrophytes. I. Species variation in stress tolerance. Am. J. Bot. 1998, 86, 785–794. [Google Scholar] [CrossRef]
  75. Holm, G.O.; Sasser, C.E. Differential salinity response between two Mississippi River subdeltas: Implications for changes in plant composition. Estuaries 2001, 24, 78–89. [Google Scholar] [CrossRef]
  76. Steyer, G.D.; Perez, B.C.; Piazza, S.; Suir, G. Potential consequences of saltwater intrusion associated with Hurricanes Katrina and Rita. In Science and the Storms: The USGS Response to the Hurricanes of 2005; United States Geological Survey: Reston, VA, USA, 2007; pp. 137–146. [Google Scholar] [CrossRef]
  77. Fuller, D.A.; Sasser, C.E.; Johnson, W.B.; Gosselink, J.G. The effects of herbivory on vegetation on islands in Atchafalaya Bay, Louisiana. Wetlands 1984, 4, 105–114. [Google Scholar] [CrossRef]
  78. Taylor, K.L.; Grace, J.B. The effects of vertebrate herbivory on plant community structure in the coastal marshes of the Pearl River, Louisiana, USA. Wetlands 1995, 15, 68–73. [Google Scholar] [CrossRef]
  79. Geho, E.M.; Campbell, D.; Keddy, P.A. Quantifying ecological filters: The relative impact of herbivory, neighbors, and sediment on an oligohaline marsh. Oikos 2007, 116, 1006–1016. [Google Scholar] [CrossRef]
  80. White, P.S.; Pickett, S.T.A. Natural disturbances and patch dynamics: An introduction. In The Ecology of Natural Disturbance and Patch Dynamics; Pickett, S.T.A., White, P.S., Eds.; Academic Press: Orlando, FL, USA, 1985; pp. 3–13. [Google Scholar]
  81. Grubb, P.J. The maintenance of species-richness in plant communities: The importance of the regeneration niche. Biol. Rev. 1997, 52, 107–145. [Google Scholar] [CrossRef]
  82. Van Dijk, W.M.; Teske, R.; Van de Lageweg, W.I.; Kleinhans, M.G. Effects of vegetation distribution on experimental river channel dynamics. Water Resour. Res. 2013, 49, 7558–7574. [Google Scholar] [CrossRef]
  83. Jones, C.G.; Lawton, J.H.; Shachak, M. Organisms as ecosystem engineers. Oikos 1994, 69, 373–386. [Google Scholar] [CrossRef]
  84. Nyman, J.A.; Walters, R.J.; Delaune, R.D.; Patrick, W.H., Jr. Marsh vertical accretion via vegetative growth. Estuar. Coast. Shelf Sci. 2006, 69, 370–380. [Google Scholar] [CrossRef]
  85. Piliouras, A.; Kim, W. Upstream and downstream boundary conditions control the physical and biological development of river deltas. Geophys. Res. Lett. 2019, 46, 11188–11196. [Google Scholar] [CrossRef]
  86. Piliouras, A.; Kim, W. Delta size and plant patchiness as controls on channel network organization in experimental deltas. Earth Surf. Process. Landf. 2019, 44, 259–272. [Google Scholar] [CrossRef]
  87. Pollock, M.M.; Naiman, R.J.; Hanley, T.A. Plant species richness in riparian wetlands—A test of biodiversity theory. Ecology 1998, 79, 94–105. [Google Scholar] [CrossRef]
  88. Guan, B.; Chen, M.; Elsey-Quirk, T.; Yang, S.; Shang, W.; Li, Y.; Tian, X.; Han, G. Soil seed bank and vegetation differences following channel diversion in the Yellow River Delta. Sci. Total Environ. 2019, 693, 133600. [Google Scholar] [CrossRef]
  89. Carle, M.V.; Sasser, C.E. Productivity and resilience: Long-term trends and storm-driven fluctuations in the plant community of the accreting Wax Lake Delta. Estuaries Coasts 2016, 39, 406–422. [Google Scholar] [CrossRef]
  90. Odum, E.P.; Barrett, G.W. Fundamentals of Ecology; Saunders: Philadelphia, PA, USA, 1971; Volume 3. [Google Scholar]
  91. Shew, D.M.; Linthurst, R.A.; Seneca, E.D. Comparison of production computation methods in a southeastern North Carolina Spartina alterniflora salt marsh. Estuaries 1981, 4, 97–109. [Google Scholar] [CrossRef]
  92. Good, R.E.; Whigham, D.F.; Simpson, R.L.; Johnson, C.G. Freshwater Wetlands. Ecological Processes and Management Potential; Academic Press: New York, NY, USA, 1978. [Google Scholar]
  93. Allen, Y.C.; Couvillion, B.R.; Barras, J.A. Using multitemporal remote sensing imagery and inundation measures to improve land change estimates in coastal wetlands. Estuaries Coasts 2012, 35, 190–200. [Google Scholar] [CrossRef]
  94. Neill, C.; Deegan, L.A. The effect of Mississippi River delta lobe development on the habitat composition and diversity of Louisiana coastal wetlands. Am. Midl. Nat. 1986, 116, 296–303. [Google Scholar] [CrossRef]
  95. Morris, J.T.; Barber, D.C.; Callaway, J.C.; Chambers, R.; Hagen, S.C.; Hopkinson, C.S.; Johnson, B.J.; Megonigal, P.; Neubauer, S.S.; Troxler, T.; et al. Contributions of organic and inorganic matter to sediment volume and accretion in tidal wetlands at steady state. Earth’s Future 2016, 4, 110–121. [Google Scholar] [CrossRef]
  96. Osland, M.J.; Gabler, C.A.; Grace, J.B.; Day, R.H.; McCoy, M.L.; McLeod, J.L.; From, A.S.; Enwright, N.N.; Feher, L.C.; Stagg, C.L.; et al. Climate and plant controls on soil organic matter in coastal wetlands. Global Change Biol. 2018, 24, 5361–5379. [Google Scholar] [CrossRef]
  97. Törnqvist, T.E.; Cahoon, D.R.; Morris, J.T.; Day, J.W. Coastal wetland resilience, accelerated sea-level rise, and the importance of timescale. AGU Adv. 2021, 2, e2020AV000334. [Google Scholar] [CrossRef]
  98. Corenblit, D.; Baas, A.C.W.; Bornette, G.; Darrozes, J.; Delmotte, S.; Francis, R.A.; Gurnell, A.M.; Julien, F.; Naiman, R.J.; Steiger, J. Feedbacks between geomorphology and biota controlling earth surface processes and landforms: A review of foundation concepts and current understandings. Earth-Sci. Rev. 2011, 106, 307–331. [Google Scholar] [CrossRef]
  99. Marchetti, Z.Y.; Villalba, A.B.; Ramonell, C.; Brumnich, F.; Pereira, M.S. Biogeomorphic succession in a fluvial–lacustrine delta of the Middle Paraná River (Argentina): Feedbacks between vegetation and morphodynamics. Sci. Total Environ. 2020, 739, 139799. [Google Scholar] [CrossRef]
  100. Coleman, J.M. Dynamic changes and processes in the Mississippi River delta. Geol. Soc. Am. Bull. 1988, 100, 999–1015. [Google Scholar] [CrossRef]
  101. Rogers, K.; Zawadzki, A.; Mogensen, L.A.; Saintilan, N. Coastal wetland surface elevation change is dynamically related to accommodation space and influenced by sedimentation and sea–level rise over decadal timescales. Front. Mar. Sci. 2022, 9, 807588. [Google Scholar] [CrossRef]
  102. Bianchi, T.S.; Allison, M.A. Large-river delta-front estuaries as natural recorders of global environmental change. PNAS Sci. 2009, 106, 8085–8092. [Google Scholar] [CrossRef] [PubMed]
  103. Simpson, E.H. Measurement of diversity. Nature. 1949, 163, 688. [Google Scholar] [CrossRef]
  104. Berger, W.H.; Parker, F.L. Diversity of planktonic foraminifera in deep-sea sediments. Science. 1970, 168, 1345–1347. [Google Scholar] [CrossRef]
  105. Frans, C.; Istanbulluoglu, E.; Mishra, V.; Munoz-Arriola, F.; Lettenmaier, D.P. Are climatic or land cover changes the dominant cause of runoff trends in the Upper Mississippi River Basin? Geophys. Res. Lett. 2013, 40, 1104–1110. [Google Scholar] [CrossRef]
  106. Syvitski, J.P.M.; Kettner, A. Sediment flux and the Anthropocene. Philos. Trans. R. Soc. A Math. Phys. Eng. Sci. 2011, 369, 957–975. [Google Scholar] [CrossRef]
  107. Glick, P.; Clough, J.; Polaczyk, A.; Couvillion, B.; Nunley, B. Potential effects of sea-level rise on coastal wetlands in southeastern Louisiana. J. Coast. Res. 2013, 63, 211–233. [Google Scholar] [CrossRef]
  108. Gudmundsson, L.; Boulange, J.; Do, H.X.; Gosling, S.N.; Grillakis, M.G.; Koutroulis, A.G.; Leonard, M.; Liu, J.; Müller Schmeid, H.; Papadimitriou, L.; et al. Globally observed trends in mean and extreme river flow attributed to climate change. Science 2021, 371, 1159–1162. [Google Scholar] [CrossRef]
  109. Collins, S.L. Climate Change and Long-Term Ecological Research. BioScience. 2022, 72, 803. [Google Scholar] [CrossRef]
  110. Hughes, B.B.; Beas–Luna, R.; Barner, A.K.; Brewitt, A.; Brumbaugh, D.R.; Cerny-Chipman, E.B.; Close, S.L.; Coblentz, K.E.; de Nesnera, K.L.; Drobnitch, S.T.; et al. Long–term studies contribute disproportionately to ecology and policy. BioScience 2017, 67, 271–281. [Google Scholar] [CrossRef]
  111. Köhler, J. Long–term ecological research in freshwater ecosystems. In Long–Term Ecological Research: Between Theory and Application; Müller, F., Baessler, C., Schubert, H., Klötz, S., Eds.; Springer: Dordrecht, The Netherlands, 2010; pp. 179–187. [Google Scholar]
Figure 2. Illustration of a typical splay lobe (modified from [20] thanks to J. Lynch) with elevation change and spatial relationships depicting the spatial and height relationships of the wetland habitat on its platform range of <1 m from the shallow pond bottom (depth of ~ 50 cm) at the lobe’s low end of the emergent mudflat (+17 cm) to the low marsh (+26 cm), the high marsh (+30 cm), and the most upland Salix nigra (SN) forest (>6 cm; mean of three laser level readings). Thus, the flood tolerance for the four predominant community-identifying species (SN > SD > SL > SP) extends through only ~62 cm elevation, regardless of the lobe’s length. A lobe’s length can range from 50 meters to kilometers, as in the case of the BSs lobe. Key: SN = Salix nigra; SD = Schoenoplectus deltarum-dominated marsh; SL = Sagittaria latifolia low marsh; SP = Sagittaria platyphylla lowest marsh; and SAV = submerged aquatic vegetation.
Water 15 03481 g002
Figure 3. Histograms of the major dominant vegetation (eight species plus three Msc. groups thereof) at the four lobes in terms of percentage of plots dominated (greatest AGB) per study year. The AGB values of the five least harvested PIO species of the nine total (only 2.4% of total harvested) were added to their corresponding Msc groups to simplify the trends. Sites are labeled a to d (high to low) according to relative composite elevation.
Water 15 03481 g003
Figure 4. Total aboveground biomass (TAGB)/year for four sites (a) and for six groups/site (be) over the 28-year study. (b) WSc Site; (c) BSs Site; (d) BSn Site; and (e) WSn Site. Salix nigra (SN); Schoenoplectus deltarum (SD); Sagittaria latifolia (SL); Sagittaria platyphylla (SP); 9 pioneers (PIO); 40 other species (OTH—the remaining 53 taxa—Table 1). The AGB during WSc years of 1995–1998 omits the vegetation at Transect 1 because of the state change due to shading by S. nigra and the considerably lower number of Sesbania drummondii (SeD, see text; comparison of 1995–1998 in Figure 3).
Water 15 03481 g004
Figure 5. Nonmetric multidimensional scaling (nMDS) model of the aggregate trajectories for changes in plant community composition at the four lobe sites under study (WSc = White’s Splay constructed; BSs = Brant Splay south; BSn = Brant Splay north; and WSn = White’s Splay new) based on the harvested aboveground biomass (AGB) data of 13 species: 4 foundation species and 9 pioneers.
Water 15 03481 g005
Figure 6. Number of species and species groups harvested in 965 plots at four splay lobe sites over the 28-year study. The solid mean trend line shows the statistically significant decline in richness after the first late summer of mudflat plant colonization (R2 = 0.781; p-value = 9.82 × 10⁻¹⁰). Abbreviations: WSc = White’s Splay constructed; BSs = Brant Splay south; BSn = Brant Splay north; WSn = White’s Splay new. Note 1: The significant drop in richness at BSn during 1989/1990 occurred because of a serious salt burn event just days before harvest. Note 2: The 1994 richness at WSn was high (16 species) compared to the other sites during the initial year of harvest because WSn’s first year of harvest was year 3 of the wetland’s existence (see text), i.e., the year understood to be the last of the primary succession period [36].
Water 15 03481 g006
Figure 7. Site mean aboveground biomass (AGB) by year corrected for years harvested over the entire study (116,706 g total collected) of the four foundation species (Salix nigra (SN), Schoenoplectus deltarum (SD), Sagittaria latifolia (SL), and Sagittaria platyphylla (SP)) and two groups (pioneer species (PIO) all other species (OTH)). Sites are arranged from left to right in order of relative average elevation (high to low): WSc = White’s Splay constructed (15 yrs); BSs = Brant Splay south (24 yrs); BSn = Brant Splay north (20 yrs); and WSn = White’s Splay new (18 yrs).
Water 15 03481 g007
Figure 8. (a) Winter set of NASA infrared images of the two studied deltaic splays that show the period from birth after two natural levee breaches to maximum growth (modified from [46] in [20]). The splays began growing in a ~10 km2 shallow pond (an average of <1 m deep) east of the Mississippi River (see Figure 1 and Figure 2 for location context). The color shades in the 1995 image abruptly changing from reddish black to blue/white identify the two clearly dominant splay wetland types: forests up-slope and the more distal winter surface bare mudflats of summer marshes, with the shallow aquatic open water being the most distal. (b) Five-year elevation change data of five sites along the South Brant Pass lobe (see 2000 image) [20]. Relative elevations to pond bottom by site are shown over the ~3.2 km lobe SN to OW sites. SN = S. nigra site; SD = Sc. deltarum; SP = Sa. platyphylla; MF = mudflat; and OW = open water. * The high SD marsh elevation change was based on only one dataset due to the outlier status of a second site’s very high sediment loading and erosion from unpredicted feeder pass movement.
Water 15 03481 g008
Figure 9. Photos of the typical dominant wetland communities of a splay lobe within the Balize Delta, Louisiana, USA. All photos were taken by D.W. Note: the mixed highest marsh image depicts a large coverage that is generally a less extensive transition zone between forest and other marshes. * See [20].
Water 15 03481 g009
Table 1. Species groups and total aboveground biomass for 53 vascular plant species and groups thereof harvested (1984–2012) on deltaic lobes within the Balize Delta of the Mississippi.
GroupSpeciesTAGBTotalPTBTotal
Foundation Species
(4 taxa)
Schoenoplectus deltarum (Sch.) Soják65,808 56.4%
Sagittaria latifolia Willd.18,334 15.7%
Sagittaria platyphylla (Engelm.) J.G. Sm.5191 4.4%
Salix nigra Marsh.2673 2.3%
92,006 78.9%
Pioneer Species
(9 taxa)
Echinochloa walteri (Pursh) A. Heller *5566 4.8%
Cyperus difformis L. *3233 2.8%
Cyperus erythrorhizos Muhl. *2572 2.2%
Leptochloa panicoides (Presl) Hitchc. *1687 1.4%
Ammannia coccinea Rottb.806
Sphenoclea zeylanica Gaertn.752
Bacopa monnieri (L.) Pennell598
Panicum dichotomiflorum Michx.341
Eclipta prostrata (L.) L.301
15,856 13.6%
Other Species (40 taxa)
Msc. Grasses
(8 taxa,
32.8% of OTH)
Panicum spp.1272
Msc. Poaceae **1228
Panicum capillare L.136
Eragrostis hypnoides (Lam.) Britt., Sterns & Poggenb.95
Leersia sp. ***80
Paspalum fluitans (Elliott) Kunth29
Leptochloa fusca (L.) Kunth (fascicularis)14
Zizaniopsis miliacea (Michx.) Döll & Asch.5
2859 2.5%
Msc. Sedges
(8 taxa,
8.0% of OTH)
Msc. Cyperaceae **404
Eleocharis spp. 171
Juncus sp. ***41
Cyperus sp. ***33
Schoenoplectus tabernaemontani (C.C. Gmel.) Palla26
Cyperus surinamensis Rottb.10
Fimbristylis vahlii (Lam.) Link10
Juncus diffusissimus (Buckley)4
699 0.6%
Msc. Herbs
(24 taxa,
59.2% of OTH)
Vigna luteola (Jacq.) Benth.1643 1.4%
Polygonum punctatum Elliott1054
Typha domingensis Pers.1022
Pluchea odorata (L.) Cass.357
Msc. Dicotyledons **298
Lindernia dubia (L.) Pennell287
Sesbania drummondii (Rydb.) Cory151
Symphyotrichum sp. ***71
Colocasia esculenta (L.) Schott60
Ludwigia decurrens Walter36
Amaranthus australis (A. Gray) Sauer35
Iris sp. ***24
Polygonum lapathifolium L.20
Alternanthera philoxeroides (Mart.) Griseb.19
Rumex sp. ***19
Najas guadalupensis (Spreng.) Magnus17
Phytolacca sp. ***17
Hydrocotyle sp. ***11
Potomogeton sp. ***8
Ipomea sagittata Poir.5
Polygonum sp. ***3
Baccharis halimifolia L.2
Lythrum lineare L.2
Polygonum glabrum Willd.2
5163 4.4%
Notes: Voucher materials at LSU herbarium, Baton Rouge, LA, USA. Taxa are listed in order of total aboveground biomass harvested during the study (TAGB). Abbreviations: OTH = other species, PTB = percentage of total aboveground biomass harvested over the 28-year study provided >1% of 116,709 g total. * Species defined as common pioneers; such species represent 82.4% of the pioneer species’ TAGB. ** Species only identified at the family level represent 1.7% of TAGB. *** Species only identified at the genus level were sterile and found on only one transect, representing 0.2% of TAGB.
Table 2. Distance-based linear model (DistLM) marginal test results, relative importance components, and their rankings.
Species aGrouppProp bRAbun cRPres dRA + P eDom fRA + P + D g
Schoenoplectus deltarumFS0.0010.2998156.39175.11153.111
Sagittaria latifoliaFS0.0010.2845215.71234.92218.722
Sagittaria platyphyllaFS0.0010.128534.4549.2858.235
Leptochloa panicoidesPIO0.0010.112341.4585.997 h1.187
Cyperus erythrorhizosPIO0.0010.111352.20712.0662.656
Cyperus difformisPIO0.0010.079262.77522.8342.943
Ammannia coccineaPIO0.0190.042770.691213.258 h0.01110
Echinochloa walteriPIO0.0300.038284.77314.0432.564
Polygonum punctatumOTH0.0340.037390.90102.111110.1911
Vigna luteolaOTH0.0400.0346101.4194.31090.1108
Sphenochlea zeylanicaPIO0.0450.0315110.64139.37101.579
Notes: The table includes 11 species (of the 53 total harvested taxa) with statistical significance of p < 0.05. Two additional species had a study-wide AGB greater than 2 among the 11 listed species (Salix nigra, 2.3% (6th) and Typha domingensis, 0.90% (11th; see Table 1), but neither showed statistical significance in the DistLM. Two multiple-species taxonomic groups (Panicum spp., 1.1%; and Poaceae, 1.1%) had a slightly higher AGB than 3 of the 11 taxa; the total AGB of these four taxa made up just 5.4% study-wide, with Salix nigra (2.3%) accounting for the largest proportion. Abbreviations: P = statistical probability (all > 0.05); R = ranking according to the values of the previous column; FS = foundation species, PIO = pioneer species; OTH = other species. a Species identified as significant by DistLM marginal test. b Proportion of the community composition explained by the DistLM marginal test. c Abundance defined as the percentage of the total aboveground biomass harvested study-wide (see Table 1). d Presence defined as percentage of the 965 plots harvested in which the species was present. e Ranking based on the sum of the rank for abundance and presence. f Dominance defined as the percentage of the 965 plots harvested in which the species was dominant. g Ranking based on the sum of the rank for abundance, presence, and dominance. h Two species had equal values; the highest ranking was assigned to species with the highest TAGB.
Table 3. Correlation among sites in total aboveground biomass during their common years of sampling after primary succession years.
PeriodSitesSampling PeriodYearsCorrelation Coefficientp a
All bWSc vs. BSs1984–1998150.6900.004
WSc vs. BSn1984–1998150.4380.102
WSc vs. WSn1994–199850.7430.150
BSs vs. BSn1984–1998150.7110.003
BSs vs. BSn1984–2004200.7280.003
BSs vs. WSn1994–200450.1740.552
BSn vs. WSn1994–200450.5800.079
PPSYWSc vs. BSs1988–1998110.7090.015
WSc vs. BSn1988–1998110.7250.012
BSs vs. BSn1988–1998110.6990.017
Notes: Abbreviations: WSc = White’s Splay created; BSs = Brant Splay south; BSn = Brant Splay north; WSn = White’s Splay new; and PPSY = post primary succession year. a Significant values (p < 0.05) are indicated in bold. b Primary succession years are included.
Table 4. Quantile regression analysis results for the aboveground biomass (AGB) response to environmental change.
ParameterTotal
AGB
Sc. deltarum
AGB
Sag. latifolia
AGB
Average annual discharge (linear)0.10300.08820.0031
Average annual discharge (quadratic)0.03220.03350.0194
Spring discharge (linear)<0.0001<0.00010.0171
Spring discharge (quadratic)<0.00010.03350.0793
Nitrate loading (linear)0.00200.21600.8620
Nitrate loading (quadratic)0.0006<0.00010.4198
Growing season length<0.00010.02080.0994
Notes: Values are presented as the p-value of the likelihood ratio of the fit. Significant values (p < 0.05) are indicated in bold. Only parameters with at least one significant effect are included.
Disclaimer/Publisher’s Note: The statements, opinions and data contained in all publications are solely those of the individual author(s) and contributor(s) and not of MDPI and/or the editor(s). MDPI and/or the editor(s) disclaim responsibility for any injury to people or property resulting from any ideas, methods, instructions or products referred to in the content.

