
Integration of Geological, Geochemical Modelling and Hydrodynamic Condition for Understanding the Geometry and Flow Pattern of the Aquifer System, Southern Nyírség–Hajdúság, Hungary

 ,
,  , ,
, ,
Abstract
1. Introduction
2. Materials and Methods
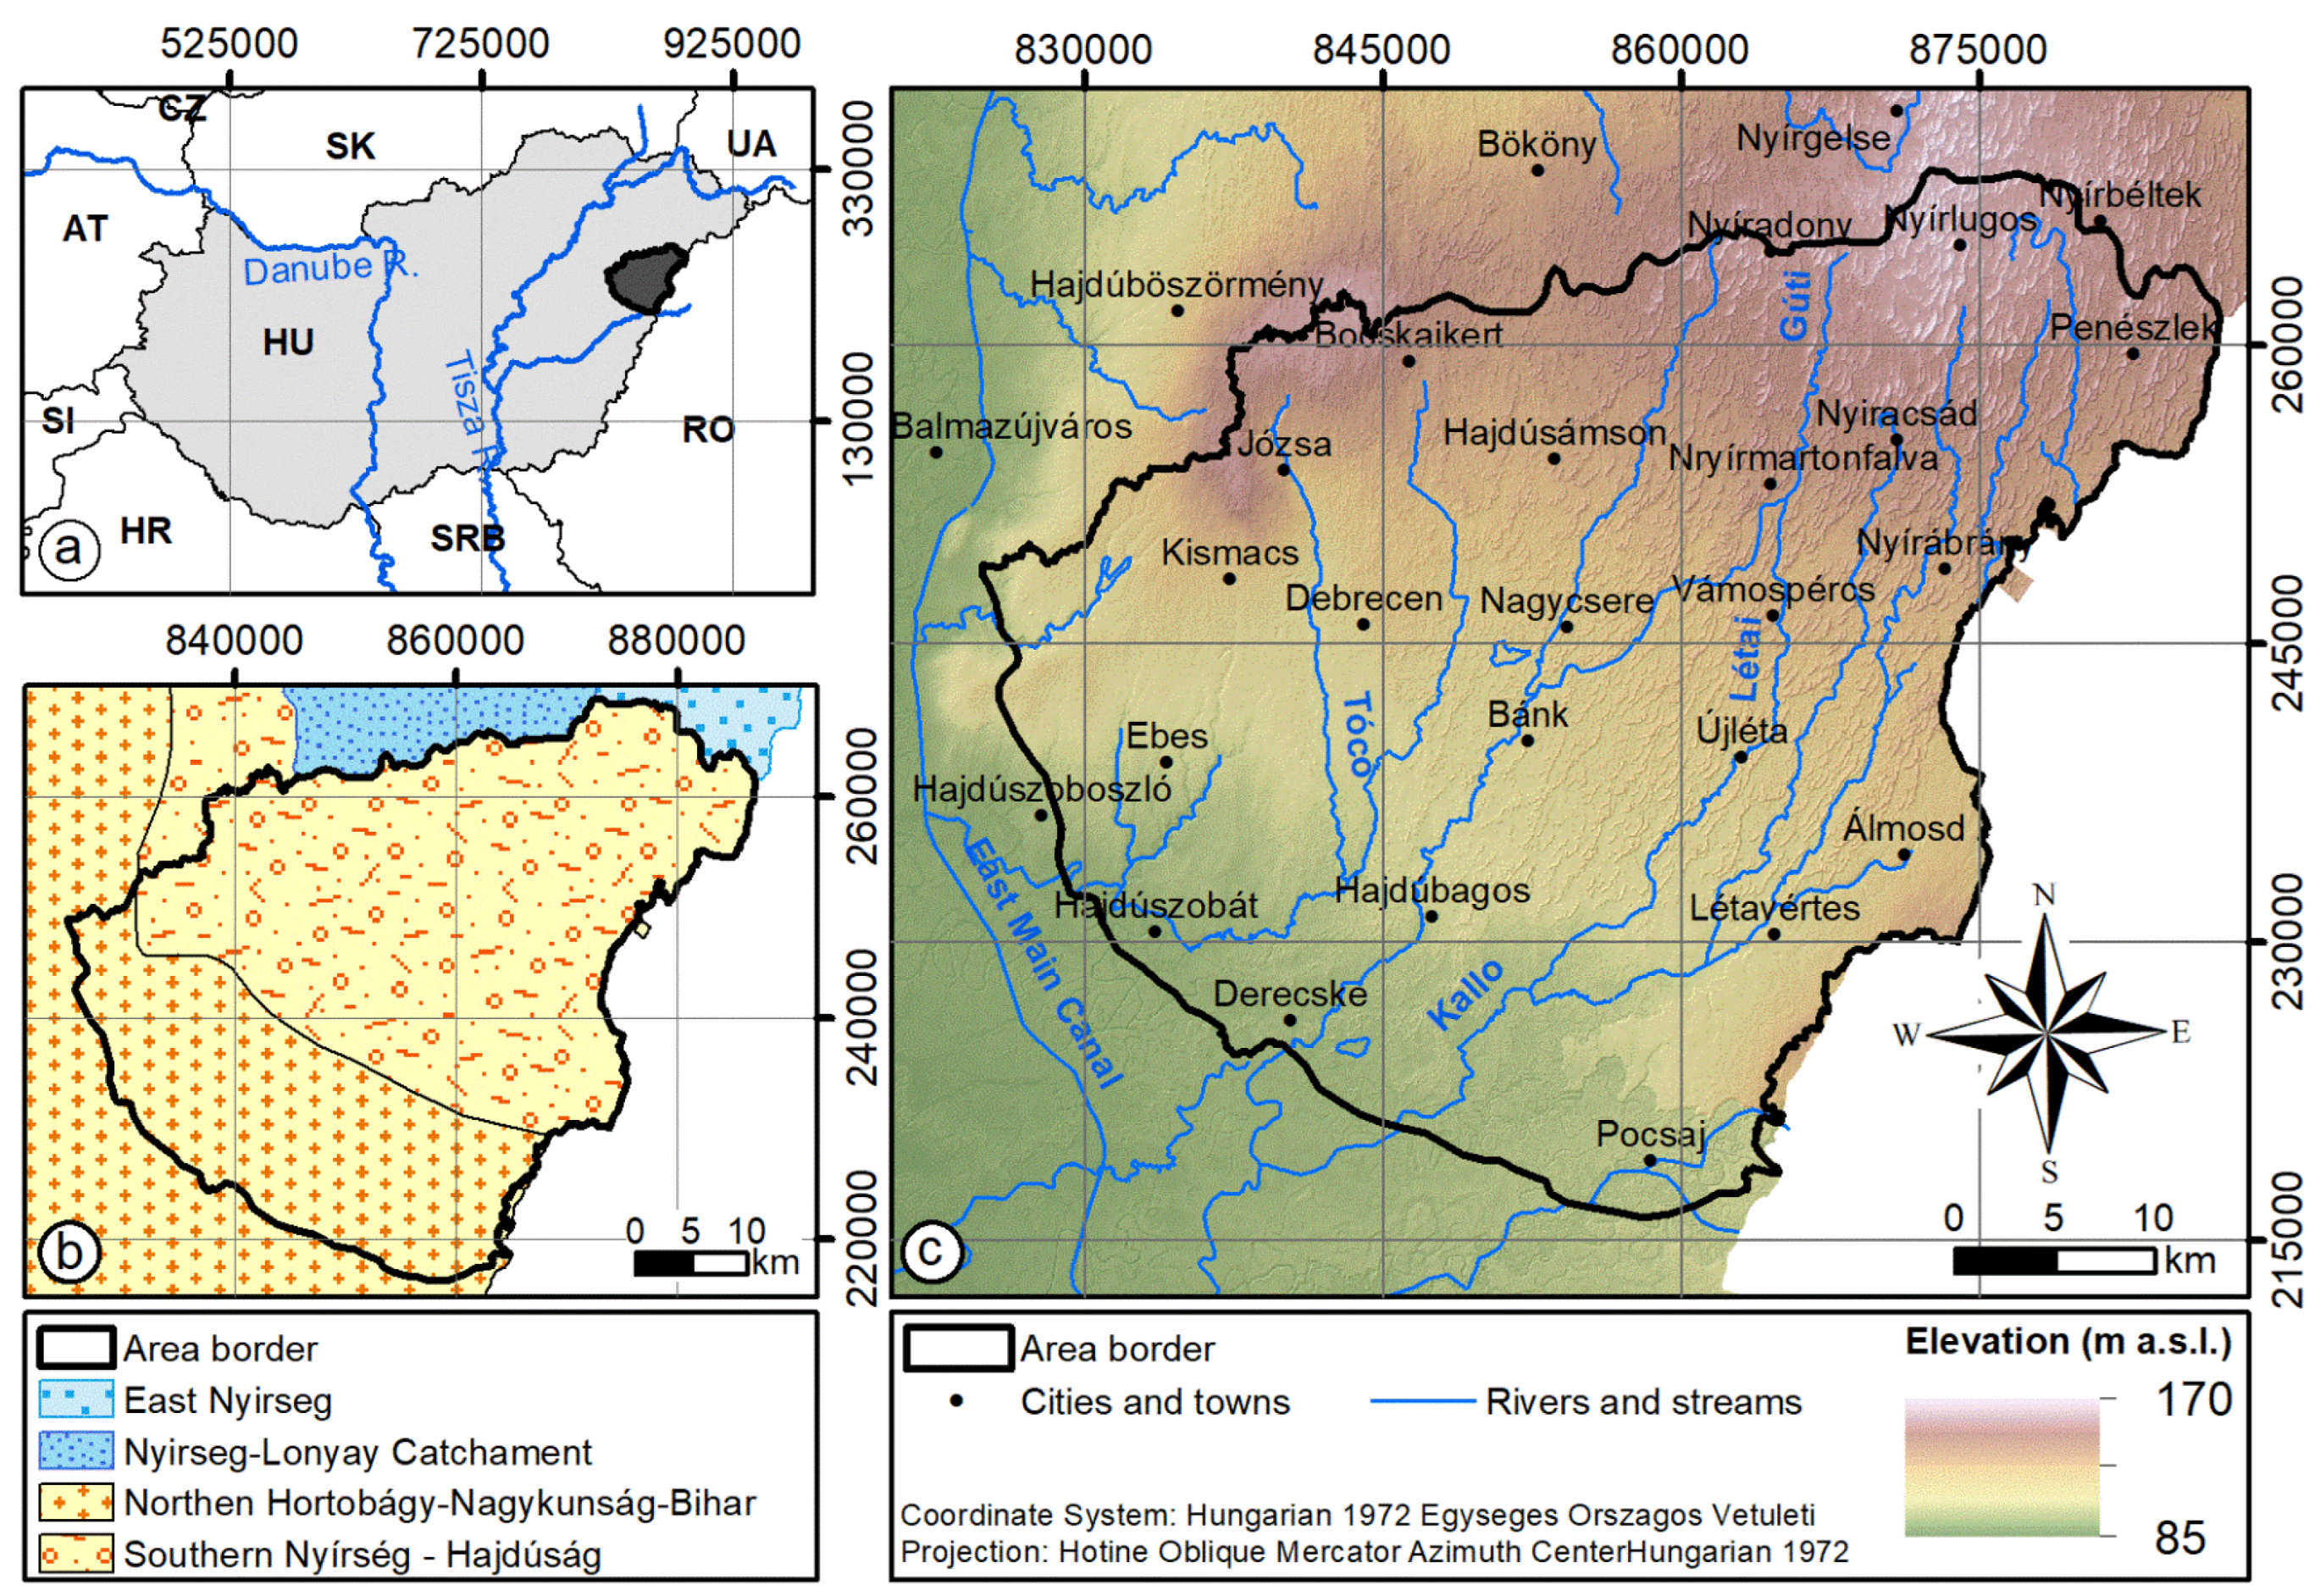
2.1. Site Description

2.2. Database
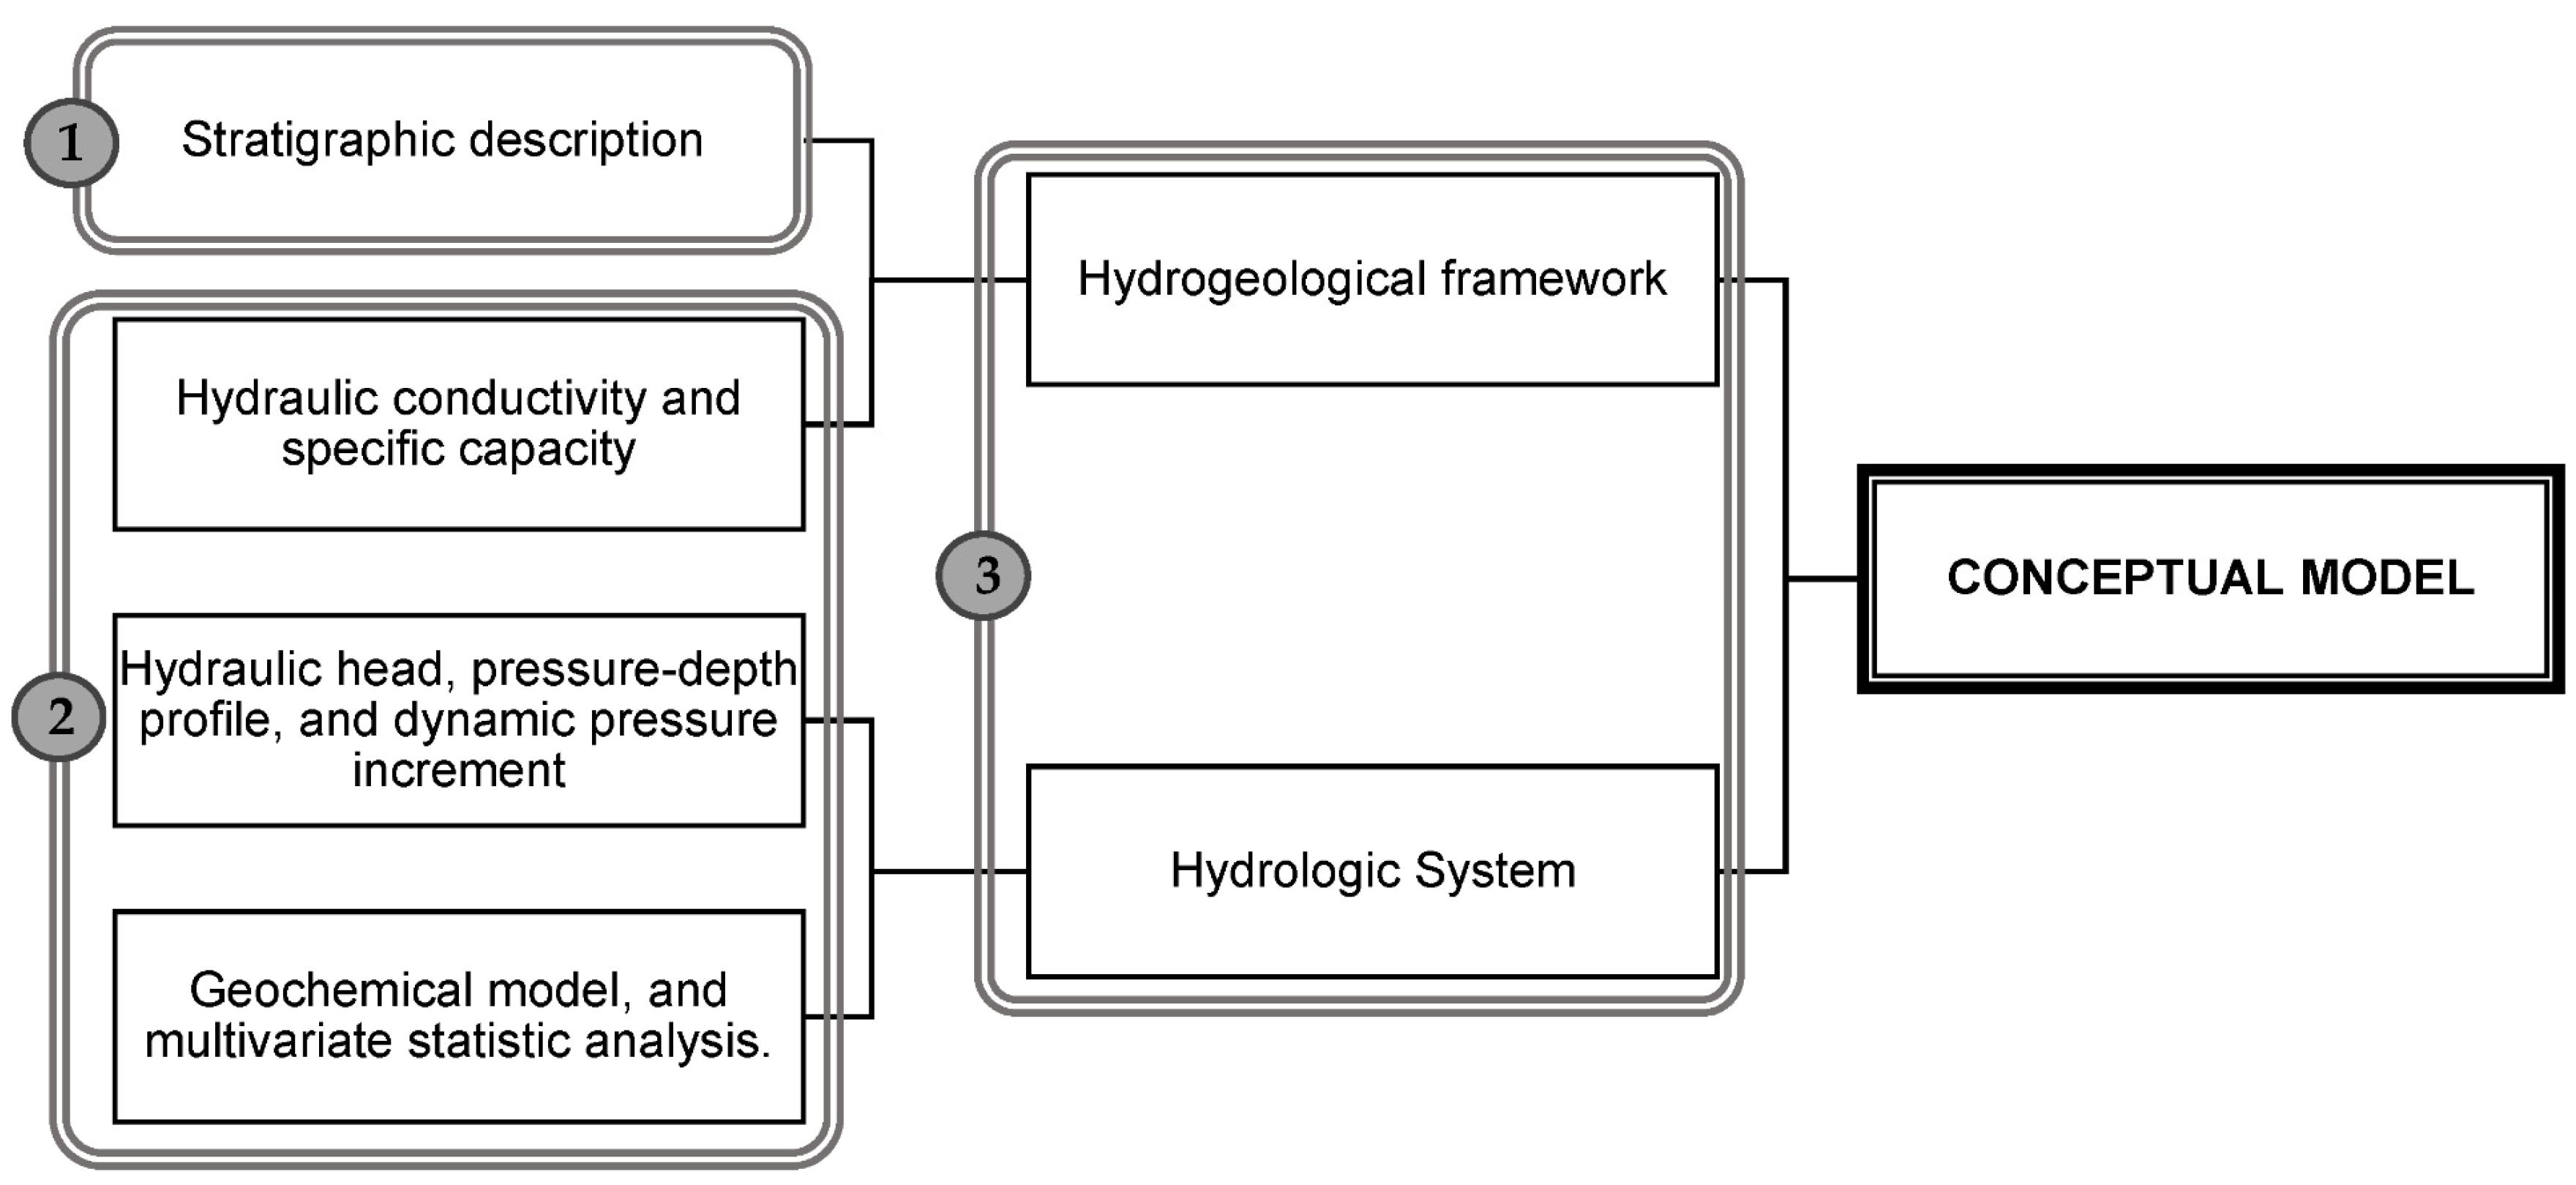
2.3. Methods
2.3.1. Systematic Well-Log Correlation
2.3.2. Hydraulic Conductivity and Specific Capacity
2.3.3. Hydraulic Head and Pressure Conditions
2.3.4. Geochemical Modelling
2.3.5. Multivariate Geostatistical Analysis
3. Results and Discussion
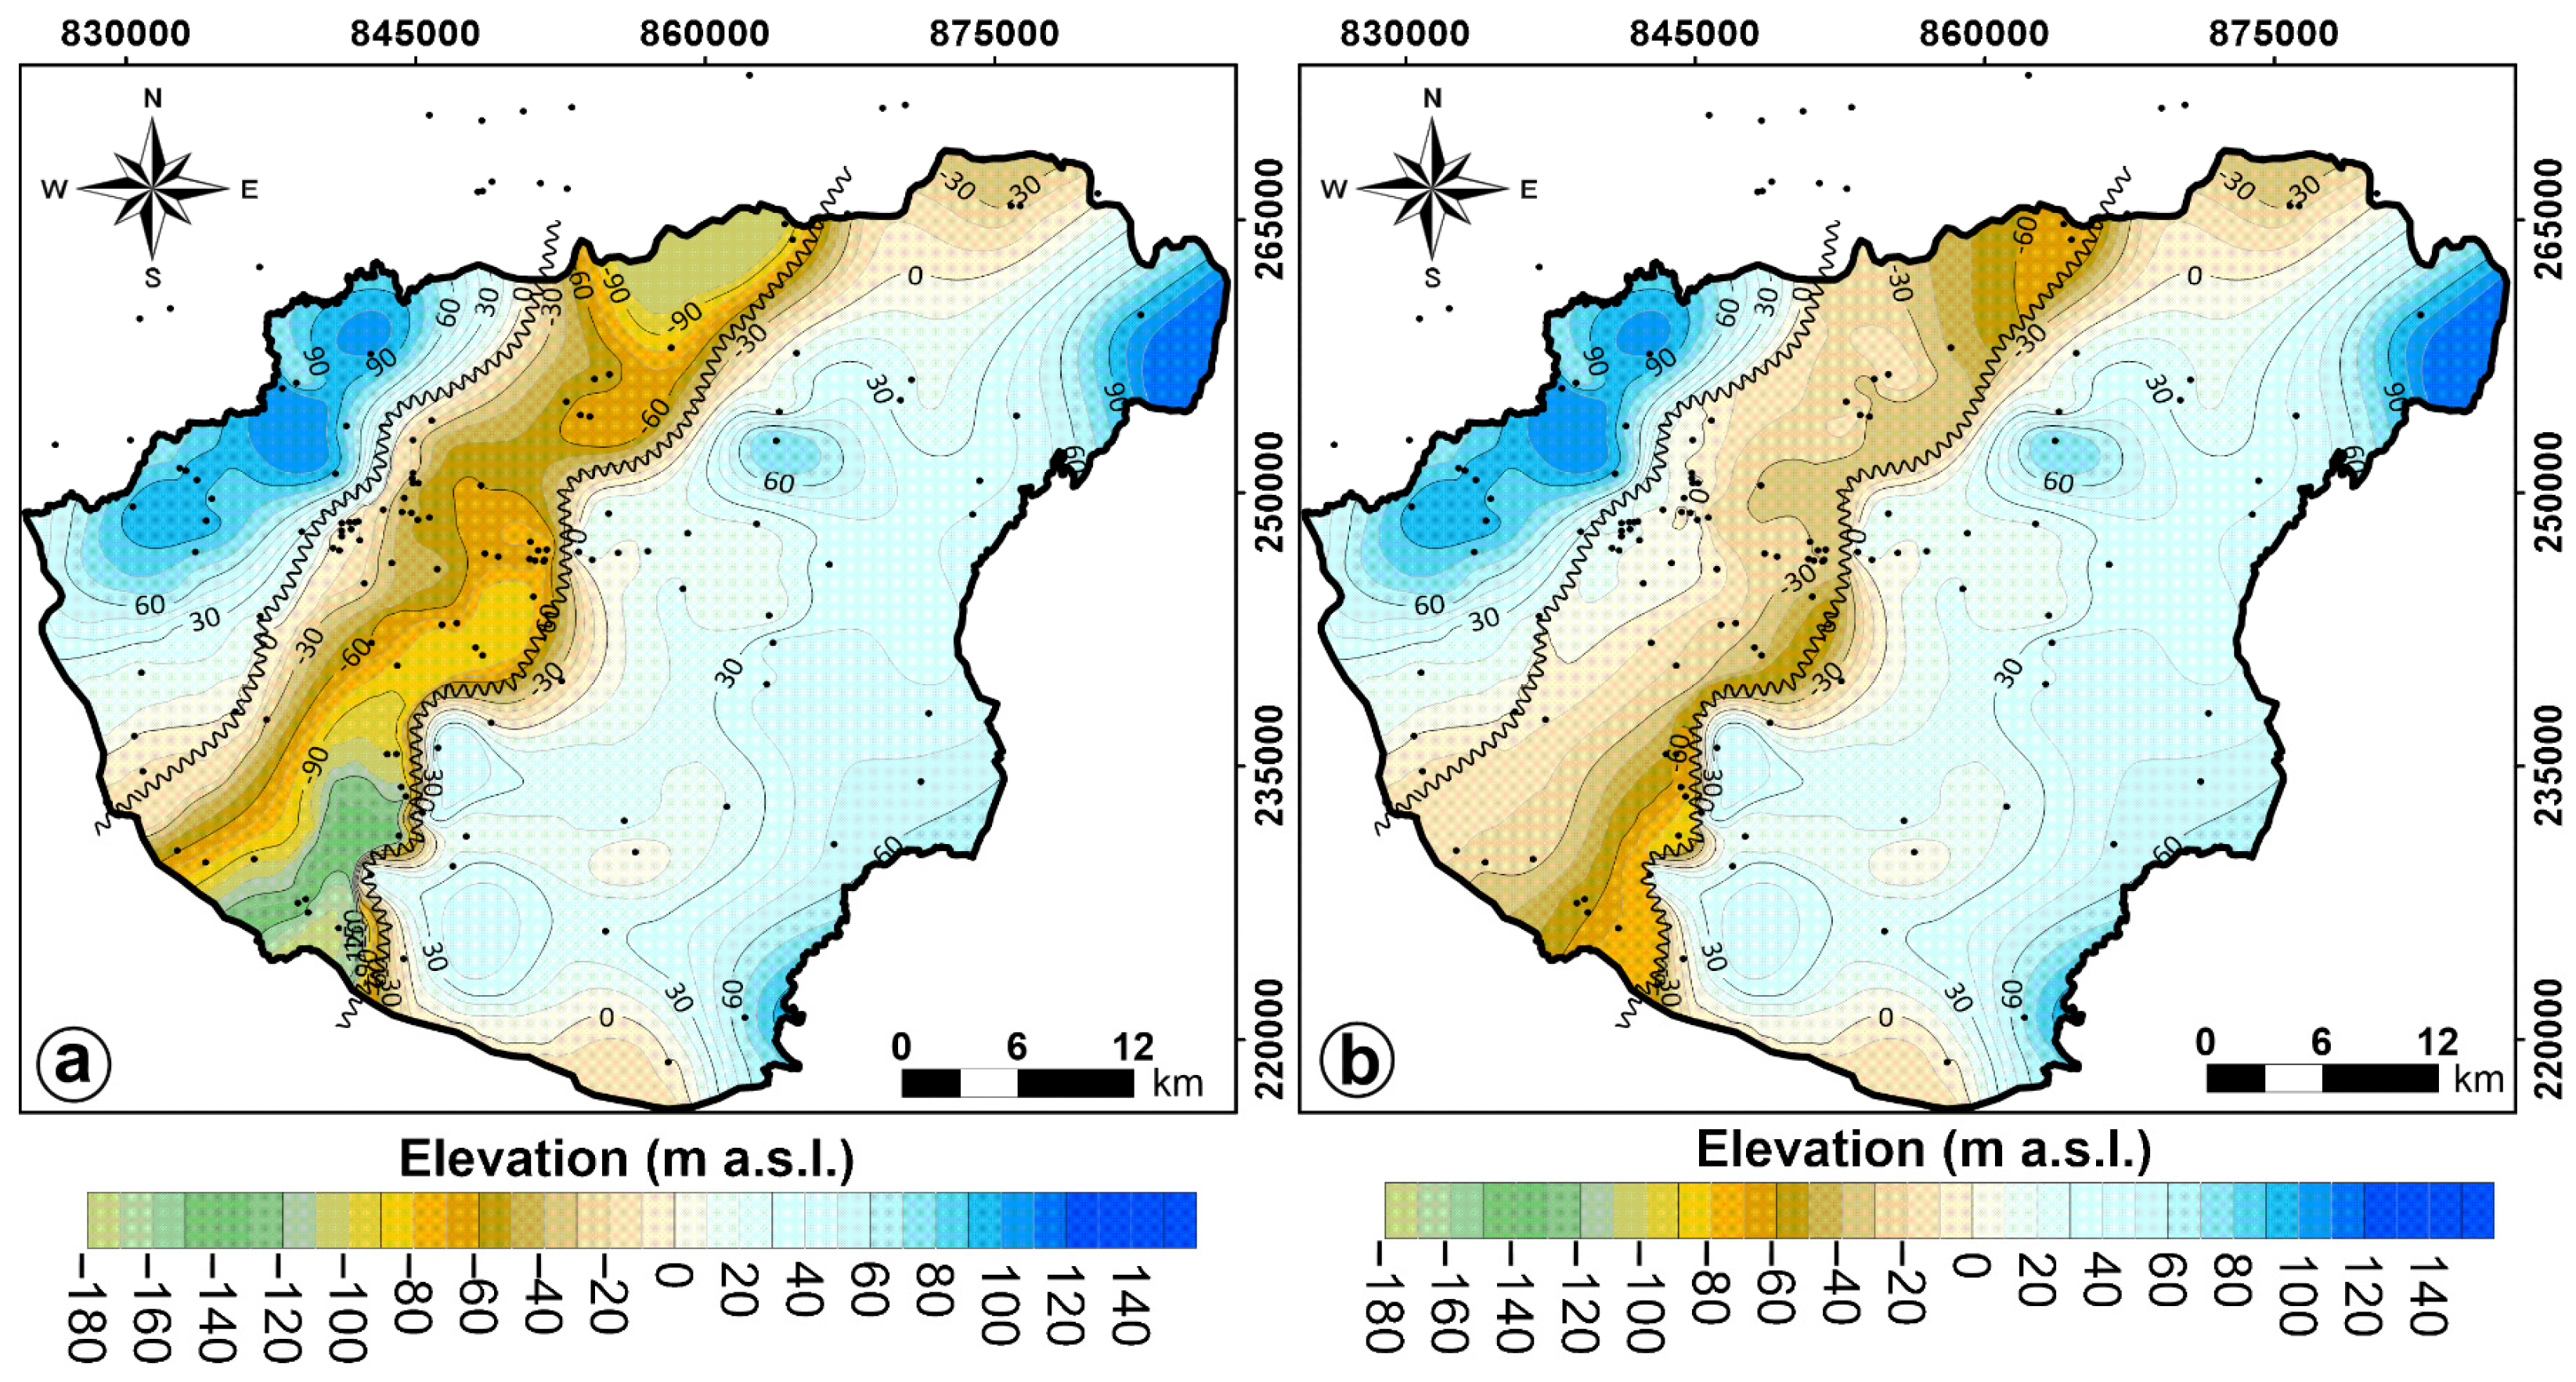
3.1. The Geometry of the Groundwater Body and Its Hydrostratigraphic Units
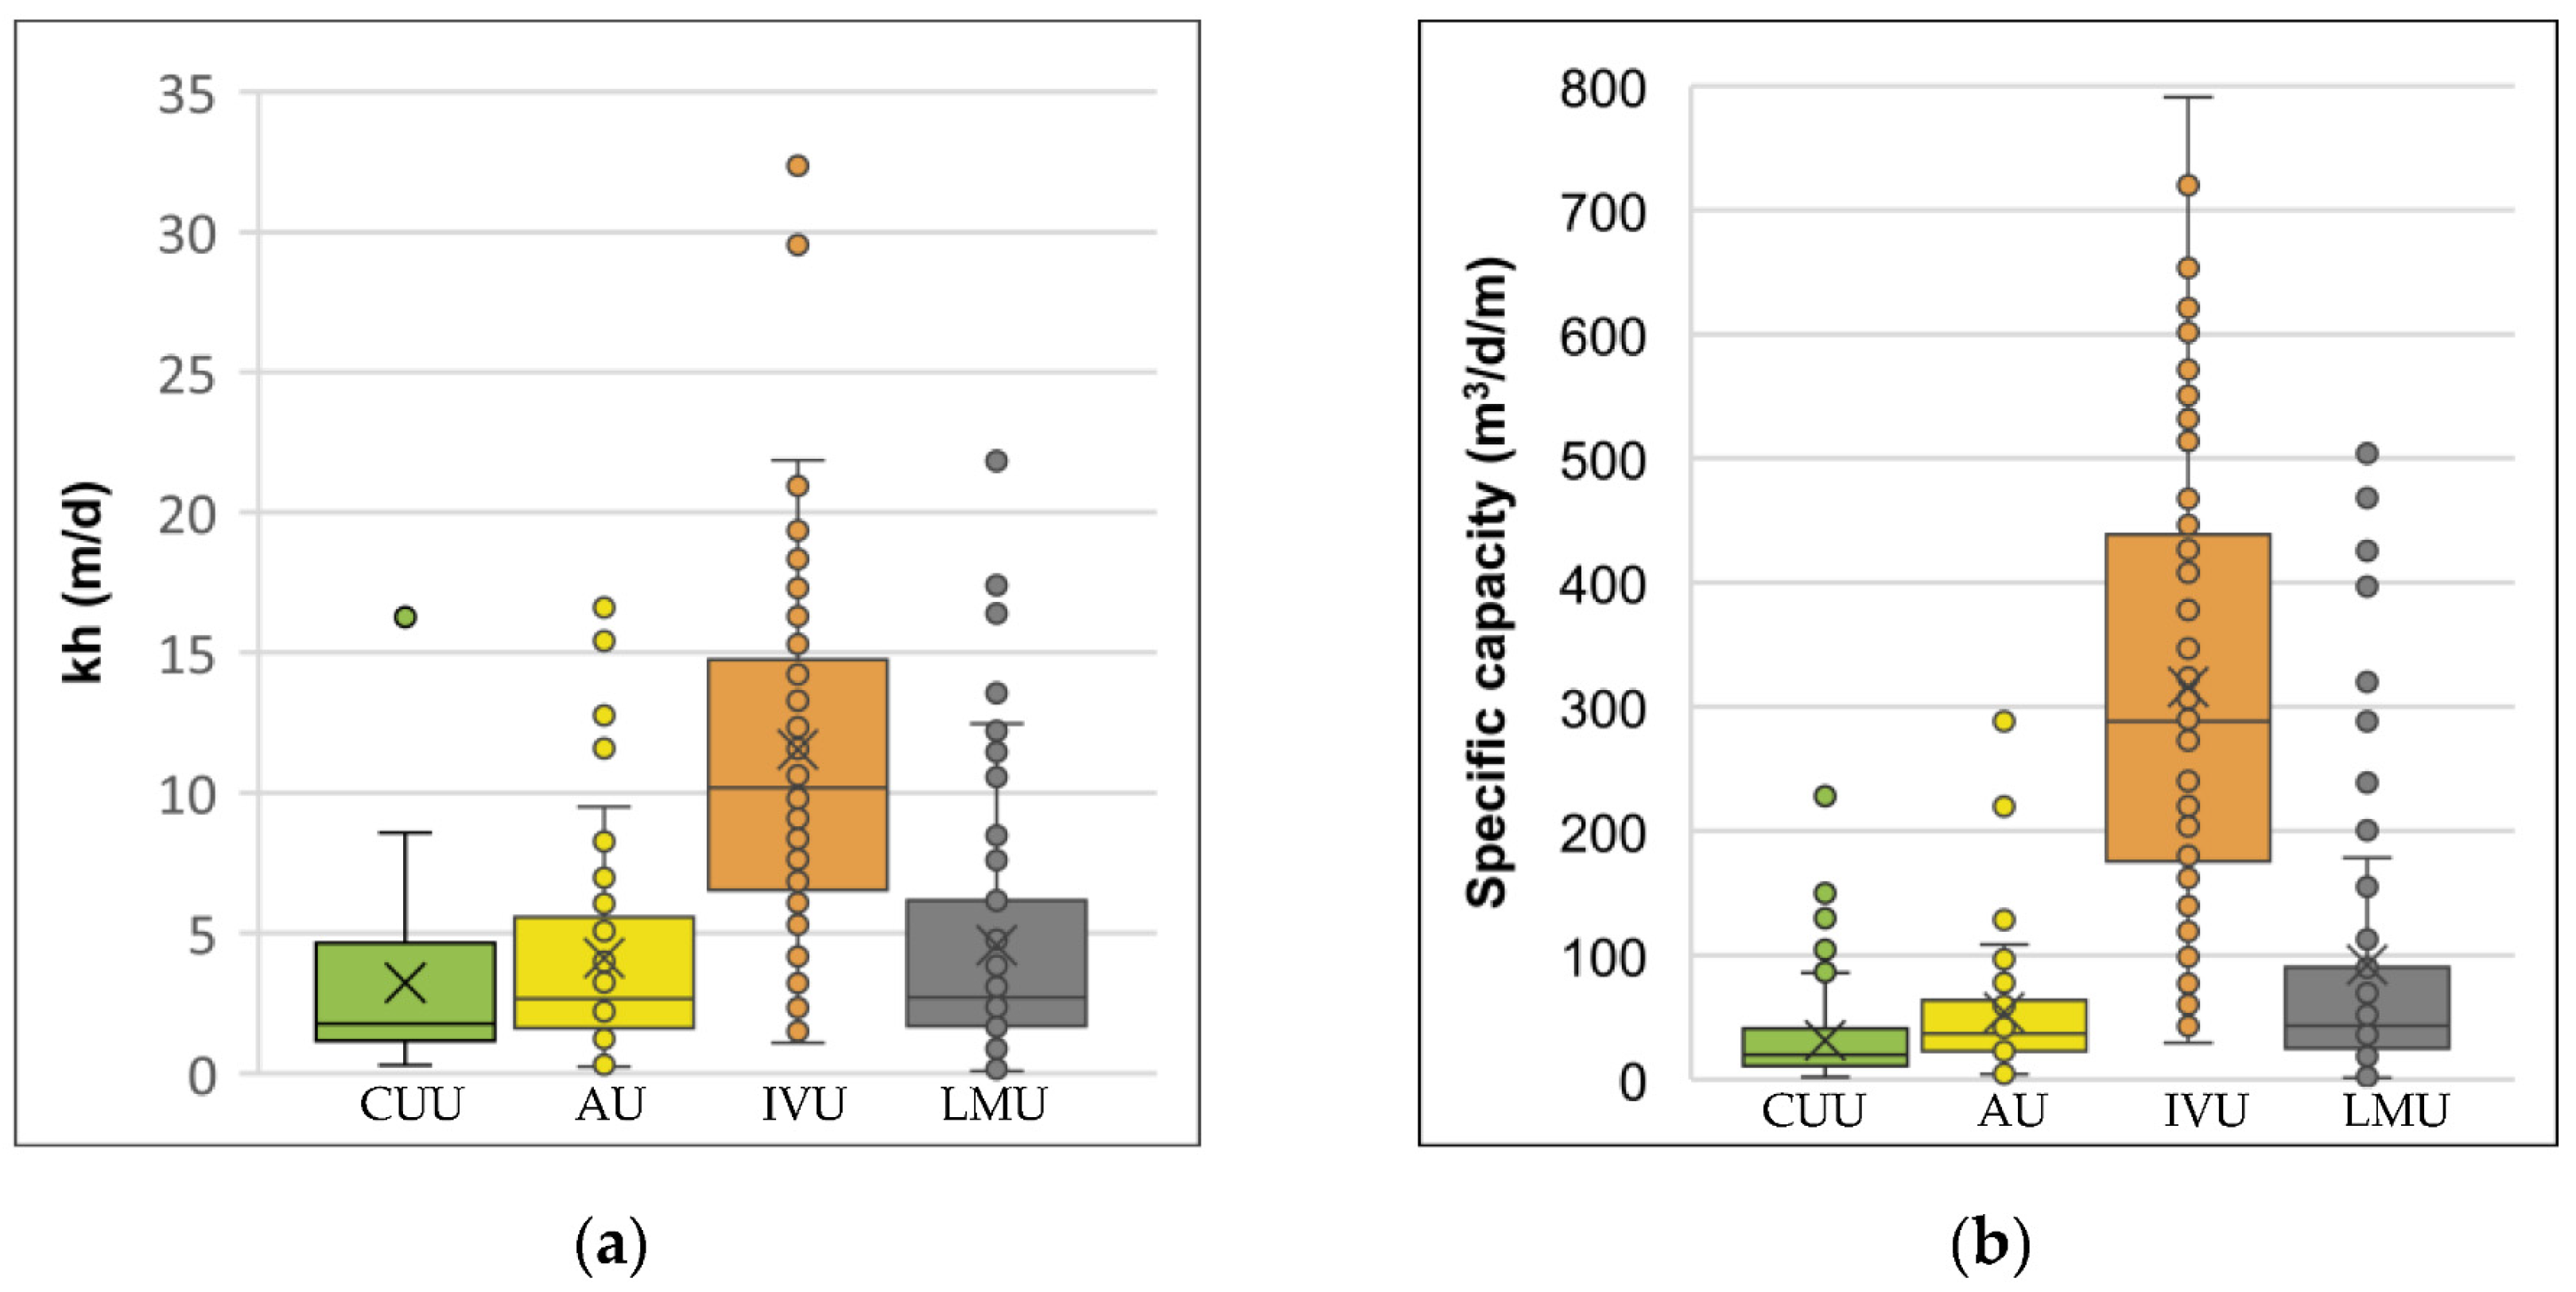
3.2. Hydraulic Parameters
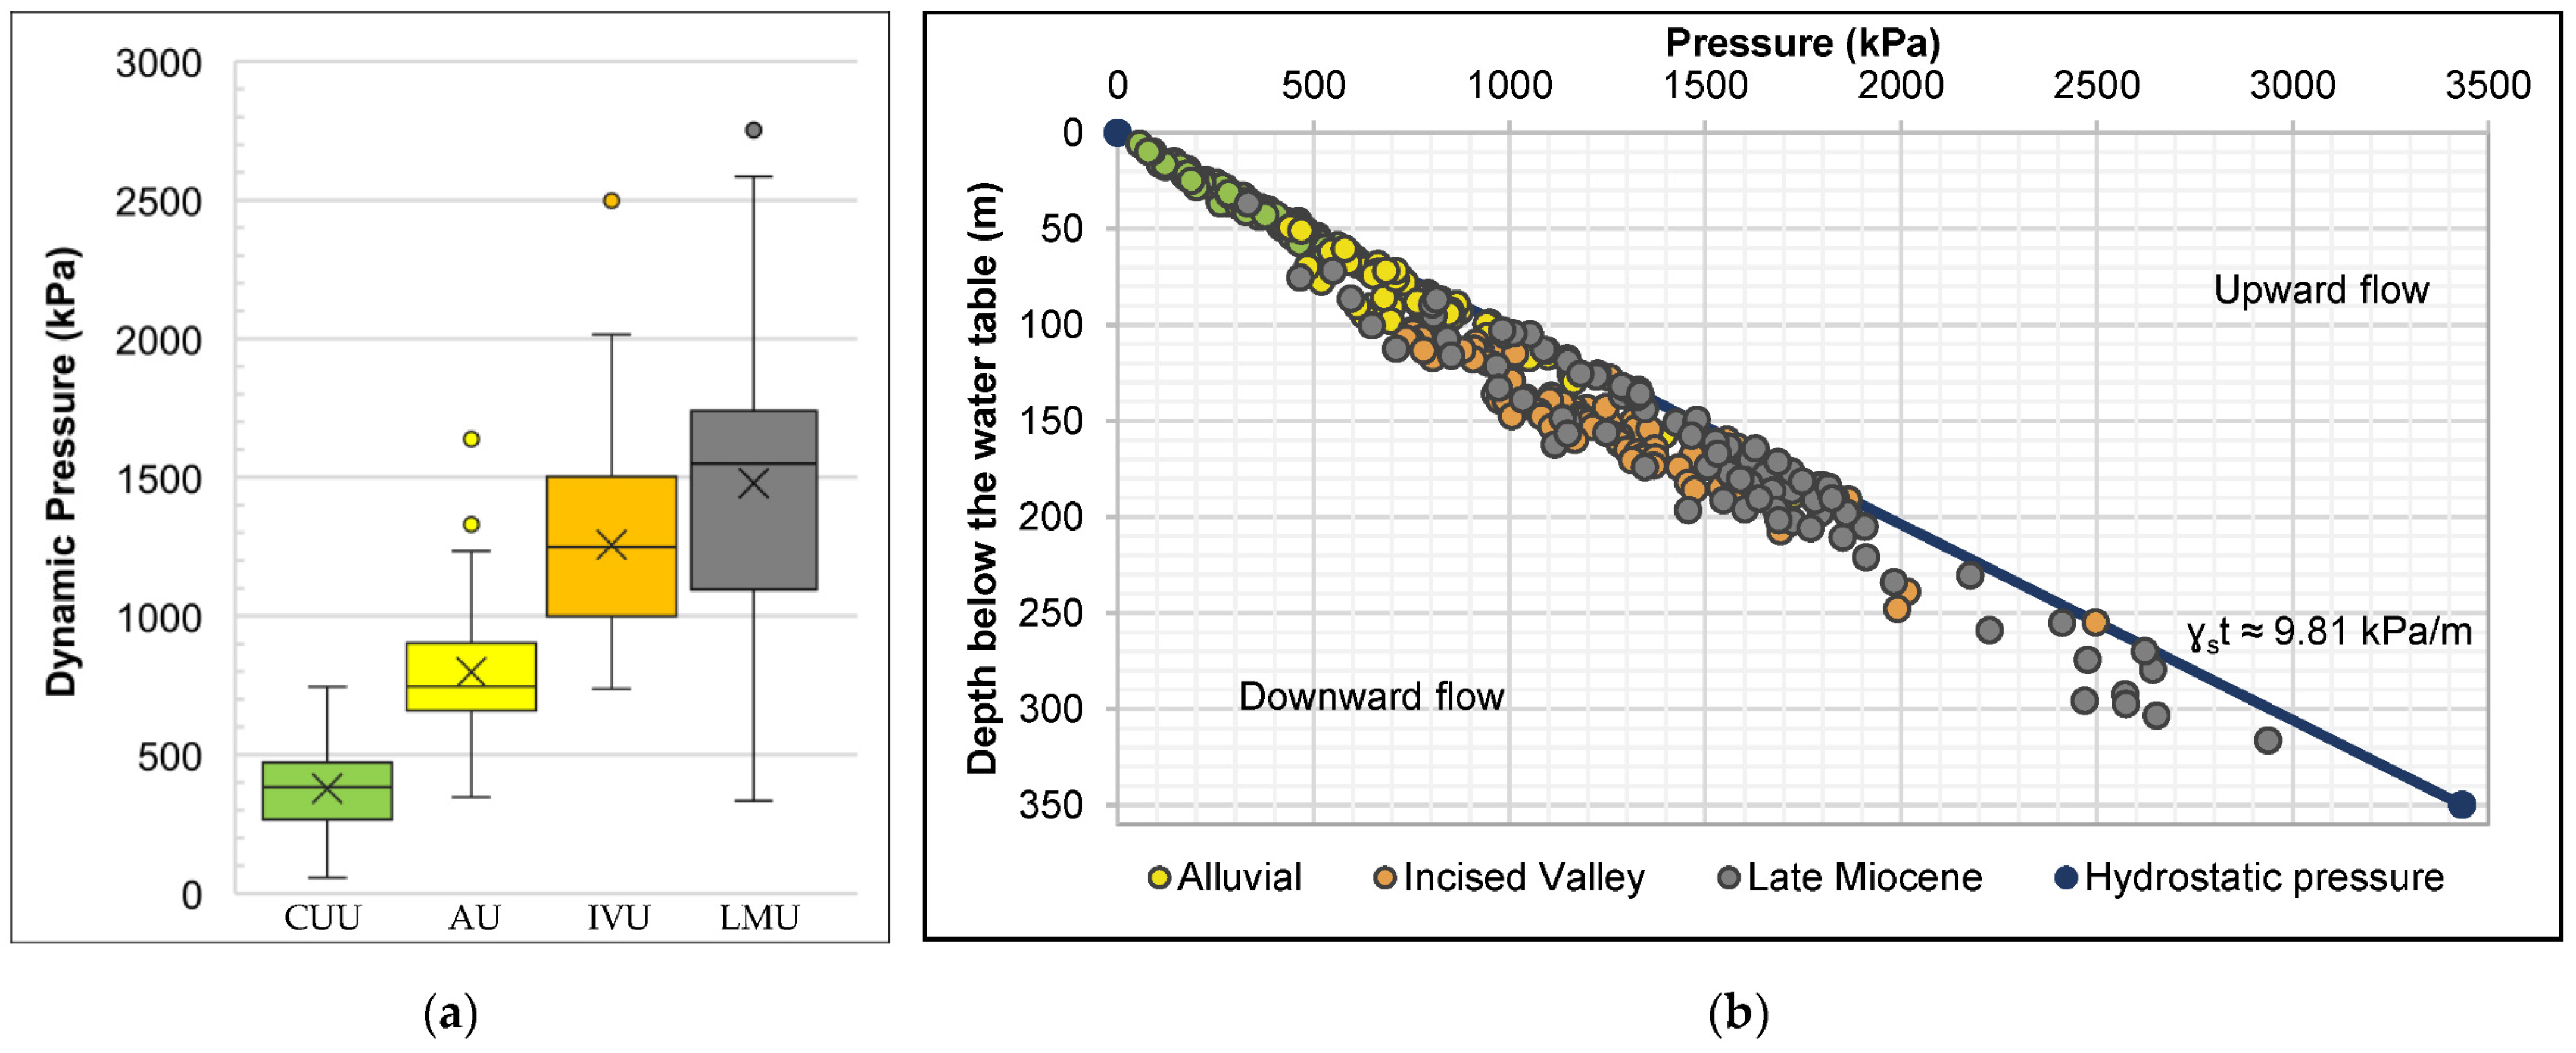
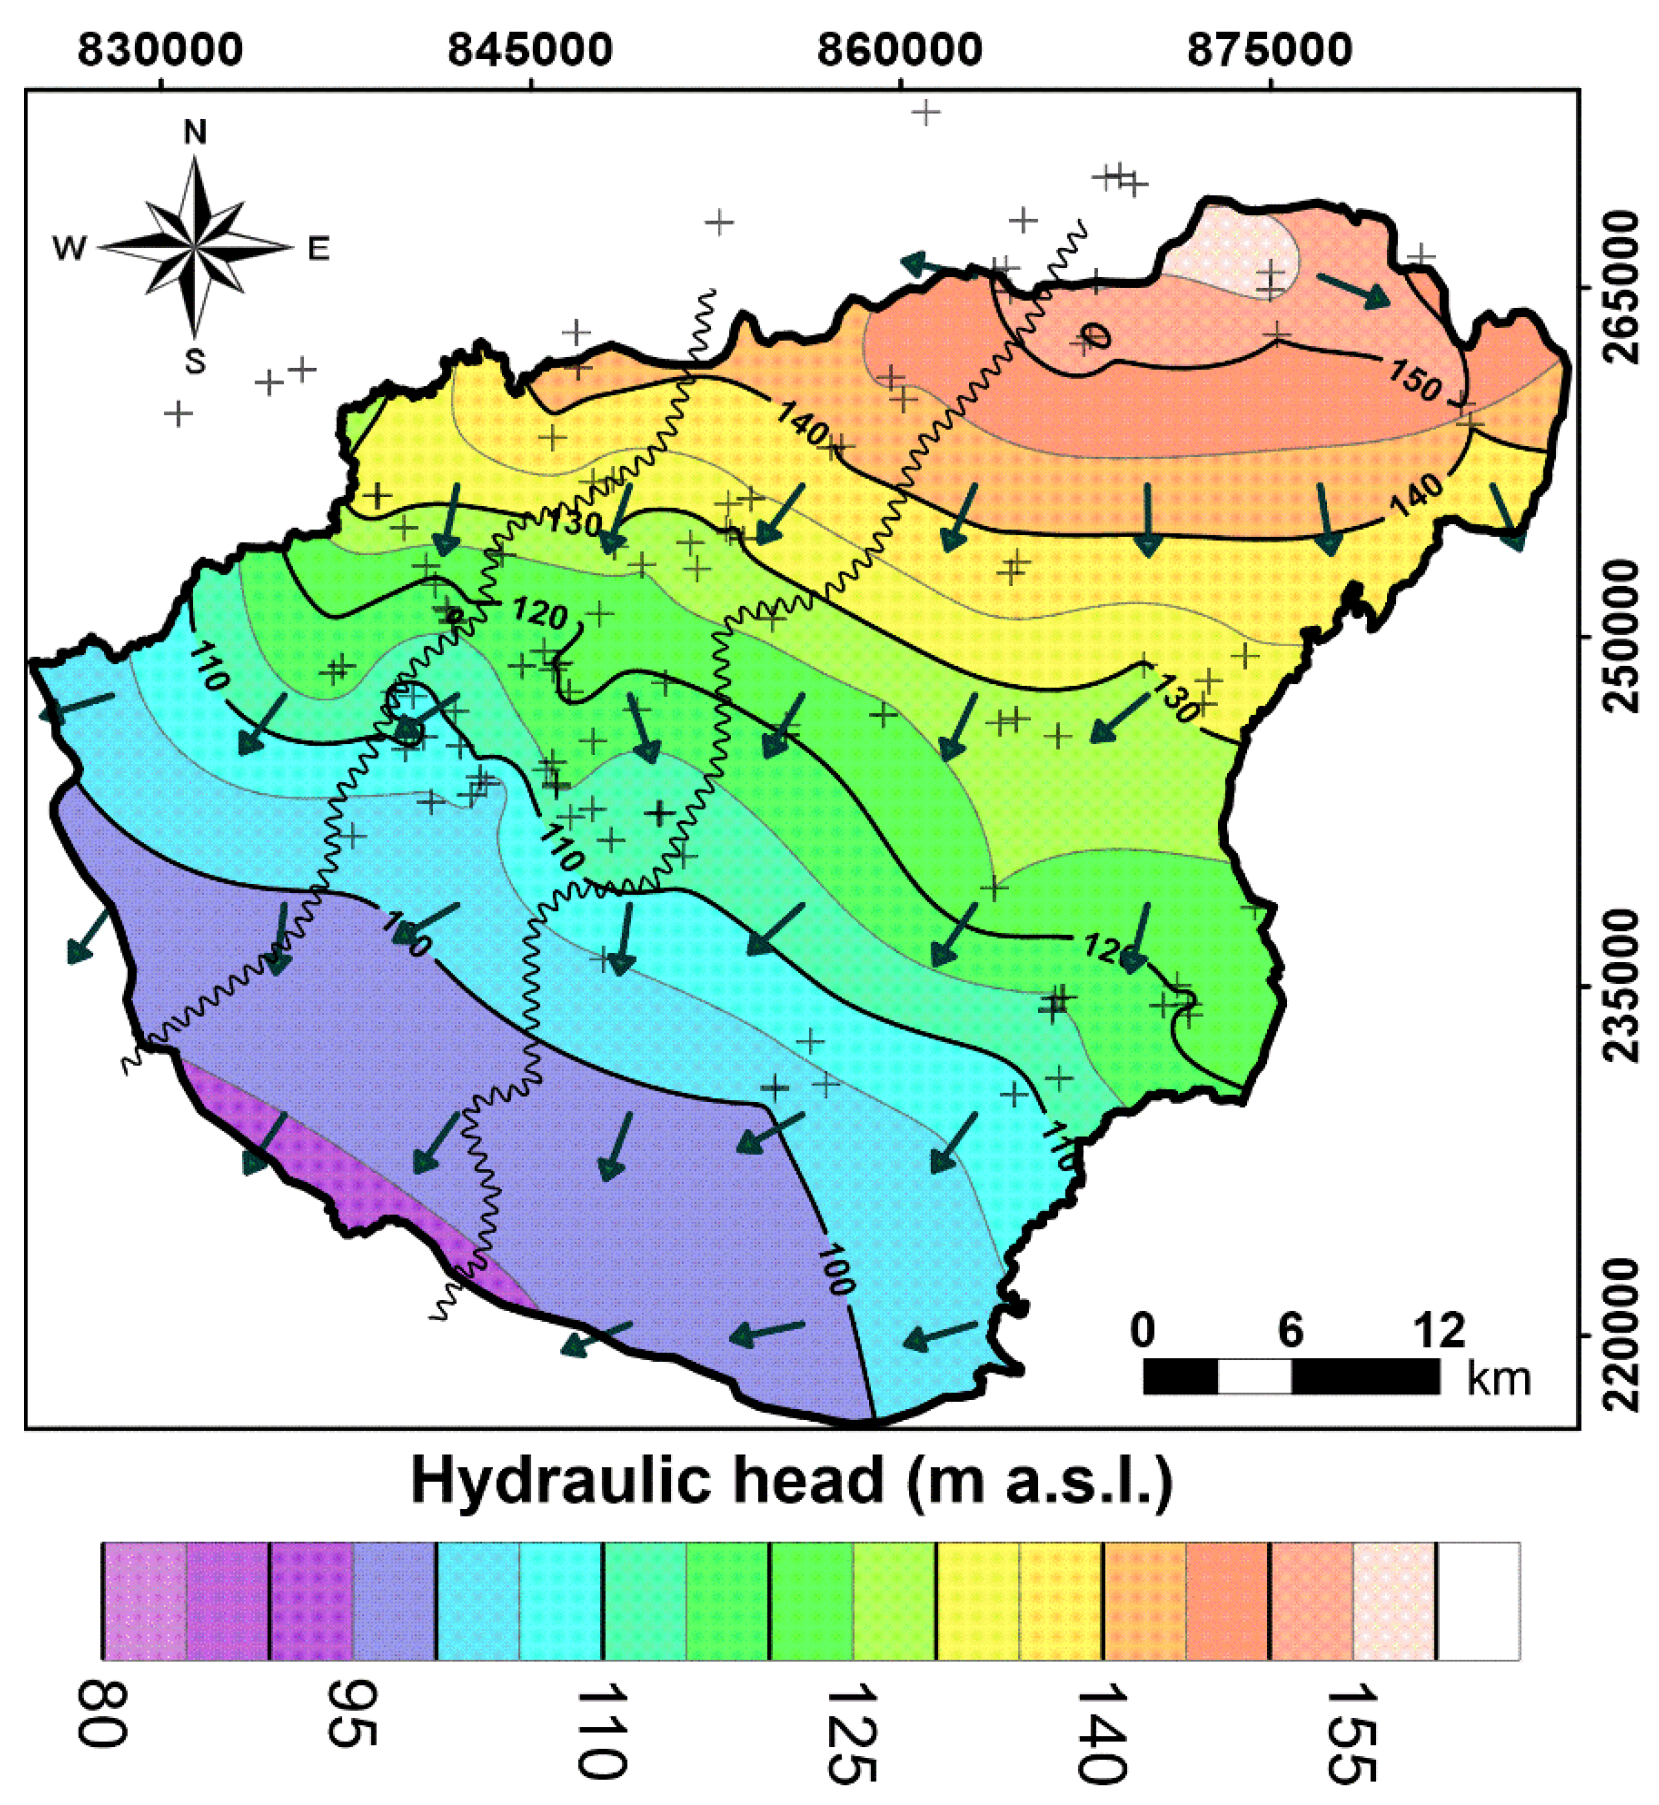
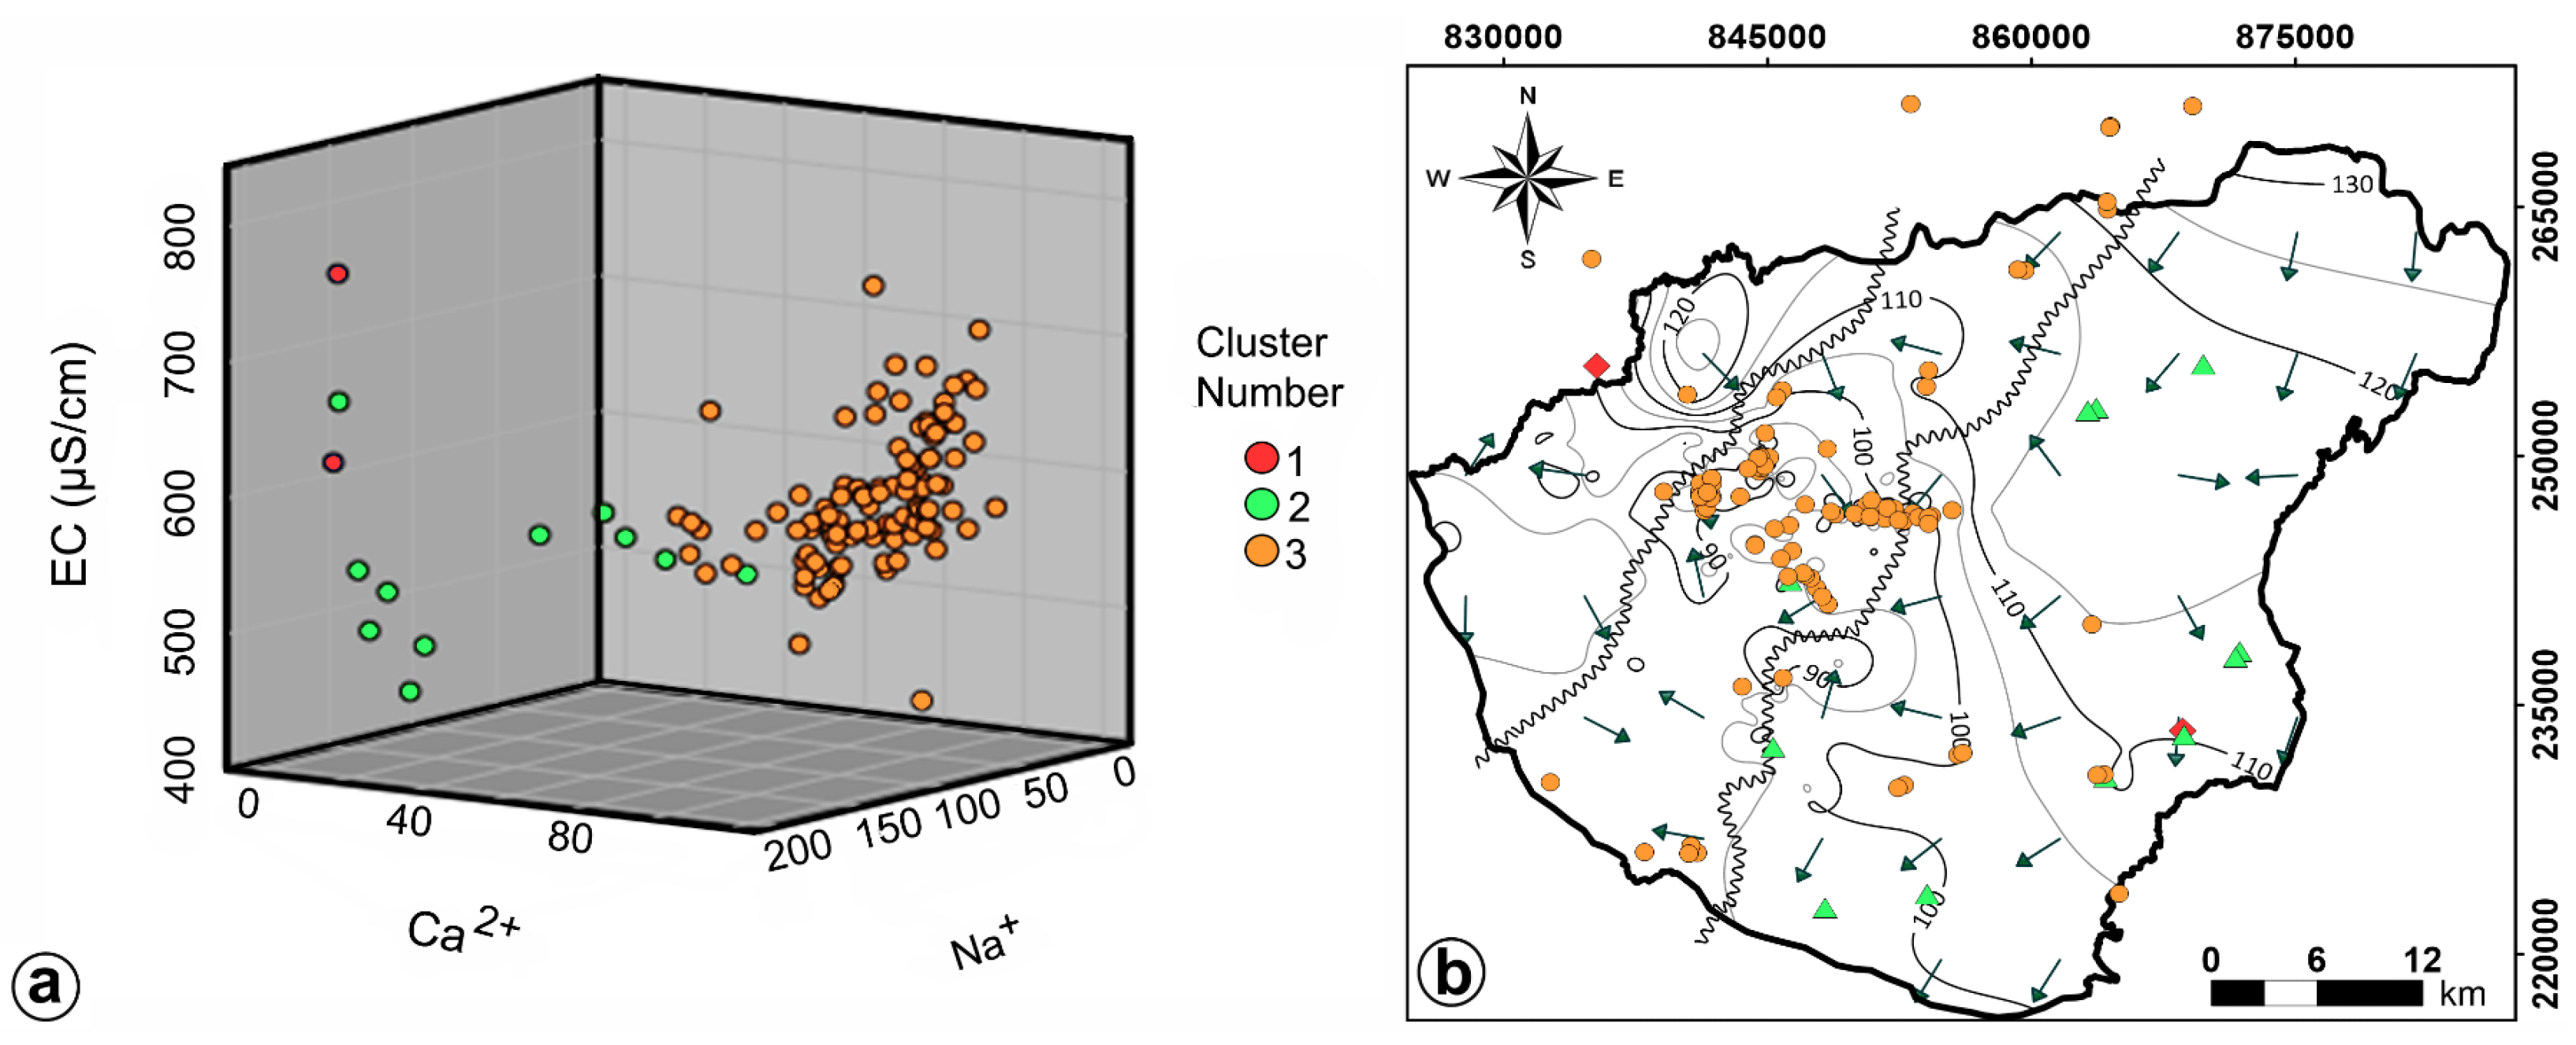
3.3. Hydrodynamic Conditions
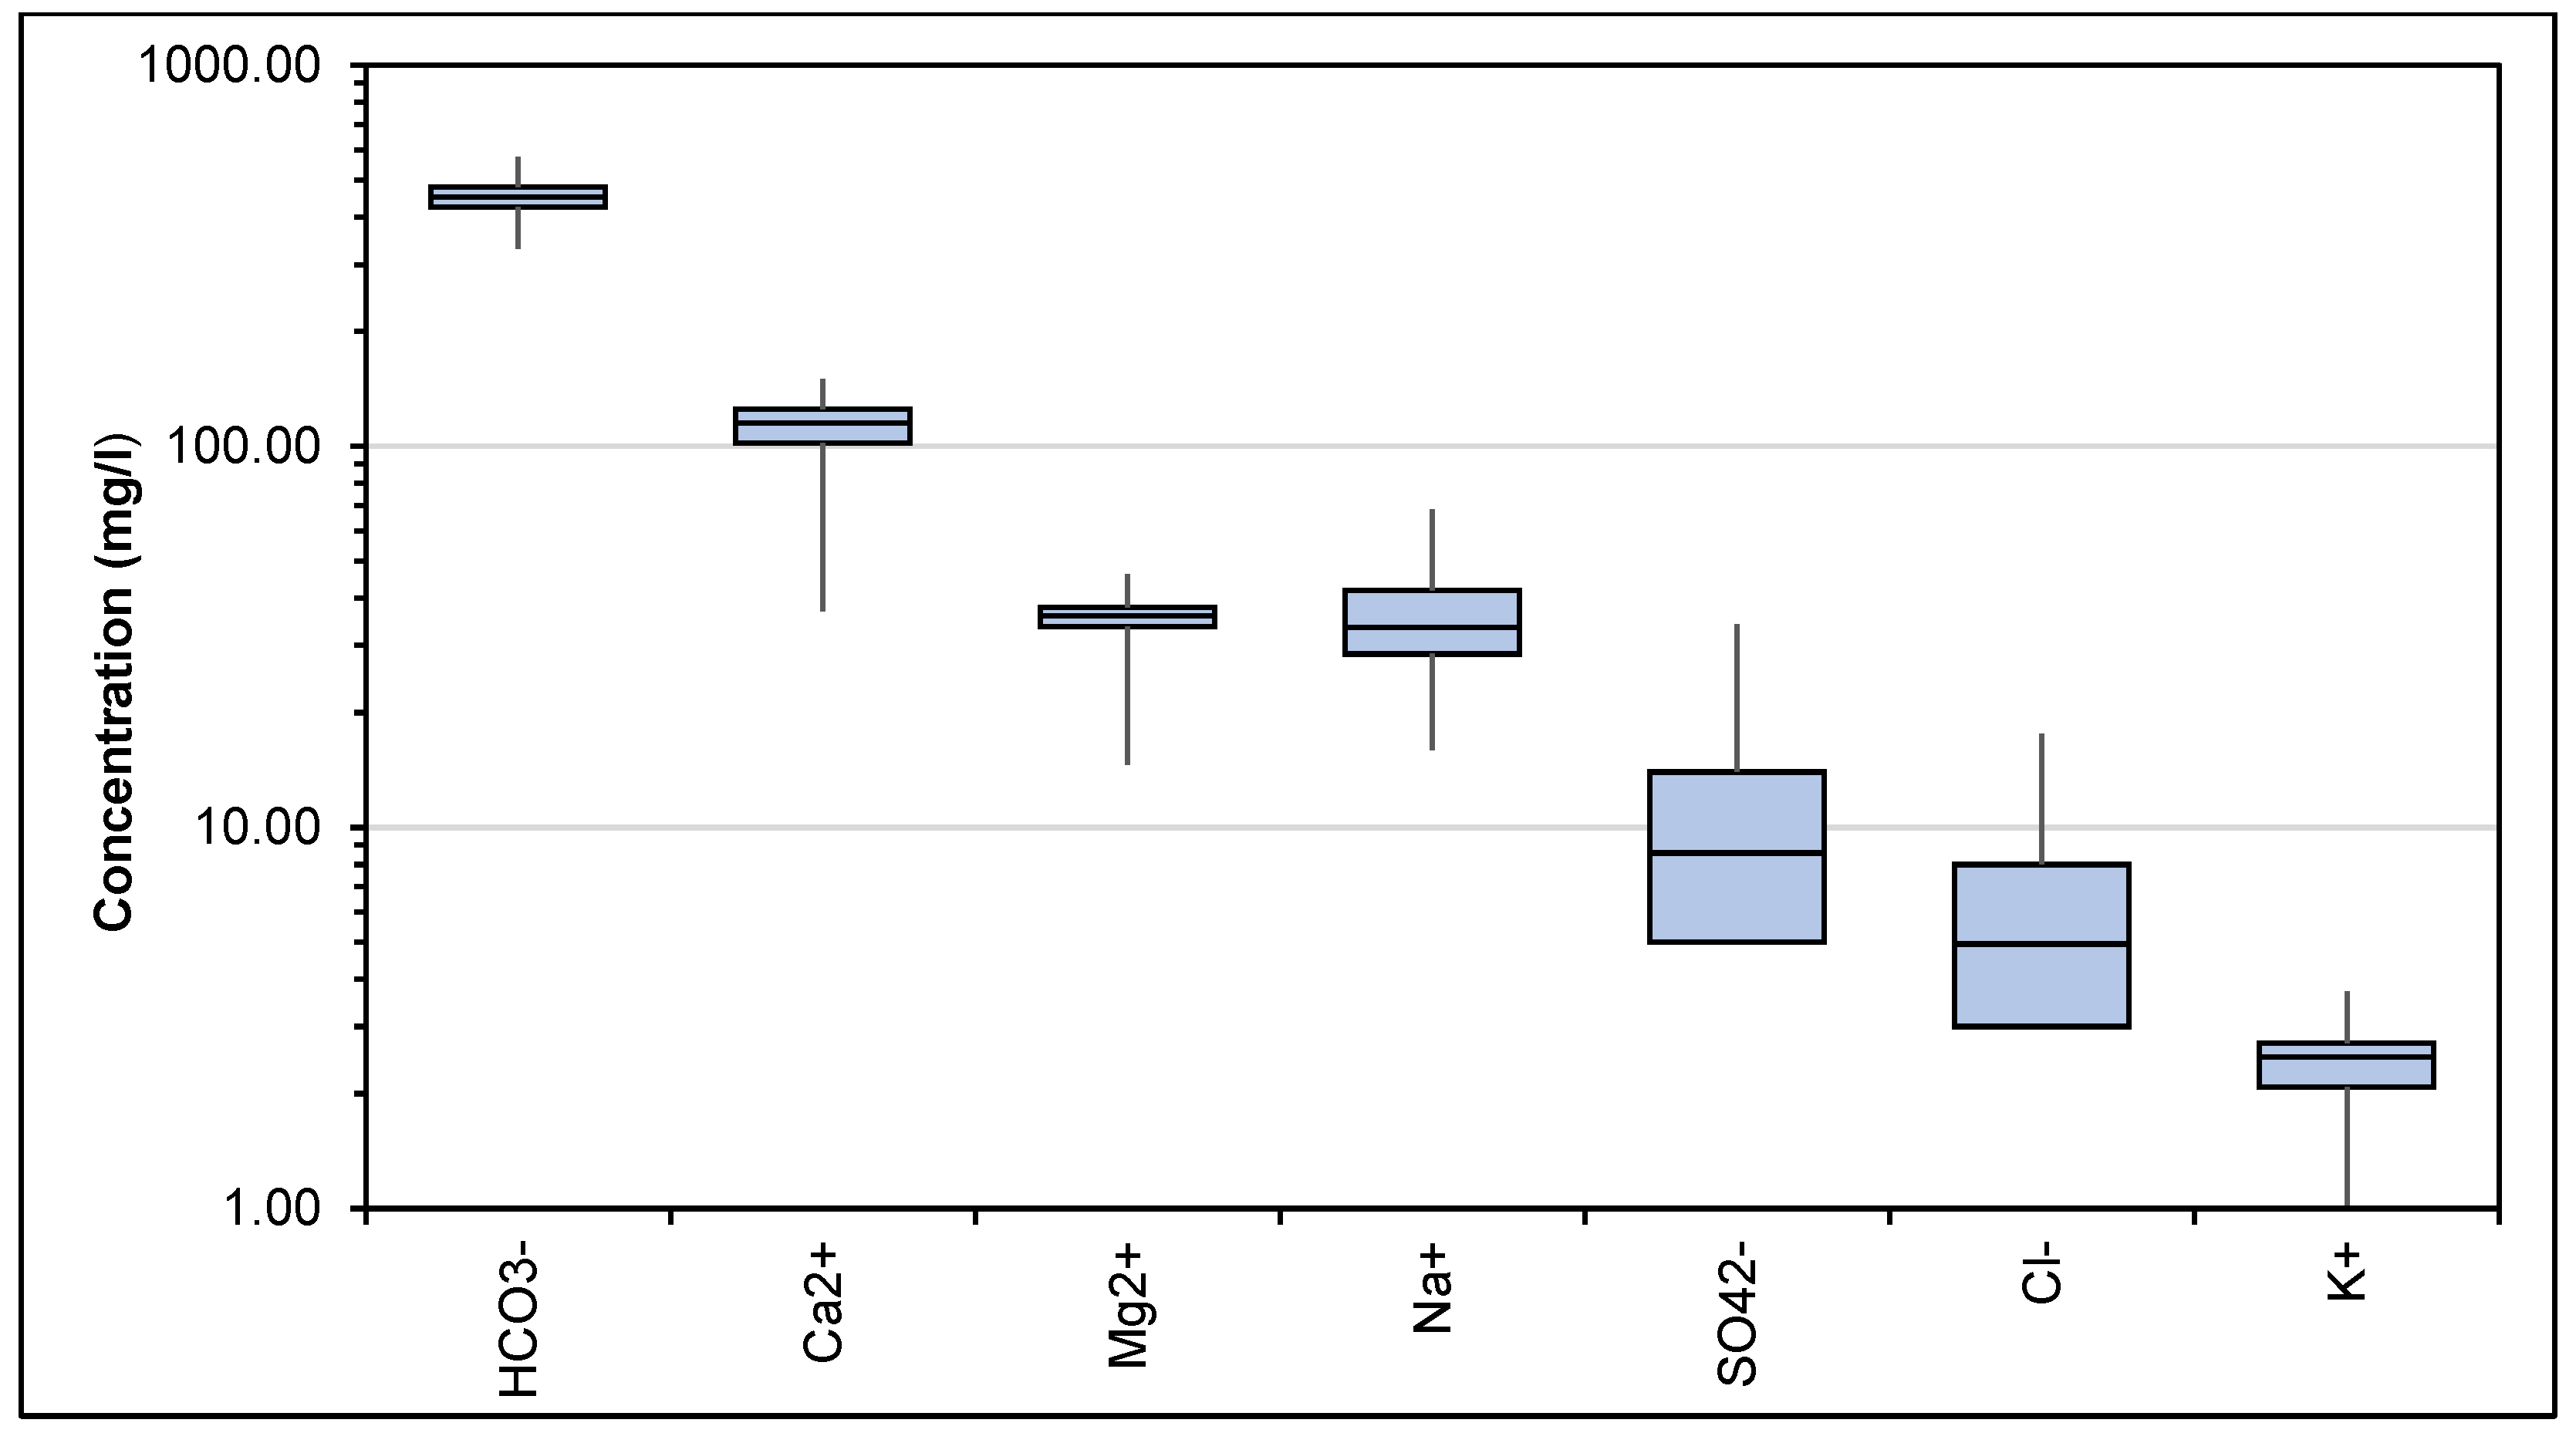
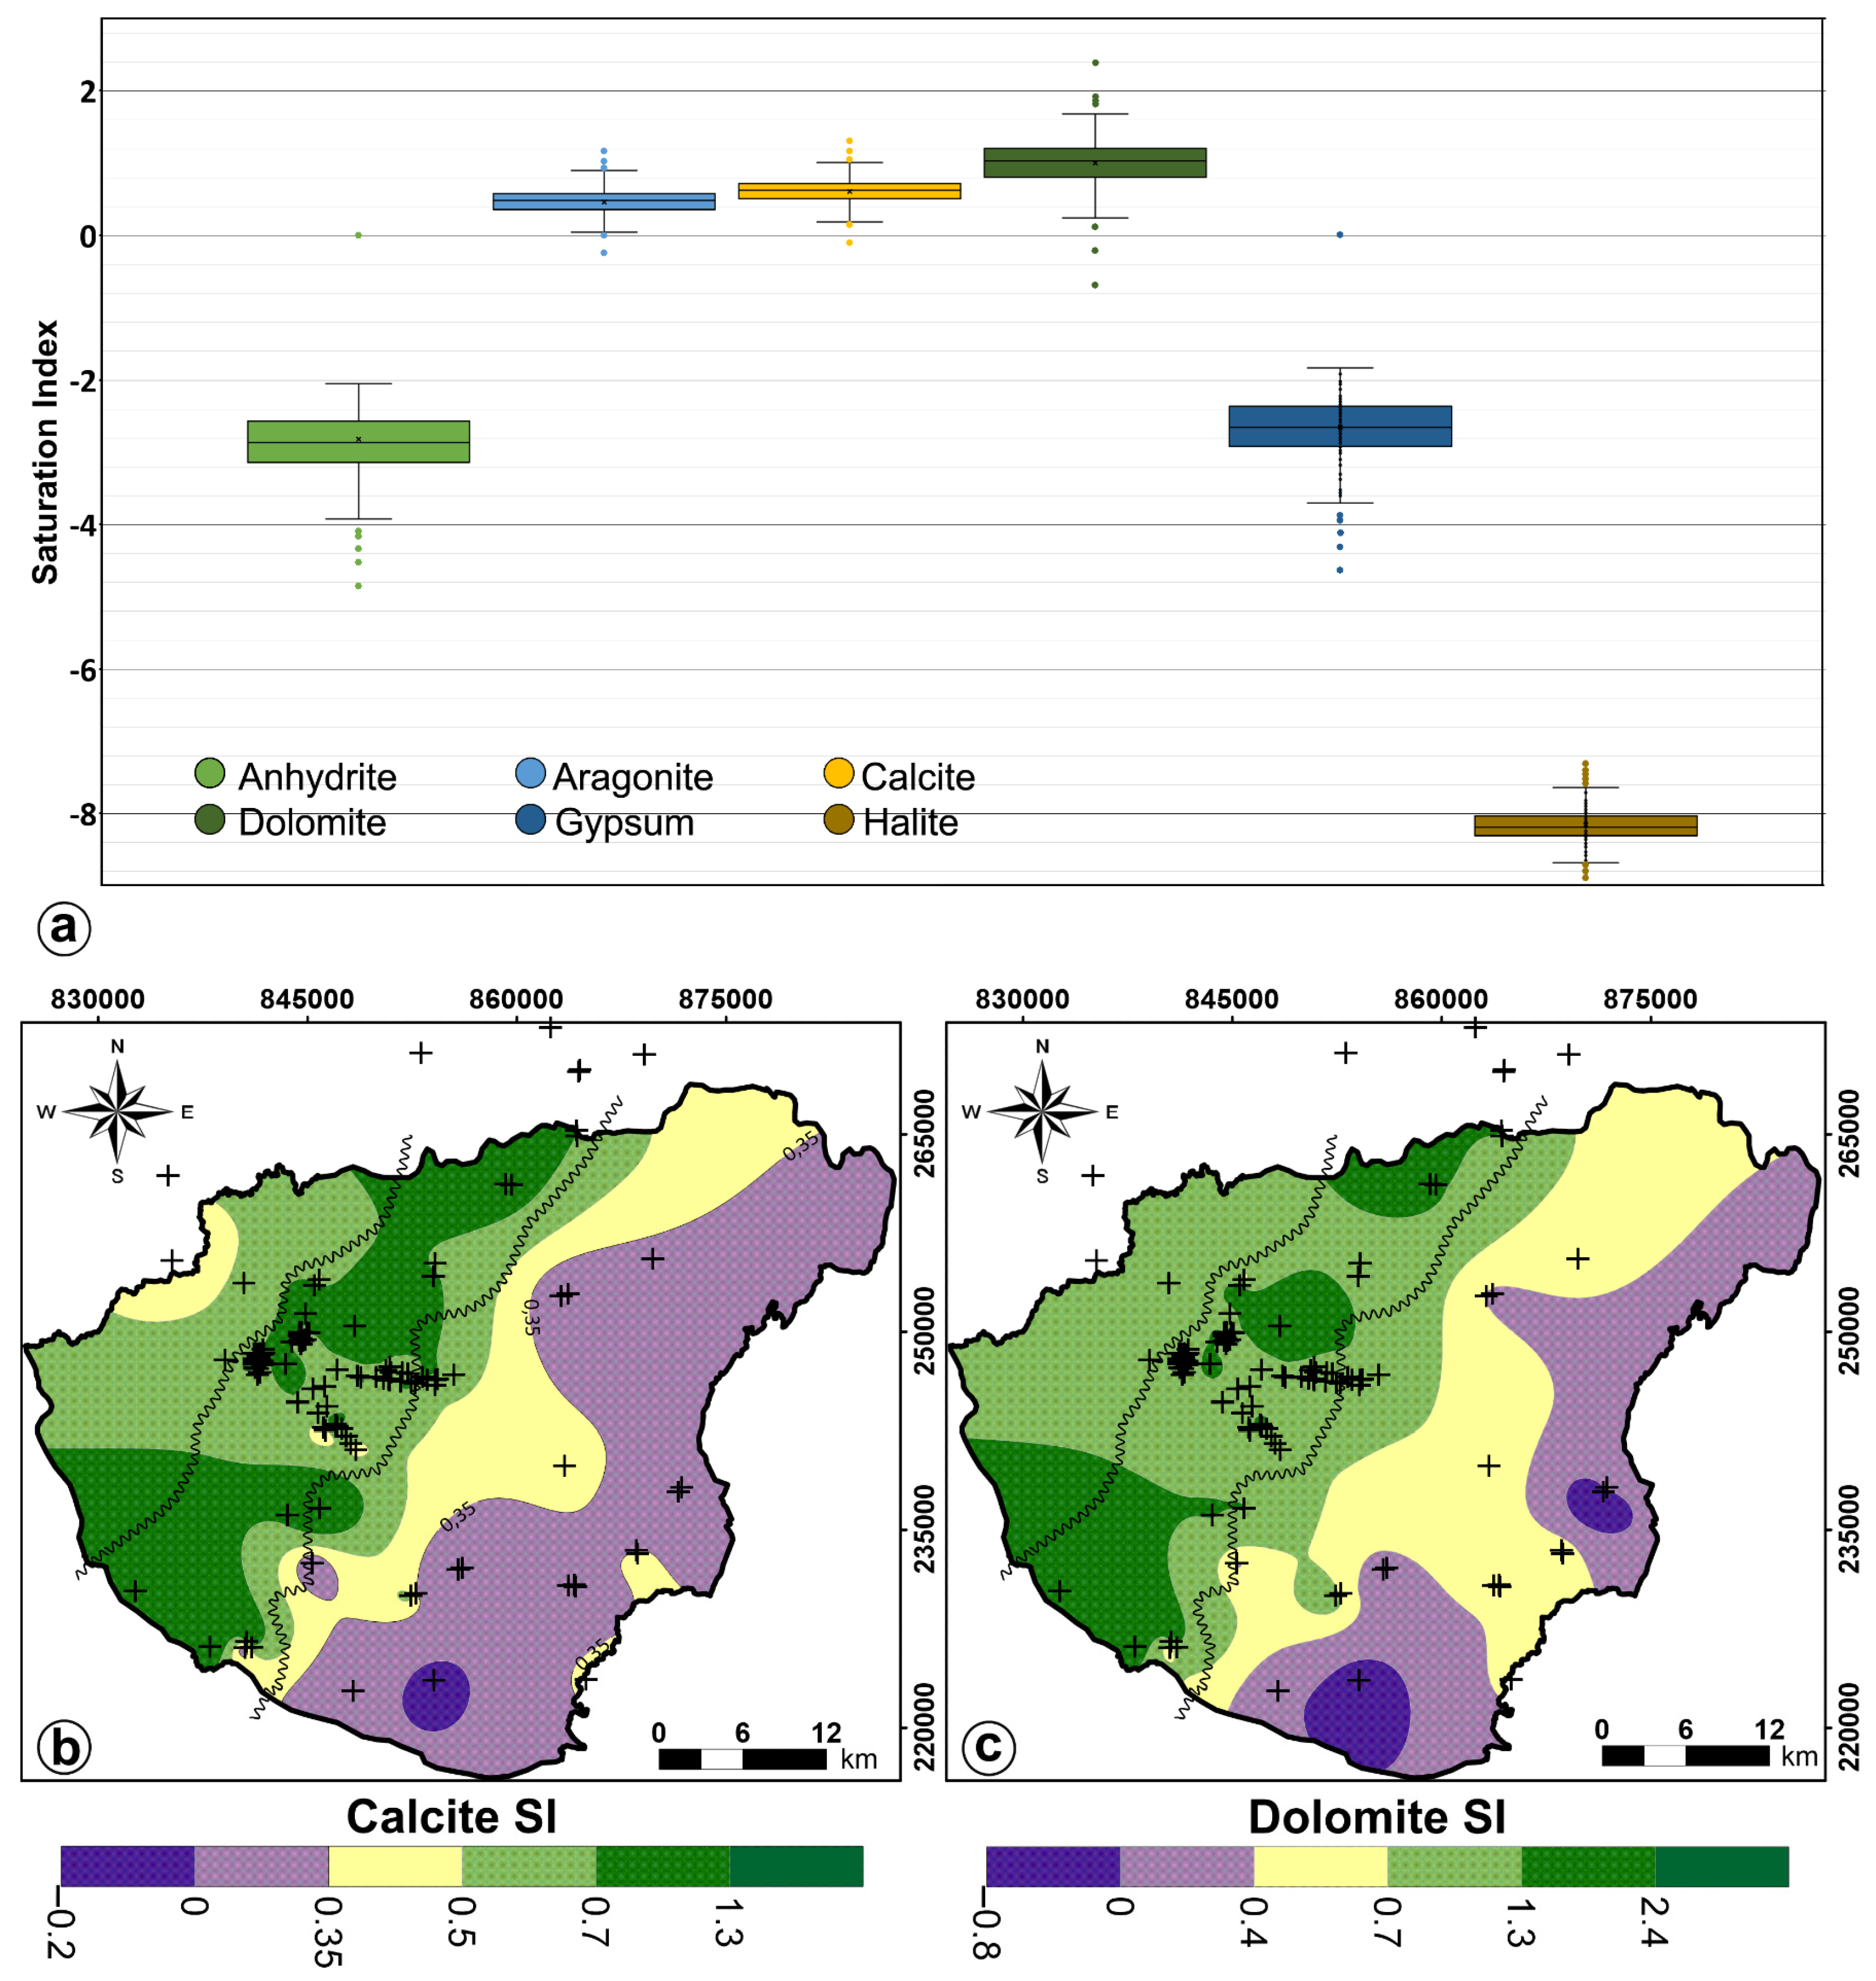
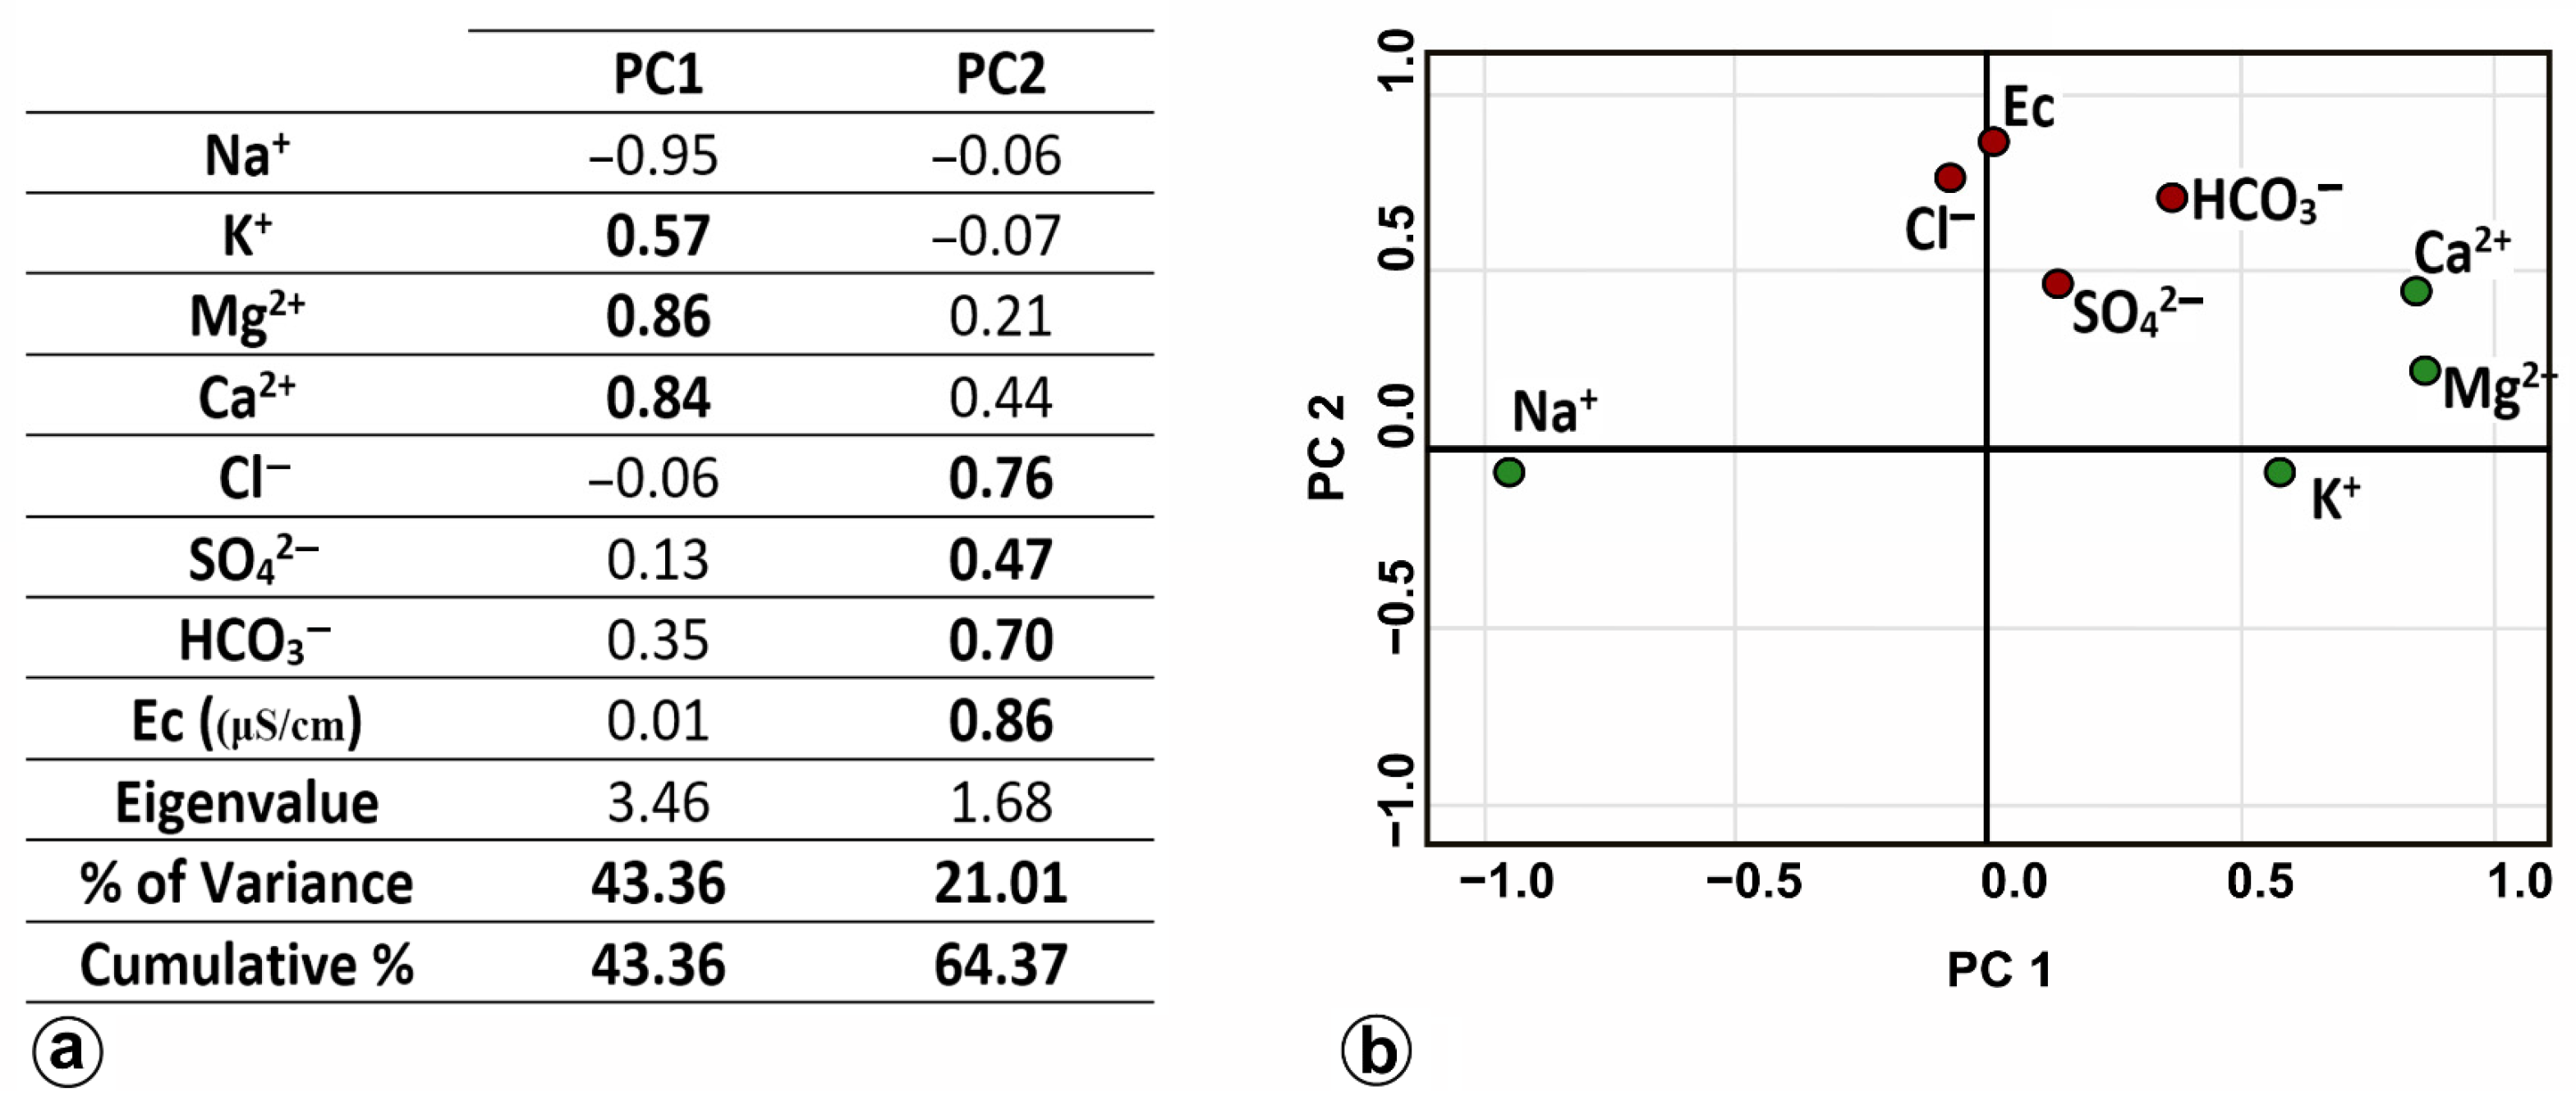
3.4. Geochemical Evidence of the Hydraulic Effects of the IVU
4. Conclusions
Author Contributions
Funding
Data Availability Statement
Conflicts of Interest
References
- Eaton, T.T. On the Importance of Geological Heterogeneity for Flow Simulation. Sediment. Geol. 2006, 184, 187–201. [Google Scholar] [CrossRef]
- Maliva, R.G. Aquifer Characterization.Schlumberger Methods in Water Resources Evaluation Series No. 4; Springer Nature: Fort Myers, FL, USA, 2016; ISBN 9783319321363. [Google Scholar] [CrossRef]
- Kawo, N.S.; Korus, J.; Gulbrandsen, M.L. Multiple-Point Statistical Modeling of Three-Dimensional Glacial Aquifer Heterogeneity for Improved Groundwater Management. Hydrogeol. J. 2023, 1–22. [Google Scholar] [CrossRef]
- Cardenas, M.B.; Zlotnik, V.A. Three-Dimensional Model of Modern Channel Bend Deposits. Water Resour. Res. 2003, 39, 1–13. [Google Scholar] [CrossRef]
- Anderson, M.P.; Aiken, J.S.; Webb, E.K.; Mickelson, D.M. Sedimentology and Hydrogeology of Two Braided Stream Deposits. Sediment. Geol. 1999, 129, 187–199. [Google Scholar] [CrossRef]
- Comunian, A.; Renard, P.; Straubhaar, J.; Bayer, P. Three-Dimensional High Resolution Fluvio-Glacial Aquifer Analog—Part 2: Geostatistical Modeling. J. Hydrol. 2011, 405, 10–23. [Google Scholar] [CrossRef]
- Hamdi, M.; Goïta, K. Estimation of Aquifer Storativity Using 3D Geological Modeling and the Spatial Random Bagging Simulation Method: The Saskatchewan River Basin Case Study (Central Canada). Water 2023, 15, 1156. [Google Scholar] [CrossRef]
- van Dijk, W.M.; Densmore, A.L.; Jackson, C.R.; Mackay, J.D.; Joshi, S.K.; Sinha, R.; Shekhar, S.; Gupta, S. Spatial Variation of Groundwater Response to Multiple Drivers in a Depleting Alluvial Aquifer System, Northwestern India. Prog. Phys. Geogr. Earth Environ. 2020, 44, 94–119. [Google Scholar] [CrossRef]
- McCord, J.T.; Gotway, C.A.; Conrad, S.H. Impact of Geologic Heterogeneity on Recharge Estimation Using Environmental Tracers: Numerical Modeling Investigation. Water Resour. Res. 1997, 33, 1229–1240. [Google Scholar] [CrossRef]
- Guo, Z.; Fogg, G.E.; Brusseau, M.L.; LaBolle, E.M.; Lopez, J. Modeling Groundwater Contaminant Transport in the Presence of Large Heterogeneity: A Case Study Comparing MT3D and RWhet. Hydrogeol. J. 2019, 27, 1363–1371. [Google Scholar] [CrossRef]
- Joshi, S.K.; Gupta, S.; Sinha, R.; Densmore, A.L.; Rai, S.P.; Shekhar, S.; Mason, P.J.; van Dijk, W. Strongly Heterogeneous Patterns of Groundwater Depletion in Northwestern India. J. Hydrol. 2021, 598, 126492. [Google Scholar] [CrossRef]
- Enemark, T.; Peeters, L.J.M.; Mallants, D.; Batelaan, O. Hydrogeological Conceptual Model Building and Testing: A Review. J. Hydrol. 2019, 569, 310–329. [Google Scholar] [CrossRef]
- Torrado, L.; Carvajal-Arenas, L.C.; Mann, P.; Bhattacharya, J. Integrated Seismic and Well-Log Analysis for the Exploration of Stratigraphic Traps in the Carbonera Formation, Llanos Foreland Basin of Colombia. J. S. Am. Earth Sci. 2020, 104, 102607. [Google Scholar] [CrossRef]
- Buday, T.; Püspöki, Z. B05 Facies Variations Detected by Well Log Correlation in a Geothermal Reservoir (Újfalu Formation) around Debrecen, Hungary. In Proceedings of the 6th Congress of Balkan Geophysical Society, Budapest, Hungary, 3–6 October 2011; European Association of Geoscientist and Engineers: Budapest, Hungary, 2011. [Google Scholar]
- Babad, A.; Burg, A.; Adar, E.M. Conceptual Hydrological Approach to a Geologically Complex Basin with Scarce Data: The Hula Valley, Middle East. Hydrogeol. J. 2019, 28, 703–722. [Google Scholar]
- Mas, P.; Calcagno, P.; Caritg-Monnot, S.; Beccaletto, L.; Capar, L.; Hamm, V. A 3D Geomodel of the Deep Aquifers in the Orléans Area of the Southern Paris Basin (France). Sci. Data 2022, 9, 781. [Google Scholar] [CrossRef]
- Enemark, T.; Andersen, L.T.; Høyer, A.S.; Jensen, K.H.; Kidmose, J.; Sandersen, P.B.E.; Sonnenborg, T.O. The Influence of Layer and Voxel Geological Modelling Strategy on Groundwater Modelling Results. Hydrogeol. J. 2022, 30, 617–635. [Google Scholar] [CrossRef]
- Déri-Takács, J.; Rostron, B.; Mendoza, C.; Mádl-Szőnyi, J. Hydrogeochemical Characteristics Refine the Conceptual Model of Groundwater Flow in Wood Buffalo National Park, Canada. Water 2022, 14, 965. [Google Scholar] [CrossRef]
- Ross, M.; Parent, M.; Lefebvre, R. 3D Geologic Framework Models for Regional Hydrogeology and Land-Use Management: A Case Study from a Quaternary Basin of Southwestern Quebec, Canada. Hydrogeol. J. 2005, 13, 690–707. [Google Scholar] [CrossRef]
- Ritzi, R.W.; Dominic, D.F.; Brown, N.R.; Kausch, K.W.; McAlenney, P.J.; Basial, M.J. Hydrofacies Distribution and Correlation in the Miami Valley Aquifer System. Water Resour. Res. 1995, 31, 3271–3281. [Google Scholar] [CrossRef]
- Fetter, C.W., Jr. Applied Hydrogeology, 4th ed.; Pearson: London, UK, 2014; ISBN 1-292-02290-6. [Google Scholar]
- Runkel, A.C.; Tipping, R.G.; Alexander, E.C.; Alexander, S.C. Hydrostratigraphic Characterization of Intergranular and Secondary Porosity in Part of the Cambrian Sandstone Aquifer System of the Cratonic Interior of North America: Improving Predictability of Hydrogeologic Properties. Sediment. Geol. 2006, 184, 281–304. [Google Scholar] [CrossRef]
- Marton, L.; Szanyi, J. Kelet-Magyarországi Pleisztocén Üledékek Geostatisztikai Vizsgálata. 1. A Transzmisszivitás Térképezése. Hidológiai Közlöny 1997, 77, 233–248. [Google Scholar]
- Anderson, M.P.; Woessner, W.W.; Hunt, R.J. Applied Groundwater Modeling. Simulation of Flow and Advective Transport, 2nd ed.; Elservier: London, UK, 2015; ISBN 9780120581030. [Google Scholar]
- Gupta, H.V.; Clark, M.P.; Vrugt, J.A.; Abramowitz, G.; Ye, M. Towards a Comprehensive Assessment of Model Structural Adequacy. Water Resour. Res. 2012, 48. [Google Scholar] [CrossRef]
- Tóth, J. Gravitational Systems of Groundwater Flow. Theory, Evaluation, Utilization, 1st ed.; Cambridge University Press: Cambridge, UK, 2009; ISBN 9780521886383. [Google Scholar]
- Tóth, J.; Almasi, I. Interpretation of Observed Fluid Potential Patterns in a Deep Sedimentary Basin under Tectonic Compression: Hungarian Great Plain, Pannonian Basin. Geofluids 2001, 1, 11–36. [Google Scholar] [CrossRef]
- Moya, C.E.; Raiber, M.; Taulis, M.; Cox, M.E. Hydrochemical Evolution and Groundwater Flow Processes in the Galilee and Eromanga Basins, Great Artesian Basin, Australia: A Multivariate Statistical Approach. Sci. Total Environ. 2015, 508, 411–426. [Google Scholar] [CrossRef] [PubMed]
- Parkhurst, D.L.; Appelo, C.A.J. Description of Input and Examples for PHREEQC Version 3—A Computer Program for Speciation, Batch-Reaction, One-Dimensional Transport, and Inverse Geochemical Calculations. US Geol. Surv. Tech. Methods 2013, 6, 497. [Google Scholar]
- Fuoco, I.; Figoli, A.; Criscuoli, A.; Brozzo, G.; De Rosa, R.; Gabriele, B.; Apollaro, C. Geochemical Modeling of Chromium Release in Natural Waters and Treatment by RO/NF Membrane Processes. Chemosphere 2020, 254, 126696. [Google Scholar] [CrossRef] [PubMed]
- Adadzi, P.; Allwright, A.; Fourie, F. Multivariate and Geostatistical Analyses of Groundwater Quality for Acid Rock Drainage at Waste Rock and Tailings Storage Site. J. Ecol. Eng. 2022, 23, 203–216. [Google Scholar] [CrossRef]
- El-Anwar, E.A.A.; Salman, S.A. Hydrochemical Modeling of Groundwater Quality from Sinai, Eastern and Western Deserts, Egypt. Model. Earth Syst. Environ. 2022, 8, 4427–4439. [Google Scholar] [CrossRef]
- Ibrahim, R.G.M.; Korany, E.A.; Tempel, R.N.; Gomaa, M.A. Processes of Water–Rock Interactions and Their Impacts upon the Groundwater Composition in Assiut Area, Egypt: Applications of Hydrogeochemical and Multivariate Analysis. J. Afr. Earth Sci. 2019, 149, 72–83. [Google Scholar] [CrossRef]
- Debreceni Vizmű Zrt. The History of Debrecen Water Works. Available online: https://www-debreceni--vizmu-hu.translate.goog/cegunkrol/cegtortenet?_x_tr_sl=hu&_x_tr_tl=en&_x_tr_hl=es-419&_x_tr_pto=wapp (accessed on 16 May 2023).
- Marton, L. Izotóphidrológiai Modellek És Számítási Eljárások a Felszín Alatti Vizek Mozgásának Tanulmányozásához. Hidrológiai Közlöny 1982, 62, 525–572. [Google Scholar]
- Szanyi, J. Felszín Alatti Víytermelés Környezeti Hatásai Dél-Nyírség Péeldáján, Szegedi Tudományegyetem. 2004. Available online: https://doktori.bibl.u-szeged.hu/id/eprint/335/ (accessed on 10 May 2023).
- Debreceni Vizmű Zrt. Documentumtár-Water Managment Legislation. Available online: https://www.debreceni-vizmu.hu/dokumentumtar (accessed on 29 March 2022).
- Vkki, V.; és, K.K.I. Vízgyűjtő-Gazdálkodási terv. Tisza Részvízgyűjtő; Budapest, Hungary. 2010. Available online: https://geoportal.vizugy.hu/vizgyujtogazd01/ (accessed on 10 May 2023).
- ESRI Magyarország Kft. Víztestek a Vízgyűjtőkön. Available online: http://geoportal.vizugy.hu/vizgyujtogazd01/ (accessed on 19 April 2022).
- NATéR NATÉR Portál. Available online: https://map.mbfsz.gov.hu/nater/ (accessed on 10 May 2023).
- Haas, J.; Budai, T.; Csontos, L.; Fodor, L.; Konrád, G.; Koroknai, B. Geology of the Pre-Cenozoic Basement of Hungary. Explanatory Notes for “Pre-Cenozoic Geological Map of Hungary” (1:500,000); Piros, O., Ed.; Geological and Geophysical Institute of Hungary: Budapest, Hungary, 2014; ISBN 9789636712990. [Google Scholar]
- Haas, J.; Budai, T.; Csontos, L.; Fodor, L.; Konrád, G.; Koroknai, B. Magyarország Pre-Kainozoos Földtani Térképe. Available online: https://map.mbfsz.gov.hu/preterc500/ (accessed on 10 May 2023).
- Juhász, G.; Pogácsás, G.; Magyar, I.; Vakarcs, G. Integrált-Sztratigráfiai és Fejlődéstörténeti Vizsgálatok az Alföld Pannóniai s.l. Rétegsorában. Földtani Közlöny 2006, 136, 51–86. [Google Scholar]
- Csato, I.; Tóth, S.; Catuneanu, O.; Granjeon, D. A Sequence Stratigraphic Model for the Upper Miocene–Pliocene Basin Fill of the Pannonian Basin, Eastern Hungary. Mar. Pet. Geol. 2015, 66, 117–134. [Google Scholar] [CrossRef]
- Magyar, I.; Radivojević, D.; Sztanó, O.; Synak, R.; Ujszászi, K.; Pócsik, M. Progradation of the Paleo-Danube Shelfmargin across the Pannonian Basin during the Late Miocene and Early Pliocene. Glob. Planet. Chang. 2013, 103, 168–173. [Google Scholar] [CrossRef]
- Császár, G.; Loránd, A.; Jaskó, T.; Dezső, S. (Eds.) Lithostratigraphic Units of Hungary. Charts and Short Descriptions; PR Press Kft.: Budapest, Hungary, 1997; ISBN 9636711909. [Google Scholar]
- Borsy, Z. Hordalékkúpok Fejlődése Az Alföldön; Scientific Publications in the BGYTF: Budapest, Hungary, 1982; Volume 37. [Google Scholar]
- Borsy, Z. Evolution of the Alluvial Fans of the Alföld. In Alluvial Fans: A Field Approach; Rachocki, A., Church, M., Eds.; John Wiley & Sons Inc.: New York, NY, USA, 1990; pp. 229–246. [Google Scholar]
- Lóki, J.; Hertelendi, E.; Borsy, Z. New Dating of Blown Sand Movement in the Nyírség. Acta Geogr. Geol. Meteorol. Debrecina 1994, 32, 67–79. [Google Scholar]
- Gábris, G.; Nádor, A. Long-Term Fluvial Archives in Hungary: Response of the Danube and Tisza Rivers to Tectonic Movements and Climatic Changes during the Quaternary: A Review and New Synthesis. Quat. Sci. Rev. 2007, 26, 2758–2782. [Google Scholar] [CrossRef]
- Püspöki, Z.; Demeter, G.; Tóth-Makk, Á.; Kozák, M.; Dávid, Á.; Virág, M.; Kovács-Pálffy, P.; Kónya, P.; Gyuricza, G.; Kiss, J.; et al. Tectonically Controlled Quaternary Intracontinental Fluvial Sequence Development in the Nyírség-Pannonian Basin, Hungary. Sediment. Geol. 2013, 283, 34–56. [Google Scholar] [CrossRef]
- Kun, E. The 30-Year Average of the Infiltration Values Calculated on the Basis of the CARPATCLIM-HU Measured Climate Parameters for the 1975–2004 of Climate Period 1; Budapest, Hungary. 2016. Available online: https://map.mbfsz.gov.hu/nater/ (accessed on 19 April 2023).
- Kun, E. 30-Year Average of Groundwater Levels Calculated in a National 3D Flow Model Based on the CARPATCLIM-HU Database for the Period 1975–2004; Budapest, Hungary. 2016. Available online: https://map.mbfsz.gov.hu/nater/ (accessed on 19 April 2023).
- Maekawa, T.; Matsumoto, Y.; Namiki, K. Interpolation by Geometric Algorithm. Comput.-Aided Des. 2007, 39, 313–323. [Google Scholar] [CrossRef]
- Aquaveo Stratigraphy Modeling—Horizons, TINs, and Meshes. Available online: https://s3.amazonaws.com/gmstutorials-10.7.aquaveo.com/StratigraphyModeling-HorizonsTINsAndMeshes.pdf (accessed on 1 January 2023).
- Logan, J. Estimating Transmissibility from Routine Production Tests of Water Wells. Groundwater 1964, 2, 35–37. [Google Scholar] [CrossRef]
- Risser, D. Factors Affecting Specific-Capacity Tests and Their Application—A Study of Six Low-Yielding Wells in Fractured-Bedrock Aquifers in Pennsylvania; U.S. Geological Survey: Reston, VA, USA, 2010. [Google Scholar]
- Lohman, S.W. Groundwater Hydraulics, 2nd ed.; Superintendent of Documents; U.S. Government Printing Office: Washington, DC, USA, 1979; ISBN 0444998209. [Google Scholar]
- Cheng, H.P. Computing Flow through Well Screens Using an Embedded Well Technique. Available online: https://apps.dtic.mil/sti/pdfs/ADA623142.pdf (accessed on 1 January 2023).
- Oliver, M.A.; Webster, R. Basic Steps in Geostatistics: The Variogram and Kriging; Springer International Publishing: New York, NY, USA, 2015; ISBN 9783319158648. [Google Scholar]
- Mikhailov, G.K. Daniel Bernoulli, Hydrodynamica (1738). In Landmark Writings in Western Mathematics 1640–1940; Grattan-Guinness, I., Cooke, R., Corry, L., Crépel, P., Guicciardin, N., Eds.; Elsevier: Amsterdam, The Netherlands, 2005; pp. 131–142. ISBN 9780444508713. [Google Scholar]
- Fogg, G.E.; Kreitler, C.W. Ground-Water Hydrology around Salt Domes in the East Texas Basin: A Practical Approach to the Contaminat Trasport Problem. Bull. Assoc. Eng. Geol. 1981, 18, 387–411. [Google Scholar]
- Zhang, B.; Zhao, D.; Zhou, P.; Qu, S.; Liao, F.; Guangcai, W. Hydrochemical Characteristics of Groundwater and Dominant Water—Rock Interactions in the Delingha. Water 2020, 12, 836. [Google Scholar] [CrossRef]
- Piper, A.M. A Graphic Procedure in the Geochemical Interpretation of Water-Analyses. Eos Trans. Am. Geophys. Union 1944, 25, 914–928. [Google Scholar] [CrossRef]
- Rajmohan, N.; Elango, L. Identification and Evolution of Hydrogeochemical Processes in the Groundwater Environment in an Area of the Palar and Cheyyar River Basins, Southern India. Environ. Geol. 2004, 46, 47–61. [Google Scholar] [CrossRef]
- Appelo, C.A.J.; Postma, D. Groundwater, Geochemistry and Pollution, 1st ed.; Cambridge University Press: Rotterdam, The Netherlands, 1993; ISBN 9789054101062. [Google Scholar]
- Spearman Rank Correlation Coefficient. In The Concise Encyclopedia of Statistics; Springer: New York, NY, USA, 2008; pp. 502–505. ISBN 978-0-387-32833-1.
- Iqbal, J.; Su, C.; Rashid, A.; Yang, N.; Baloch, M.Y.J.; Talpur, S.A.; Ullah, Z.; Rahman, G.; Rahman, N.U.; Earjh; et al. Hydrogeochemical Assessment of Groundwater and Suitability Analysis for Domestic and Agricultural Utility in Southern Punjab, Pakistan. Water 2021, 13, 3589. [Google Scholar] [CrossRef]
- Patil, V.H.; Singh, S.N.; Mishra, S.; Donavan, D.T. Efficient Theory Development and Factor Retention Criteria: Abandon the ‘Eigenvalue Greater than One’ Criterion. J. Bus. Res. 2008, 61, 162–170. [Google Scholar] [CrossRef]
- Szabó, N.P.; Braun, B.A.; Abdelrahman, M.M.G.; Dobróka, M. Improved Well Logs Clustering Algorithm for Shale Gas Identification and Formation Evaluation. Acta Geod. Geophys. 2021, 56, 711–729. [Google Scholar] [CrossRef]
- Bridge, J.S. Rivers and Floodplains: Forms, Processes, and Sedimentary Record; John Wiley & Sons Inc.: Hoboken, NJ, USA, 2003; ISBN 978-0-632-06489-2. [Google Scholar]
- Miall, A.D. The Geology of Fluvial Deposits. In Sedimentary Facies, Basin Analysis, and Petroleum Geology, 4th ed.; Springer: Berlin/Heidelberg, Germany, 2006; ISBN 3540591869. [Google Scholar]
- Al-Mashreki, M.H.; Eid, M.H.; Saeed, O.; Székács, A.; Szűcs, P.; Gad, M.; Abukhadra, M.R.; AlHammadi, A.A.; Alrakhami, M.S.; Alshabibi, M.A.; et al. Integration of Geochemical Modeling, Multivariate Analysis, and Irrigation Indices for Assessing Groundwater Quality in the Al-Jawf Basin, Yemen. Water 2023, 15, 1496. [Google Scholar] [CrossRef]


| Data Type | Samples | Source | Institution | |
|---|---|---|---|---|
| Geological and geophysical | Geologic log | 130 | New Urbancsek Data Base | SARA 1 |
| Geophysical logs | 133 | |||
| Hydrodynamic | Hydraulic head | 366 | Hungarian deep-drilled wells index. New Urbancsek Data Base. | SARA 1 ME 2 |
| Well diameter | 466 | |||
| Screen sections and production rate | 369 | |||
| Geochemical | Water samples | 118 | National Geochemical Database | SARA 1 |
| pH | T (°C) | Ec (Ω.m) | Na+ | K+ | Mg2+ | Ca2+ | Cl− | SO42− | HCO3− | CO3− | NO3− | TDS | |
|---|---|---|---|---|---|---|---|---|---|---|---|---|---|
| Max | 8.8 | 24.6 | 767.0 | 193.0 | 6.5 | 29.8 | 106.3 | 31.4 | 55.0 | 570.0 | 0.0 | 90.4 | 1304.0 |
| Min | 7.2 | 10.7 | 430.0 | 16.0 | 0.5 | 0.1 | 2.9 | 2.0 | 0.0 | 320.0 | 0.0 | 0.0 | 290.0 |
| Mean | 7.7 | 18.2 | 576.9 | 45.5 | 2.2 | 20.1 | 75.0 | 7.7 | 10.7 | 439.8 | 0.0 | 1.2 | 614.5 |
| Media | 7.6 | 18.0 | 566.5 | 33.4 | 2.2 | 21.4 | 81.1 | 7.0 | 8.6 | 440.0 | 0.0 | 0.0 | 604.0 |
| St. Deviation | 0.3 | 2.3 | 56.5 | 33.8 | 1.0 | 6.1 | 24.4 | 4.0 | 9.0 | 41.9 | 0.0 | 8.5 | 99.2 |
| Na+ | K+ | Mg2+ | Ca2+ | Cl− | SO42− | HCO3− | Ec (Ω.m) | |
|---|---|---|---|---|---|---|---|---|
| Na+ | 1 | −0.38 | −0.82 | −0.88 | −0.04 | −0.17 | −0.3 | −0.01 |
| K+ | 1 | 0.31 | 0.37 | −0.01 | 0.02 | 0.13 | 0.05 | |
| Mg2+ | 1 | 0.74 | 0.07 | 0.22 | 0.44 | 0.21 | ||
| Ca2+ | 1 | 0.3 | 0.27 | 0.6 | 0.36 | |||
| Cl− | 1 | 0.25 | 0.34 | 0.5 | ||||
| SO42− | 1 | 0.16 | 0.27 | |||||
| HCO3− | 1 | 0.6 | ||||||
| Ec (Ω.m) | 1 |
Disclaimer/Publisher’s Note: The statements, opinions and data contained in all publications are solely those of the individual author(s) and contributor(s) and not of MDPI and/or the editor(s). MDPI and/or the editor(s) disclaim responsibility for any injury to people or property resulting from any ideas, methods, instructions or products referred to in the content. |
© 2023 by the authors. Licensee MDPI, Basel, Switzerland. This article is an open access article distributed under the terms and conditions of the Creative Commons Attribution (CC BY) license (https://creativecommons.org/licenses/by/4.0/).
Share and Cite
Flores, Y.G.; Eid, M.H.; Szűcs, P.; Szőcs, T.; Fancsik, T.; Szanyi, J.; Kovács, B.; Markos, G.; Újlaki, P.; Tóth, P.; et al. Integration of Geological, Geochemical Modelling and Hydrodynamic Condition for Understanding the Geometry and Flow Pattern of the Aquifer System, Southern Nyírség–Hajdúság, Hungary. Water 2023, 15, 2888. https://doi.org/10.3390/w15162888
Flores YG, Eid MH, Szűcs P, Szőcs T, Fancsik T, Szanyi J, Kovács B, Markos G, Újlaki P, Tóth P, et al. Integration of Geological, Geochemical Modelling and Hydrodynamic Condition for Understanding the Geometry and Flow Pattern of the Aquifer System, Southern Nyírség–Hajdúság, Hungary. Water. 2023; 15(16):2888. https://doi.org/10.3390/w15162888
Chicago/Turabian StyleFlores, Yetzabbel G., Mohamed Hamdy Eid, Péter Szűcs, Teodora Szőcs, Támas Fancsik, János Szanyi, Balázs Kovács, Gábor Markos, Péter Újlaki, Péter Tóth, and et al. 2023. "Integration of Geological, Geochemical Modelling and Hydrodynamic Condition for Understanding the Geometry and Flow Pattern of the Aquifer System, Southern Nyírség–Hajdúság, Hungary" Water 15, no. 16: 2888. https://doi.org/10.3390/w15162888
APA StyleFlores, Y. G., Eid, M. H., Szűcs, P., Szőcs, T., Fancsik, T., Szanyi, J., Kovács, B., Markos, G., Újlaki, P., Tóth, P., McIntosh, R. W., & Püspöki, Z. (2023). Integration of Geological, Geochemical Modelling and Hydrodynamic Condition for Understanding the Geometry and Flow Pattern of the Aquifer System, Southern Nyírség–Hajdúság, Hungary. Water, 15(16), 2888. https://doi.org/10.3390/w15162888