Abstract
A reasonable flood season delineation can effectively implement staged reservoir scheduling and improve water resource efficiency. Therefore, this study is aimed at analyzing the flood period segmentation and optimizing the staged flood limit water levels (FLWLs) for a multi-purpose reservoir, the Longtan Reservoir, China. The rainfall seasonality index () and the runoff seasonality index () are used to evaluate the feasibility and rationality of the flood period staging. The fractal method is then used to segment the flood season. Finally, the design flood is carried out to optimize the staged FLWLs. The results show that the is an effective indicator for judging the feasibility and verifying the rationality of flood segmentation. The flood period can be segmented into the pre-flood season (12 April–29 May), the main flood season (30 May–3 September), and the post-flood season (4 September–9 November). The FLWLs in the main flood and the post-flood season can be raised by 2.05 m and 3.45 m, and the effective reservoir capacity is increased by 5.810 billion m3 and 6.337 billion m3, according to the results of the flood season division.
1. Introduction
The frequency of extreme flood events has increased significantly under the influence of global warming [1,2]. Areas rich in water resources, but especially the region behind the economy is more vulnerable to the hazard of floods. Take the Himalayas for example. The region has worked 62 glacial lake outburst flood (GLOF) since 1935, occurring eight in Nepal [3], once every 3–10 years [4,5,6]. In recent decades, sustainability, resilience, and climate change adaptation flood control strategies have emerged [7], such as low impact development (LID) [8,9], sustainable drainage systems (SUDS) [10,11], green infrastructure (GI) [12,13,14], water sensitive urban design (WSUD) [15,16], etc., which have received positive responses in developed countries. For developing countries faced with population pressure and food shortages, forcing societies to use floodplains, engineering measures, such as dredging rivers, strengthening drainage systems, and building flood walls, continue to be taken to reduce the impact of flooding [17,18,19]. The construction of a sound flood control engineering system will help to bring out the beneficial properties of floods while preventing floods. Reservoirs are one of the most effective components of critical infrastructure [20], but traditional reservoir operation and scheduling often use a single FLWL to meet the flood, leading to massive abandonment of water during the flood season and insufficient storage after the flood, which exacerbates the conflict between reservoir flood control and benefit generation [21,22].
Therefore, mankind has changed the operation of a single FLWL through the method of flood staging. Currently, the clustering analysis method is widely used for flood season segmentation. Commonly used cluster analysis methods include the fractal analysis method [23], the fuzzy set analysis method [24,25], the change-point analytic method [26], the Fisher optimal segmentation method [27,28], the set pair analysis method [29], the ensemble method [30,31], and other methods [32]. Compared with other clustering analysis methods, the fractal method overcomes the subjective empirical nature in the determination of indicator thresholds and the number of variation points. Fang [33] and Wang et al. [34] demonstrated that the fractal method is quantitative and objective based on the fractal theory of flood staging through practical research cases. Based on the reasonable flood staging results, the FLWL of each stage is optimized, to achieve the purpose of reservoir benefit and flood control. The methods of staged FLWL optimization include the fuzzy analysis method [35,36,37], the artificial intelligence optimization algorithms [38,39,40], and the design flood process method [41,42,43]. Compared with the design flood process method, which has clear physical principles and simple calculations [44], the fuzzy analysis and the artificial intelligence optimization algorithms are not widely applicable because of the large subjective errors and cumbersome calculations [43,45,46].
In summary, the previous research on flood staging and FLWL adjustment is relatively mature, but the feasibility study of flood staging and the reasonableness test of the staging results have rarely been covered. The objective understanding of seasonal changes in precipitation or runoff directly affects the results of flood staging, and reservoir flood staging is the basis for the reservoir scheduling scheme [47]. In the past, the necessity and feasibility of flood separation were basically judged qualitatively from the operation of water facilities; the reasonableness of flood separation results is mainly judged qualitatively, or by comparing the staging results of different flood separation methods for mutual testing. However, there are a large number of calculations in the existing flood separation methods and only a few flood separation methods can be selected for cross-checking in the actual study, so the reasonableness of the staging results needs to be investigated. [48]. How to analyze the feasibility of flood staging [49] and the reasonable test of the staging results [25,50] from a quantitative point of view represents an urgent problem to be solved.
Therefore, the novelty of this study is to overcome the above difficulties by using the and to address the following three objectives: (1) A Seasonality index method is used to evaluate the feasibility of flood season segmentation. (2) A Fractal method for flood staging is employed, using a comparative study of the seasonality indexes before and after dividing the entire flood season to inspect the reasonableness of the flood season segmentation results. (3) A design flood process method to optimize staged flood FLWLs. A multi-purpose reservoir, the Longtan Reservoir, China, is picked as a case study. The research flow is shown in Figure 1.
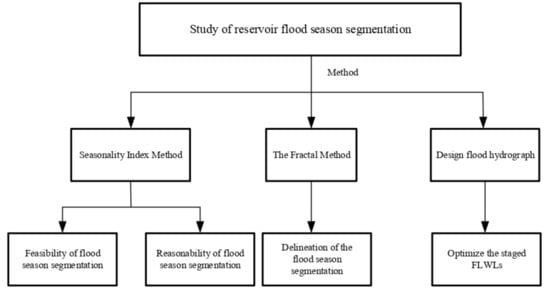
Figure 1.
The research flow.
2. Materials and Methods
2.1. Study Area and Data
Longtan Reservoir is located in the canyon area of the upper reaches of the Hongshui River, (102°20′ E~109°30′ E, 23°04′ N~26°50′ N) (Figure 2). The reservoir is the “leading” reservoir power station of the Hongshui River, with a normal storage level of 375 m and an effective storage capacity of 111.15 billion m3. Since its commissioning in 2007, the operation is as follows: the highest annual water inflow was in 2008 (54.754 billion m3), and its highest post-flood level is 374.88 m; the lowest annual water inflow was in 2011 (25.938 billion m3), and its highest post-flood level is 339.91 m. According to the comprehensive water inflow and annual maximum water level, the water inflow of the reservoir exceeds 111.5 billion m3 of the reservoir’s profit storage capacity, but the reservoir has not fully stored to the normal storage level of 375 m in recent years, and the reservoir filling rate is only 70%. If the reservoir is operated strictly according to the FLWL, there is a risk of a large amount of water abandonment. Not only can the water resources not be fully utilized, but the power and electricity of cascade hydropower stations downstream of Longtan will also be affected, which will pose a threat to the water supply security in the Pearl River Delta in the dry season. Based on this, this study takes Longtan Reservoir as the research object and adjusts its flood season staging and FLWL.
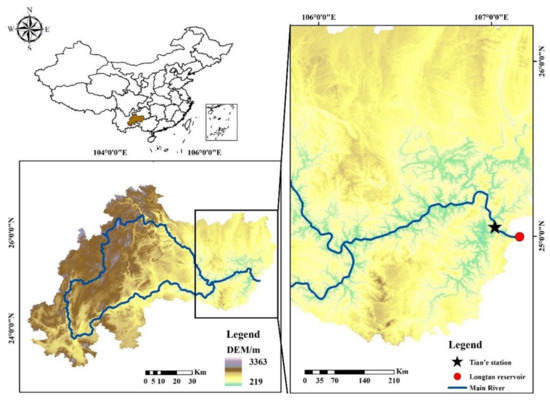
Figure 2.
Location of the study area.
Tian’e Hydrological Station is located 15 km downstream of Longtan Reservoir and was established in May 1959. The adjustment of flood stage and FLWL in this study are directly adopted from Tian’e station hydrological data, including 53-year long series of daily rainfall, daily runoff, and flood data from 1960 to 2012.
2.2. Methodology
2.2.1. Seasonality Index Method
A seasonality index () is an effective tool for analyzing seasonal variation across space and time [36]. In this study, is used to describe the seasonal characteristics of rainfall and runoff in the flood season of the Longtan basin. Thus, the feasibility and rationality of flood staging can be quantitatively analyzed. The is given as follows [51]:
where is total rainfall or runoff in a certain study period, in month , and is total rainfall or runoff. The rainfall and runoff data are obtained from the daily rainfall and runoff of Tian’ e station from 1960 to 2012.
As suggested by Walsh and Lawler [51], the seasonality index classes are shown in Table 1. Therefore, it is indicated that rainfall and runoff are evenly distributed throughout the flood season when 0.19, and there is variability in the distribution of rainfall and runoff during the flood season which needs to be staged when > 0.19 in this study.

Table 1.
Seasonality index cases.
2.2.2. Fractal Method
The concept of fractals [52] reveals the unity of order and disorder and the unity of determinism and indeterminism in nonlinear systems. Therefore, the fractal method is widely used to study hydrological changes with random, nonlinear, and similar characteristics. This study used the fractal analysis method with rainfall and runoff as the index factors and calculates the corresponding capacity dimension (similar dimension) to quantify the fractal by selecting the average series of annual rainfall and annual runoff, to determine the flood stage of Longtan Reservoir. The specific steps are as follows:
- (1)
- The Samples are taken from the entire flood season.
- (2)
- Determine the time length /d.
- (3)
- Select the threshold levels .
- (4)
- Count the number of times in that the sample exceeds the -threshold.
- (5)
- Calculate the relative time scale corresponding to the different time scale , and the is given as follows:
- (6)
- Calculate the relative measurements
- (7)
- Calculate and , then make a linear fitting to them to obtain the slope . The capacity dimension can be obtained as follows:
- (8)
- can be seen as the same staging if increasing and decreasing the time length and repeating steps (2) to (7) yields approximately equal capacity dimensions .
2.2.3. Design Flood Process Method
In this study, the design flood hydrograph was used for the adjustment of the staged FLWLs. Firstly, we used the staged maximum method to select samples of flood data from 1960 to 2012 at Tian’e station and the staged annual maximum method to select samples of historical floods (the results of the selection are shown in Table S1 of supplementary materials). Then, we calculated the empirical flood frequencies by Equations (5)–(7) and determined the initial statistical parameter values according to Equation (8) to fit a theoretical frequency curve. Finally, the typical flood hydrograph in July 1966, which is unfavorable to flood control, was selected, and the peak flow was used as the control standard in accordance with the same ratio amplification method (Equation (9)) to derive the 500-year design flood hydrograph and the 10,000-year check flood hydrograph for each flood stage, according to Equation (10), to derive the reservoir capacity of the staged reservoir, to obtain the stage FLWLs.
The calculation steps of the Design flood process method are as follows [53]:
- (1)
- The annual maximum method is used for flood sample selection and the n-year flood series is arranged in descending order as: , the empirical frequency of the pre and post flood periods can be calculated by the following equation:
- (2)
- In the investigation and certification period of years, there are a catastrophic flood, of which l occur in a continuous series of n items, the empirical frequency of the main food period in such a discontinuous series of floods can be calculated by the following equation.Empirical frequency of a catastrophic flood:Empirical frequency of n-l consecutive floods:
- (3)
- Unbiased estimation formula of moment method:where is modulus coefficient .
- (4)
- The same ratio amplification method is as follows:where is the amplification factor, is the peak flow of the design flood, and is the peak flow of the typical flood.
- (5)
- The idea of flood regulation calculation in this study is to conduct flood regulation calculation according to the flood control requirements of the dam itself and then calculate the final stage FLWLs according to the flood control storage capacity. Principle of reservoir flood control calculation based on water balance principle:where and are incoming flows at the beginning and the end of the period; and are outgoing flows at the beginning and the end of the period; and are reservoir capacity values at the start and the end of the period; is calculation time.
3. Results
3.1. Feasibility Analysis of Flood Season Segmentation
We aimed to analyze the necessity and feasibility of flood segmentation from a quantitative perspective through the change pattern of the and the in the flood season of Longtan basin. The variations of the and the are shown in Figure 3. The shows a slight upward trend (the slope is 0.0019), and the shows a slight downward trend (the slope is −0.0004). The results indicate that the and the show no clear tendency to increase or decrease, reflecting the random nature of hydrological phenomena. Overall, the shape of the variation curves of the and are basically the same, which also indicates that the formation of runoff is affected by rainfall to some extent. In 89% of the years, the is greater than the , implying that the seasonal characteristics of runoff are more significant than that of rainfall during the flood season, mainly because the water content of the watershed soil is not saturated in the early flood season, and it takes some time for rainfall to yield runoff. The maximum value of the is 0.66 which appeared in 1991, the minimum value is 0.22 and occurred in 1961, and the mean value is 0.46. The peak value of the is 0.66, occurring in 1998, the minimum value is 0.36, occurring in 1961, and the mean value is 0.5. As shown in Figure 4, 60% and 74% of the years that the and the range from 0.4 to 0.59, respectively, which meet the criterion of significant seasonality. The results show that both rainfall and runoff exhibit pronounced seasonal characteristics throughout the flood season. Thus, it is feasible and essential to stage the flood in Longtan Reservoir.
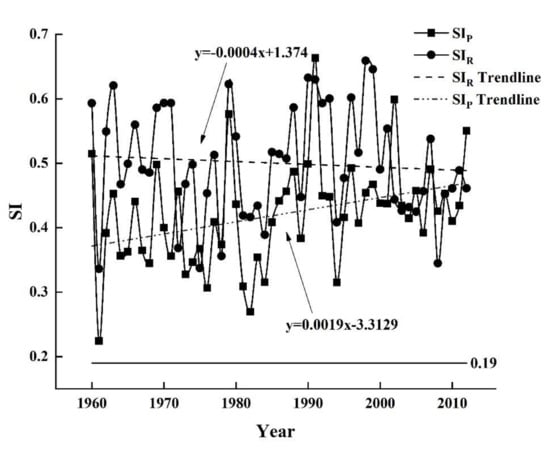
Figure 3.
The variations of the and the .
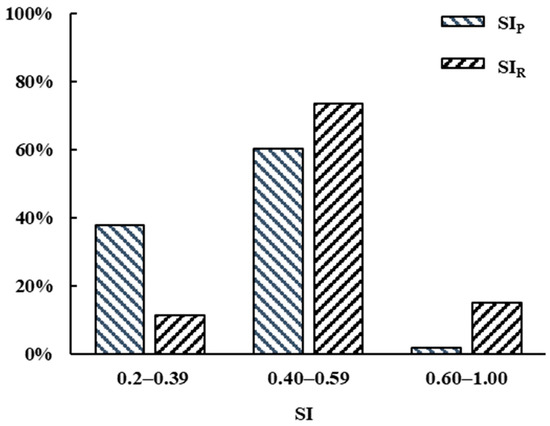
Figure 4.
Percentage of each level of the and for the entire flood season.
3.2. Flood Season Segmentation Results
Fractal calculations based on the rainfall and runoff data of Longtan Reservoir from 1960 to 2012 were used to obtain reasonable flood segmentation results. According to Qian and Zheng [54], the two periods are deemed to be part of the same sub-flood season if the capacity dimension of one period is similar to that of another neighboring period (with the maximum divergence not exceeding the crucial value of 5%).
The segmentation results are shown in Table 2 and Table 3. Table 2, by using rainfall as an index show that when T = 50 d, the largest deviation of the slope of is 0.1687, which was 9.58% (>5%) of the minimal capacity dimension, suggesting a mutation in the capacity dimension at T = 50 d. When T = 30 d~T = 45 d, the capacity dimension is quite close, and the maximum deviation is 0.0334, which only accounts for 1.89% of the minimum capacity dimension, so it can be classified as the pre-flood season (12 April–26 May). In the same analysis, the main flood and post-flood periods are 27 May–3 September and 4 September–9 November, respectively. Using runoff as an indicator, the entire flood season is segmented into four sub-flood periods (Table 3). However, according to the hydraulic engineering calculation standards, floods are divided into a maximum of 3 sub-flood seasons. As a result, the second and third stages are integrated into the main flood season in this study based on the multi-year average daily runoff flow and flood evolution pattern. So, the pre-flood, main flood, and post-flood periods are 12 April–31 May, 1 June–3 September, and 4 September–9 November, respectively. The segmentation results with the daily rainfall index and daily runoff index are summarized in Table 4. The staging results show that the two differ only by five days in the start date of the main flood season. According to the mean start date of the two main flood seasons and be determined as the start date of the main flood season in this study. Therefore, the final flood segmentation is adjusted as follows: the pre-flood season (12 April–29 May), the main flood season (30 May–3 September), and the post-flood season (4 September–9 November).
Table 2.
The segmentation by using rainfall as the index.
Table 3.
The segmentation by using runoff as the index.
Table 4.
The segmentation results with daily rainfall index and daily runoff index.
3.3. Reasonableness Test of the Segmentation Results
We aimed to compare the changes of the and before and after the flood segmentation to quantitatively analyze the reasonableness of the staging results. The percentage of each level of the and before and after flood segmentation are shown in Figure 4, Figure 5 and Figure 6. As illustrated in Figure 4, before the flood segmentation, more than 60% of the years show a significant seasonal characteristic and the and range from 0.40 to 0.59. Besides, no year indicates that the rainfall or runoff is evenly distributed during the flood season ( and ). For (Figure 4), after the flood segmentation, the values have significantly decreased. The percentage of the years with is 51%, 95%, and 73% in the three sub-flood periods, respectively. Moreover, the percentage of the years with is 15%, 40%, and 47% in the three sub-flood periods, respectively, implying that the segmentation of flood season has weakened the seasonal characteristics of rainfall. For (Figure 5), after the flood segmentation, the values have also significantly decreased, the percentage of the years with are 54%, 87%, and 85% in the three sub-flood periods, respectively. Moreover, the percentage of the years with are 11%, 23%, and 45% in the three sub-flood periods, respectively, implying that the segmentation of flood season has weakened the seasonal characteristics of runoff. In summary, the staging of the flood season allows the seasonal characteristics of rainfall and runoff to be reduced, resulting in a more uniform and consistent distribution of rainfall and runoff within each sub-flood season, so the staging results are reasonable.
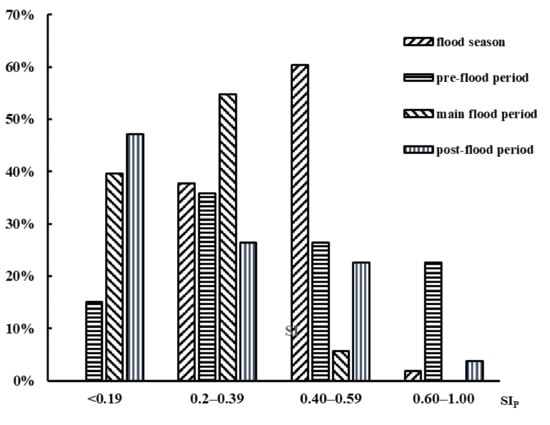
Figure 5.
Percentage of each level of the before and after the flood segmentation.
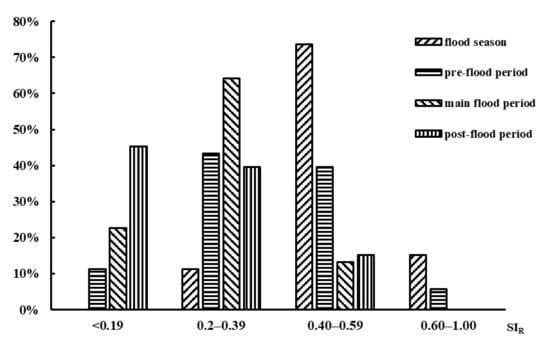
Figure 6.
Percentage of each level of the before and after the flood segmentation.
3.4. Frequency Analysis and the Design Flood Process Results
Equation (5) is used to calculate the empirical frequency of flood flow series in the pre-flood and post-flood periods of Longtan Reservoir. Equations (6) and (7) are used to calculate the empirical frequency of flood flow series in the main flood period. Using the hydrological frequency analysis software, the best theoretical frequency curve was obtained by appropriately adjusting Cv and Cs. The outcomes of the frequency analysis are concluded in Table 5. The mean value of the flood peak of the main flood season is 11,288 m3/s, which is larger than that of the pre-flood season (4211 m3/s) and that of the post-flood season (5569 m3/s). Besides, the parameter (0.34) and the parameter (0.67) of the main flood season are smaller than that of the pre-flood season (, ) and the post-flood season (, ), indicating that the flood peak of the main flood season is large in magnitude, small in dispersion and symmetrical in distribution. The parameters of the pre-flood season and the post-flood season are the same (0.58), indicating that there is little difference in the dispersion of the flood peaks during the pre-flood season and the post-flood season. Compared with the entire flood season (before segmentation), the mean flood peak of the main flood season (11,288 m3/s) is larger than that of the entire flood season (), indicating that the large magnitude floods are mainly distributed during the main flood season. However, the parameters of the main flood season and the entire flood season are the same (0.34), indicating that the dispersion of the floods in the main flood season remained the same after the flood staging. The parameters of the pre-flood season and the post-flood season are equal to 0.58, bigger than that of the entire flood season (0.34), implying that the dispersion of floods in the pre-flood and post-flood seasons becomes more significant. The of the main flood (0.67) is smaller than that of the entire flood season (), indicating the more symmetrical distribution of floods during the main flood after segmentation.
Table 5.
The results of the frequency analysis.
Finally, the 500-year and 10,000-year design flood hydrographs of the three sub-flood periods are derived by using the same ratio amplification method, and the results are shown in Figure 7, Figure 8 and Figure 9.
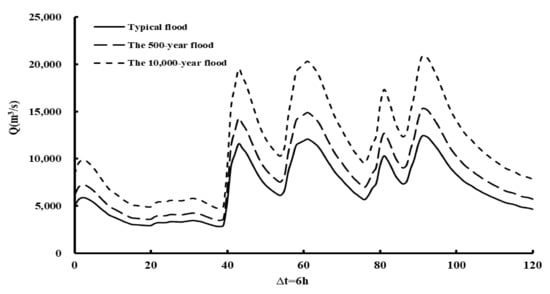
Figure 7.
Design flood hydrograph of the pre-flood period.
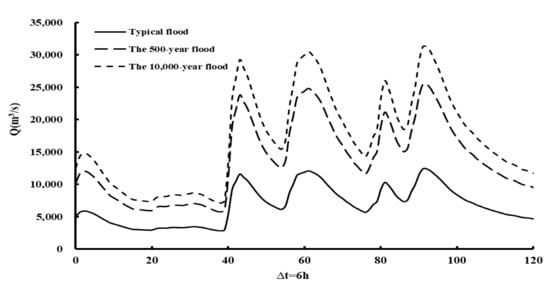
Figure 8.
Design flood hydrograph of the main flood period.
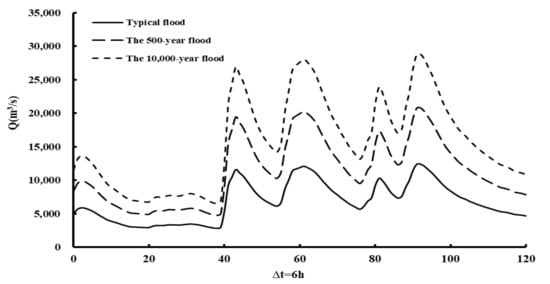
Figure 9.
Design flood hydrograph of the post-flood period.
3.5. The Optimization and Determination of FLWL
According to the comparison of the design flood results before and after the segmentation, it proves the necessity of FLWL optimization. As shown in Table 5, the flood peak flows of the 500-year and 10,000-year floods are 15,250 m3/s and 20,820 m3/s in the pre-flood period, which are equivalent to the original design results of the seven-year and 43-year floods. However, as suggested by Liu [55], taking into account the former flood period to vacate the reservoir capacity for the main flood period and the dry period less water and other factors, and raising the water level of the former flood season will increase the risk of water abandonment in the main flood period, so it is not practical to adjust (raise) the FLWL during the former flood period. The flood peak flows of the 500-year and 10,000-year floods are 25,462 m3/s and 31,267 m3/s in the main flood period, which are smaller than the design outcomes of the entire flood period (the 500-year design flood flow is 27,600 m3/s and the 10,000-year flood flow is 35,500 m3/s), indicating that increasing the FLWL of the main flood period is permissible. For the post-flood period, the peak flows of the 500-year and 10,000-year floods are 20,790 m3/s and 28,775 m3/s, which are equivalent to the 43-year and 714-year floods of the preliminary design results. Besides, the post-flood period is followed by a long dry season, so adjusting the FLWL in the post-flood season can fully utilize the reservoir volume and increase the profitability of the reservoir. Therefore, only the FLWLs of the main flood period and post-flood period are adjusted in this study, and the FLWL of the pre-flood period stays the same as the original value of 375.00 m.
The control condition for the routing of flood control is that the highest water level after the routing of flood control does not surpass the check flood level of the reservoir (381.84 m). With a step length of 0.5 m, the flood is regulated from 375 m, and the process of the routing of flood control is shown in Tables S2 and S3 in the Supplementary Material. Finally, as shown in Table 6, the FLWLs of the three sub flood periods are determined as 375.00 m, 377.05 m, and 378.45 m.
Table 6.
The results of routing of flood control.
4. Discussion
In this study, the fractal method is used to stage the flood season of Longtan Reservoir. The fractal method has good adaptability in the study of flood season staging [33,34] and compared with other traditional methods of flood season staging, such as the relative frequency RF method [56], the fractal method divides the flood season by statistical calculation rather than visual assessment, thus producing more objective results. The variable point-fuzzy method [57], vector statistics method and fuzzy set analysis method [58] have been applied to the flood season staging of Longtan Reservoir. Compared with the present study, the number of stages is the same, but the stage points are slightly different, as shown in Table 7. The reason for this is that the principles of the fractal method and the two research methods are different. The two methods are based on fuzzy theory. Thus, in determining the main flood period, there is a certain subjective error. The fractal method is based on a strong physical background to overcome this subjectivity [33]. Whereas the two studies only consider the impact of flow indicator, this study uses dual indicators of rainfall and runoff for flood staging. As stated by Xu, et al. [59] and Jiang, et al. [25], instead of a single indicator, multiple indices depicting flood seasonality should be considered when performing flood season division, therefore the segmentation results in this study should be more reasonable. In summary, the staging points are slightly different.
Table 7.
Comparison of the results of the fractal method with other research methods.
The innovation of this study is to use the to analyze the feasibility of flood staging and the reasonableness of the staging results from a quantitative point of view. Meanwhile, it proves the applicability of the fractal method in flood staging. However, it should be noted that the staging results obtained using the fractal method are still subject to the choice of hydrologic time scale and threshold level. In terms of the scientific significance of the overall study, especially in the case of global warming, such as tropical cyclones, temperate cyclones [57,60], and sea level rise [58], a series of climate changes lead to an increase in the frequency of mega-flood events and an increase in flood risk, which can be effectively reduced by formulating a reasonable flood phasing and FLWL optimization scheme, fully demonstrating that this study has solved the corresponding scientific problems. The impact of climate change on floods will continue in the future [61], so there are two key technical issues that need to be addressed in future research, namely the future climate change predictions and response predictions for future floods. The solution to the above two key questions will allow for proactive structural and non-structural flood control measures to reduce flood risk.
5. Conclusions
A reasonable flood season segmentation and adjustment of FLWL for a multi-purpose reservoir can help maximize flood resource use without increasing flood risk. This study first quantitatively analyzes the feasibility of flood staging for the Longtan Reservoir, then divides the flood season and verifies the reasonableness of the staging results, and finally adjusts the FLWL. In this way, the large amount of water wastage caused by the previous implementation of a single FLWL can be improved to some degree.
Some findings are as follows: (1) From 1960 to 2012, 60% and 74% of the years that the and the of the entire flood season range from 0.4 to 0.59, indicating that there are significant differences in the distribution of rainfall and runoff throughout the flood period. Therefore, it is essential to stage the flood period. (2) The entire flood period should be divided into the pre-flood period (12 April–29 May), the main flood period (30 May–3 September), and the post-flood period (4 September–9 November). (3) In the pre-flood, FLWL remains unchanged (375.00 m), whereas in the main flood and post-flood FLWL increased by 2.05 m (377.05 m) and 3.45 m (378.45 m), and the effective reservoir capacity increased by 5.810 billion m3 and 6.337 billion m3.
Supplementary Materials
The following supporting information can be downloaded at: https://www.mdpi.com/article/10.3390/w14050775/s1, Table S1: Peak discharge series in flood season of Longtan Reservoir; Table S2: The routing of flood control in the main flood season; Table S3: The routing of flood control in the post-flood season.
Author Contributions
Conceptualization, J.D. and Y.R.; Data curation, J.D. and X.L.; Formal analysis, J.D.; Funding acquisition, C.M. and Z.X.; Investigation, J.D. and S.L. (Shufeng Lai); Methodology, J.D. and Y.R.; Project administration, C.M. and Z.X.; Resources, J.D.; Software, J.D.; Supervision, G.S.; Validation, J.D. and Y.R.; Visualization, J.D.; Writing—original draft, J.D.; Writing—review & editing, G.S., X.L. and S.L. (Shufeng Lai). All authors have read and agreed to the published version of the manuscript.
Funding
This research was funded by the Natural Science Foundation of China, grant number 51969004 and 51979038; the National Key Research and Development Program of China, grant number 2017YFC0406004; the Guangxi Natural Science Foundation of China, grant number 2017GXNSFAA198361.
Institutional Review Board Statement
Not applicable.
Informed Consent Statement
Not applicable.
Data Availability Statement
Some or all data, models, or code generated or used during this reserch are proprietary or confidential in nature and may only be provided with restrictions. We will conduct further research on this aspect in the future. The existing research data will be gradually developed in the subsequent papers, and it is only temporarily confidential at present.
Conflicts of Interest
The authors declare no conflict of interest.
References
- Arnell, N.W.; Gosling, S.N. The impacts of climate change on river flood risk at the global scale. Clim. Chang. 2016, 134, 387–401. [Google Scholar] [CrossRef] [Green Version]
- Milly, P.; Wetherald, R.T.; Dunne, K.A.; Delworth, T.L. Increasing risk of great floods in a changing climate. Nature 2002, 415, 514–517. [Google Scholar] [CrossRef] [PubMed]
- Nie, Y.; Liu, Q.; Wang, J.; Zhang, Y.; Sheng, Y.; Liu, S. An inventory of historical glacial lake outburst floods in the Himalayas based on remote sensing observations and geomorphological analysis. Geomorphology 2018, 308, 91–106. [Google Scholar] [CrossRef]
- Bajracharya, S.R.; Mool, P. Glaciers, glacial lakes and glacial lake outburst floods in the Mount Everest region, Nepal. Ann. Glaciol. 2009, 50, 81–86. [Google Scholar] [CrossRef] [Green Version]
- Ives, J.D.; Shrestha, R.B.; Mool, P.K. Formation of Glacial Lakes in the Hindu Kush-Himalayas and GLOF Risk Assessment; ICIMOD: Patan, Nepal, 2010. [Google Scholar]
- Wang, S.J.; Zhang, T. Glacial lakes change and current status in the central Chinese Himalayas from 1990 to 2010. J. Appl. Remote Sens. 2013, 7, 073459. [Google Scholar] [CrossRef]
- Chen, H.E. Evolution of flood defense strategies: Toward nature-based solutions. Environments 2021, 9, 2. [Google Scholar]
- Eckart, K.; McPhee, Z.; Bolisetti, T. Performance and implementation of low impact development—A review. Sci. Total Environ. 2017, 607/608, 413–432. [Google Scholar] [CrossRef]
- Jackisch, N.; Weiler, M. The hydrologic outcome of a Low Impact Development (LID) site including superposition with streamflow peaks. Urban Water J. 2015, 14, 143–159. [Google Scholar] [CrossRef]
- Gimenez-Maranges, M.; Breuste, J.; Hof, A. A new analytical tool for a more deliberate implementation of Sustainable Drainage Systems. Sustain. Cities Soc. 2021, 71, 102955. [Google Scholar] [CrossRef]
- Hellmers, S.; Manojlovic, N.; Palmaricciotti, G.; Kurzbach, S.; Fröhle, P. Multiple linked sustainable drainage systems in hydrological modelling for urban drainage and flood risk management. J. Flood Risk Manag. 2015, 11, 6660–6667. [Google Scholar] [CrossRef]
- Elborolosy, Y.; Cataldo, J. NYCDEP green infrastructure. In Proceedings of the International Low Impact Development Conference 2020, Bethesda, MD, USA, 20–24 July 2020. [Google Scholar]
- Yamashita, S.; Watanabe, R.; Shimatani, Y. Smart adaptation activities and measures against urban flood disasters. Sustainable Cities Soc. 2016, 27, 175–184. [Google Scholar] [CrossRef]
- Taura, F.; Ohme, M.; Shimatani, Y. Collaborative development of green infrastructure: Urban flood control measures on small-scale private lands. J. Disaster Res. 2021, 16, 457–468. [Google Scholar] [CrossRef]
- Xiong, H.; Sun, Y.; Ren, X. Comprehensive assessment of water sensitive urban design practices based on multi-criteria decision analysis via a case study of the University of Melbourne, Australia. Water 2020, 12, 2885. [Google Scholar] [CrossRef]
- Radcliffe, J.C.; Page, D.; Naumann, B.; Dillon, P. Fifty years of water sensitive urban design, Salisbury, South Australia. Environ. Sci. Eng. Front. 2017, 11, 7. [Google Scholar] [CrossRef]
- Hall, J.W.; Harvey, H.; Manning, L.J. Adaptation thresholds and pathways for tidal flood risk management in London. Clim. Risk Manag. 2019, 24, 42–58. [Google Scholar] [CrossRef]
- Adnan, M.; Talchabhadel, R.; Nakagawa, H.; Hall, J.W. The potential of Tidal River Management for flood alleviation in South Western Bangladesh. Sci. Total Environ. 2020, 731, 138747. [Google Scholar] [CrossRef]
- Muller, M.; Biswas, A.; Martin-Hurtado, R.; Tortajada, C. Built infrastructure is essential. Science 2015, 349, 585–586. [Google Scholar] [CrossRef]
- Pan, L.; Lla, B.; Sga, B.; Lxa, B.; Wang, Z.; Jza, B.; Cyxa, C. Optimal design of seasonal flood limited water levels and its application for the Three Gorges Reservoir. J. Hydrol. 2015, 527, 1045–1053. [Google Scholar]
- Ding, W.; Zhang, C.; Peng, Y.; Zeng, R.; Zhou, H.; Cai, X. An analytical framework for flood water conservation considering forecast uncertainty and acceptable risk. Water Resour. Res. 2015, 51, 4702–4726. [Google Scholar] [CrossRef]
- Wang, Z.; Wu, J.; Cheng, L.; Liu, K.; Wei, Y.M. Regional flood risk assessment via coupled fuzzy c-means clustering methods: An empirical analysis from China’s Huaihe River Basin. Nat. Hazards J. Int. Soc. Prev. Mitig. Nat. Hazards 2018, 93, 803–822. [Google Scholar] [CrossRef]
- Hu, J.L. Reservoir Flood Staging and Flood Limit Level Studies. Ph.D. Thesis, Huazhong Normal University, Wuhan, China, 2015. [Google Scholar]
- Jia, M.; Mu, X.F. Application of fuzzy sets analysis method in staging flood season of reservoir. J. Water Resour. Water Eng. 2015, 26, 178–181. [Google Scholar] [CrossRef]
- Jiang, H.; Wang, Z.Z.; Ye, A.L.; Liu, K.L.; Wang, L.H. Hydrological characteristic-based methodology for dividing flood seasons: An empirical analysis from China. Environ. Earth Sci. 2019, 78, 399. [Google Scholar] [CrossRef]
- Liu, P.; Guo, S.L.; Xiong, L.H.; Chen, L. Flood season segmentation based on the probability change-point analysis technique. Hydrol. Sci. J. 2010, 55, 540–554. [Google Scholar] [CrossRef]
- Wang, H.; Xiao, W.; Wang, J.; Wang, Y.; Huang, Y.; Hou, B.; Lu, C. The impact of climate change on the duration and division of flood season in the Fenhe River Basin, China. Water 2016, 8, 105. [Google Scholar] [CrossRef] [Green Version]
- Xu, Y.M.; Niu, X.L. Study on the influence of different domains on flood season division based on improved optimal dissection method. Hydroelectricity 2019, 45, 19–22+116. [Google Scholar]
- Mo, C.X.; Mo, G.Y.; Liu, P.; Zhong, H.H.; Jin, J.L. Reservoir operation by staging due to climate variability. Hydrol. Ences J. 2018, 63, 926–937. [Google Scholar] [CrossRef]
- Jiang, H.; Yu, Z.B.; Mo, C.X. Reservoir flood season segmentation and optimal operation of flood-limiting water levels. J. Hydrol. Eng. 2014, 20, 05014035. [Google Scholar] [CrossRef]
- Jiang, H.; Yu, Z.B.; Mo, C.X. Ensemble method for reservoir flood season segmentation. J. Water Resour. Plan. Manag. 2016, 143, 04016079. [Google Scholar] [CrossRef]
- Feng, X.; Guo, S.L.; Chen, L.; Chang, F.J.; Zhong, Y.X.; Liu, P. Identification of flood seasonality using an entropy-based method. Stochastic Environ. Res. Risk Assess. 2018, 32, 3021–3035. [Google Scholar] [CrossRef]
- Fang, C.H.; Guo, S.L.; Duong, D.D. Two new approaches to dividing flood sub-seasons in flood season using the fractal theory. Chin. Sci. Bull. 2010, 55, 105–110. [Google Scholar] [CrossRef]
- Jia-Gen, D.; Wang, Z.-Y.; Wen, Y.-H. Research on the seasonal period classification of Taihu basin floods based on fractal theory. China Rural Water Hydropower 2015, 2, 118–122. [Google Scholar]
- Bi, Y.J. Study on flood water level design of Fenhe Reservoir by stages. Water Resour. Dev. Manag. 2018, 24–27+12. [Google Scholar]
- Sumner, G.; Homar, V.; Ramis, C. Precipitation seasonality in eastern and southern coastal Spain. Int. J. Climatol. 2001, 21, 219–247. [Google Scholar] [CrossRef]
- Zhang, J.; He, J.S.; Liu, D. The determination of seasonal flood control limited water level of Dahuofang reservoir. China Sci. Pap. 2015, 851–854. [Google Scholar]
- Huang, X.F.; Chen, Y.G.; Lin, J.; Fang, G.H.; Qu, X.P.; Zhu, L.X. Research on benefit of reservoir flood resources utilization based on the dynamic control of limited water level. Desalin. Water Treat. 2017, 79, 214–220. [Google Scholar] [CrossRef] [Green Version]
- Tang, W.; Ren, L.; Xu, H.; Hu, B.; Ding, Z.; Nie, W. Study on the control method of flood limited water level in Danjiangkou reservoir. Adv. Mater. Res. 2013, 830, 376–383. [Google Scholar] [CrossRef]
- Wang, Y.; Guo, S.L.; Yang, G.; Hong, X.J.; Hu, T. Optimal early refill rules for Danjiangkou Reservoir. Water Sci. Water Eng. 2014, 16, 419. [Google Scholar]
- Chang, J.X.; Guo, A.J.; Du, H.H.; Wang, Y.M. Floodwater utilization for cascade reservoirs based on dynamic control of seasonal flood control limit levels. Environ. Earth. Sci. 2017, 76, 260. [Google Scholar] [CrossRef]
- Wang, W.S.; Yao, R.H.; Qin, G.W.; Liang, S.Q.; Ding, J. Direct derivation of pipe floods conditional on flood staging. Eng. Sci. Technol. 2019, 51, 75–82. [Google Scholar]
- Yin, J.B.; Guo, S.L.; Liu, Z.J.; Chen, K.B.; Chang, F.-J.; Xiong, F. Bivariate seasonal design flood estimation based on copulas. J. Hydrol. Eng. 2017, 22, 05017028. [Google Scholar] [CrossRef] [Green Version]
- Zhu, L.X.; Huang, X.F.; Liu, X.M.; Jia, C.X. Seasonal limited water level control of reservoir based on flood utilization. In Proceedings of the International Conference on Mechatronics, Shenyang, China, 1–3 April 2015. [Google Scholar]
- Liu, X.Y.; Zhu, Y.H.; Guo, X.H.; Qu, G. Comparative research on multi-objective optimization algorithms for optimal reservoir operation. J. Changjiang Acad. Sci. 2015, 32, 9–14. [Google Scholar]
- Ouyang, S.; Zhou, J.Z.; Li, C.L.; Liao, X.; Wang, H. Optimal design for flood limit water level of cascade reservoirs. Water Resour. Manag. 2015, 29, 445–457. [Google Scholar] [CrossRef]
- Zhang, M.-J.; Guo, J.-L.; Lin, W.; Guo, J.; Shu, Z.-K.; LI, Y.-H.; Zhang, J.-W. The impacts of climate change on hydrologic seasonal shift: Taking flood season division and extreme precipitation as examples. Clim. Chang. Res. 2019, 15, 158–166. [Google Scholar]
- Guojin, C.D.L. Discussion on key issues about reservoir flood season by stages. Heilongjiang Hydraul. Sci. Technol. 2018, 46, 129–131. [Google Scholar] [CrossRef]
- Mondol, M.A.H.; Jang, D.H. Seasonality analysis on high- and low-rainfall regions in bangladesh using precipitation concentration index. J. Clim. Res. 2017, 12, 215–226. [Google Scholar] [CrossRef]
- Li, T.; Zhang, Y. Considering abrupt change in rainfall for flood season division: A case study of the Zhangjia Zhuang Reservoir, based on a new model. Water 2018, 10, 1152. [Google Scholar]
- Walsh, R.P.D.; Lawler, D.M. Rainfall seasonality: Description, spatial patterns and change through time. Weather 1981, 36, 201–208. [Google Scholar] [CrossRef]
- Mandelbrot, B.B.; Aizenman, M. Fractals: Form, chance, and dimension. Phys. Today 1979, 32, 65–66. [Google Scholar] [CrossRef]
- MWR (2006). Regulation for calculating design flood of water resources and hydropower projects (SL 2006). Beijing. Available online: https://max.book118.com/html/2017/0807/126477681.shtm (accessed on 23 January 2022).
- Qian, J.L.; Zheng, M.S. Flood staging study. China Rural Water Hydropower 2012, 89–90, 97. [Google Scholar]
- Liu, L. Flood Season Staging Operation Research of Longtan Reservoir based on Change- Point and Fuzzy Theory. Ph.D. Thesis, Guangxi University, Guangxi, China, 2015. [Google Scholar]
- Black, A.R.; Werritty, A. Seasonality of flooding: A case study of North Britain. J. Hydrol. 1997, 195, 1–25. [Google Scholar] [CrossRef]
- Catalano, A.J.; Broccoli, A.J. Synoptic characteristics of surge-producing extratropical cyclones along the northeast coast of the United States. J. Appl. Meteorol. Climatol. 2018, 51, 1. [Google Scholar] [CrossRef]
- Marsooli, R.; Lin, N. Impacts of climate change on hurricane flood hazards in Jamaica Bay, New York. Clim. Chang. 2020, 163, 1–19. [Google Scholar] [CrossRef]
- Xu, D.M.; Wang, W.C.; Qiu, L.; Li, Y.H. The lnfluence of different types of indicators for the staging on flood season of reservoir based on. J. Basic Sci. Eng. 2016, 24, 429–441. [Google Scholar] [CrossRef]
- Catalano, A.J.; Broccoli, A.J.; Kapnick, S.B.; Janoski, T.P. High-impact extratropical cyclones along the northeast coast of the United States in a long coupled climate model simulation. J. Clim. 2019, 32, 7. [Google Scholar] [CrossRef]
- Fan, X.; Qin, Y.Y.; Gao, X. Interpretation of the main conclusions and suggestions of lPCC AR6 working group I report. Environ. Prot. 2021, 49, 44–48. [Google Scholar] [CrossRef]
Publisher’s Note: MDPI stays neutral with regard to jurisdictional claims in published maps and institutional affiliations. |
© 2022 by the authors. Licensee MDPI, Basel, Switzerland. This article is an open access article distributed under the terms and conditions of the Creative Commons Attribution (CC BY) license (https://creativecommons.org/licenses/by/4.0/).