1. Introduction
Dissolving oxygen in water (aeration) is one of the most energy intensive steps in water and wastewater treatment plants (WWTPs). For example, approximately 54 to 67% of the total energy consumption in WWTPs is used for the aeration of their activated sludge processes to oxidize and remove organic matter (COD) and ammonia (NH
3) [
1,
2,
3]. Current aeration technologies applied in large scale for water and wastewater treatment plants range from mixers and impellers to macroscopic orifices or porous materials whose main purpose is to transfer oxygen to a liquid medium [
4,
5]. Depending on the method, different issues can arise. Fine-pore diffusers suffer from fouling or decrease in aeration efficiency due to scaling and clogging of pores. On the other hand, with coarse-bubble surface aerators and impellers more energy is required to transfer O
2 to the liquid media [
2].
In industrial processes often swirling flows with highly turbulent liquid–gas interfaces are applied; they overcome some of these disadvantages. Several studies have been performed to understand and characterize the mass transfer across such two-phase interfaces. For example, Duinmeijer et al. [
4] used three-dimensional stereo particle image velocimetry to measure the velocity field in the vicinity of the free surface and to investigate the validity of the analytic Burgers vortex model. Kimura et al. [
5], Cristofano et al. [
6], Putra and Lucas [
7] investigated mass transport across the free surface of hydraulic intakes for several applications using numerical analysis and experimental setups. Invisible to the outside observer, there are intricate flow patterns beneath the surface, which only have been recently investigated [
8]. These flow patterns are to some extent comparable to so-called “Taylor–Couette” flows, which allow enhanced heat and mass transfer.
In the present work we investigate whether the mass transfer can be further enhanced when swirling flows with liquid–gas interfaces are constrained in a hyperbolic funnel. For example, it has been reported that utilizing a free-surface vortex in a shower head might result in ≈14% lower water consumption while maintaining the shower comfort, higher amounts of oxygen dissolved, and a favourable change in pH if a hyperbolically shaped funnel is used [
9]. In this type of funnel, which was first suggested by Schauberger [
10], the liquid–gas interface can extend from the top of the funnel all the way to the outlet, resembling a helix or standing wave pattern. It has been hypothesized [
10] that a constrained vortex in a hyperbolic funnel can yield extraordinary aeration capabilities. In the present work we have tested this hypothesis by measuring the dissolved oxygen in water after it has been drained in a swirling motion through a hyperbolic funnel. We experimentally observe different liquid–gas interface topologies over a range of mass flow rates, where the highest aeration efficiency is achieved for intermediate mass flows with large liquid– gas interfacial areas. These aeration systems are well defined, highly controllable and extremely efficient aeration systems, with the potential to supersede currently commercially available technologies.
2. Setup and Experimental Methods
The experimental setup with the funnel is shown in
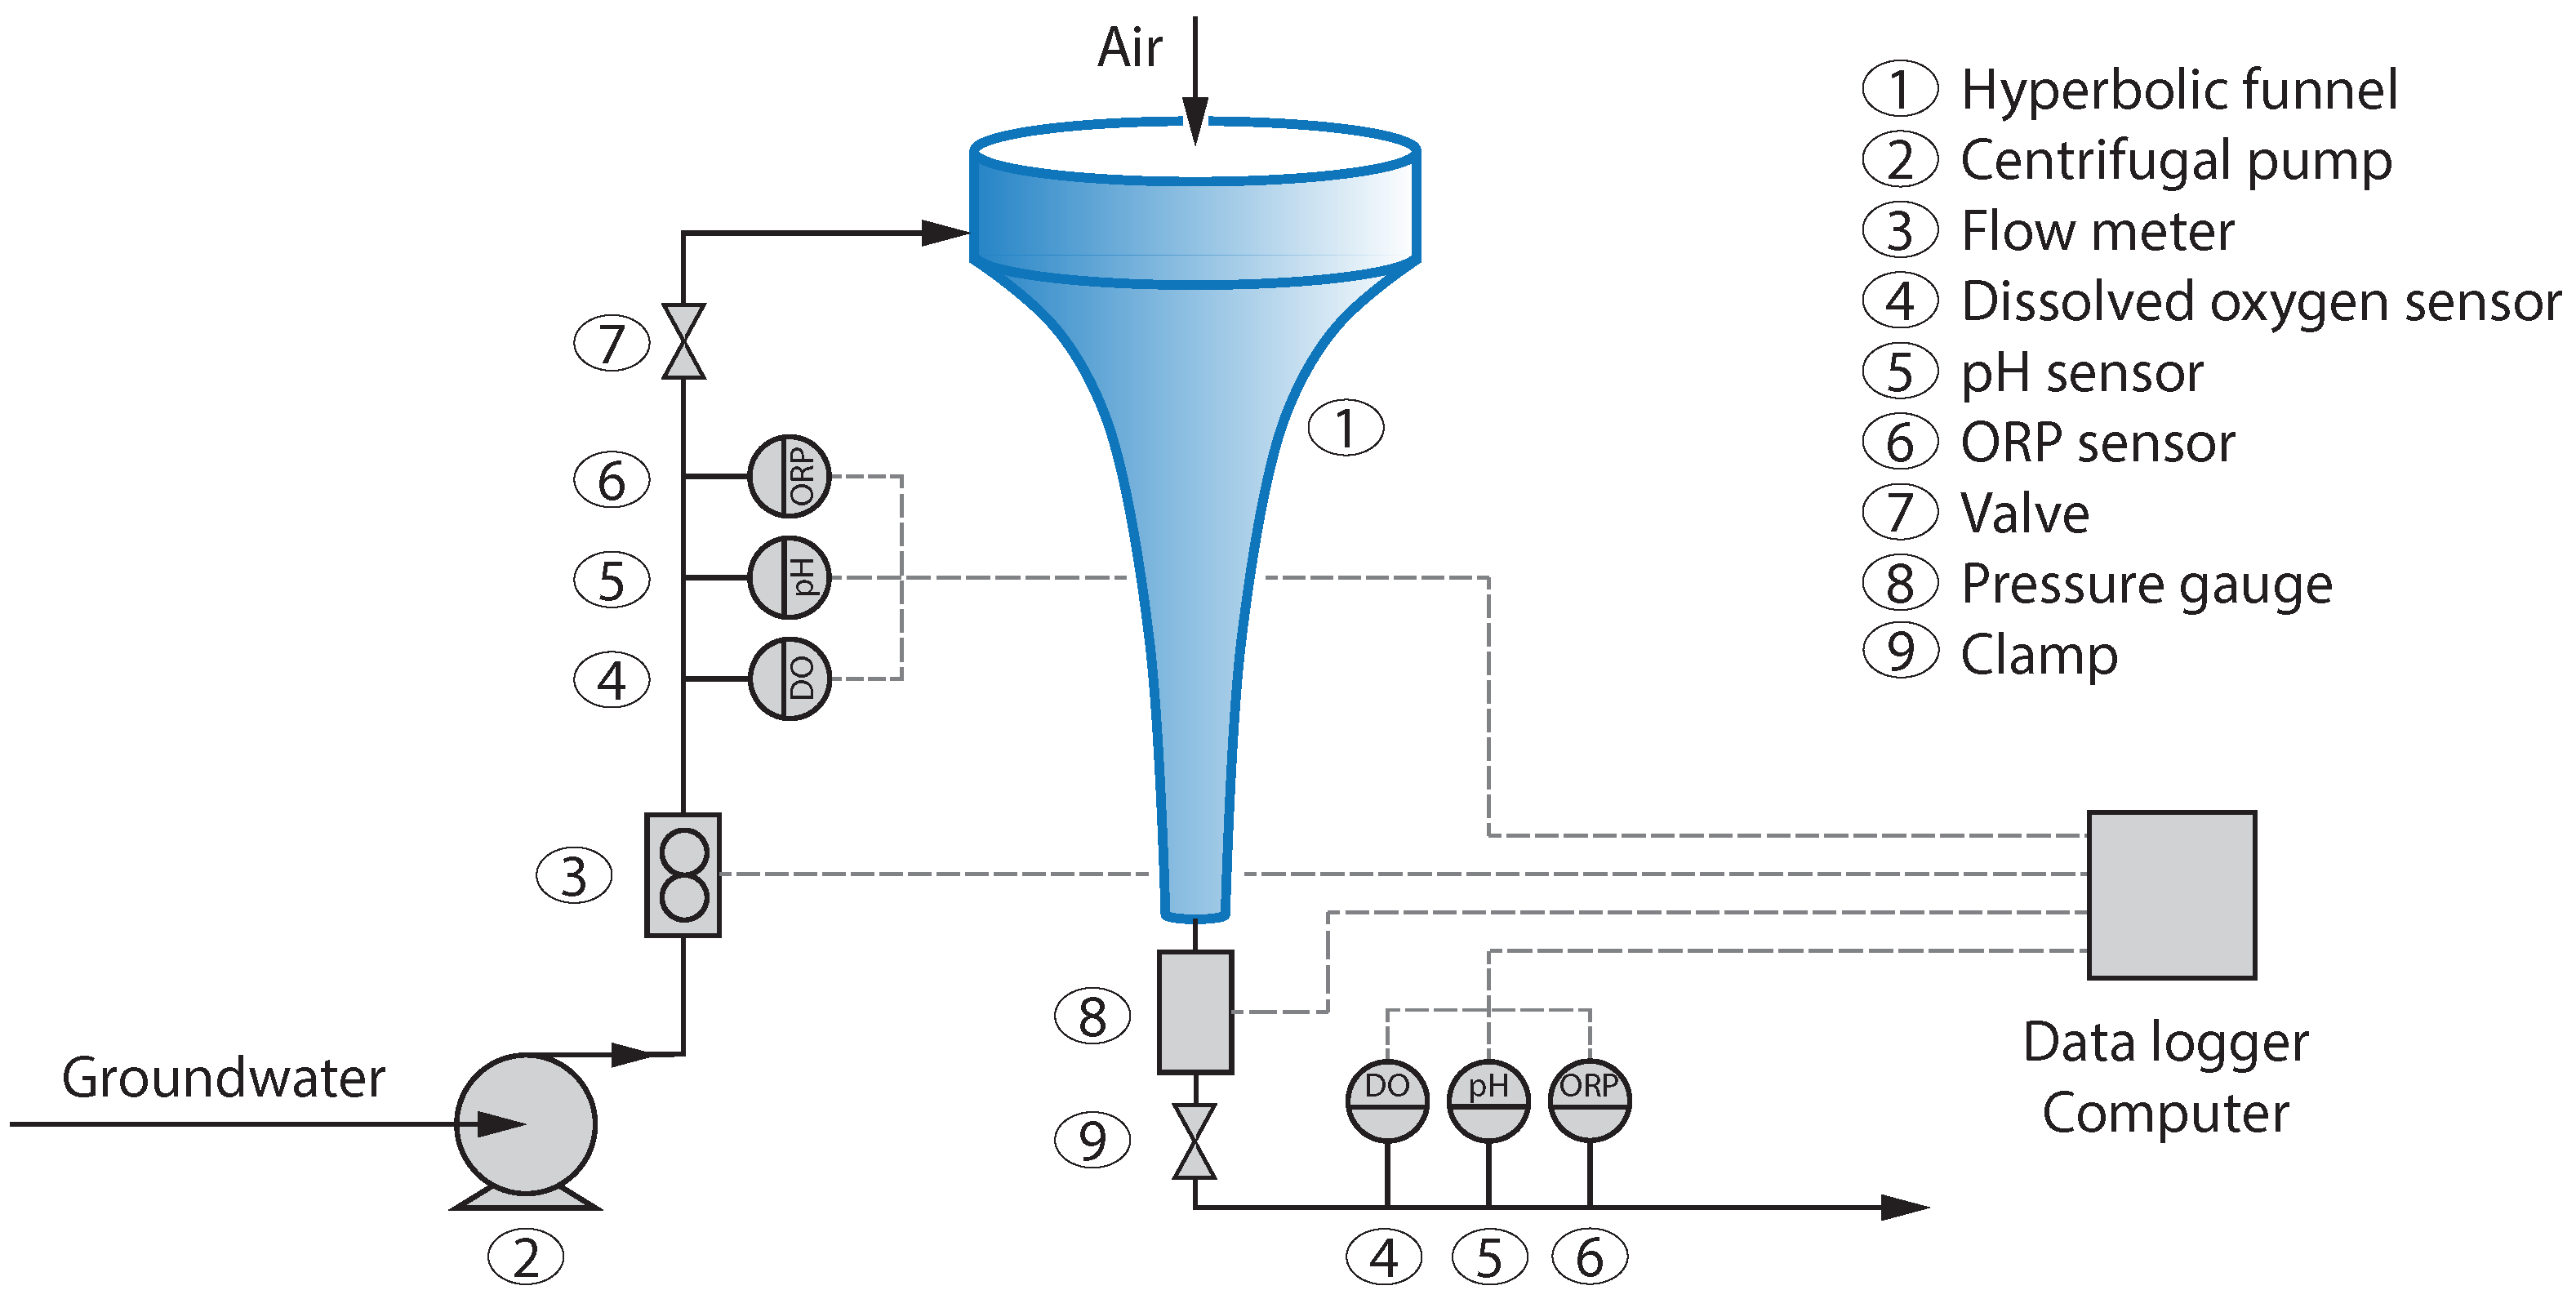
Figure 1. The funnel (1) is 94 cm long, has a 30 cm top diameter and a 1.6 cm outlet diameter. On top of the funnel, a glass cylinder (same diameter and 12 cm high) was placed. The water was pumped in the funnel from a ground water well via an inlet port located at the funnel top cylinder. The inlet is engineered such to ensure that the water enters the system tangentially, thus creating a swirl necessary to form the vortex. At the inlet, a flow meter (3, Endress & Hauser Picomag DMA25) was installed to verify the mass flow rate entering the system. Three different parameters were measured at the inlet and outlet: Dissolved oxygen (4, PreSens PSt3 Sensor), pH (5, Endress & Hauser memosens orbisint CPS11D) and redox potential (6, Endress & Hauser memosens orbisint CPS12D). An inlet ball valve (7) and an outlet clamp (9) were installed to balance the mass flow rate to obtain different operating regimes. Upstream of the outlet clamp, a pressure sensor (8, Endress & Hauser Cerabar T PMC131) was installed to verify the system outlet pressure.
The glass structure of the funnel made it possible to visualize the shape of the air–liquid interface. Depending on the operating conditions, three different liquid–air interface shapes were identified, for which the system’s aeration capability was investigated. Each regime was stabilized by controlling the flow inlet and outlet parameters. An outlet dissolved oxygen sensor was used to verify a steady state condition (constant dissolved oxygen concentration). Then dissolved oxygen (DO), pH and redox potential were recorded for 20 min at both inlet and outlet. All the tests were repeated four times, with at least 400 data points per test. The liquid volume was estimated optically assuming rotational symmetry of the hyperboloid with a systematic error of up to ≈5% depending on the flow regime. This calculation was done by first estimating the volume of the air core by digitizing the air/water interface and revolving the obtained curvature around its vertical axis. Since the total inner volume of the system is given by the geometry of the funnel, the liquid volume can be calculated by subtracting the air core from the total volume. The water used for the experiments was ground water. It was analyzed prior to the experiments; the results are summarized in
Table 1. Most important characteristics of this water are a low initial oxygen concentration, a relatively high concentration of iron (4.6 mg/L) and a stable pH (6.9).
3. Results
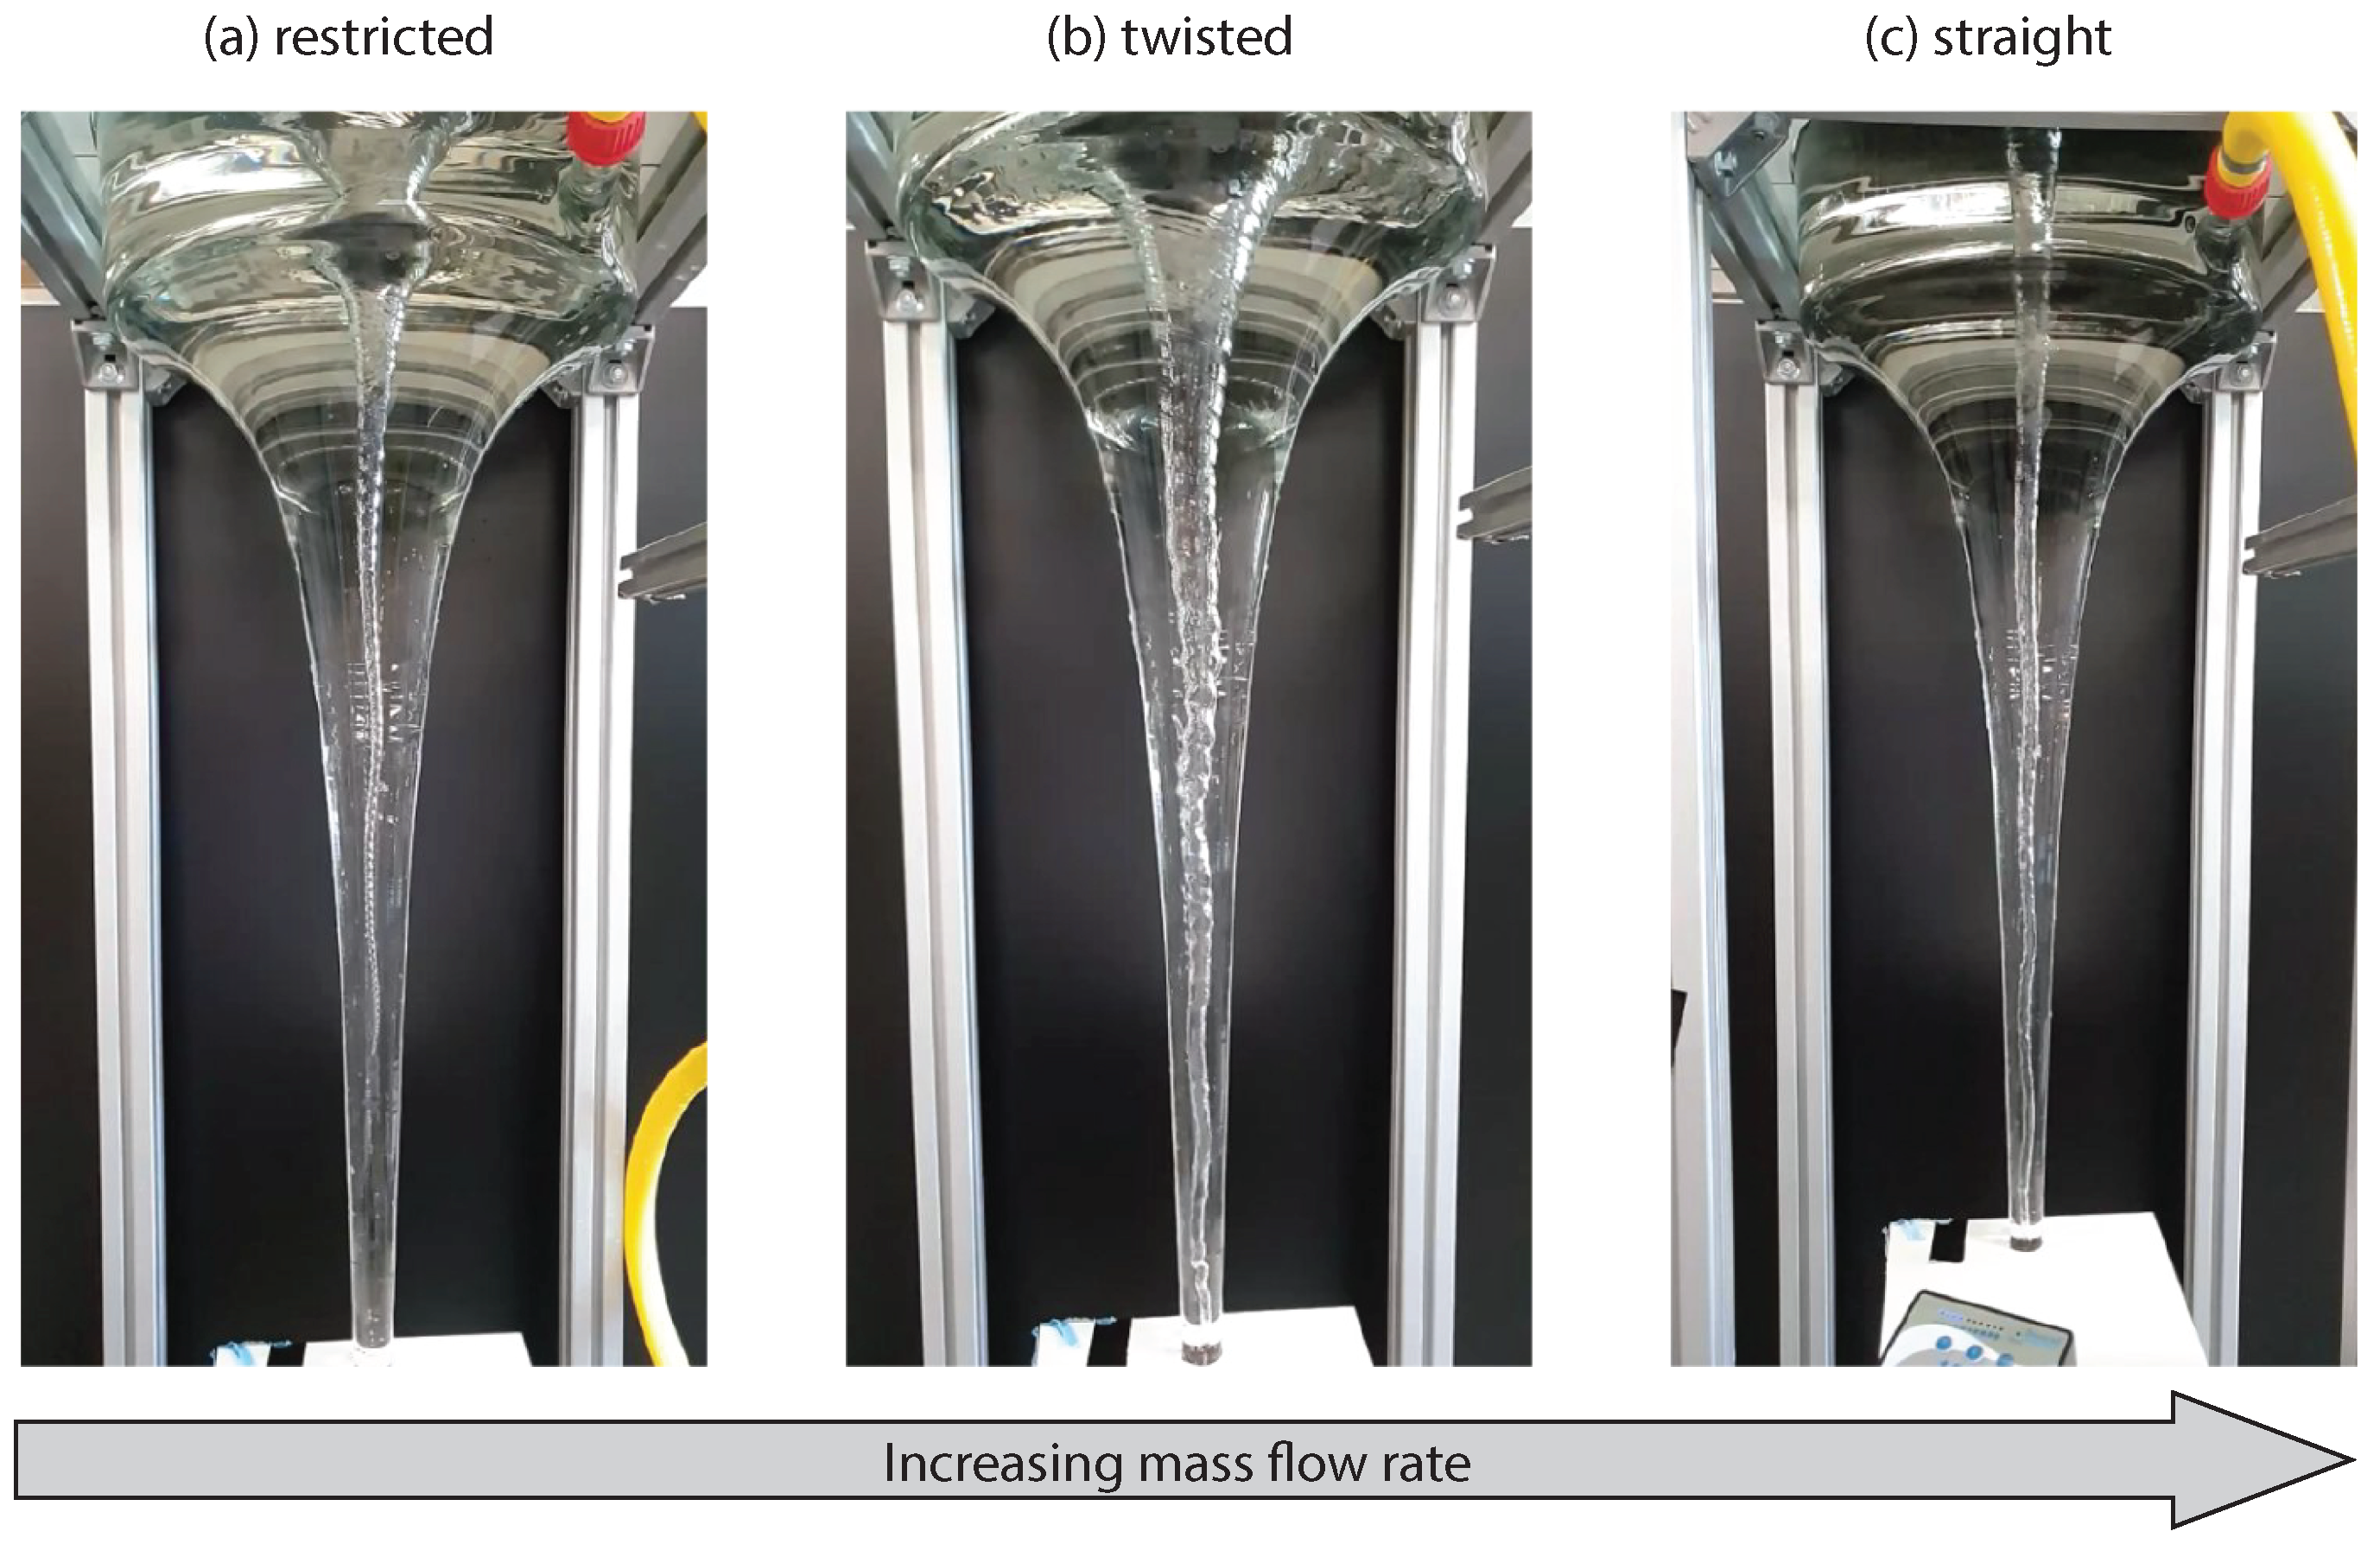
Depending on the mass flow rate through the funnel three types of regimes could be observed which are characterized by distinctively different shapes of the liquid–air interfaces as shown in
Figure 2. The
restricted regime (
Figure 2a) received its denomination due to the fact that a small outlet pressure of around 70 mbar was applied by constricting the outlet tubing. Its surface to volume ratio is low, since the air core does not extend until the outlet. It stops somewhere mid-way and breaks-up into bubbles which float downstream towards the funnel exit (see
Figure 2a). The restricted regime forms when the inlet flow is stabilized at approximately 15 L/min. The largest interface to volume ratio is created in the so called
twisted regime (
Figure 2b). This regime is obtained when no constriction is applied to the outlet valve and the inlet flow is stabilized at approximately 20 L/min. This regime is characterized by a large air volume (around 51% of the total system volume). Another characteristic observed for this regime is the formation of a double helix shaped interface (also seen in
Figure 2b). In the
straight regime (
Figure 2c) the interface to volume ratio is much smaller, around 94% of the total funnel volume is occupied by water. It occurs when the flow is stabilized at approximately 22 L/min and no restriction is applied to the system outlet. In this regime the interface is rather smooth (no double helix shape observed) and it extends until the system outlet.
Table 2 summarizes the different characteristics of each regime regarding their flow rate and outlet pressure. The air volume for each situation was calculated from a visual analysis of the interfaces assuming rotational symmetry. The hydraulic retention time (HRT) was determined by applying tracer technology. A pulse of tracer medium (NaOH, 1 M) was injected at the funnel inlet (
) on fixed time intervals. A short increase in concentration of the tracer was then measured at the funnel outlet using the pH sensor shown in
Figure 1 while leaving the system, resulting in an averaged residence time for each pulse. The mean residence time distribution for each pulse was calculated as
with
t being the mean residence time and
the concentration of tracer medium in mg/L. The mean residence times of the tracers are equivalent to the HRTs. For each flow regime, these values were compared to and verified by estimated HRTs based on visual analysis. As it can be seen from
Table 2 the system has a relatively low HRT. Interestingly, the twisted regime shows the lowest residence times, indicating a delicate force balance between gravitational, centrifugal and friction forces for different mass flow rates. It appears that at intermediate mass flow rates, the swirl and, accordingly, the centrifugal force decrease. Because of the inclined funnel wall, this further results in a lower upward pointing axial force at the funnel wall and thus in lower residence times.
The measurements of the DO allows the calculation of the oxygen volumetric mass transfer coefficient (
) at 13
C and the standard oxygen transfer rate (SOTR), defined as the rate at which the oxygen is transferred in tap water at 20
C and zero DO. The oxygen transfer rate, defined as the product of the volumetric mass transfer coefficient
(1/h) and a concentration gradient acting as the driving force, is given as [
11]
with
being the oxygen saturation concentration and
C the actual oxygen concentration in the liquid, both in mg/L. Moreover, the oxygen transfer rate can also be expressed using the oxygen mass balance equation of the overall system, namely as
with
being the flow rate (L/h) and
V the volume (in L) of the liquid contained in the system. Combining Equations (
2) and (
3), we can then calculate the volumetric mass transfer coefficient as
which can be easily obtained by the measured quantities during the experiments.
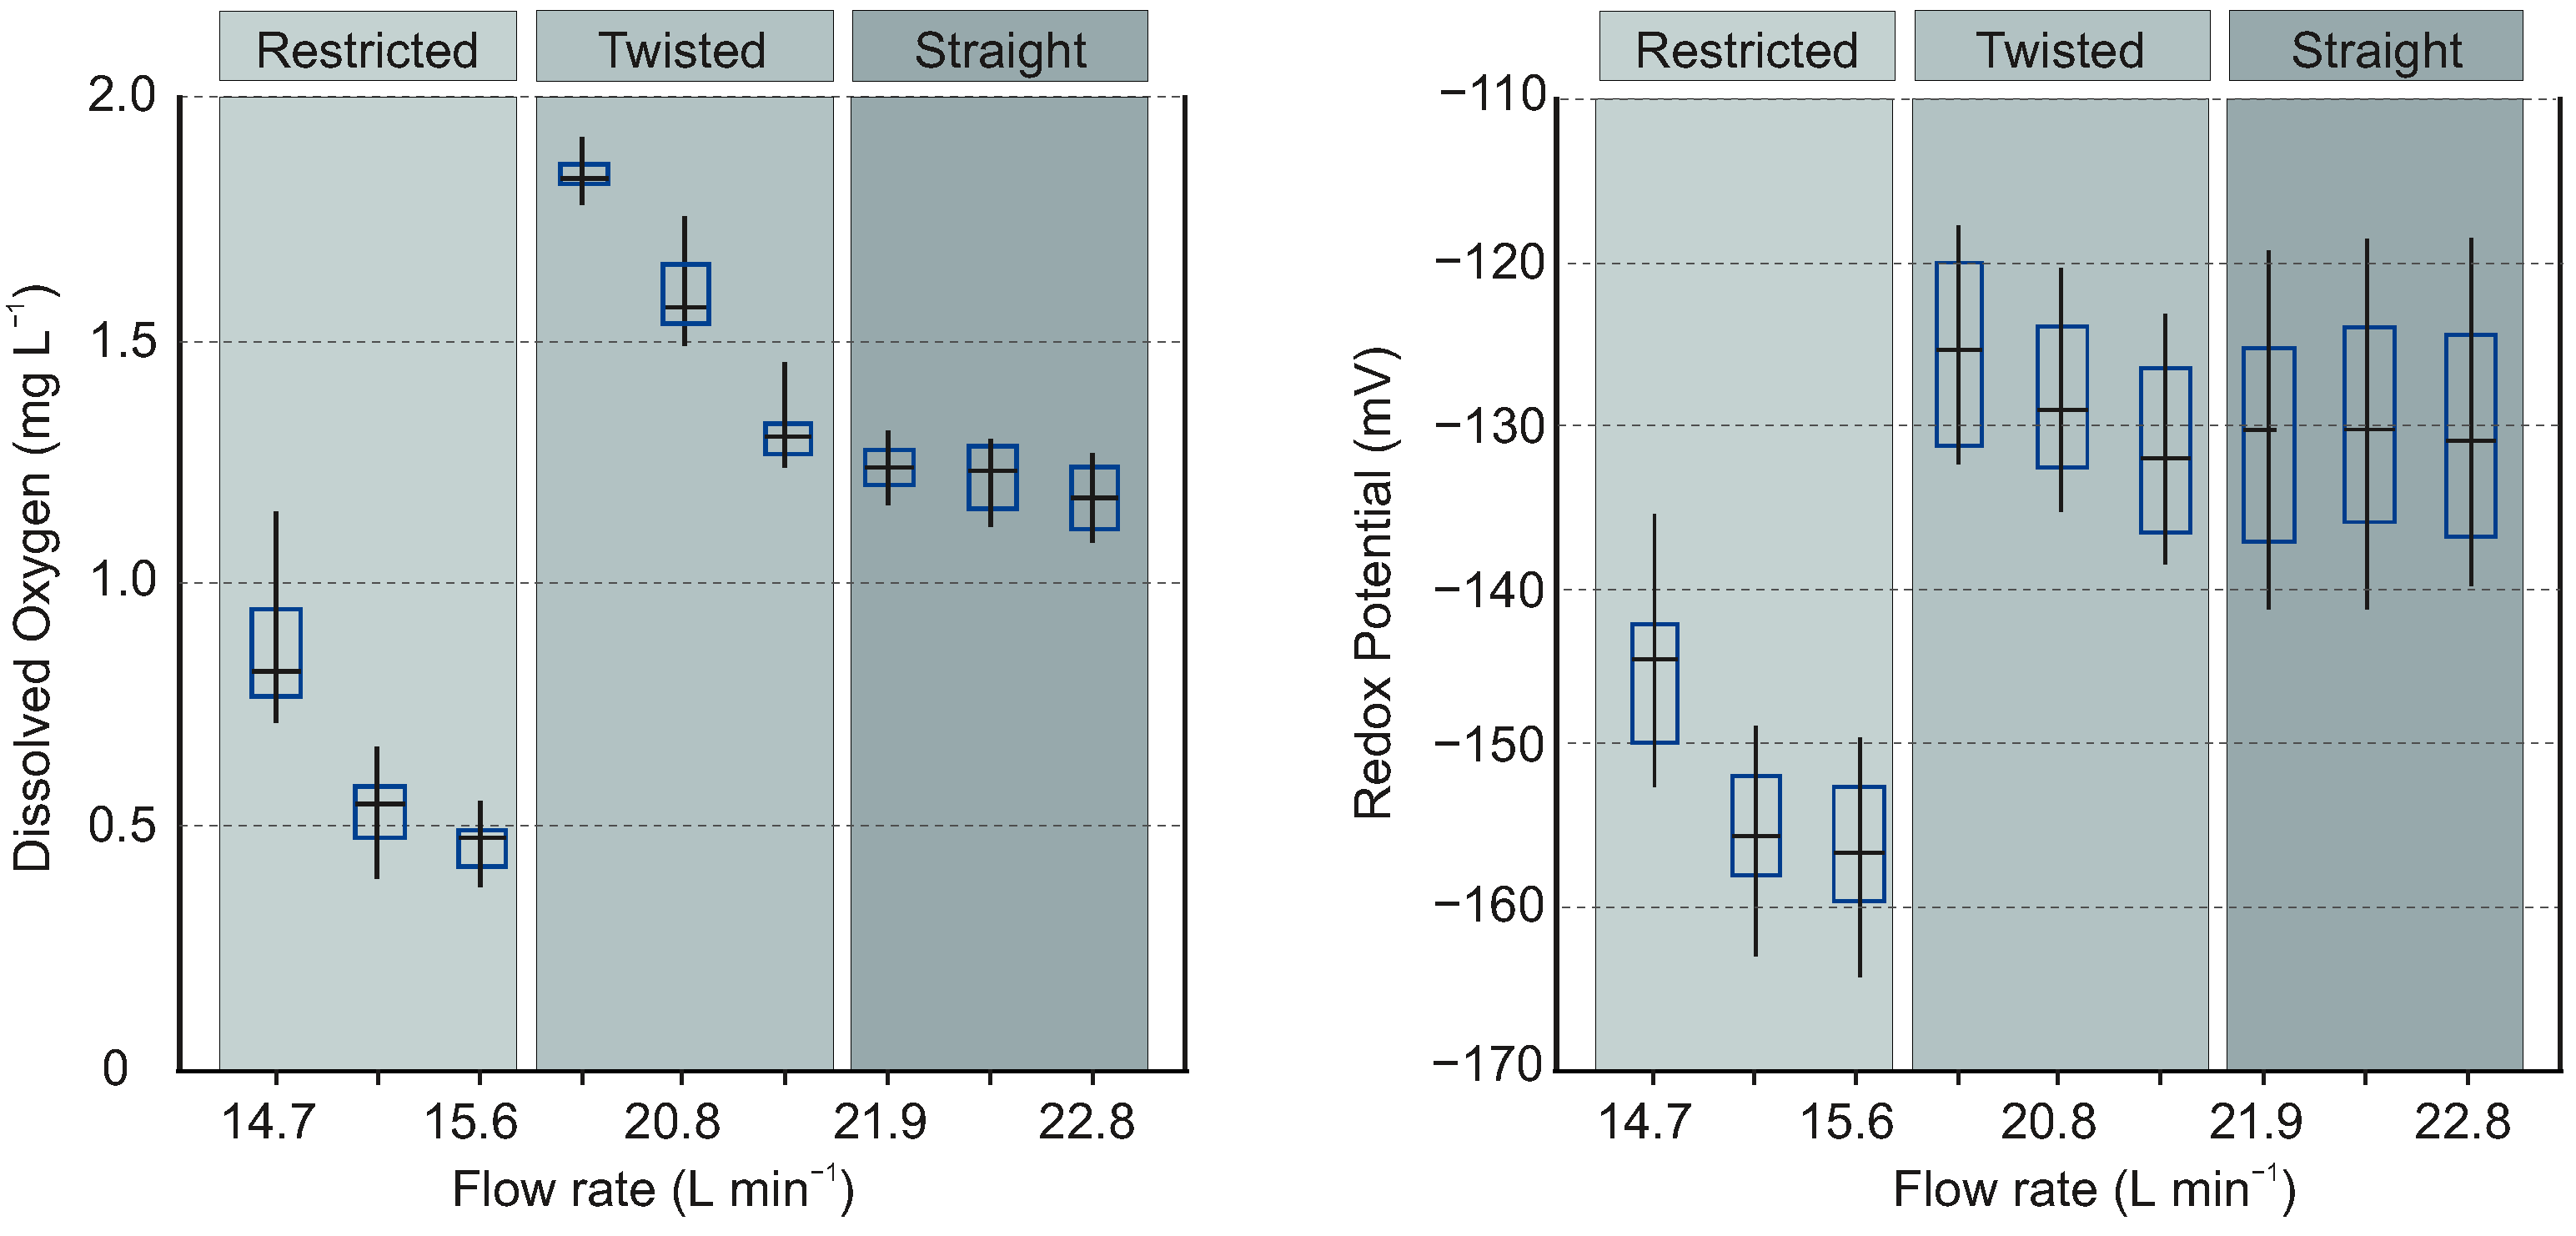
Figure 3 shows that the outlet dissolved oxygen concentration reaches its highest values (≈2 mg/L) inside the twisted regime. This is expected, as this regime presents the largest area-to-volume ratio and also presents a double helix interface which indicates enhanced turbulence, thus also enhanced advection. At a flow rate of 20.8 L/min the outlet DO values obtained for the twisted regime are quite similar compared to those obtained with the straight regime (around 1.5 mg/L). This is due to the fact that at this flow rate the twisted interface is not completely developed, thus the area-to-volume ratio is similar to what is seen in the straight regime. The low DO levels obtained at the restricted regime are due to the small interface area. The outlet redox potential behavior follows the same trend as dissolved oxygen, indicating that oxygen is the dominant oxidation agent in the system. This is expected because the system is fed with anoxic ground water whose analysis did not indicate the presence of other (strong) oxidants (see
Table 1). The low (negative) redox values at both inlet and outlet are due to a combination of low dissolved oxygen concentrations and high concentrations of Fe
(see
Table 1).
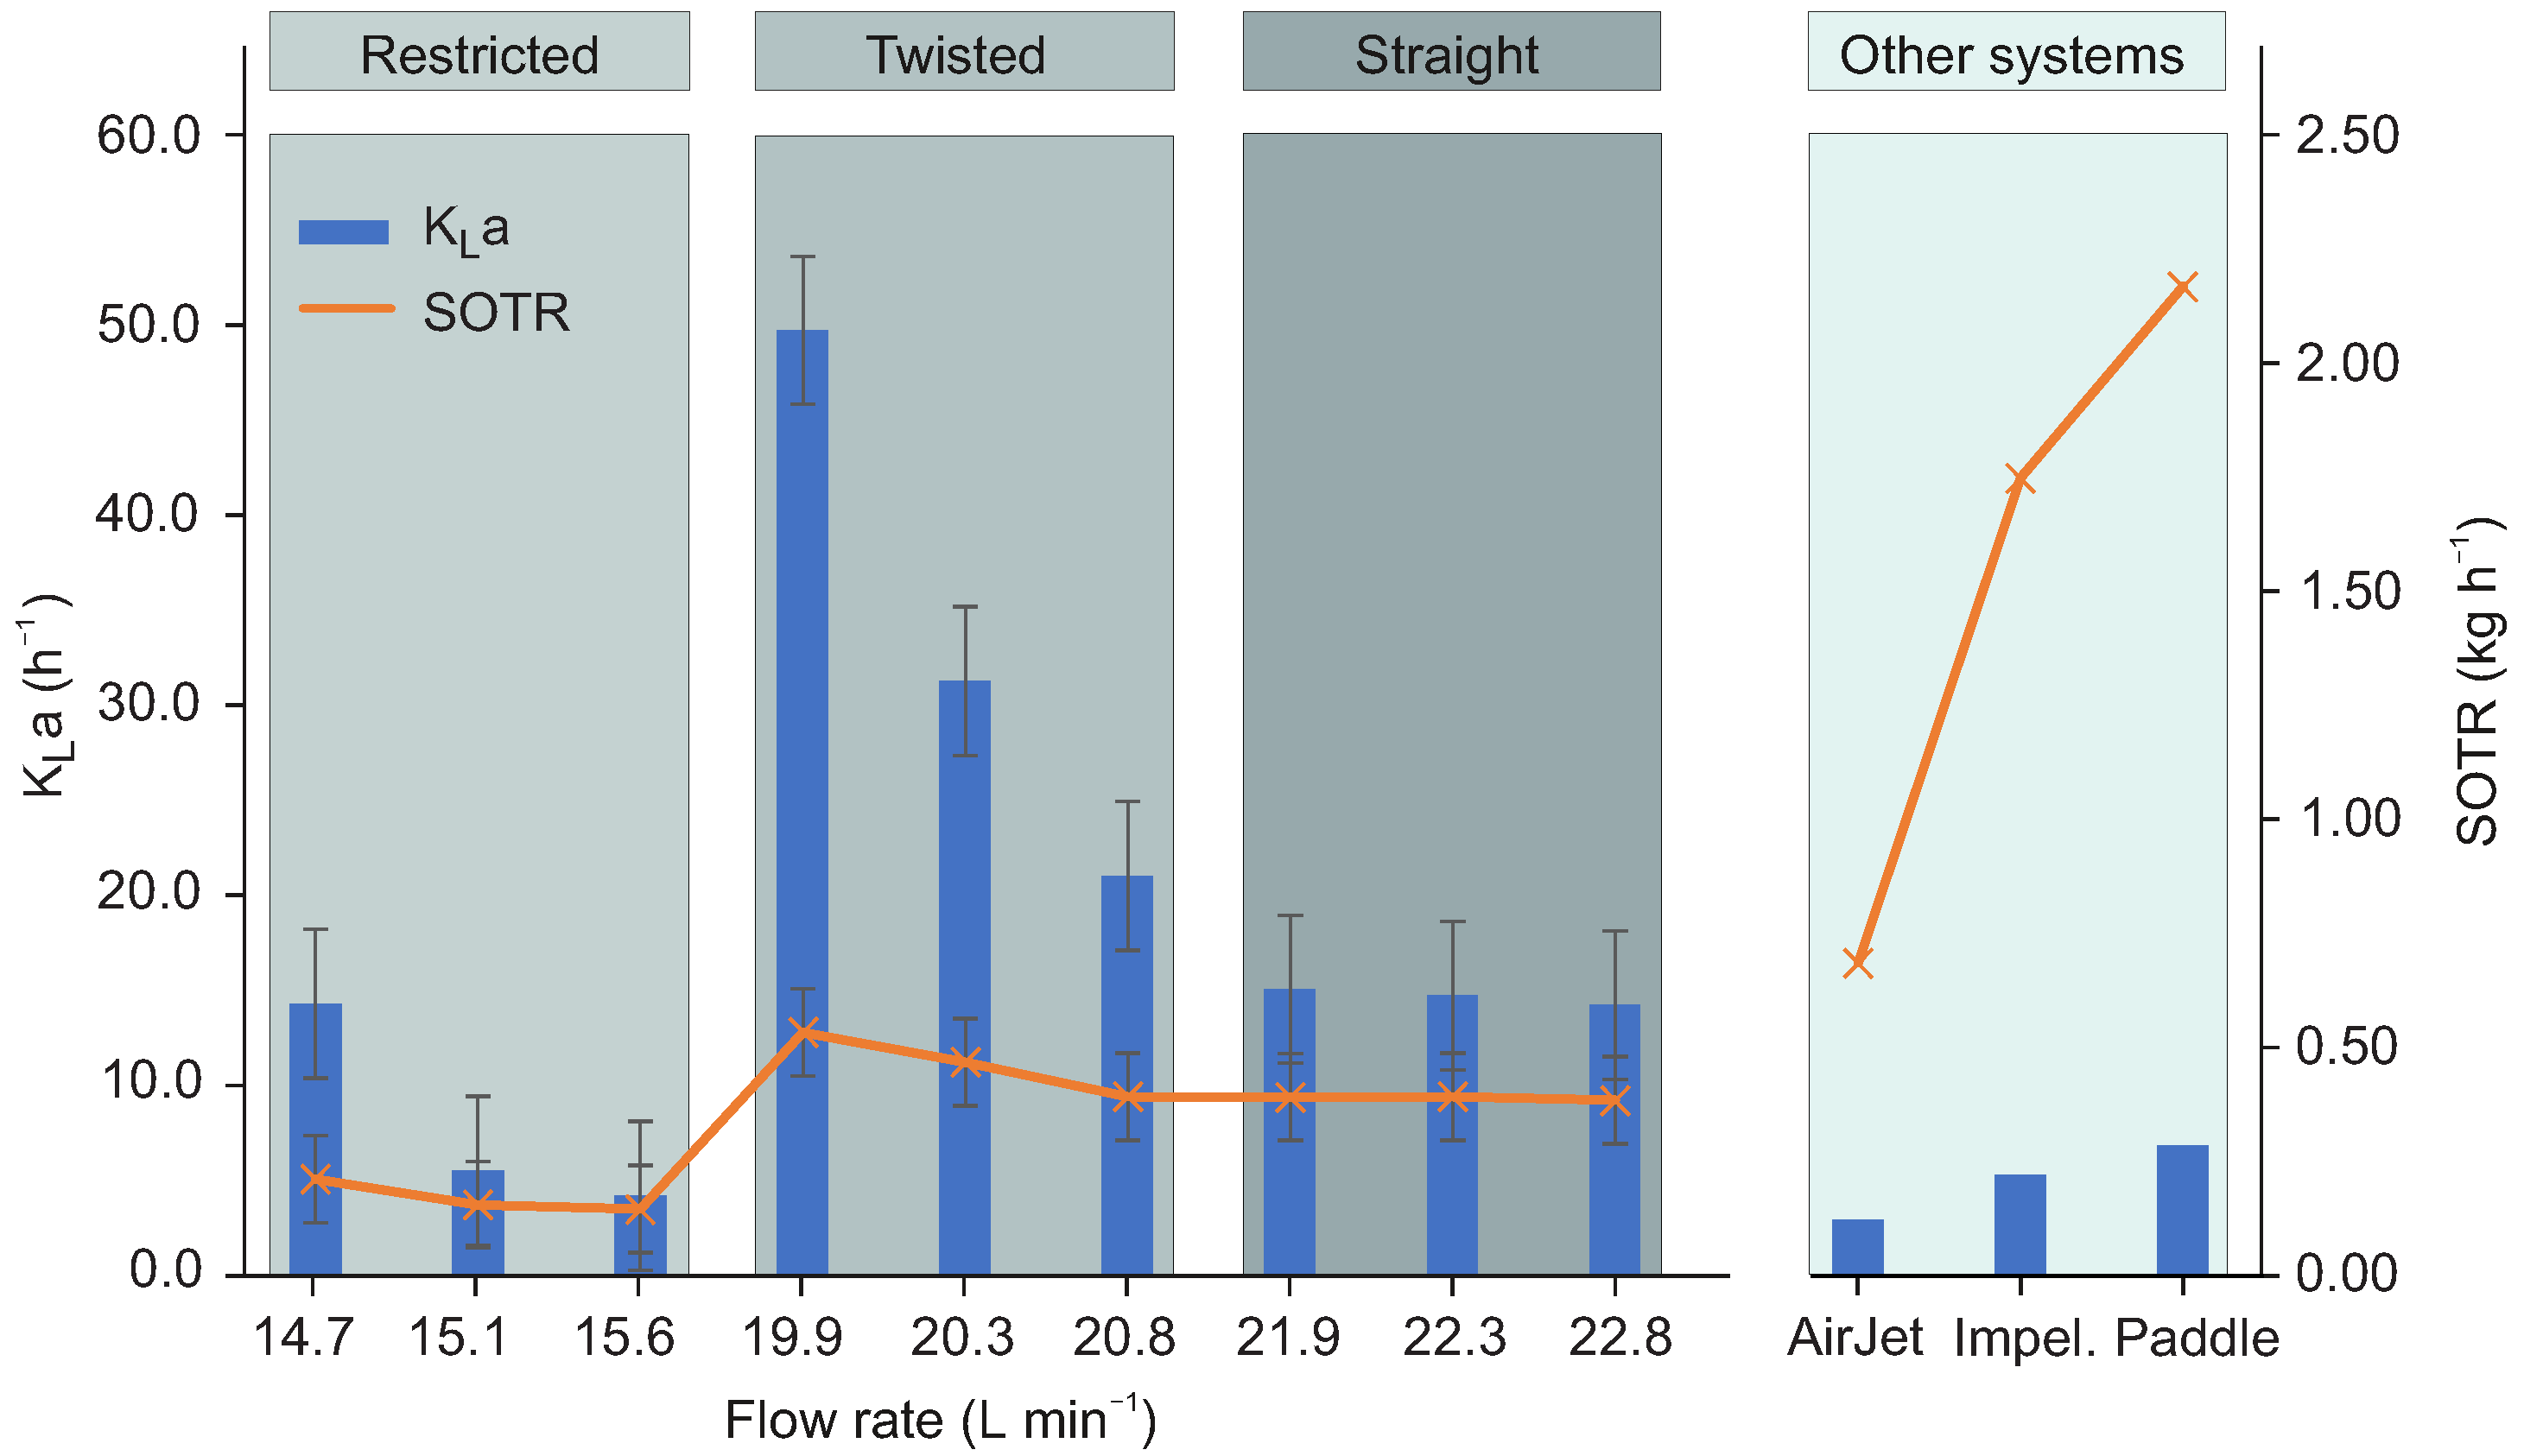
Figure 4 shows
and SOTR values (see
Supplementary Information for details) dependent also as a function of flow rate. Average
values (for 20 °C) for air jet, impellers and paddle aerators [
12] are shown for comparison. The plot shows that the
values obtained with the free surface vortex in a hyperbolically shaped funnel are considerably higher than those of the three commercial systems used for comparison, especially in the twisted regime. These high oxygen transfer rates are a consequence of the aforementioned combination of high area-to-volume ratios and possibly enhanced turbulence close to the interface. On the other hand, the SOTR values (up to 0.5 kg/h) [
12] are comparable to air jet system and lower than those reported for impeller and paddle systems (between 1.0 and 2.5 kg/h) [
12]. This is due to the short hydraulic retention times in the hyperbolic funnel (typically less than a minute). A possibility to increase the SOTR value is the application of a cascade of funnels which would multiply the HRT with a factor representing the number of funnels, whilst maintaining the desired flow regime and thus the
value. For practical applications the specific energy demand of such a cascade can be estimated as follows: The twisted regime of the hyperbolic funnel tested in this work has a specific energy demand of 0.01 kWh/kg O
(see
Appendix A for calculation details). In comparison, the specific energy demands of mechanical aerators range from 0.42 to 0.83 kWh/kg O
[
13] and the specific energy demands of air jets range from 0.74 to 1.0 kWh/kg O
[
12]. However, the industrial applicability of this system depends on its scalability to higher flow rates in larger funnels on the one hand, and on the possibility to achieve the described regimes with liquids of different viscosities as found in wastewater streams on the other. Thus, while the potential improvements in the energy efficiency of the aeration process seem promising, further work is required for confirmation and to exclude negative impacts on the sludge characteristics and WWTP performances.
4. Conclusions
In summary, we have investigated the potential of a geometrically constricted hyperbolic vortex system for gas diffusion applications. At certain mass flow rates the hydrodynamics of this system provides a large area-to-volume ratio and a large liquid–gas interface with enhanced turbulent mixing near the liquid/gas interface, allowing enhanced gas diffusion and advection superior to commercially available systems.While the system enables very fast gas transfer (high
), it provides a rather limited standard oxygen transfer rate (SOTR). The calculated SOTR is comparable to air jet systems, but lower than those of impellers and paddle wheels. This is caused by the low hydraulic retention time, intrinsic to the hydrodynamics of the system which provides relatively low specific initial angular velocities. However, the SOTR is proportional to the HRT, which again is dependent on the funnel size, thus a larger funnel or several funnels in series could potentially be used for large scale applications like wastewater or drinking water treatment plants. Apart from that, applications like heterogeneous iron removal from ground water [
14], which do not necessarily require oxygen saturation, could be a direct application.
In order to better understand the physics behind the enhanced oxygen volumetric mass transfer in this type of geometrically constrained vortex the authors plan to further investigate vortices in constrained systems, including particle image velocimetry and numerical two-phase flow simulations. Stack structured systems would be ideal for large scale applications like wastewater and drinking water treatment plants.


 ,
, 


