
Chemometric Approach to Pesticide Residue Analysis in Surface Water

 ,
,  , , , ,
  and
and 
Abstract
1. Introduction
2. Materials and Methods
2.1. Standards
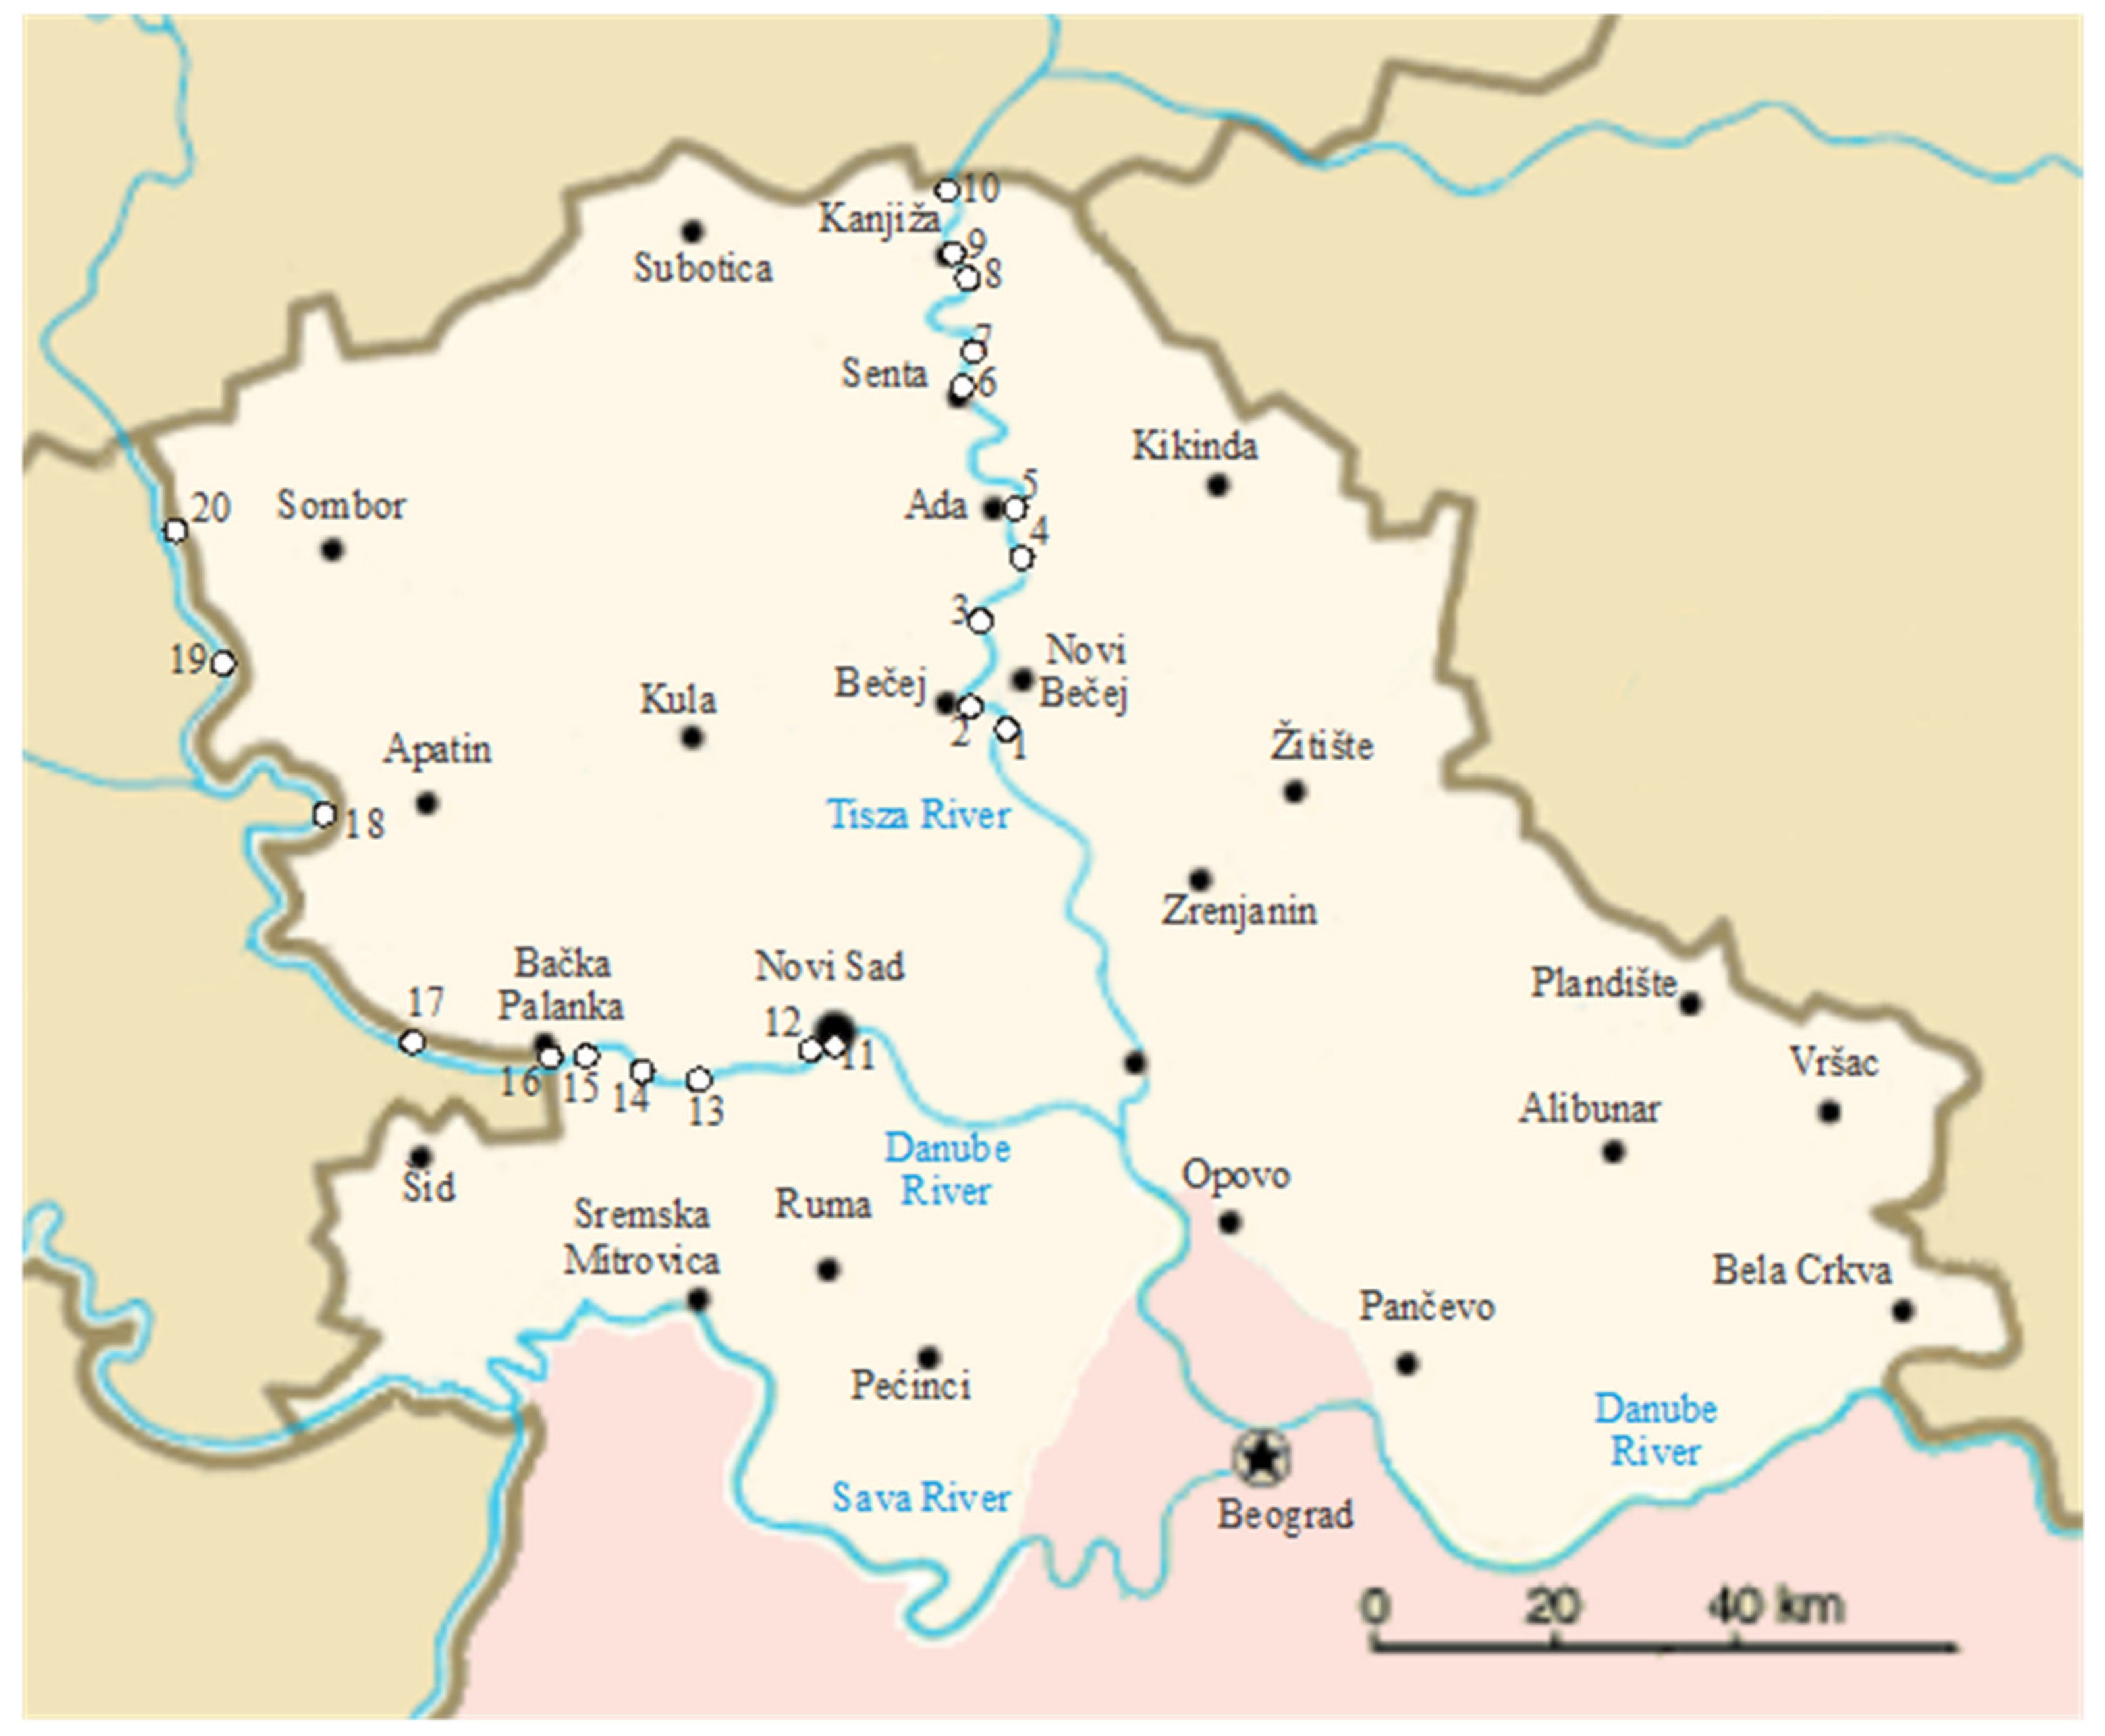
2.2. Sampling
2.3. Analytical Techniques
2.4. High-Performance Liquid Chromatographic Conditions
2.5. Statistical Analysis
2.5.1. ANN Modeling
2.5.2. Global Sensitivity Analysis
2.5.3. Error Analysis
3. Results and Discussion
3.1. Method Validation
3.1.1. ANN Model
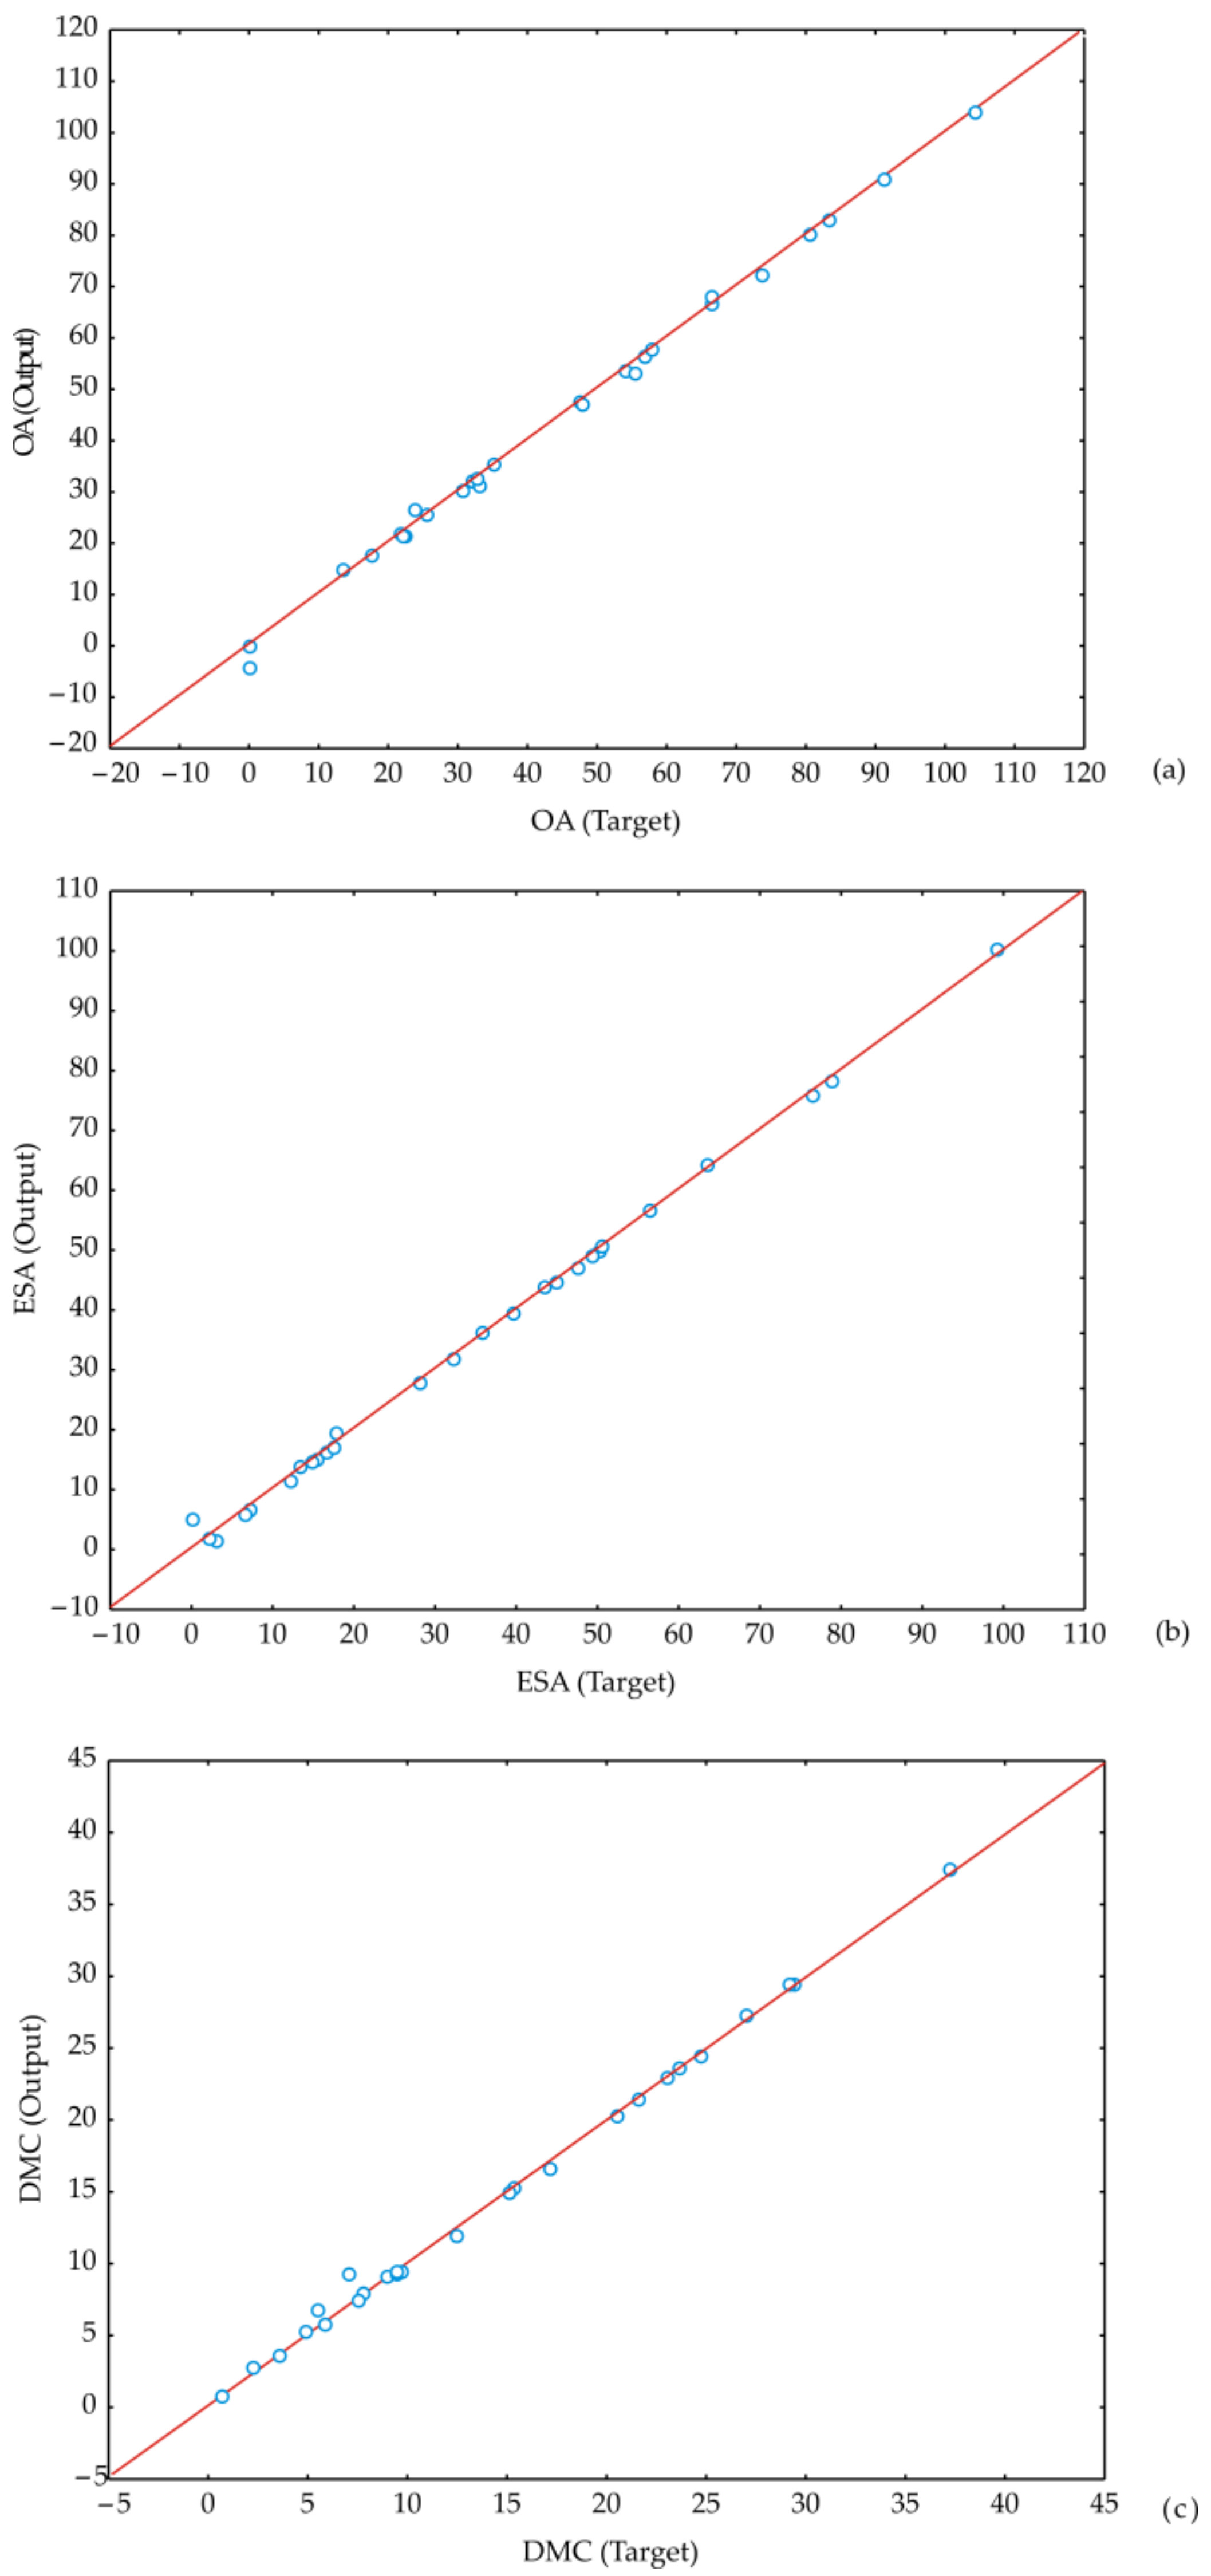
The Accuracy of the Models and the Residual Analysis
Multi-Objective ANN Optimization
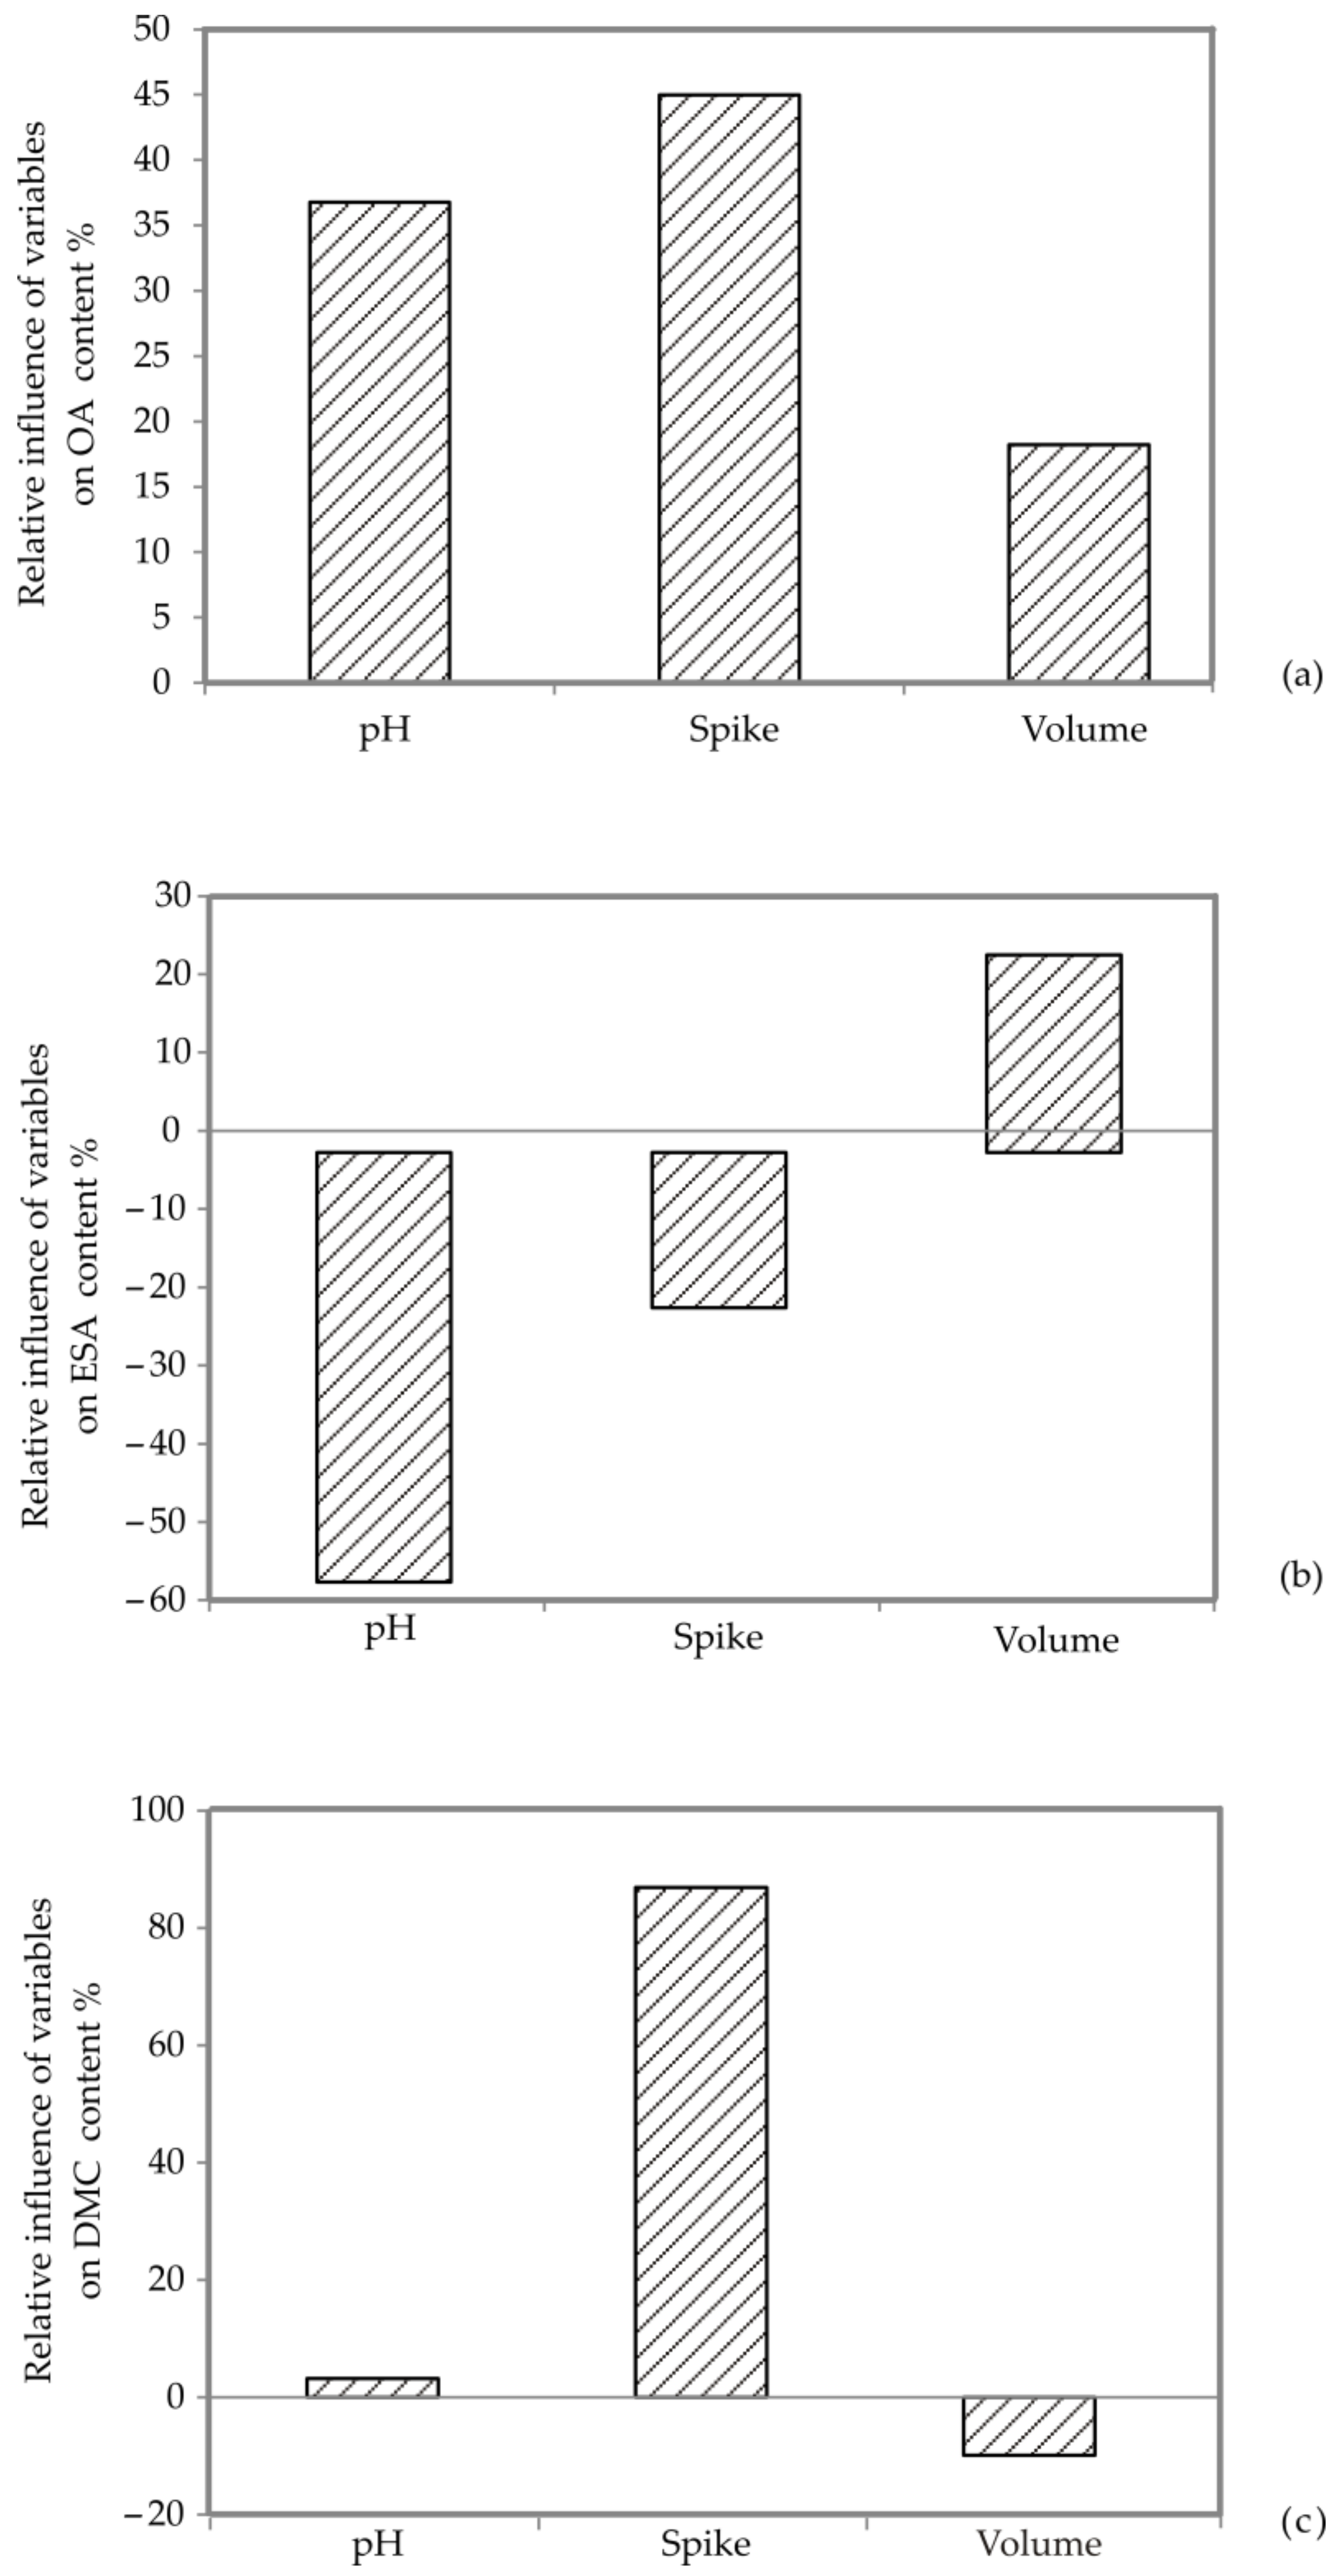
Global Sensitivity Analysis—Yoon’s Interpretation Method
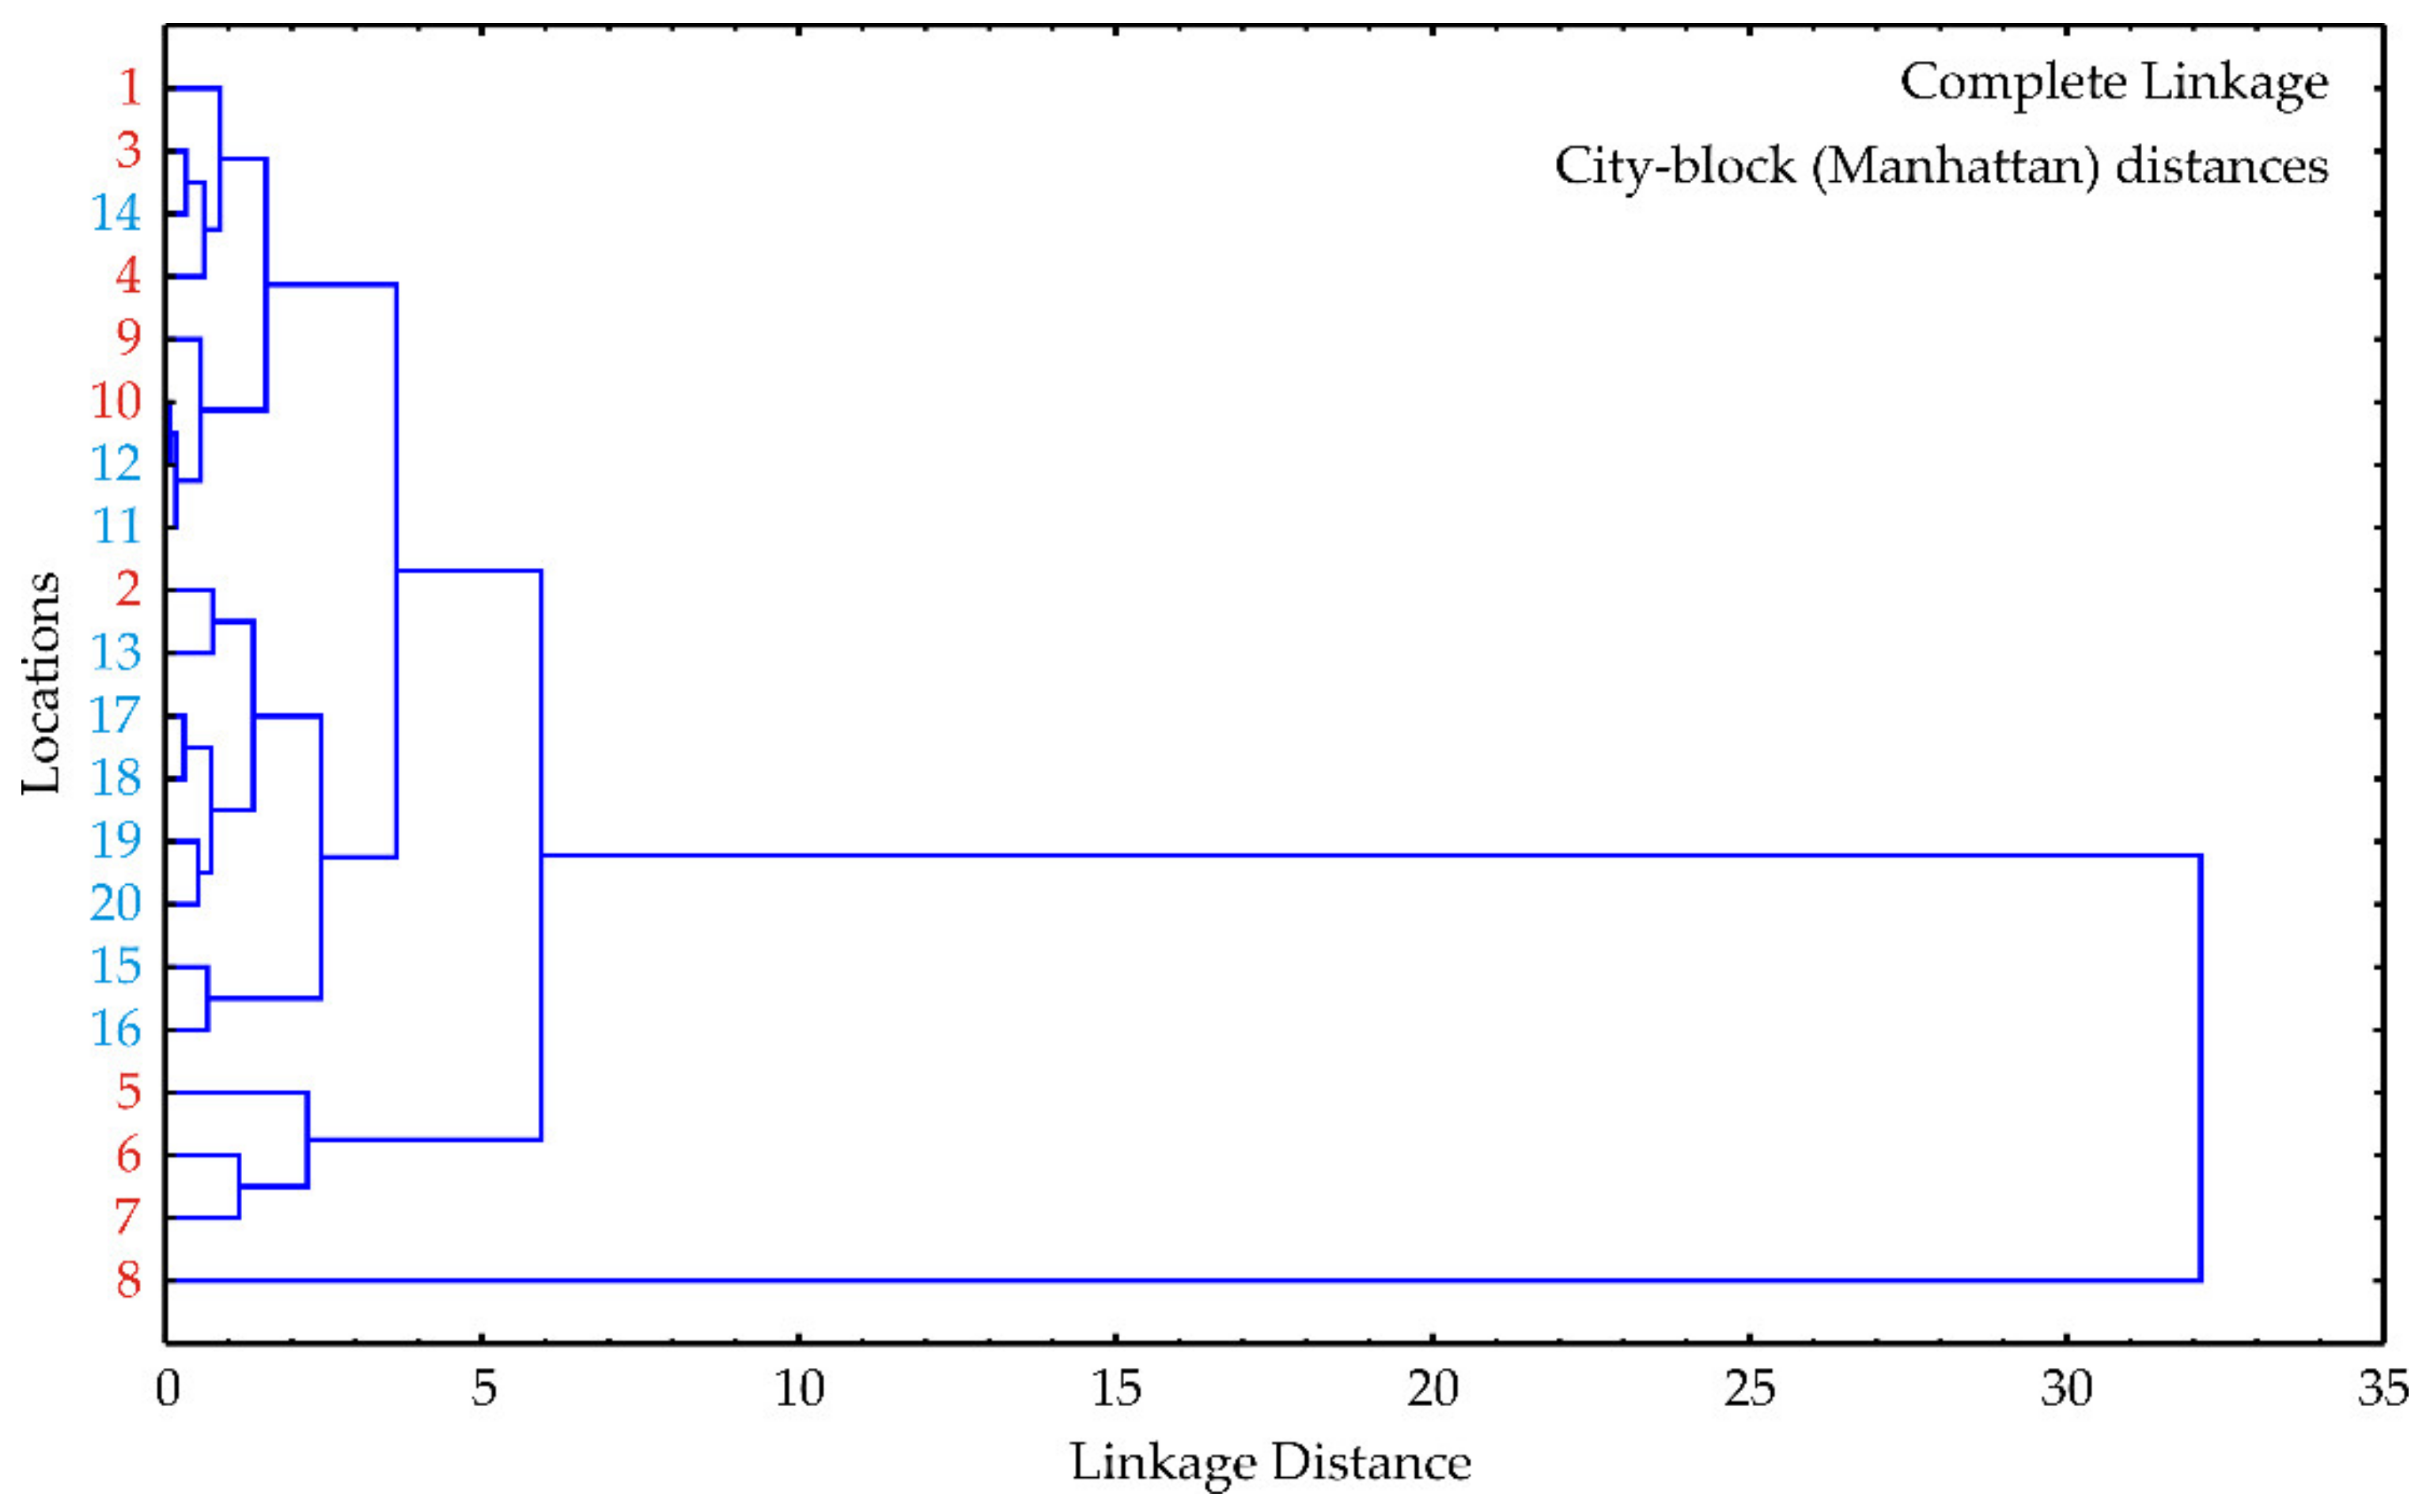
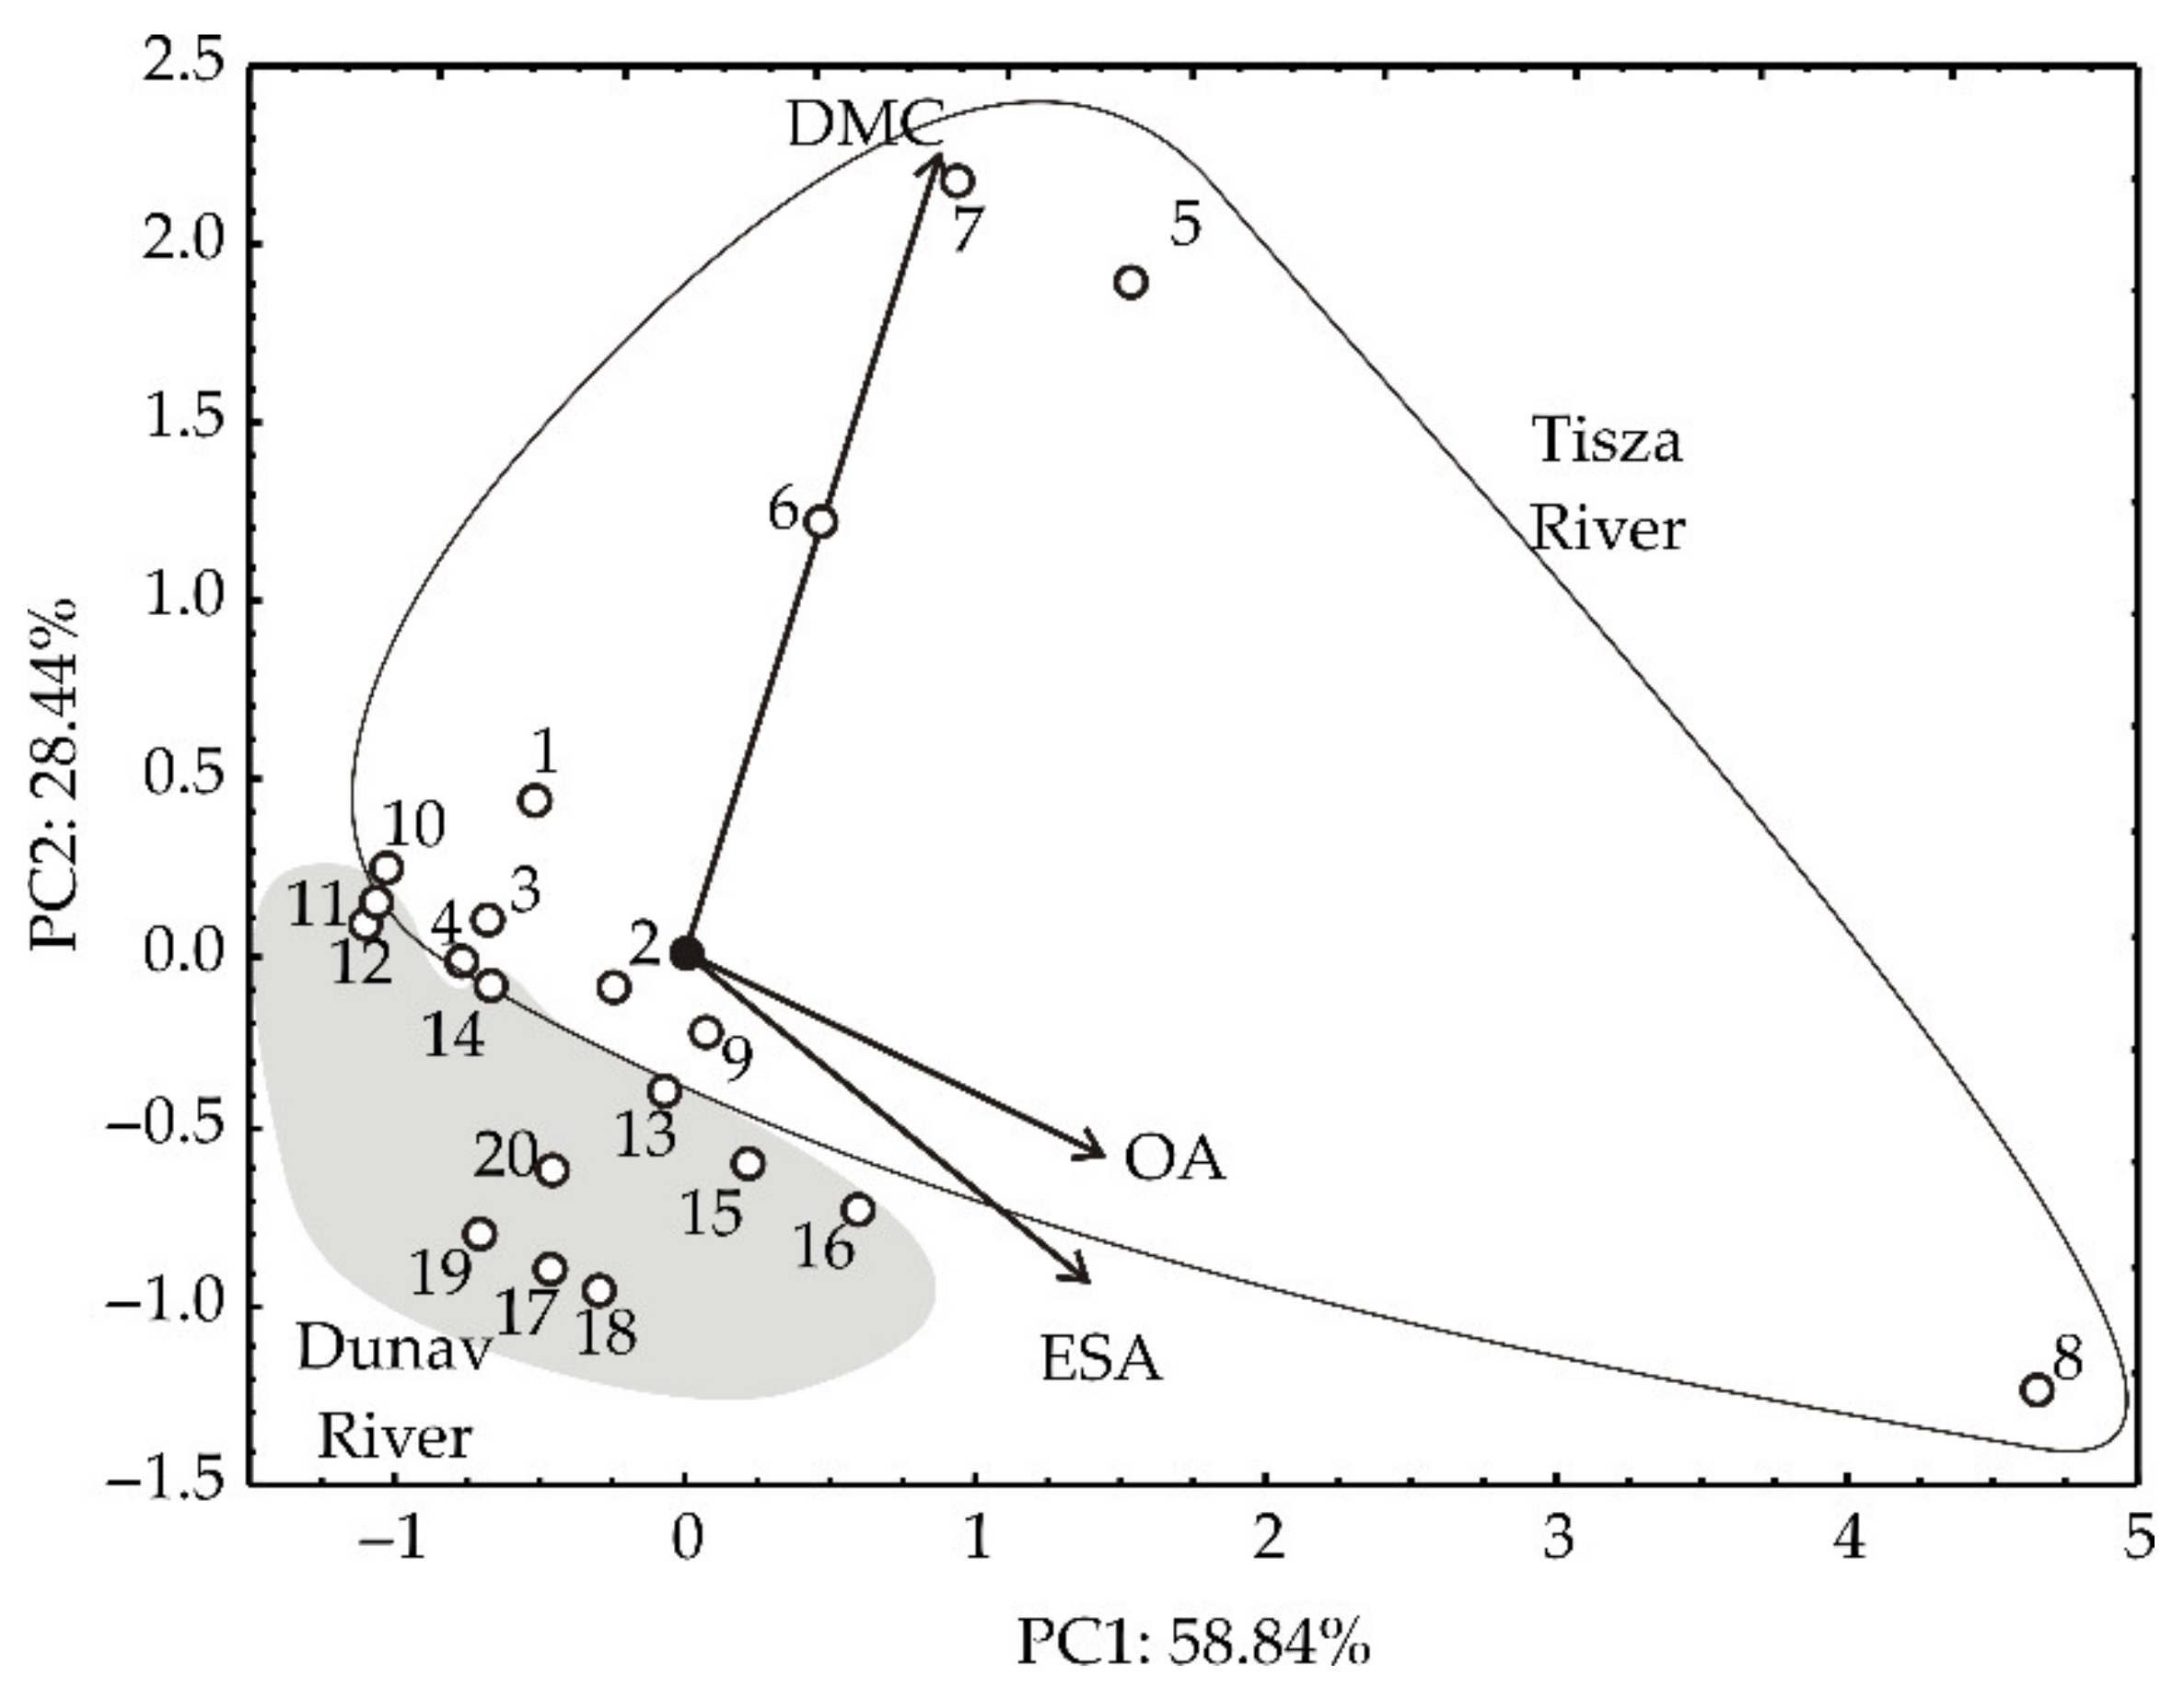
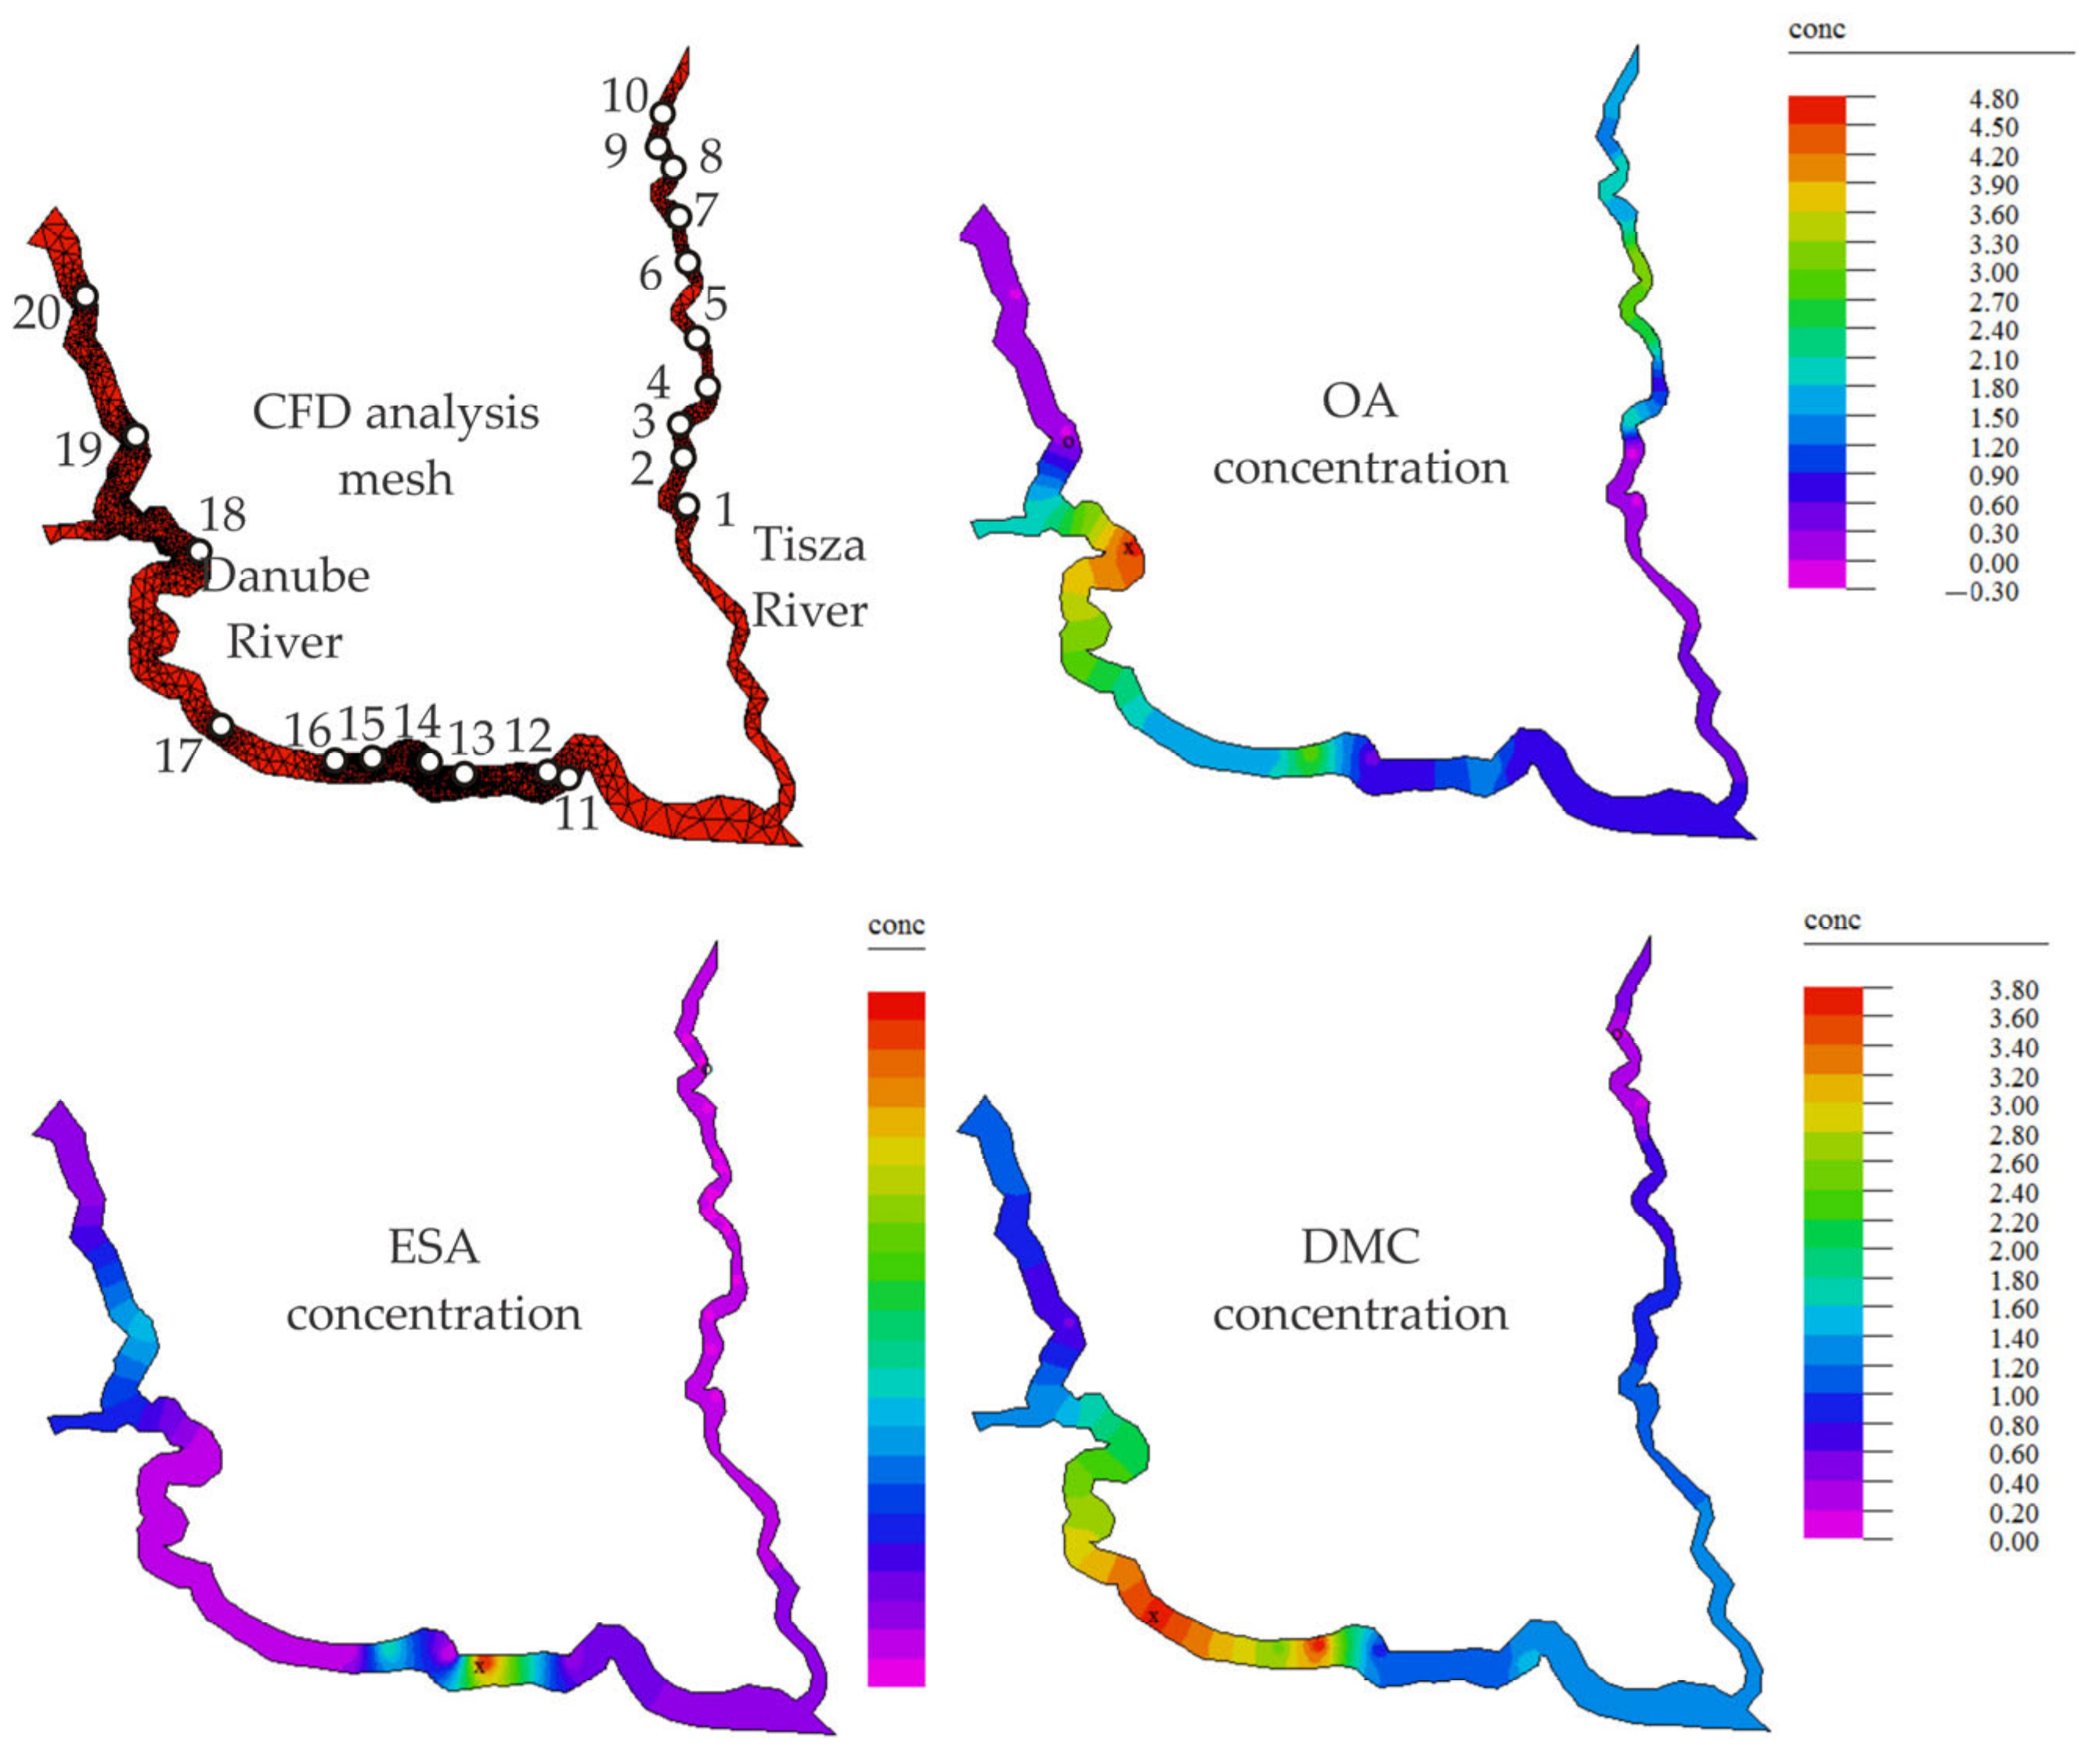
3.2. Detection of DMC, ESA and OA in Water from Sampling Sites in the Danube River and the Tisza River
4. Conclusions
Author Contributions
Funding
Institutional Review Board Statement
Informed Consent Statement
Data Availability Statement
Conflicts of Interest
References
- Rehman, A.; Ma, H.; Ozturk, I.; Ulucak, R. Sustainable development and pollution: The effects of CO2 emission on population growth, food production, economic development, and energy consumption in Pakistan. Environ. Sci. Pollut. Res. 2022, 29, 17319–17330. [Google Scholar] [CrossRef] [PubMed]
- Hoffmann, R.; Muttarak, R.; Peisker, J.; Stanig, P. Climate change experiences raise environmental concerns and promote Green voting. Nat. Clim. Change 2022, 12, 148–155. [Google Scholar] [CrossRef]
- Dincer, I. Renewable energy and sustainable development: A crucial review. Renew. Sustain. Energy Rev. 2000, 4, 157–175. [Google Scholar] [CrossRef]
- Ponce, P.; Álvarez-García, J.; Medina, J.; del Río-Rama, M.D.L.C. Financial development, clean energy, and human capital: Roadmap towards sustainable growth in América Latina. Energies 2021, 14, 3763. [Google Scholar] [CrossRef]
- Amjith, L.R.; Bavanish, B. A review on biomass and wind as renewable energy for sustainable environment. Chemosphere 2022, 293, 133579. [Google Scholar] [CrossRef] [PubMed]
- Ogunkunle, O.; Ahmed, N.A. Exhaust emissions and engine performance analysis of a marine diesel engine fuelled with Parinari polyandra biodiesel–diesel blends. Energy Rep. 2020, 6, 2999–3007. [Google Scholar] [CrossRef]
- Ogunkunle, O.; Ahmed, N.A. Overview of biodiesel combustion in mitigating the adverse impacts of engine emissions on the sustainable human–environment scenario. Sustainability 2021, 13, 5465. [Google Scholar] [CrossRef]
- Bielski, S.; Marks-Bielska, R.; Zielińska-Chmielewska, A.; Romaneckas, K.; Šarauskis, E. Importance of agriculture in creating energy security—A case study of Poland. Energies 2021, 14, 2465. [Google Scholar] [CrossRef]
- Nayab, R.; Imran, M.; Ramzan, M.; Tariq, M.; Taj, M.B.; Akhtar, M.N.; Iqbal, H.M. Sustainable biodiesel production via catalytic and non-catalytic transesterification of feedstock materials—A review. Fuel 2022, 328, 125254. [Google Scholar] [CrossRef]
- Bełdycka-Bórawska, A.; Bórawski, P.; Holden, L.; Rokicki, T.; Klepacki, B. Factors Shaping Performance of Polish Biodiesel Producers Participating in the Farm Accountancy Data Network in the Context of the Common Agricultural Policy of the European Union. Energies 2022, 15, 7400. [Google Scholar] [CrossRef]
- Lykogianni, M.; Bempelou, E.; Karamaouna, F.; Aliferis, K.A. Do pesticides promote or hinder sustainability in agriculture? The challenge of sustainable use of pesticides in modern agriculture. Sci. Total Environ. 2021, 795, 148625. [Google Scholar] [CrossRef] [PubMed]
- Obermeier, C.; Mason, A.S.; Meiners, T.; Petschenka, G.; Rostás, M.; Will, T.; Wittkop, B.; Austel, N. Perspectives for integrated insect pest protection in oilseed rape breeding. Theor. Appl. Genet. 2022, 135, 3917–3946. [Google Scholar] [CrossRef] [PubMed]
- Mănoiu, V.M.; Crăciun, A.I. Danube river water quality trends: A qualitative review based on the open access web of science database. Ecohydrol. Hydrobiol. 2021, 21, 613–628. [Google Scholar] [CrossRef]
- Soprani, M.; Ponzoni, A.; Sberveglieri, V.; Carmona, E.N.; Bhandari, M.P.; Betto, G.; Sberveglieri, G. Real-time chemical gas sensing of pathogenic microorganisms pollution in wastewater. In Proceedings of the 2017 ISOCS/IEEE International Symposium on Olfaction and Electronic Nose (ISOEN), Montréal, QC, Canada, 28–31 May 2017; pp. 1–3. [Google Scholar]
- Wijewardene, L.; Wu, N.; Qu, Y.; Guo, K.; Messyasz, B.; Lorenz, S.; Riis, T.; Ulrich, U.; Fohrer, N. Influences of pesticides, nutrients, and local environmental variables on phytoplankton communities in lentic small water bodies in a German lowland agricultural area. Sci. Total Environ. 2021, 780, 146481. [Google Scholar] [CrossRef] [PubMed]
- Pelosi, C.; Bertrand, C.; Daniele, G.; Coeurdassier, M.; Benoit, P.; Nélieu, S.; Lafay, F.; Bretagnolle, V.; Gaba, S.; Vulliet, E.; et al. Residues of currently used pesticides in soils and earthworms: A silent threat? Agric. Ecosyst. Environ. 2021, 305, 107167. [Google Scholar] [CrossRef]
- Székács, A. Herbicide mode of action. In Herbicides Chemistry, Efficacy, Toxicology, and Environmental Impacts—Emerging Issues in Analytical Chemistry; Elsevier: Amsterdam, The Netherlands, 2021; pp. 41–86. [Google Scholar] [CrossRef]
- Ulrich, U.; Lorenz, S.; Hörmann, G.; Stähler, M.; Neubauer, L.; Fohrer, N. Multiple pesticides in lentic small water bodies: Exposure, ecotoxicological risk, and contamination origin. Sci. Total Environ. 2022, 816, 151504. [Google Scholar] [CrossRef]
- Kovacevik, B.; Mitrev, S.; Boev, B. The Impact of Agriculture Activities on Groundwater Quality. In: Creating Sustainable Transffer of Knowledge for Building Novel Ideas for Critical Environmental Issues of the Western Balkan Countries. Stip. Republic of North Macedonia. 28–30 October 2019. Available online: https://eprints.ugd.edu.mk/id/eprint/23745 (accessed on 3 July 2022).
- Székács, A.; Mörtl, M.; Darvas, B. Monitoring pesticide residues in surface and ground water in Hungary: Surveys in 1990–2015. J. Chem. 2015, 2015, 717948. [Google Scholar] [CrossRef]
- Cheng, Z.; Zhang, C.; Jiang, W.; Zhai, W.; Gao, J.; Wang, P. Effects of the presence of triclocarban on the degradation and migration of co-occurring pesticides in soil. Environ. Pollut. 2022, 310, 119840. [Google Scholar] [CrossRef]
- Mahler, B.J.; Nowell, L.H.; Sandstrom, M.W.; Bradley, P.M.; Romanok, K.M.; Konrad, C.P.; Van Metre, P.C. Inclusion of pesticide transformation products is key to estimating pesticide exposures and effects in small US streams. Environ. Sci. Technol. 2021, 55, 4740–4752. [Google Scholar] [CrossRef]
- Tisler, S.; Tüchsen, P.L.; Christensen, J.H. Non-target screening of micropollutants and transformation products for assessing AOP-BAC treatment in groundwater. Environ. Pollut. 2022, 309, 119758. [Google Scholar] [CrossRef]
- Anagnostopoulou, K.; Nannou, C.; Evgenidou, E.; Lambropoulou, D. Overarching issues on relevant pesticide transformation products in the aquatic environment: A review. Sci. Total Environ. 2022, 815, 152863. [Google Scholar] [CrossRef] [PubMed]
- Ulrich, U.; Pfannerstill, M.; Ostendorp, G.; Fohrer, N. Omnipresent distribution of herbicides and their transformation products in all water body types of an agricultural landscape in the North German Lowland. Environ. Sci. Pollut. Res. 2021, 28, 44183–44199. [Google Scholar] [CrossRef] [PubMed]
- Torrentó, C.; Ponsin, V.; Lihl, C.; Hofstetter, T.B.; Baran, N.; Elsner, M.; Hunkeler, D. Triple-element compound-specific stable isotope analysis (3D-CSIA): Added value of Cl isotope ratios to assess herbicide degradation. Environ. Sci. Technol. 2021, 55, 13891–13901. [Google Scholar] [CrossRef] [PubMed]
- Shoemaker, J.A.; Bassett, M.V. Method 535. Measurement of Chloroacetanilide and Other Acetamide Herbicide Degradates in Drinking Water by Solid Phase Extraction and Liquid Chromatography/Tandem Mass Spectrometry (LC/MS/MS); EPA Document #: EPA/600/R-05/053; National Exposure Research Laboratory Office of Research and Development U.S. Environmental Protection Agency: Cincinnati, OH, USA, 2005. [Google Scholar]
- Rajković, D.; Jeromela, A.M.; Pezo, L.; Lončar, B.; Grahovac, N.; Špika, A.K. Artificial neural network and random forest regression models for modelling fatty acid and tocopherol content in oil of winter rapeseed. J. Food Compost Anal. 2022, 44, 105020. [Google Scholar] [CrossRef]
- Vakula, A.; Pavlić, B.; Pezo, L.; Tepić Horecki, A.; Daničić, T.; Raičević, L.; Ljubojević, M.; Šumić, Z. Vacuum drying of sweet cherry: Artificial neural networks approach in process optimization. J. Food Process. Preserv. 2020, 44, e14863. [Google Scholar] [CrossRef]
- Shariati, M.; Mafipour, M.S.; Mehrabi, P.; Bahadori, A.; Zandi, Y.; Salih, M.N.; Nguyen, H.; Dou, J.; Song, X.; Poi-Ngian, S. Application of a hybrid artificial neural network-particle swarm optimization (ANN-PSO) model in behavior prediction of channel shear connectors embedded in normal and high-strength concrete. Appl. Sci. 2019, 9, 5534. [Google Scholar] [CrossRef]
- Mohandes, S.R.; Zhang, X.; Mahdiyar, A. A comprehensive review on the application of artificial neural networks in building energy analysis. Neurocomputing 2019, 340, 55–75. [Google Scholar] [CrossRef]
- Vojnov, B.; Jaćimović, G.; Šeremešić, S.; Pezo, L.; Lončar, B.; Krstić, Đ.; Vujić, S.; Ćupina, B. The Effects of Winter Cover Crops on Maize Yield and Crop Performance in Semiarid Conditions—Artificial Neural Network Approach. Agronomy 2022, 12, 2670. [Google Scholar] [CrossRef]
- Pezo, L.; Lončar, B.; Šovljanski, O.; Tomić, A.; Travičić, V.; Pezo, M.; Aćimović, M. Agricultural Parameters and Essential Oil Content Composition Prediction of Aniseed. Based on Growing Year. Locality and Fertilization Type—An Artificial Neural Network Approach. Life 2022, 12, 1722. [Google Scholar] [CrossRef]
- Jawad, J.; Hawari, A.H.; Zaidi, S.J. Artificial neural network modeling of wastewater treatment and desalination using membrane processes: A review. J. Chem. Eng. 2021, 419, 129540. [Google Scholar] [CrossRef]
- Puntarić, E.; Pezo, L.; Zgorelec, Ž.; Gunjača, J.; Kučić, G.; Voća, N. Prediction of the Production of Separated Municipal Solid Waste by Artificial Neural Networks in Croatia and the European Union. Sustainability 2022, 14, 10133. [Google Scholar] [CrossRef]
- Yoon, Y.; Swales, G.; Margavio, T.M. A comparison of discriminant analysis versus artificial neural networks. J. Oper. Res. Soc. 2017, 44, 51–60. [Google Scholar] [CrossRef]
- Ruškić, N.; Mirović, V.; Marić, M.; Pezo, L.; Lončar, B.; Nićetin, M.; Ćurčić, L. Model for Determining Noise Level Depending on Traffic Volume at Intersections. Sustainability 2022, 14, 12443. [Google Scholar] [CrossRef]
- The list of approved substances. In Official Gazette of Republic of Serbia No. 47/22; Ministry of Agriculture and Environment: Belgrade, Serbia, 2022.
- Konstantinou, I.K.; Hela, D.G. Albanis TAThe status of pesticide pollution in surface waters (rivers lakes) of Greece Part, I. Review on occurrence and levels. Environ. Pollut. 2006, 141, 555–570. [Google Scholar] [CrossRef] [PubMed]
- Karlsson, A.S.; Lesch, M.; Weihermüller, L.; Thiele, B.; Disko, U.; Hofmann, D.; Vereecken, H.; Spielvogel, S. Pesticide contamination of the upper Elbe River and an adjacent floodplain area. J. Soils Sediments 2020, 20, 2067–2081. [Google Scholar] [CrossRef]
- Sonrani, M.; Abbatangelo, M.; Carmona, E.; Duina, G.; Malgaretti, M.; Comini, E.; Sberveglieri, V.; Bhandari, M.P.; Bolpagni, D.; Sberveglieri, G. Array of semiconductor nanowires gas sensor for IoT in wastewater management. In Proceedings of the 2018 Workshop on Metrology for Industry 4.0 and IoT, Brescia, Italy, 16–18 April 2018; pp. 68–71. [Google Scholar]
- The Regulation on Limit Values of Priority and Priority Hazardous Substances Polluting Surface Water and Deadlines for Their Achievement. In Official Gazette of Republic Serbia No. 24/2014; Ministry of Agriculture and Environment: Belgrade, Serbia, 2014.
- Aćimović, M.; Lončar, B.; Jeliazkov, V.; Pezo, L.; Ljujić, J.; Miljković, A.; Vujisić, L. Comparison of Volatile Compounds from Clary Sage (Salvia sclareaL.) Verticillasters Essential Oil and Hydrolate. J. Essent. Oil-Bear. Plants 2022, 25, 555–570. [Google Scholar] [CrossRef]
- Kojić, P.S.; Popović, S.S.; Tokić, M.S.; Šijački, I.M.; Lukić, N.L.; Jovičević, D.Z.; Petrović, D.L. Hydrodynamics of an external-loop airlift reactor with inserted membrane. Braz. J. Chem. Eng. 2017, 34, 493–505. [Google Scholar] [CrossRef]


| Tisza River | Danube River | ||||
|---|---|---|---|---|---|
| No. | Sample Site Locations | Coordinates | No. | Sample Site Locations | Coordinates |
| 1 | Novi Bečej | 45° 35′56″ N 20° 07′ 95″ E | 11 | Sremska Kamenica | 45° 13′ 47″ N 19° 5′ 21″ E |
| 2 | Bečej | 45° 36′ 4″ N 20° 03′ 319″ E | 12 | Novi Sad | 45° 14′ 68″ N 19° 51′ 38″ E |
| 3 | Bačko Petrovo Selo | 45° 42′ 78″ N 20° 5′ 55″ E | 13 | Futog | 45° 13′ 94″ N 19° 41′ 91″ E |
| 4 | Mol | 45° 45′ 78″ N 20° 8′ 74″ E | 14 | Begeč | 45° 13′ 22″ N 19° 37′ 02″ E |
| 5 | Ada | 45° 47′ 62″ N 20° 8′ 72″ E | 15 | Čelarevo | 45° 15′ 35″ N 19° 31′ 854″ E |
| 6 | Senta | 45° 55′ 63″ N 20° 5′ 88″ E | 16 | Bačka Palanka | 45° 14′ 05″ N 19° 22′ 98″ E |
| 7 | Sanad | 45° 58′ 321″ N 20° 5′ 708″ E | 17 | Bačko Novo Selo | 45° 17′ 139″ N 19° 08′ 25″ E |
| 8 | Novi Kneževac | 46° 2′ 926″ N 20° 5′ 304″ E | 18 | Bogojevo | 45° 31′ 81″ N 19° 4′ 72″ E |
| 9 | Kanjiža | 46° 4′ 173″ N 20° 3′ 94″ E | 19 | Apatin | 45° 40′ 501″ N 18° 58’ 15″ E |
| 10 | Martonoš | 46° 7′ 08″ N 20° 4′ 62″ E | 20 | Bezdan | 45° 50′ 97″ N 18° 51′ 57″ E |
| No | pH | Spike | Injection Volume | OA | ESA | DMC |
|---|---|---|---|---|---|---|
| 1 | 2 | 0.5 | 0.5 | 13.466 | 0.000 | 6.796 |
| 2 | 2 | 0.5 | 1 | 17.036 | 7.289 | 8.760 |
| 3 | 2 | 0.5 | 1.5 | 47.373 | 32.294 | 9.077 |
| 4 | 2 | 1 | 0.5 | 31.838 | 35.448 | 21.454 |
| 5 | 2 | 1 | 1 | 47.789 | 47.034 | 24.372 |
| 6 | 2 | 1 | 1.5 | 92.682 | 75.841 | 25.254 |
| 7 | 2 | 1.5 | 0.5 | 0.000 | 2.918 | 2.198 |
| 8 | 2 | 1.5 | 1 | 23.386 | 17.694 | 4.866 |
| 9 | 2 | 1.5 | 1.5 | 80.327 | 49.917 | 5.825 |
| 10 | 4.5 | 0.5 | 0.5 | 54.191 | 27.038 | 15.012 |
| 11 | 4.5 | 0.5 | 1 | 25.058 | 11.761 | 12.456 |
| 12 | 4.5 | 0.5 | 1.5 | 22.084 | 13.555 | 7.587 |
| 13 | 4.5 | 1 | 0.5 | 71.137 | 56.358 | 30.079 |
| 14 | 4.5 | 1 | 1 | 57.161 | 43.878 | 26.995 |
| 15 | 4.5 | 1 | 1.5 | 67.904 | 49.604 | 23.196 |
| 16 | 4.5 | 1.5 | 0.5 | 34.317 | 14.978 | 9.712 |
| 17 | 4.5 | 1.5 | 1 | 32.775 | 6.361 | 7.397 |
| 18 | 4.5 | 1.5 | 1.5 | 57.629 | 14.994 | 3.562 |
| 19 | 7 | 0.5 | 0.5 | 81.937 | 78.524 | 23.114 |
| 20 | 7 | 0.5 | 1 | 22.043 | 38.353 | 15.094 |
| 21 | 7 | 0.5 | 1.5 | 0.000 | 16.891 | 5.358 |
| 22 | 7 | 1 | 0.5 | 100.534 | 99.423 | 37.131 |
| 23 | 7 | 1 | 1 | 55.350 | 61.722 | 29.203 |
| 24 | 7 | 1 | 1.5 | 31.913 | 43.630 | 20.046 |
| 25 | 7 | 1.5 | 0.5 | 65.080 | 49.581 | 16.987 |
| 26 | 7 | 1.5 | 1 | 30.102 | 17.057 | 9.589 |
| 27 | 7 | 1.5 | 1.5 | 22.479 | 2.152 | 0.679 |
| Network Name | * Performance | Error | Training Algorithm | Error Function | Hidden Activation | Output Activation | ||||
|---|---|---|---|---|---|---|---|---|---|---|
| Train. | Test. | Valid. | Train. | Test. | Valid. | |||||
| MLP 3-9-3 | 0.999 | 0.999 | 0.996 | 0.000 | 0.000 | 0.001 | BFGS 109 | SOS | Tanh | Identity |
| Cycle | ANN | ||
|---|---|---|---|
| OA | ESA | DMC | |
| Train | 0.9998 | 0.9998 | 0.9998 |
| Test | 0.9982 | 0.9996 | 0.9992 |
| Validation | 0.9986 | 0.9952 | 0.9953 |
| Parameter | 1 | 2 | 3 | 4 | 5 | 6 | 7 | 8 | 9 |
|---|---|---|---|---|---|---|---|---|---|
| pH | −1.068 | −0.323 | −0.083 | 0.230 | −2.201 | 0.032 | −0.884 | 0.167 | 1.270 |
| Spike | −1.149 | 0.633 | −0.772 | 0.726 | 0.839 | 0.427 | −1.067 | 0.395 | 1.346 |
| Injection volume | −0.238 | −0.263 | −1.160 | 0.327 | −0.076 | 0.410 | 0.021 | 1.377 | −0.234 |
| Bias | −0.004 | 1.774 | 1.308 | 1.461 | −0.355 | −1.575 | 1.942 | 1.776 | 0.123 |
| Outputs | 1 | 2 | 3 | 4 | 5 | 6 | 7 | 8 | 9 | Bias |
|---|---|---|---|---|---|---|---|---|---|---|
| OA | −0.859 | 0.895 | −0.261 | 0.306 | −0.398 | 0.943 | 0.315 | 0.263 | 0.541 | 0.706 |
| ESA | 0.812 | 0.215 | 0.202 | 0.866 | 0.509 | 0.889 | 1.207 | 0.976 | −0.651 | 0.041 |
| DMC | −1.444 | 1.071 | 0.435 | −1.391 | 1.047 | 1.060 | −0.442 | 0.216 | 0.910 | −0.174 |
| χ2 | RMSE | MBE | MPE | SSE | AARD | r2 | |
|---|---|---|---|---|---|---|---|
| OA | 1.601 | 1.242 | 0.029 | 1.996 | 41.615 | 20.436 | 0.998 |
| ESA | 1.505 | 1.204 | −0.311 | 4.397 | 36.509 | 25.356 | 0.998 |
| DMC | 0.348 | 0.579 | −0.212 | 5.429 | 7.829 | 10.814 | 0.997 |
| Skew | Kurt | Mean | StDev | Var |
|---|---|---|---|---|
| 0.654 | 3.548 | 0.029 | 1.265 | 1.601 |
| −2.648 | 10.016 | −0.311 | 1.185 | 1.404 |
| −2.798 | 9.483 | −0.212 | 0.549 | 0.301 |
| LOD OA = 0.036 µg/dm3 | LOD ESA = 0.042 µg/dm3 | LOD DMC = 0.045 µg/dm3 | ||||||||
|---|---|---|---|---|---|---|---|---|---|---|
| µg/dm3 | rsd. % | µg/dm3 | rsd. % | µg/dm3 | rsd. % | |||||
| Tisza | 1 | 0.680 ± 1.178 a | 0.96 | >LOD | 0.074 ± 0.078 a | 0.063 | >LOD | 1.477 ± 0.666 abc | 0.54 | >LOD |
| 2 | 1.485 ± 1.432 ab | 1.17 | >LOD | 0.047 ± 0.052 a | 0.043 | >LOD | 1.050 ± 0.677 ab | 0.55 | >LOD | |
| 3 | 0.662 ± 1.146 a | 0.94 | >LOD | 0.009 ± 0.015 a | 0.012 | <LOD | 1.081 ± 0.800 abc | 0.65 | >LOD | |
| 4 | 0.546 ± 0.946 a | 0.77 | >LOD | 0.298 ± 0.320 a | 0.261 | >LOD | 0.963 ± 0.774 a | 0.63 | >LOD | |
| 5 | 2.900 ± 1.238 ab | 1.01 | >LOD | 0.012 ± 0.011 a | 0.009 | <LOD | 3.605 ± 1.950 bc | 1.59 | >LOD | |
| 6 | 1.687 ± 0.432 ab | 0.35 | >LOD | 0.004 ± 0.007 a | 0.006 | <LOD | 2.578 ± 1.034 abc | 0.84 | >LOD | |
| 7 | 1.739 ± 1.506 ab | 1.23 | >LOD | 0.007 ± 0.006 a | 0.005 | <LOD | 3.691 ± 2.239 c | 1.83 | >LOD | |
| 8 | 4.592 ± 2.579 b | 2.11 | >LOD | 26.027 ± 11.884 b | 9.703 | >LOD | 2.135 ± 1.001 abc | 0.82 | >LOD | |
| 9 | Bdl | Bdl | <LOD | 0.043 ± 0.075 a | 0.06 | <LOD | 0.599 ± 0.175 a | 0.14 | >LOD | |
| 10 | Bdl | Bdl | <LOD | Bdl | Bdl | <LOD | 1.020 ± 0.311 ab | 0.25 | >LOD | |
| Minimum concentration | 0.55 µg/dm3 | 0.004 µg/dm3 | 0.60 µg/dm3 | |||||||
| Maximum concentration | 4.59 µg/dm3 | 0.3 µg/dm3 | 3.69 µg/dm3 | |||||||
| Average value | 1.43 µg/dm3 | 0.08 µg/dm3 | 1.82 µg/dm3 | |||||||
| Danube | 11 | Bdl | Bdl | <LOD | Bdl | Bdl | <LOD | 1.120 ± 0.090 abc | 0.07 | >LOD |
| 12 | Bdl | Bdl | <LOD | Bdl | Bdl | <LOD | 0.947 ± 0.245 a | 0.20 | >LOD | |
| 13 | 1.966 ± 0.302 ab | 0.25 | >LOD | Bdl | Bdl | <LOD | 0.823 ± 0.431 a | 0.35 | >LOD | |
| 14 | 0.818 ± 1.417 a | 1.16 | >LOD | Bdl | Bdl | <LOD | 0.915 ± 0.596 a | 0.49 | >LOD | |
| 15 | 2.562 ± 0.999 ab | 0.82 | >LOD | Bdl | Bdl | <LOD | 0.704 ± 0.223 a | 0.18 | >LOD | |
| 16 | 3.230 ± 1.713 ab | 1.40 | >LOD | Bdl | Bdl | <LOD | 0.702 ± 0.363 a | 0.30 | >LOD | |
| 17 | 1.705 ± 1.479 ab | 1.21 | >LOD | Bdl | Bdl | <LOD | 0.198 ± 0.103 a | 0.08 | >LOD | |
| 18 | 1.993 ± 0.729 ab | 0.60 | >LOD | Bdl | Bdl | <LOD | 0.213 ± 0.068 a | 0.06 | >LOD | |
| 19 | 1.272 ± 1.119 ab | 0.91 | >LOD | Bdl | Bdl | <LOD | 0.202 ± 0.134 a | 0.11 | >LOD | |
| 20 | 1.527 ± 1.593 ab | 1.30 | >LOD | 0.005 ± 0.009 a | 0.008 | <LOD | 0.461 ± 0.484 a | 0.40 | >LOD | |
| Minimum concentration | 0.82 µg/dm3 | 0.01 µg/dm3 | 0.20 µg/dm3 | |||||||
| Maximum concentration | 3.23 µg/dm3 | 0.01 µg/dm3 | 1.12 µg/dm3 | |||||||
| Average value | 1.51 µg/dm3 | 0.01 µg/dm3 | 0.63 µg/dm3 | |||||||
| Priority Hazardous Substance | Numeric Identification (CAS No.) | Average Annual Concentration (µg/L) | Maximum Permissible Concentration (µg/L) |
|---|---|---|---|
| Atrazine | 1912-24-9 | 0.6 | 2.0 |
| Cyclodiene pesticides: Aldrin Dieldrin Endrin Isodrin | 309-00-02 60-57-1 72-20-8 465-73-6 | Sum 0.01 | / |
| Total DDT | / | 0.025 | / |
| Para-para DDT | 50-29-3 | 0.01 | / |
| Endosulfan | 115-29-7 | 0.005 | 0.01 |
| Simazine | 122-34-9 | 1 | 4 |
| Trifluralin | 1582-09-8 | 0.03 | / |
Publisher’s Note: MDPI stays neutral with regard to jurisdictional claims in published maps and institutional affiliations. |
© 2022 by the authors. Licensee MDPI, Basel, Switzerland. This article is an open access article distributed under the terms and conditions of the Creative Commons Attribution (CC BY) license (https://creativecommons.org/licenses/by/4.0/).
Share and Cite
Ćurčić, L.; Lončar, B.; Pezo, L.; Stojić, N.; Prokić, D.; Filipović, V.; Pucarević, M. Chemometric Approach to Pesticide Residue Analysis in Surface Water. Water 2022, 14, 4089. https://doi.org/10.3390/w14244089
Ćurčić L, Lončar B, Pezo L, Stojić N, Prokić D, Filipović V, Pucarević M. Chemometric Approach to Pesticide Residue Analysis in Surface Water. Water. 2022; 14(24):4089. https://doi.org/10.3390/w14244089
Chicago/Turabian StyleĆurčić, Ljiljana, Biljana Lončar, Lato Pezo, Nataša Stojić, Dunja Prokić, Vladimir Filipović, and Mira Pucarević. 2022. "Chemometric Approach to Pesticide Residue Analysis in Surface Water" Water 14, no. 24: 4089. https://doi.org/10.3390/w14244089
APA StyleĆurčić, L., Lončar, B., Pezo, L., Stojić, N., Prokić, D., Filipović, V., & Pucarević, M. (2022). Chemometric Approach to Pesticide Residue Analysis in Surface Water. Water, 14(24), 4089. https://doi.org/10.3390/w14244089