Abstract
This paper represents the first regional-scale investigation in the Piedmont Po plain about the relationship between groundwater temperature (GWT) and climate variability. The understanding of relationships between air temperature (AT) and GWT is really important, especially in the context of global climate change. The aim of this investigation is to study the relationship between GWT and AT over a 10-year time period (from 2010 to 2019) to analyse how these two parameters interrelate and to evaluate possible trends. To carry out this study, basic statistic interpolations were performed on both parameters to facilitate comparison. Both AT and GWT showed an increase over the observed decade with a more pronounced growth of the AT; this allow to state that GWT is more resilient to climate change than AT. However, some areas in the Piedmont plain showed a behaviour that partially deviated from the standard trend observe for the majority of the region. These areas were influenced by particular anthropic factors (for example the paddy fields in the Novara plain) or natural elements (as the monitoring wells in the “Canavese” area, located downstream of melting glaciers, or the wells located close to the Tanaro River). Moreover, this study wanted to stress the importance of the knowledge of the localization in wells of the instruments for the GWT measurement, to have the most accurate and comparable data. It was proved that as the depth increased, the maximum and minimum peaks of the GWT shifted in time respect to the maximum and minimum peaks of the AT, and, in addition, the GWT fluctuation in the bottom part of the aquifer was milder than the fluctuation observed in the most superficial part. Further investigations will be conducted in future in Piedmont plain areas with different behavior, in order to better understand their dynamics and the factors that may influence GWT and how they are affected by climate change.
1. Introduction
In the 20th century the number of towns and cities dependent from groundwater (GW) was continuously increasing [1] and GW has become an essential resource to support the constant development of mankind [1,2]. Groundwater withdrawals in 2010 are estimated to have reached 900 km3/y and, in varying proportions by country, 36% was used for water-supply, 42% for agricultural purposes and 24% for industrial use [1]. Although, actually, only few countries publish water use data on a regular basis by sector [3].
In literature, it’s recognized that a global climate change is taking place [4] and this could affect the hydrologic cycle [5,6,7,8,9], leading to an increase in temperatures and a variation in precipitation regime, also affecting GW all over the world [10,11,12,13,14,15,16,17,18]. Moreover, it is reported that the period 2015–2019 was the warmest period ever registered globally [19,20]. Consequently, the understanding of how GW are influenced by climate change [21,22] is becoming more and more important. Indeed, GW can mitigate periods of drought because larger aquifers are potentially less stressed by climate variability than surface water [23], and so they reduce the risk of temporary water shortage [2,24,25].
It is also known that GW temperature (GWT) responds rapidly to climate variations [26,27,28], and especially the shallow aquifers are influenced by the air and ground surface temperatures, that are directly linked to different land uses and climate change [28,29]. These factors make the aquifers (especially the shallow ones) and the GW-dependent ecosystems vulnerable to future climate scenarios [6,11]. Moreover, it is also highlighted how the variations of GWT really affects the ecosystems in GW dominated wetlands [14].
In Italy there are only few studies conducted on this topic. One of them [30] analyses an unconfined aquifer in the Campanian plain (Southern Italy) and shows a clear correlation between the mean minimum air temperature (AT) and the mean minimum GWT. Also, in a recent study it was observed that the temperature of Alpine springs of the NW Alps of the Piedmont region increased in the last decade in relation to climate change [31].
The aim of this study is to evaluate how the climate change affects the GWTs in Piedmont Po plain (NW Italy). The importance of GW in Piedmont plain is linked to the fact that about 85% of the total GW extracted is used for human consumption [32]. The analysis was conducted by the evaluation and comparison through a statistical approach of the AT and the GWT for a period of 10 years (from 2010 to 2019). Trend analyses were carried out on the two studied parameters (AT and GWT) in order to observe how they behave individually and also to be able to analyse the relationships that exist between them.
A study of AT trends over the past 60 years has already been carried out in the study area [33], which showed an increasing trend. With this work, the aim is to deepen this study and also compared data with the GWT trend.
Moreover, the study stresses the importance of a correct location of the instruments for the GWT measure, to have accurate and comparable data.
2. Study Area
2.1. Geological and Hydrogeological Setting
Piedmont is located in the north-western Italy and covers an area of almost 25,000 km2. The Piedmont Po plain represents the 27% of the whole region and is bordered by the Alps to the north and east, and the Apennines to the south [34]. Because it is bounded on three sides by mountain ranges, the Piedmont Po plain is the meeting point for continental currents from the Po Valley, moisture from the Mediterranean Sea and Atlantic currents from the NW that interact with the Alpine foothills. These characteristics favour the presence of different microclimates that make this territory unique [35].
From a geological point of view, the Piedmont Po plain consists, from top to bottom (Figure 1), by Quaternary Alluvial deposits (lower Pleistocene-Holocene), that host a shallow unconfined aquifer, the Villafranchiano transitional deposits (late Pliocene-early Pleistocene), that host a multi-layered aquifer and Pliocenic marine deposits (Pliocene), hosting a confined aquifer [34,36]. For these features and its size the Piedmont Po plain is considered the most important GW reservoir of the Piedmont region [34,37,38].
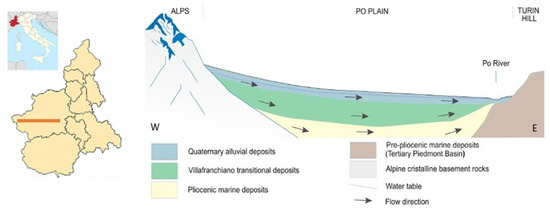
Figure 1.
Sketch of a W-E cross-section of the hydrogeological complexes of the Po Plain (modified from [34]). The red line highlights the localization of the cross-section.
More details of the hydrogeological setting of the study area can be found in [34].
This study was conducted on the shallow unconfined aquifer, hosted in the Quaternary alluvial deposits, which has a thickness between 20 and 50 m and is characterised by high hydraulic conductivity (K = 5 × 10⁻³/5 × 10−4 m/s). This aquifer consists of coarse gravels and sands of fluvial or fluvioglacial origin, with minor intercalations of silty clay [34]. These fluvial deposits are connected to the ancient river courses of Po and Tanaro [39]. At the base of the shallow aquifer locally thick and continuous layers of silt or clay rich deposits are present, that represent the separation between the shallow aquifer and the deep aquifers [40].
2.2. GW Thermal Model of the Piedmont Plain
The GW thermal conceptual model of the shallow aquifer of the Piedmont Po plain has been conceptualized based on previous researches [26,31,34,41].
The annual distribution of GWT in the shallow aquifer is usually characterised by a maximum in autumn and a minimum in spring [26,41]. This behaviour reflects with a short time delay the AT distribution [26] that shows a mean maximum in July (28.5 °C) and a mean minimum in January (−0.8 °C) over the period 1958–2009 [42].
Moreover, GWT varied in depth, depending of the analysed season [43,44]. This variation occurs up to a surface called ‘constant temperature surface’ located at a depth of about 25 m from the earth surface. Then GWT remains constant between 25 and 50 m. At a depth of 50 m there is a second surface called ‘geothermal constant temperature surface’ from which GWT tends to increase due to the geothermal potential. In addition, as the depth increases, the maximum and minimum peaks of the GWT shift, moving respectively from autumn to winter and from spring to summer. [26,28]. Moreover, a statistical elaboration [26] in a small portion of the study area of this paper highlights that with increasing depth in aquifer, the amplitude of GWT fluctuation (difference between annual GWT mean maximum and annual GWT mean minimum) is milder than the fluctuation observed in the shallowest part of the aquifer.
3. Materials and Methods
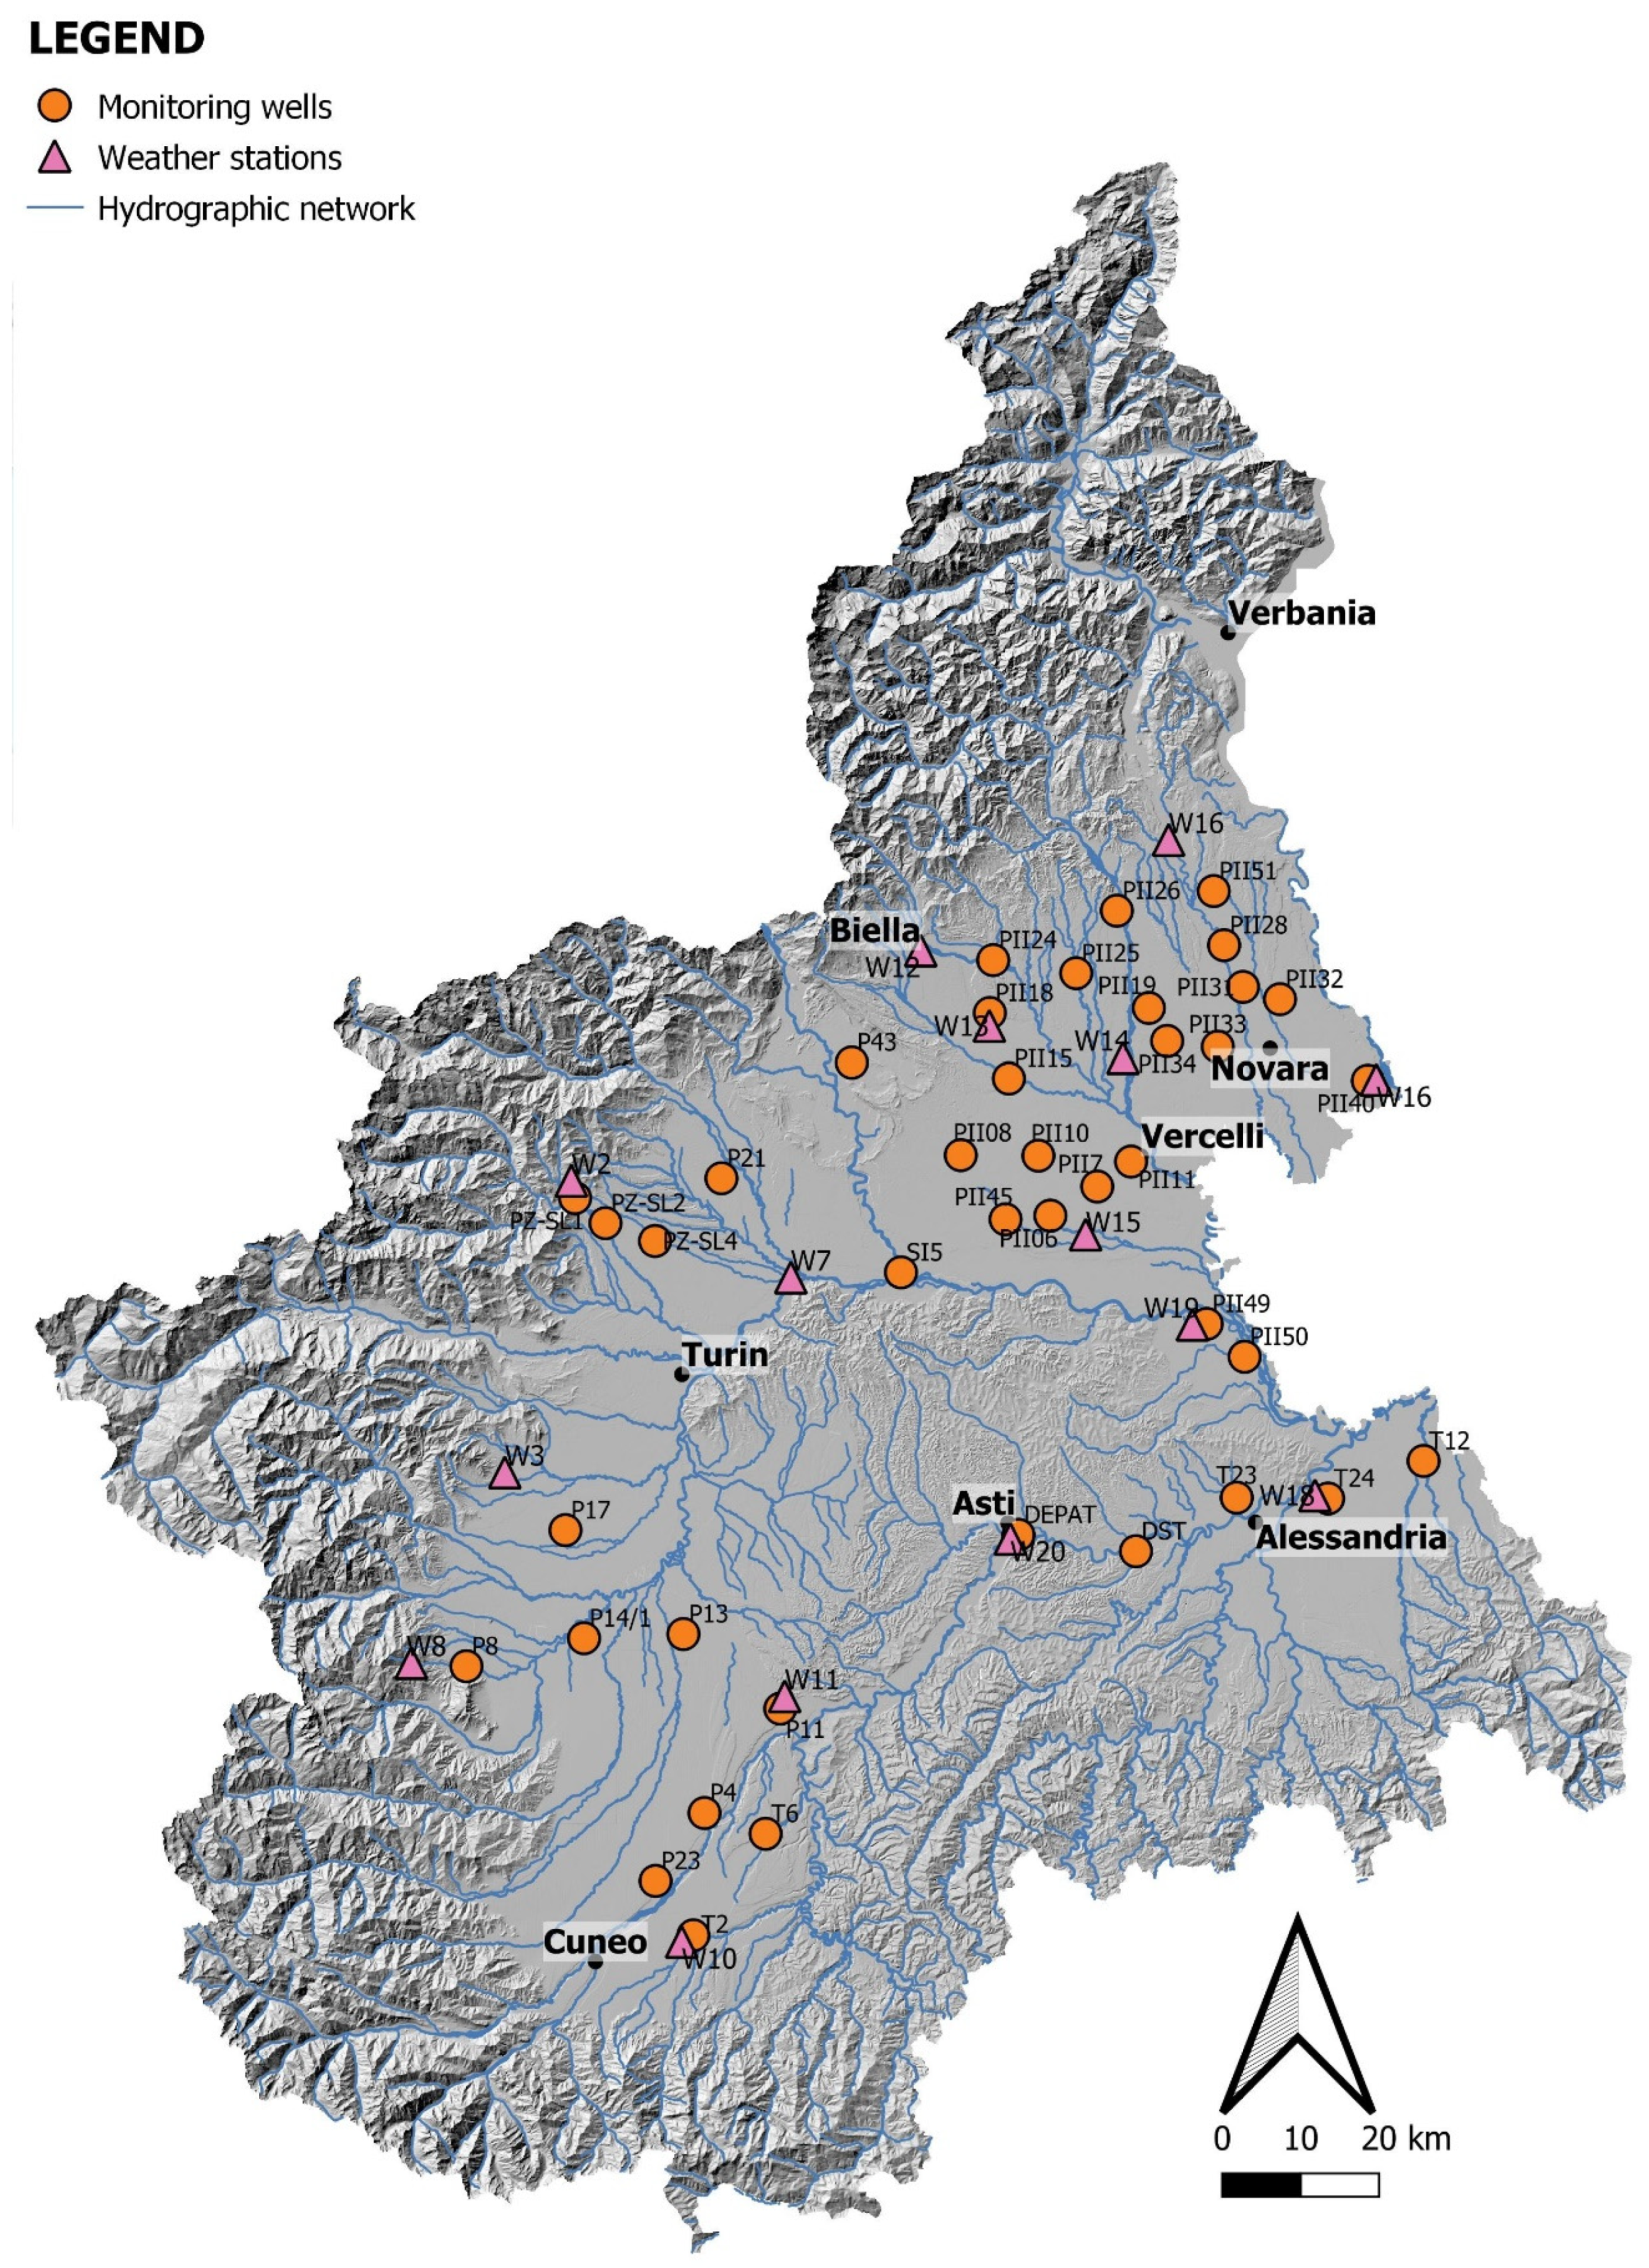
For this research, 41 monitoring wells in the shallow aquifer and 20 weather stations were selected throughout the Piedmont Po plain area (Figure 2).

Figure 2.
Map of the Piedmont region with the localization of the 41 monitoring wells and the 20 weather stations used for the study.
The monitoring wells are equipped with the GW data logger OTT Orpheus Mini (OTT Hydromet GmbH, Loveland, CO, USA) for the measure of the water table and the GWT (resolution temperature: 0.1 °C; accuracy temperature: ±0.5 °C), positioned between 7 and 20 m from the topographic surface. All of the monitoring wells are screened in the shallow aquifer of the Piedmont Po plain. The GWTs in the 41 monitoring wells have been downloaded from the GREASE database of Regione Piemonte [45]. The most of the GWTs data start from January 2010 and end in December 2019, and consequently the decade 2010–2019 was analysed. Only for 6 of the 41 monitoring wells the observed period is reduced to the interval 2013–2019 as the database only contains data for this time interval.
The same time period has been analysed for the weather stations. The data of the AT are available from the MeteoWeb app [46]. The studied 20 weather stations have been selected in order to cover uniformly the territory of the Piedmont Po plain as best as possible.
The available GWT data are from measurements taken 3 times a day (8 a.m., 4 p.m., 12 p.m.); the AT data, on the other hand, are single daily measurements. For both, it was decided to use the monthly mean value and the annual mean value for data processing.
The data from the weather stations are complete and present measurements for all months of the studied period; instead, the GWT data are not always complete since some wells show periods in which measurements are not present. Consequently, the completeness index (CI) [47] of each well was calculated in the observed period (2010–2019 or 2013–2019), according to the equation:
Only wells with CI ≥ 75% were selected for the study.
At first, temperature data and their variation over the observed time period were plotted for both GWT and AT data. These graphs were then studied to observe the maximum and minimum temperature peaks and the seasonal trends.
To correlate the GWT and AT data, the Voronoi polygon method [48,49] was used on the QGis software (version 3.16 Hannover). The Voronoi polygons were centered on weather stations, to match the monitoring wells to the weather stations and to better understand the relationship between GWT and AT.
Subsequently the GWT and AT data were both studied with basic statistical analysis (mean, maxima, minima) to make a statistical assessment of temporal variations in temperature data. These statistics were also processed in order to observe the annual GWT variability measured by subtracting the data referred to day that registered the absolute minimum GWT from the data referred to day that registered the absolute maximum GWT of each year.
After, the non-parametric methods of the Mann-Kendall [50,51] and Theil-Sen [52] were used to assess the trends and the slopes of the monthly mean of GWT and AT. These tests, calculated on the ProUCL 5.1 software (United States Environmental Protection Agency, Washington, DC, USA) [53], were chosen because they both allow non-parametric analysis and they are largely used in study in the field of water resource and climate [54,55,56].
4. Results and Discussion
4.1. Qualitative Analysis
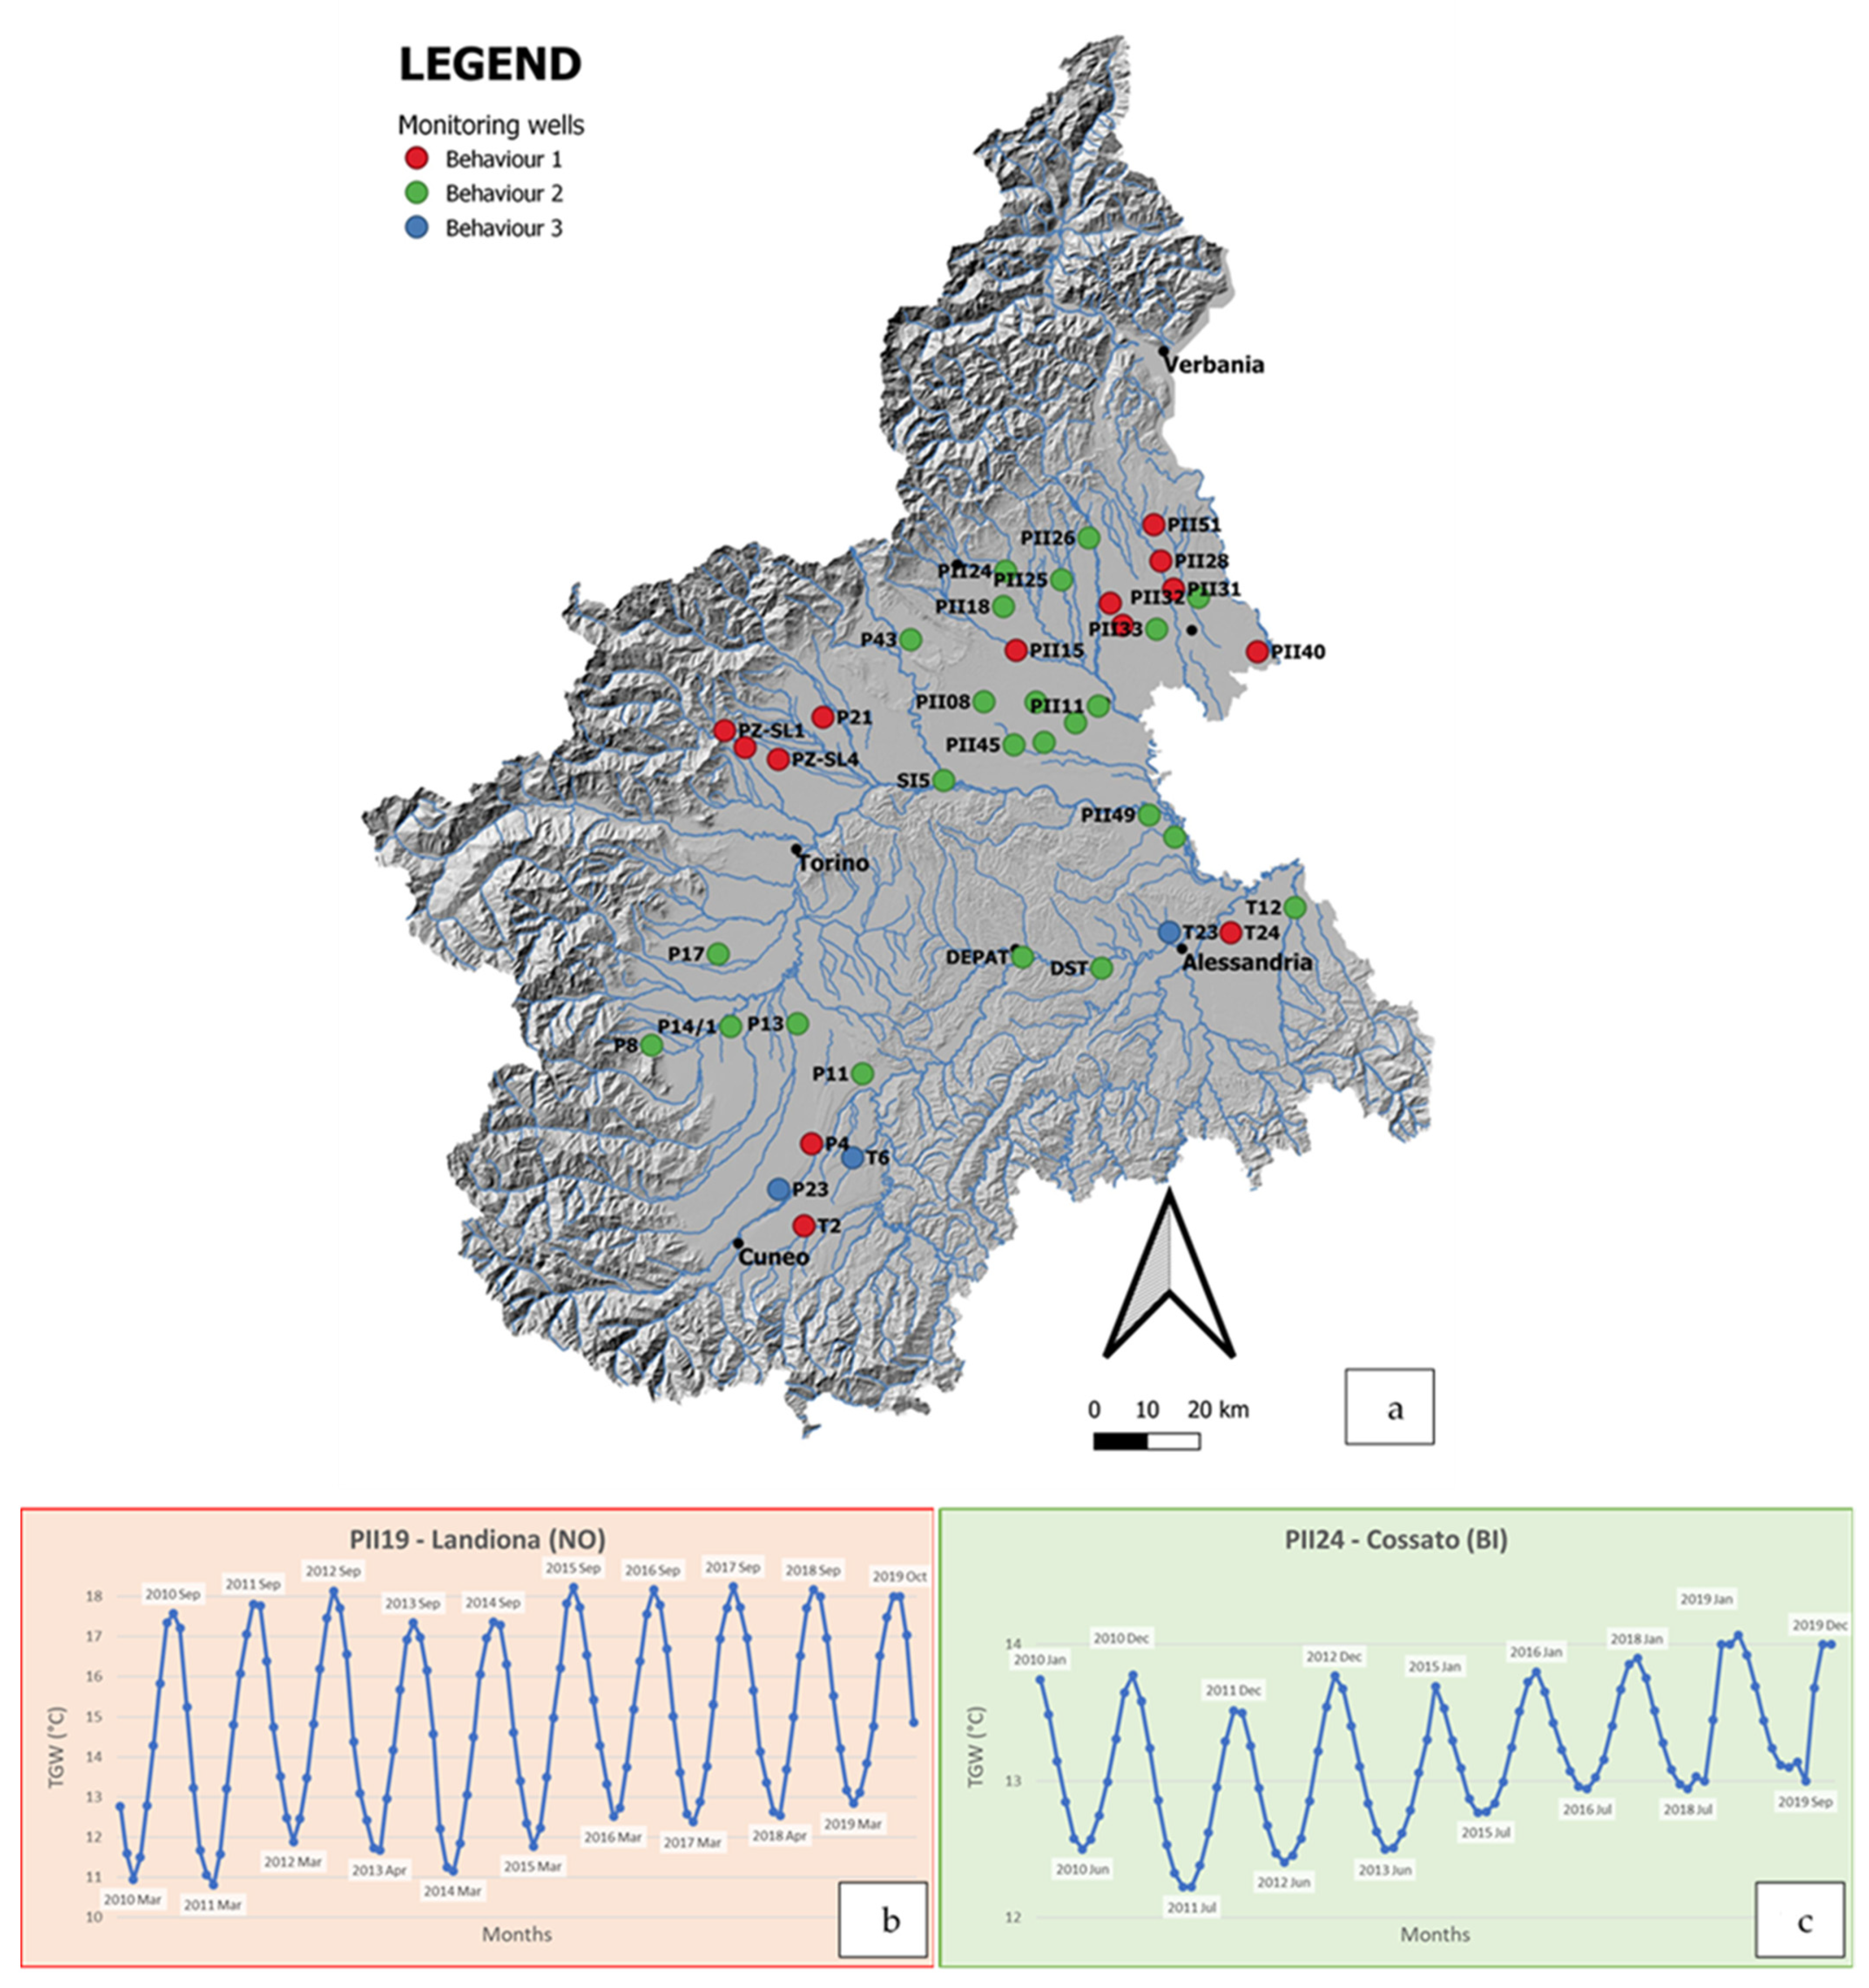
During the qualitative analysis conducted on the GWT time-plots, three families of wells were recognised, concerning the period of maximum and minimum temperature peaks (Figure 3). The first family, in red in the Figure 3a, has a maximum temperature peak in autumn (September–October) and a minimum in spring (March) (behaviour 1) (Figure 3b). The second group, in green in the Figure 3a, has a maximum in winter (December–January) and a minimum in summer (July) (behaviour 2) (Figure 3c). A third group, in blue in Figure 3a, was also identified, characterising only 3 wells, in which there is a variable behaviour that cannot be categorised into either of the two families described above (behaviour 3). More specifically, two of these wells (T23, T6) cyclically have a maximum peak in winter and a minimum in spring; the third (P23) has a maximum in spring and a minimum in winter.
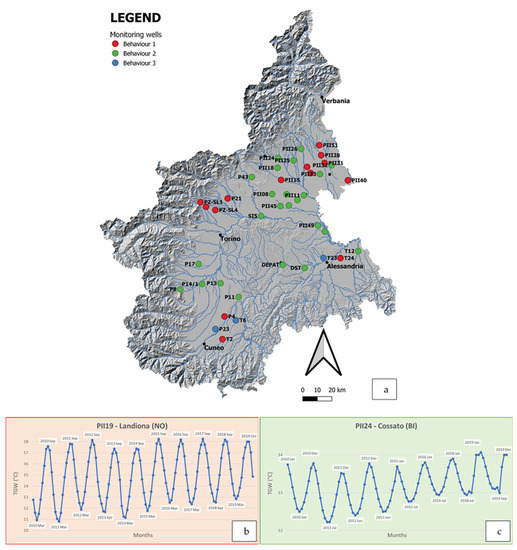
Figure 3.
Maximum and minimum GWT peak behaviours throughout the whole Piedmont Po plain. (a): distribution of the monitoring wells highlighting different behaviours. (b): example of behaviour 1 (maximum in autumn and minimum in spring). (c): example of behaviour 2 (maximum in winter and minimum in summer).
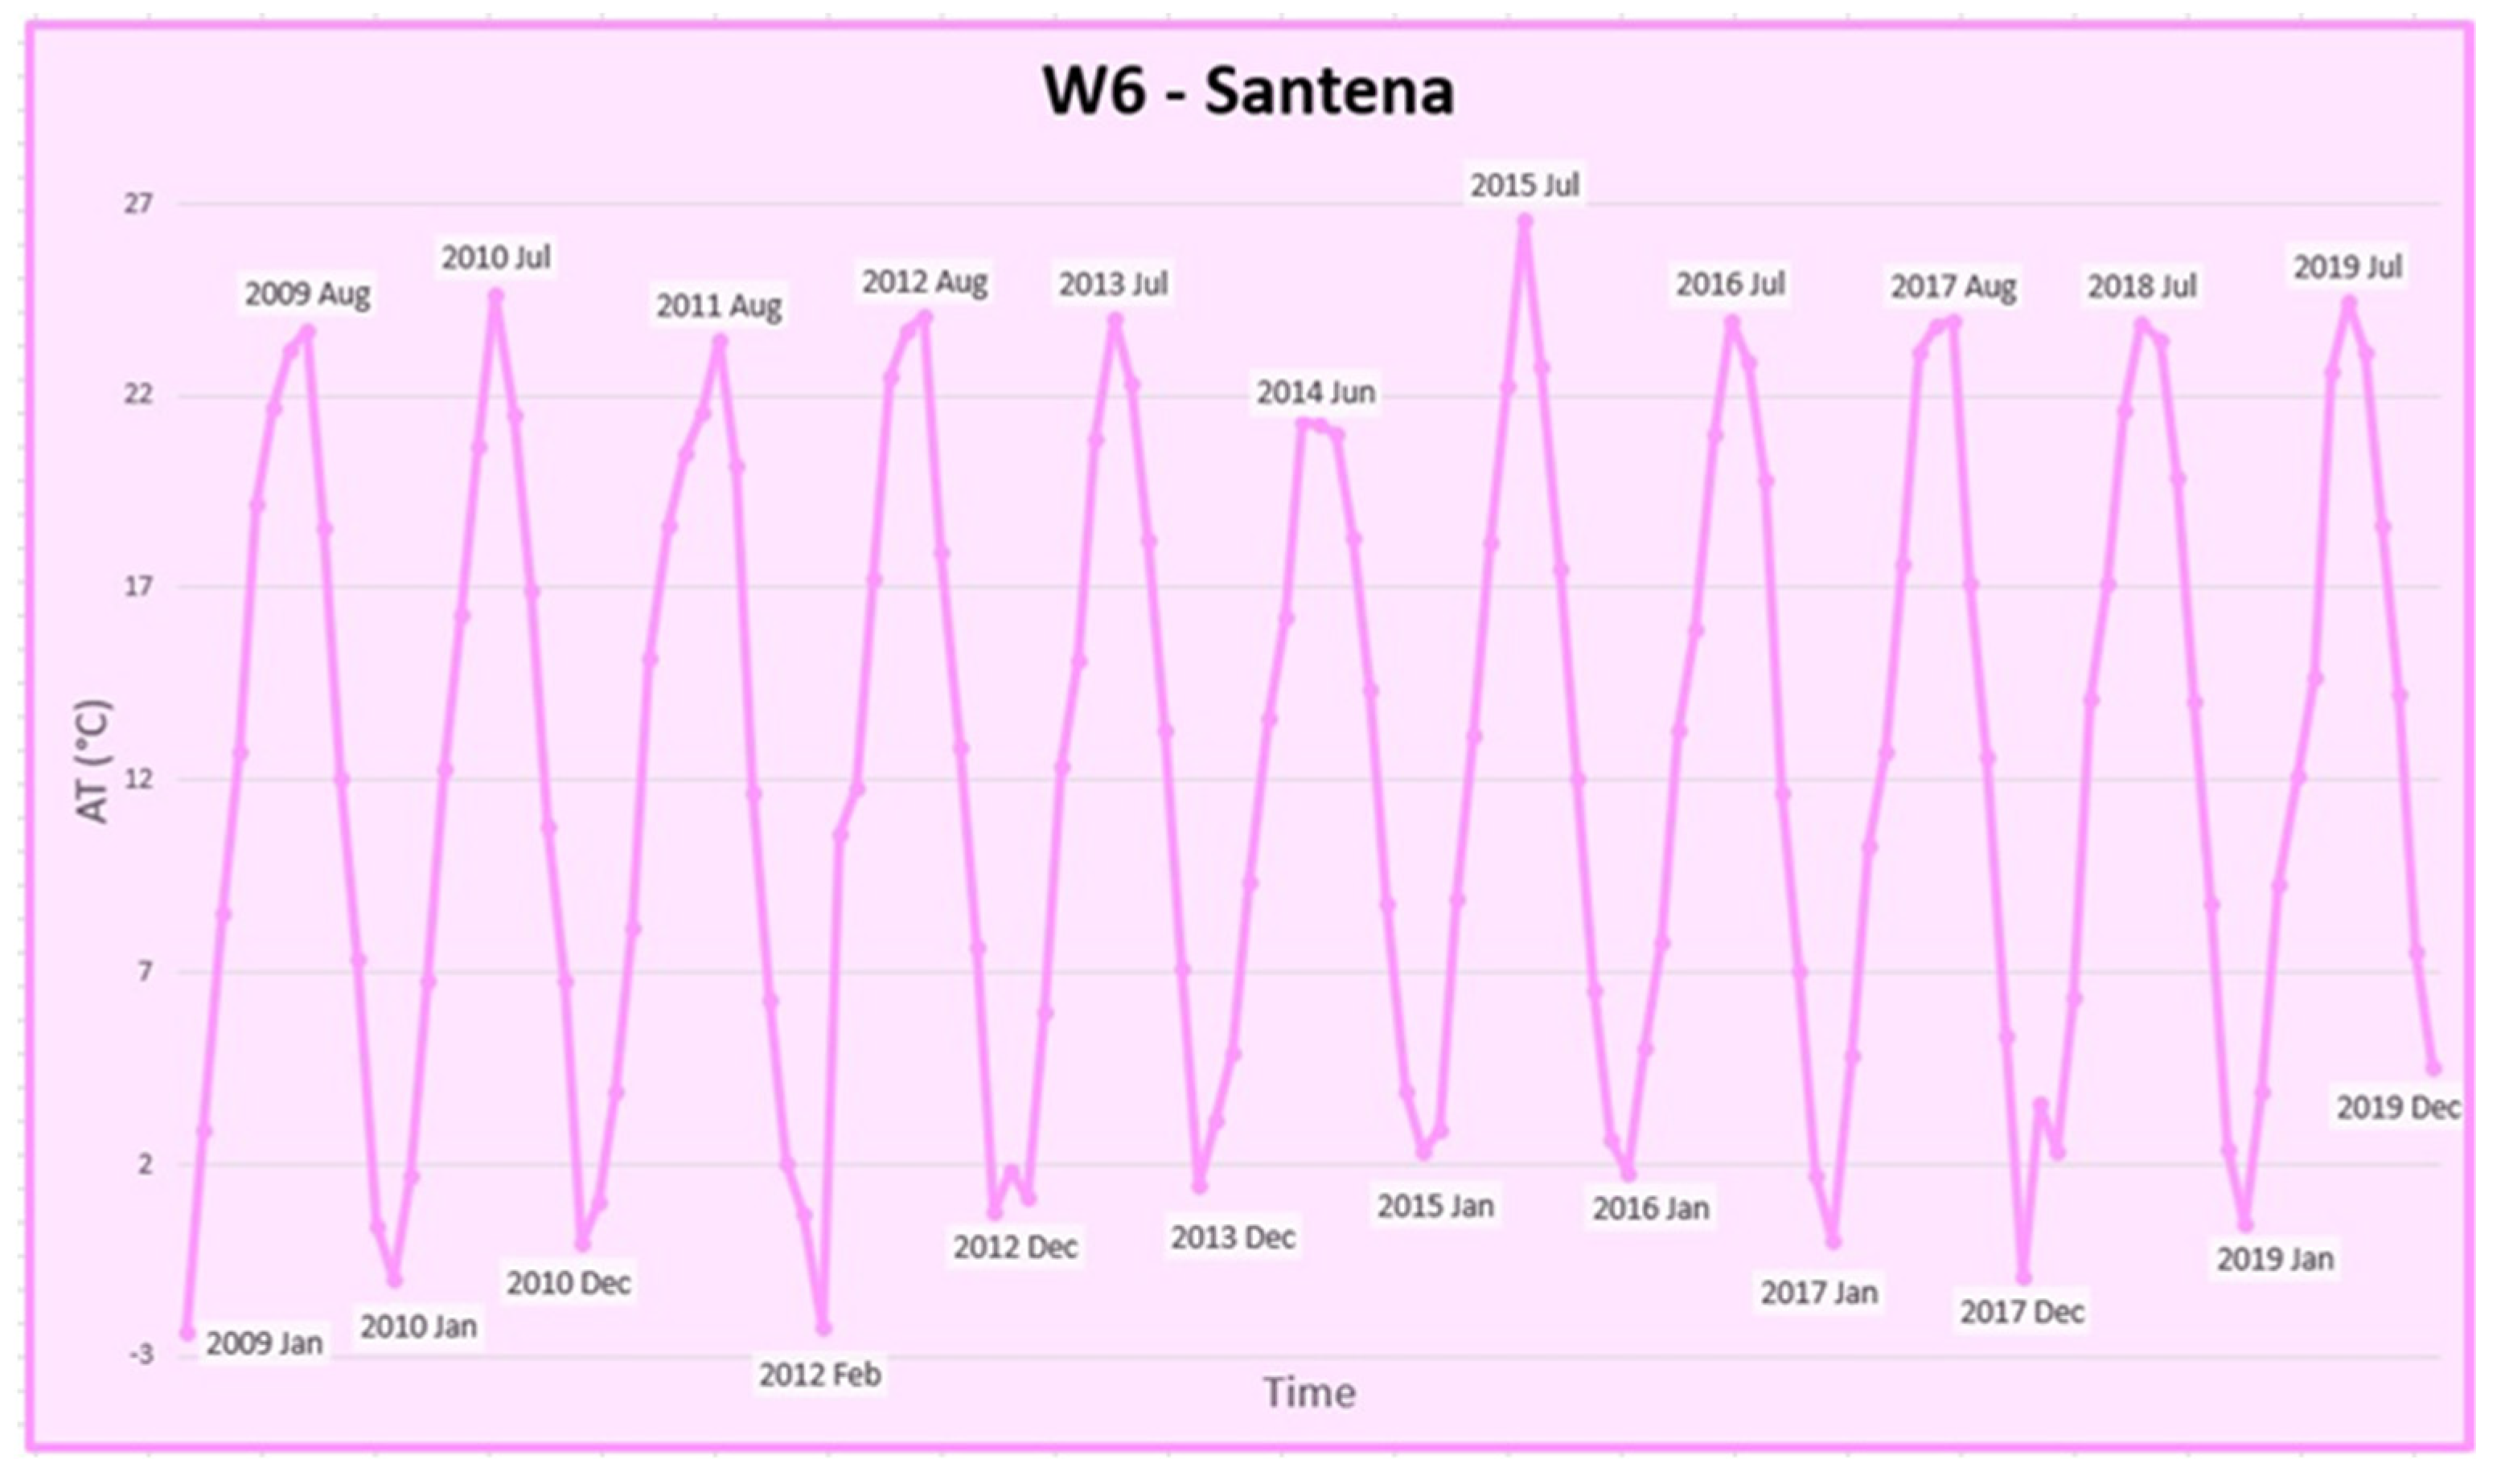
As far as AT is concerned, it has been observed that for all the analysed weather stations there is a summer maximum (mainly in July) and a winter minimum (mainly in January) as expected (Figure 4).
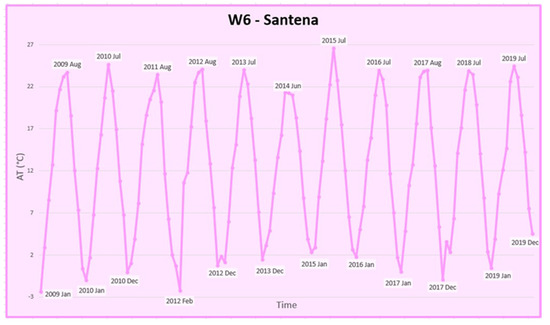
Figure 4.
Example of maximum and minimum AT peak behaviour observed in the weather stations.
4.2. Statistical Analysis
To make a statistical assessment of temperature data for both GWT and AT, it was calculated the monthly mean, the monthly absolute maximum, the monthly absolute minimum and the standard error. The results, averaged over all the years observed, are shown in Table 1 and Table 2 respectively.

Table 1.
Summary of monthly mean statistical data for GWT (mean, mean absolute maximum, mean absolute minimum and standard error) for the observed monitoring wells.
Table 2.
Summary of statistical data for AT (mean, mean absolute maximum, mean absolute minimum and standard error) for the observed weather stations.
The regional distribution of mean monthly GWTs and ATs varied respectively between 12.3 and 17.3 °C and between 7.7 and 14.0 °C.
The regional distribution of monthly absolute maxima varied between 14.0 and 22.0 °C for GWT and between 12.4 and 20.1 °C for AT.
The regional distribution of monthly absolute minima varied between 6.8 and 15.6 °C for GWT and between 4.0 and 10.2 °C for AT.
As far as GWTs are concerned, the maximum temperatures are recorded in the provinces of Turin and Vercelli, as shown in Table 1; with regard to ATs, as is to be expected, the maximum temperatures are recorded in the larger urban centres within the study area.
4.3. Non Parametric Test Analysis
Mann-Kendall and Theil-Sen methods allowed to quantify the time series data trend and to better understand how the temperature (both AT and GWT) vary in the observed time period (Table 3 and Table 4).
Table 3.
Nonparametric test analysis results for AT.
Table 4.
Non-parametric tests analysis results about GWT.
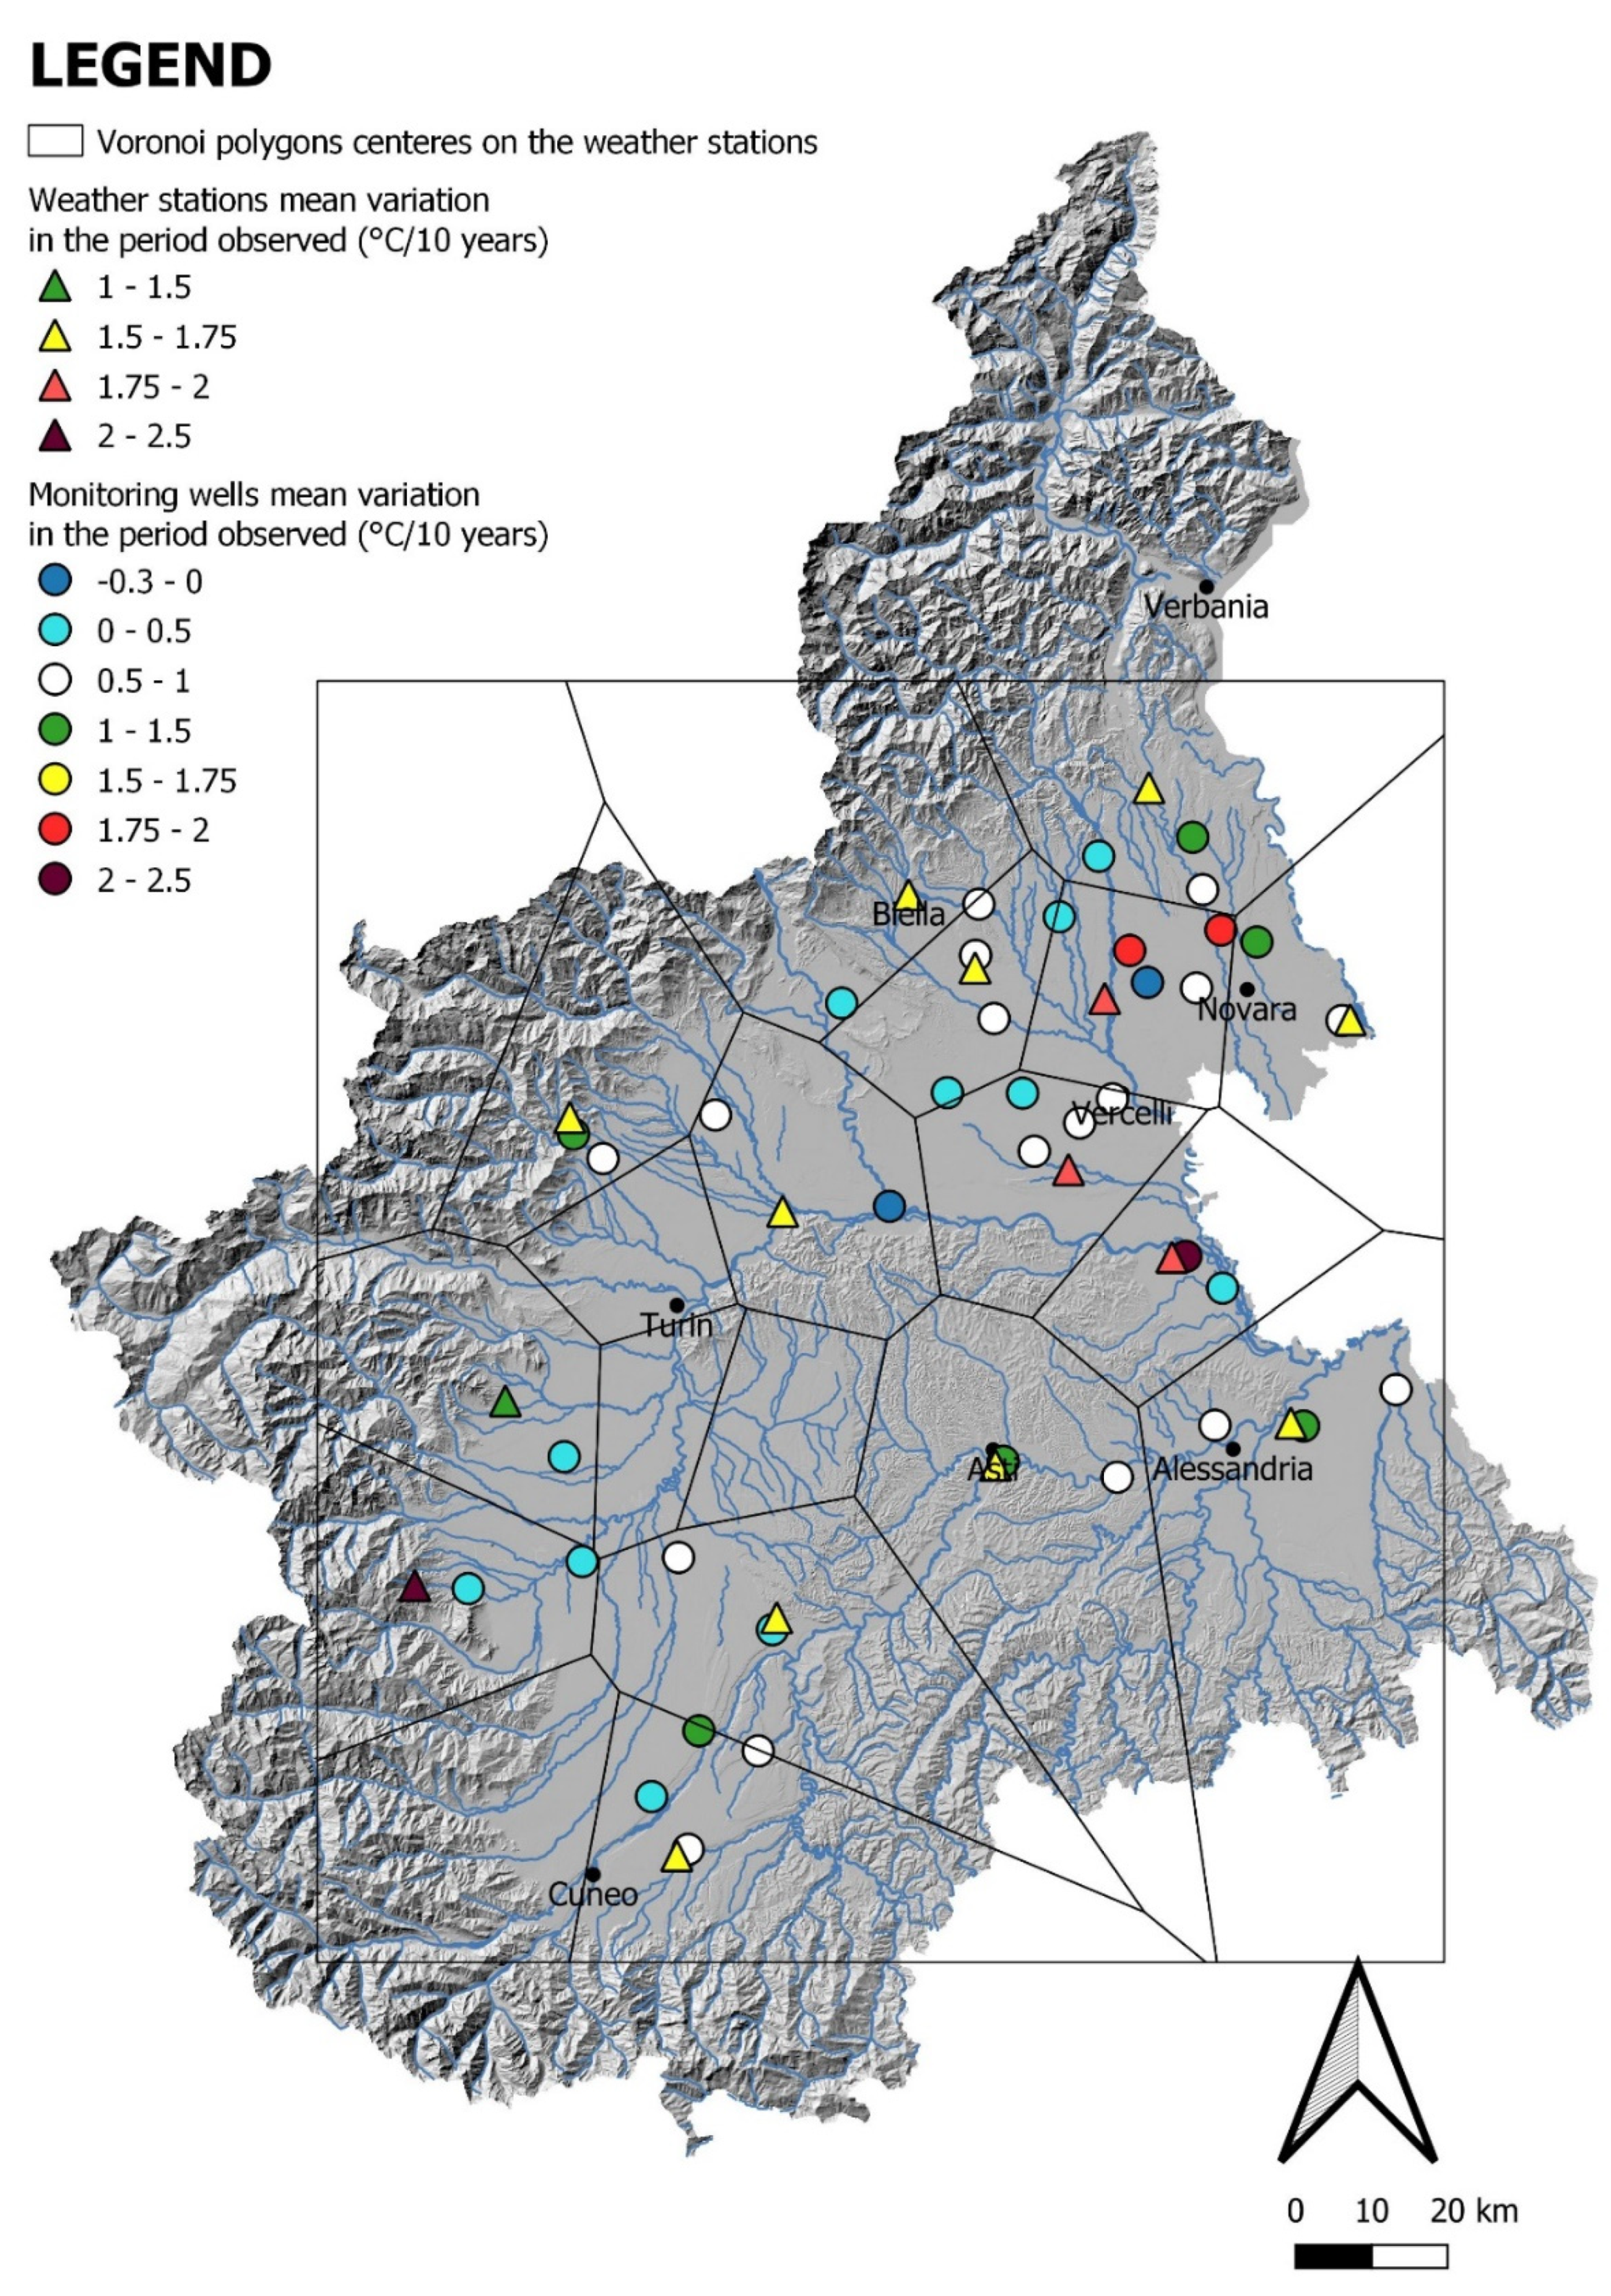
With regard to AT all the weather stations had shown an increasing trend and, moreover, it is possible to observe a variation in annual mean AT over the period 2010–2019 ranging between 1.7 and 2.2 °C/10 years (Figure 5).

Figure 5.
Mean variation of ATs (triangles) and GWTs (rounds) in the entire observed period (2010–2019) and Voronoi polygons, centered on weather station used to match the monitoring wells to the weather stations.
Furthermore, also annual mean GWT generally shows a variation in the period 2010–2019 between −0.3 and 2.1 °C/10 years (Figure 5).
The trends, processed with the ProUCL statistical software, show that, as far as the monthly average GWTs data are concerned, most of the monitoring wells (34) show a statistically significant positive trend with a level of significance 0.05. With regard to the remainder, 6 of these (PII34, PII10, PII26, PZ-SL2, PZ-SL4, SI5) do not have a statistically significant trend, but still show an increase in temperature over time, and only 1 monitoring well (PII45) is characterised by a statistically significant negative trend.
Observing the geographical position of these 7 monitoring wells with no statistically significant positive trend, it is possible to note that they are concentrated within the provinces of Vercelli and Turin. This behaviour is hypothesised to be linked to the particular nature of the two areas. In fact, the first one, the province of Vercelli, is characterised by the presence of a large quantity of rice fields, which therefore, due to the nature of the agricultural method, could have influenced the GWTs data.
As far as the province of Turin is concerned, on the other hand, this behaviour is thought to be linked to the fact that most of the monitoring wells located in the territory are in correspondence with the area called “Canavese” area. These monitoring wells are located downstream to mountain areas with glaciers, so this behavior could be linked with the glacial melting of the Lanzo valley glaciers due to climate change, of which there are several testimonies in the literature [57].
Through the comparison between GWT and AT, using the Voronoi polygons (Figure 5), it was possible to highlight that in most cases (37 on 41, 90% of the analysed couples of temperature data) there is a greater increase in the monthly mean AT than in the monthly mean GWT.
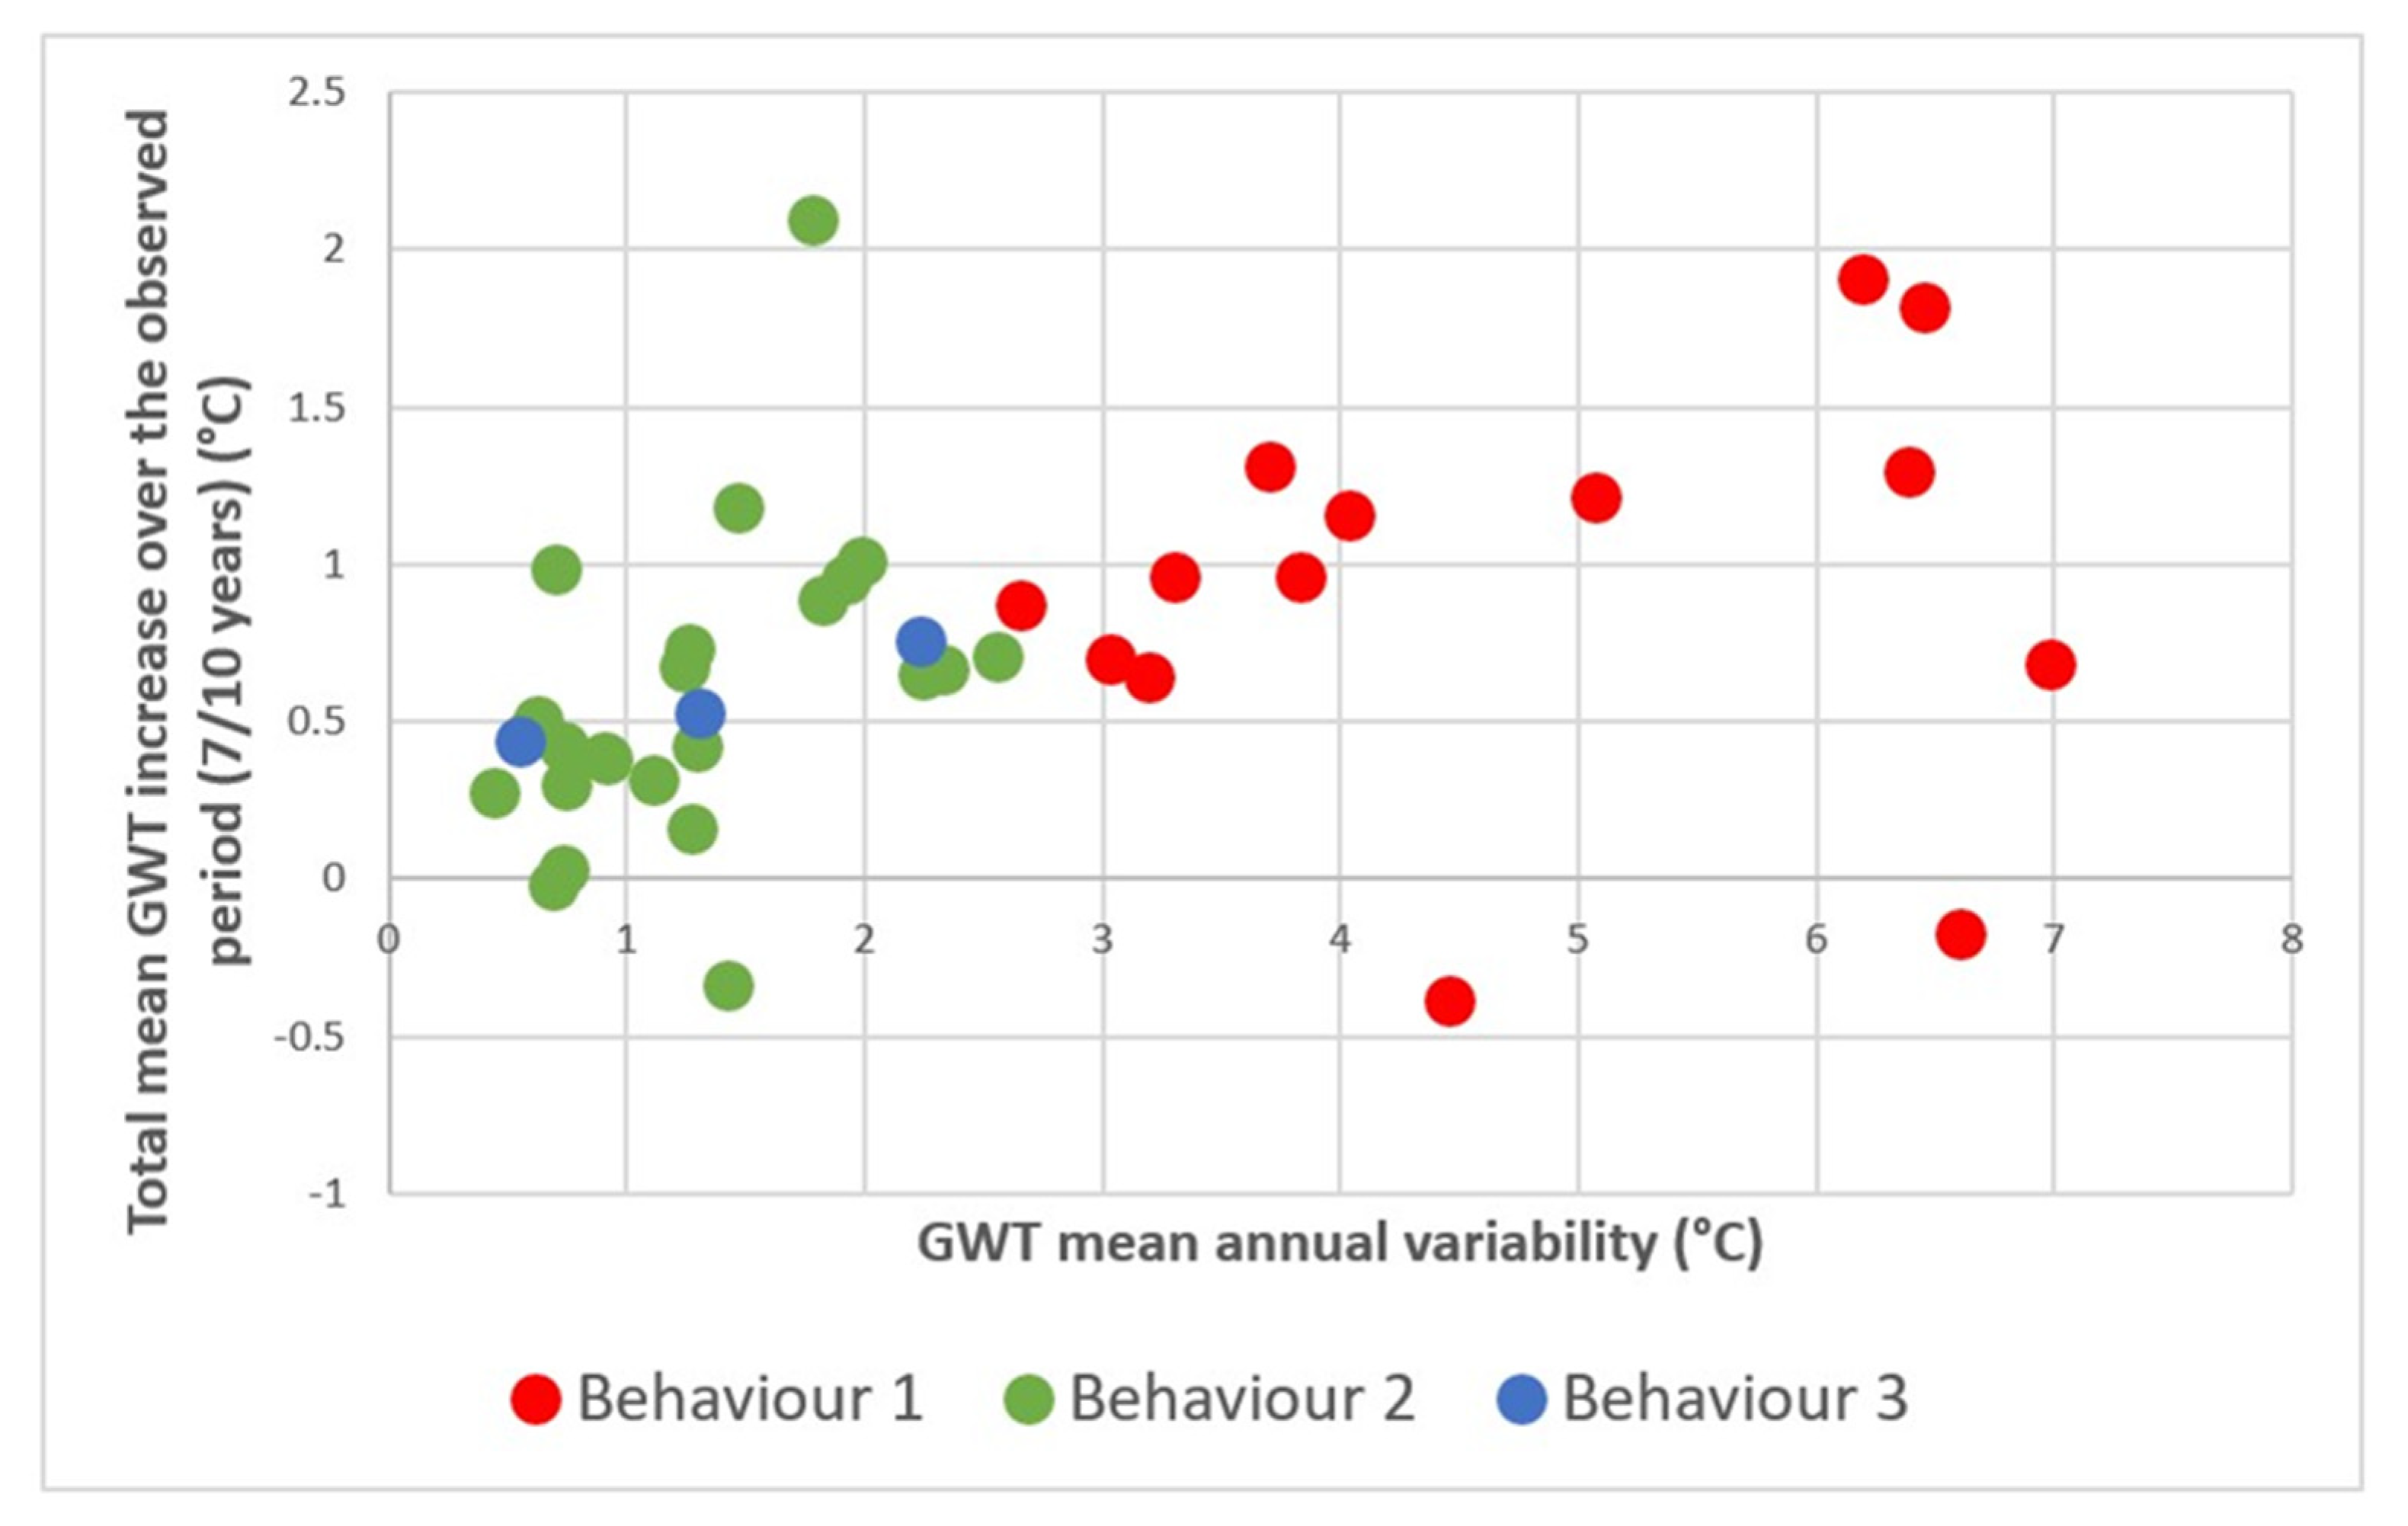
Then, the data of GWT mean increase have been plotted with the GWT mean annual variability for each monitoring wells (Figure 6).
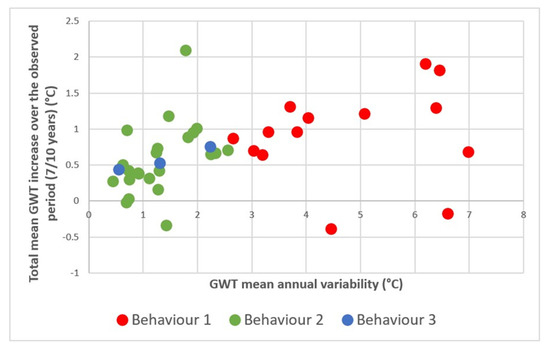
Figure 6.
Correlation between mean annual variability of GWT and total GWT mean increase in the period observed.
It is possible to observe that the data related to wells with behaviour 1 (in red), that also have a greater annual GWT variability, generally have higher values of increase in the mean GWT in the observed decade. On the contrary, the data related to wells with behaviour 2 (green) and behaviour 3 (blue) have a lower annual GWT range and also present a lower increase in mean GWT in the decade observed.
These results, added to those observed through qualitative and statistical analysis, allows us to conclude that the observed thermal reply of GW to AT is influenced by the height of the water column above the groundwater temperature measuring instrument and by the GW level depth. In fact, as mentioned in the literature [26,41], the depth at which the temperature of GW is measured affects the observation of GWT seasonal behaviour: the deeper the GWT is measured, the more the maximum temperature peak is shifted in time (compared to atmospheric data) and the lower the annual GWT range as it tends to be less sensitive to atmospheric temperature variations.
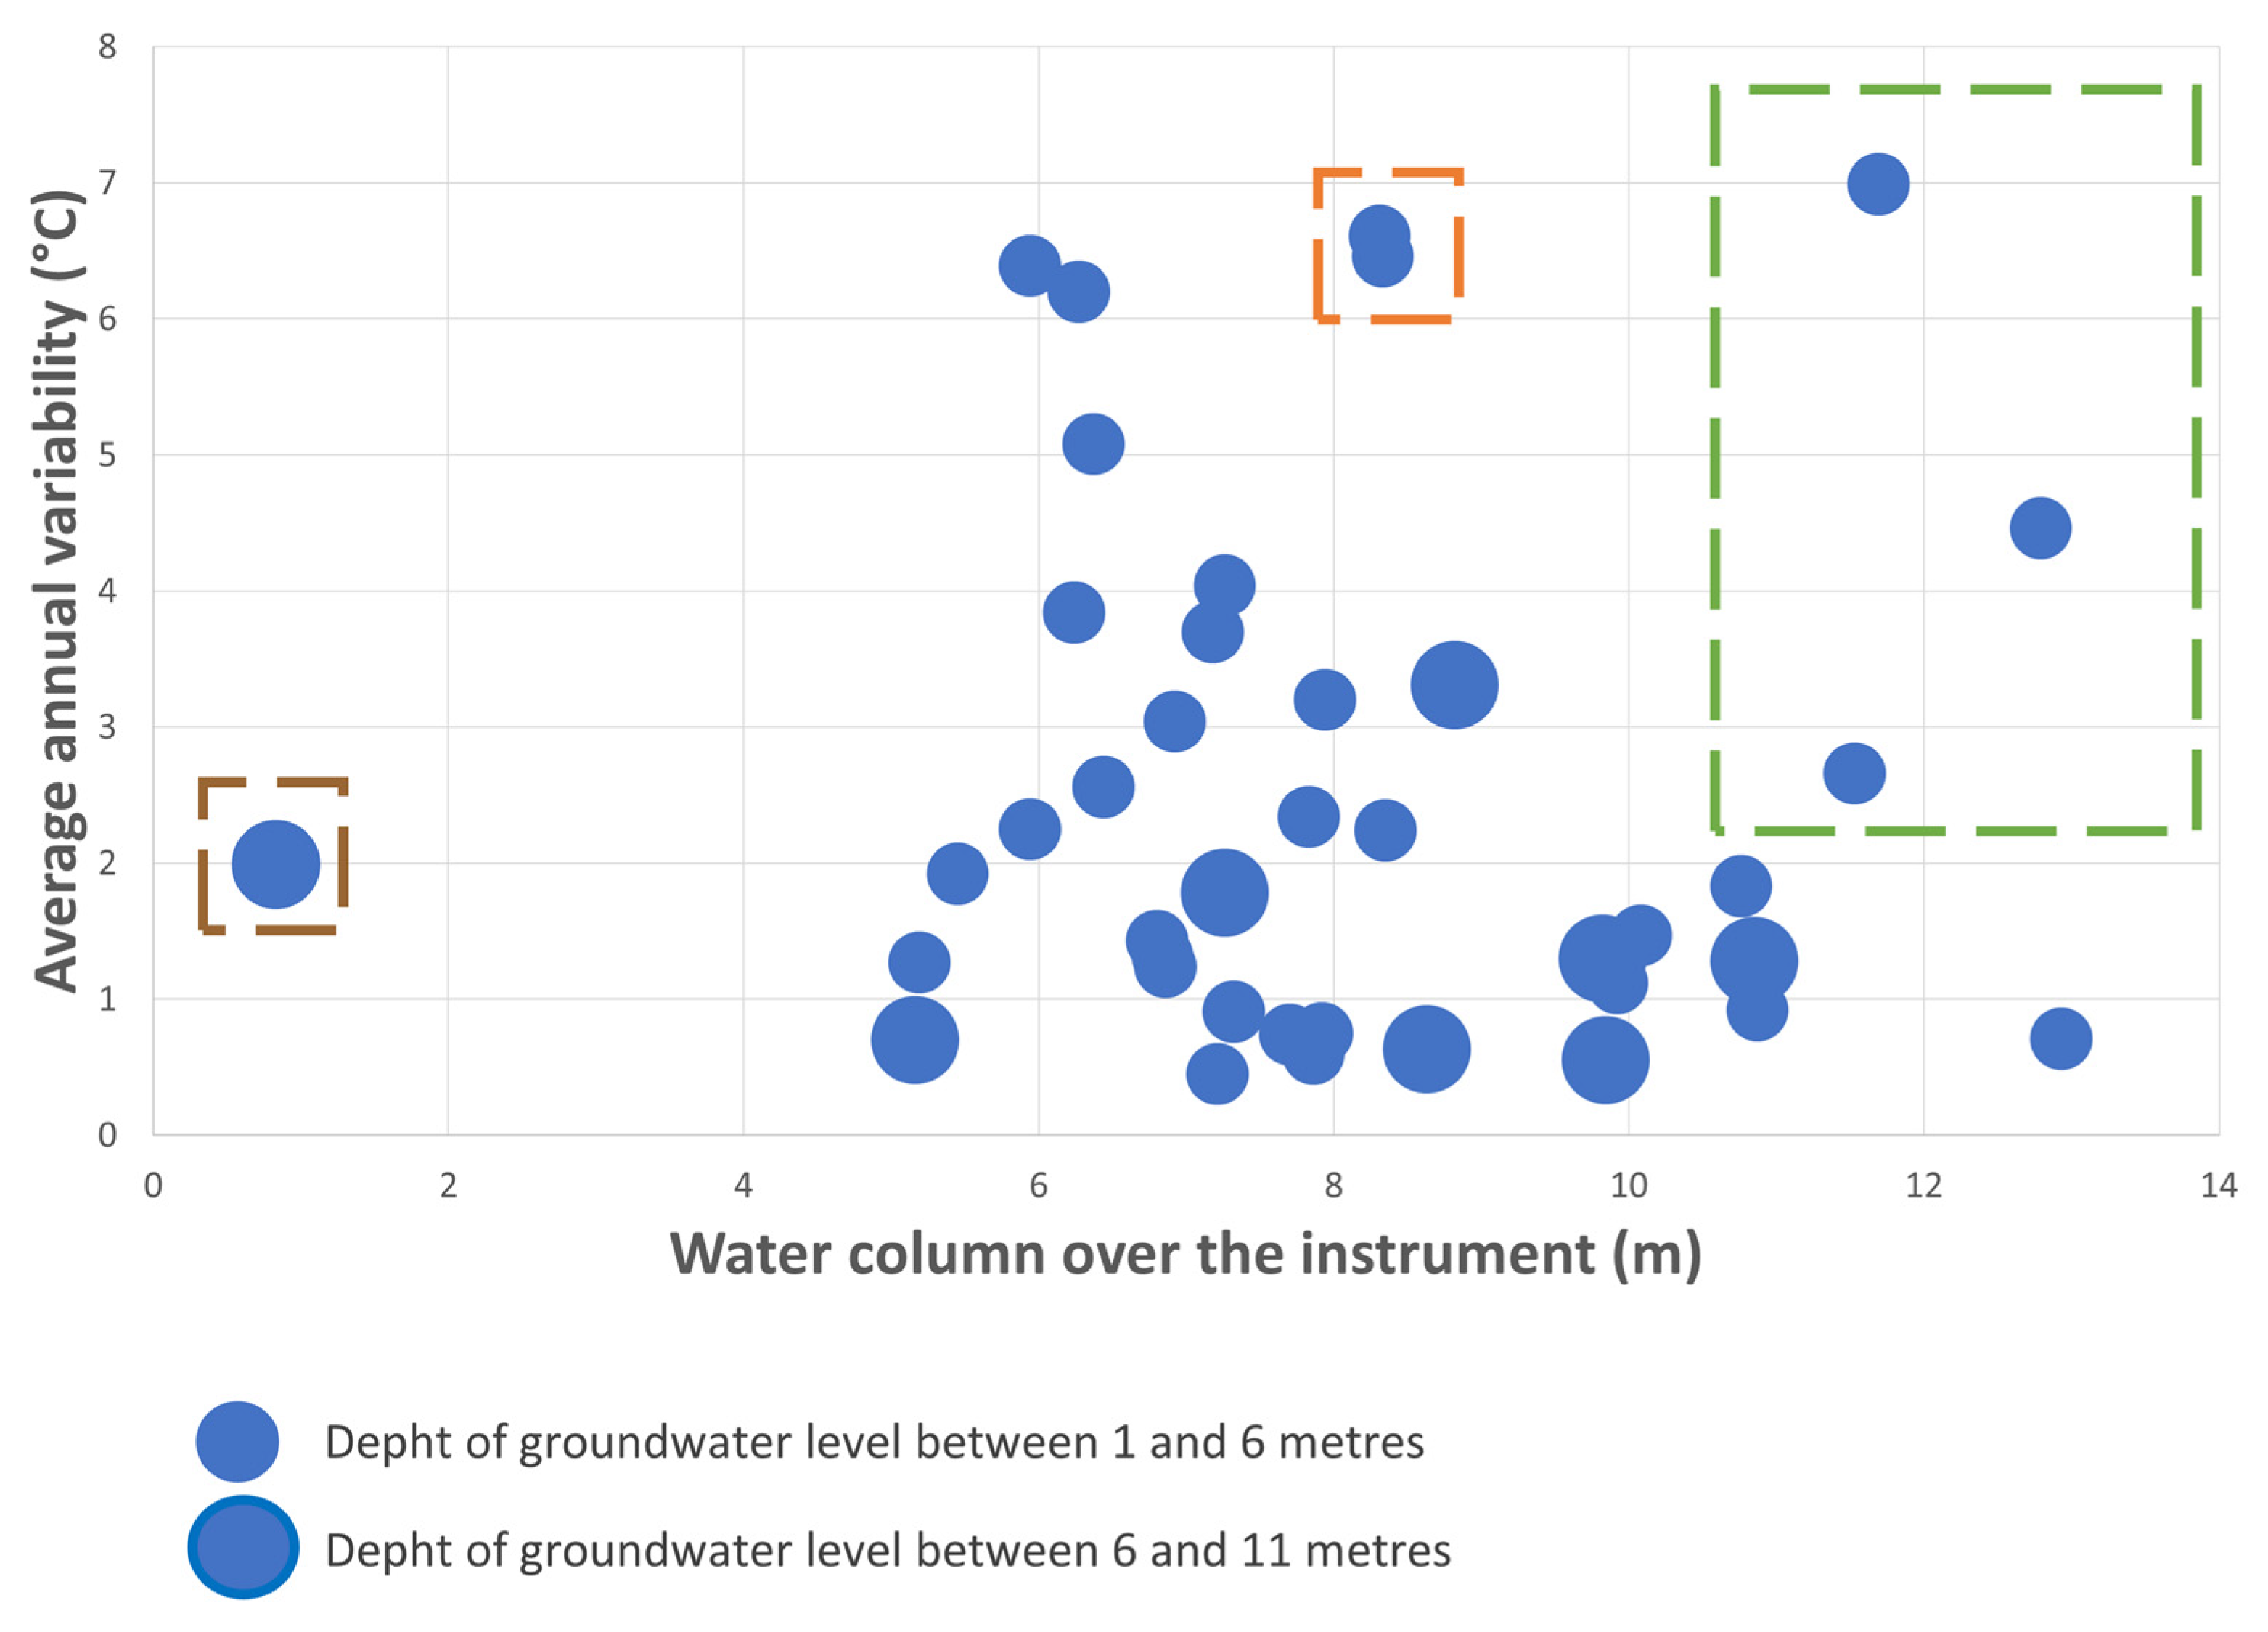
To stress the link between GWT and position of the instrument, data relating to the water column above the instrument, the annual mean variability of GWT and the depth of the groundwater level were plotted in the diagram of Figure 7. As hypothesized previously it has been possible to observe that the monitoring wells with a greater column of water above the instrument tend to have a lower annual mean variability.

Figure 7.
Correlation between GWT mean annual variability and water column over the instrument. The different dimensions of the dot represent the depth of the GW level. The coloured dashed rectangles show three particular cases in which the results deviate from the mean trend: in brown a well located close to a river, in orange wells located in paddy fields area and in green wells located in the downstream of a mountain area.
Moreover, the plot of GWT mean annual variability vs. the groundwater depth shows that a high annual variability is generally typical of wells with low depth to GW (1–6 m). On the contrary, wells with a higher depth to GW (6–11 m) have a lower mean annual variability.
Some wells (a total of six, highlighted by coloured dashed rectangles in Figure 7) have a behaviour that does not match with this description. When analysing these points, it was possible to observe that they are linked to particular situations. In brown is highlighted a well located in the province of Asti (DEPAT) that is a monitoring well drilled close to the Tanaro river and it is probably influenced by the watercourse. In orange there are two monitoring wells located in the province of Novara (PII34 and PII19), within the paddy fields areas. As reported in [54,58], in this area the agricultural technique of rice represents the main driver of water level modification, and consequently physical-chemical parameters of groundwater. Finally, in green, there are three monitoring wells located in the province of Turin, and more specifically in the area called “Canavese” area (PZ-SL2, PZ-SL4 and P21). These are the only monitoring wells in plain located downstream to mountain areas with glaciers. GWT in this area is probably influenced by the glacial melting of the Lanzo valley glaciers due to climate change, of which there are several testimonies in the literature [57].
5. Conclusions
This study represents the first regional-scale investigation in the Piedmont Po plain about the relationship between GWTs and climate variability. Prior to this, only studies concerning the observation of air temperature trends and how them influenced and are influenced by precipitations were carried out [33]. However, the understanding of relationships between AT and GWT is really important, especially in the context of global climate change. This is a fundamental analysis that is part of a global research strand that is already underway around the world (e.g., [14,16,17]) and which certainly needs to be deepened both at the Italian national level, but also at the international level.
The aim of this research was to study the evolution over time of GWT over a period of 10 years (from 2010 to 2019) and the relationship between GWT and AT, to analyse how these two parameters interact with each other, and to evaluate possible trends.
The analysis of 41 wells and 20 weather stations allowed us to highlight the existing positive correlation between AT and GWT.
Mann-Kendall and Theil-Sen tests show that approximately 90% of the 41 GWT data have an increasing trend at the 95% confidence level for mean, minimum and maximum annual GWT. The increasing trend of the GWT reflect the increase in air temperature. Indeed, AT shows an increase in annual mean values in all the analysed weather stations as already reported in previous work in the same study area that had also observed the increasing trend of the AT [33]. Other works also highlighted a positive trend concerning AT in Italy (e.g., in the southern Italian territory [30]).
However, it is evident that the increasing trend for AT is more pronounced than that for GWT. Consequently, it is possible to state that, despite the study area is located in a context of climatic variability, GWT are more resilient to change than AT.
The second objective of this study was to highlight the importance of the knowledge of the location in wells of the instruments for the GWT measure, to have accurate and comparable data.
The results of this study confirmed that GWT varies, depending of the analysed season. In addition, as the depth increases, the maximum and minimum peaks of the GWT shift in time respect to the maximum and minimum peaks of the AT, and the GWT fluctuation is milder than the fluctuation observed in the shallowest part of the aquifer.
Moreover, it was observed that the location in the wells of the instruments for the GWT measure seems to influence the mean annual variability recorded by the instrument. Indeed, the analysis of the water column above the instrument showed that the monitoring wells with a greater column of water tend have a lower annual mean variability. Moreover, a low annual variability is generally typical also of wells with low depth to GW (1–6 m).
Some areas in the Piedmont plain have behaviours that partially deviate from the mean trend (see Figure 7). These areas are influenced by particular anthropic factors (as the paddy fields in the Novara plain) or natural elements (as the monitoring wells in the “Canavese” area, located downstream of melting glaciers, or the wells located close rivers). Further investigations will be conducted in future in these areas of the Piedmont plain in order to better understand their dynamics and the factors that may influence GWT.
At last, although correlations confirm that AT influences GWT, further investigation is needed to better understand how GWT is affected by, for example, different land uses and atmospheric precipitation events. Future insights will also concern a detailed analysis of the factors influencing the more or less evident increase in GWT in relation to AT (e.g., depth of the water table, position of the monitoring well…). All this information will permit to obtain a more complete description of all the factors (e.g., [59,60,61]) affecting the groundwater in the Piedmont plain, that represents the most important GW reservoir of the Piedmont region.
Author Contributions
Conceptualization, E.E., M.L. and S.M.; formal analysis: E.E.; Methodology: E.E., M.L. and S.M; data curation, E.E., M.L. and S.M; writing—original draft preparation, E.E., M.L.; writing—review and editing, E.E., M.L. and S.M.; supervision, M.L. and D.A.D.L. All authors have read and agreed to the published version of the manuscript.
Funding
This research received no external funding.
Acknowledgments
The authors would like to thank Ester Valente and her colleagues for their help in acquiring the data.
Conflicts of Interest
The authors declare no conflict of interest.
References
- Alley, W.; Furey, S.; Klingbeil, R.; Shivakoti, B.R.; Kabede, S.; Hirata, R. The UN-SDGs for 2030: Essential Indicators For Groundwater; International Association of Hydrogeologists: London, UK, 2017; 8p. [Google Scholar]
- van der Gun, J. Groundwater and Global Change: Trends, Opportunities and Challenges; United Nations Educational, Scientific and Cultural Organization: Paris, France, 2012; ISBN 978-92-3-001049-2. [Google Scholar]
- 2 Level of Water Stress (Freshwater Withdrawal as a Proportion of Available Freshwater Resources). Available online: https://sdg.tracking-progress.org/indicator/6-4-2-level-of-water-stress-freshwater-withdrawal-as-a-proportion-of-available-freshwater-resources/ (accessed on 10 September 2021).
- Climate Change 2007: The Physical Science Basis: Contribution of Working Group I to the Fourth Assessment Report of the Intergovernmental Panel on Climate Change; Solomon, S.; Intergovernmental Panel on Climate Change, Intergovernmental Panel on Climate Change (Eds.) Cambridge University Press: Cambridge, UK; New York, NY, USA, 2007; ISBN 978-0-521-88009-1. [Google Scholar]
- Giorgi, F.; Im, E.-S.; Coppola, E.; Diffenbaugh, N.S.; Gao, X.J.; Mariotti, L.; Shi, Y. Higher Hydroclimatic Intensity with Global Warming. J. Clim. 2011, 24, 5309–5324. [Google Scholar] [CrossRef]
- Menberg, K.; Blum, P.; Kurylyk, B.L.; Bayer, P. Observed Groundwater Temperature Response to Recent Climate Change. Hydrol. Earth Syst. Sci. 2014, 18, 4453–4466. [Google Scholar] [CrossRef]
- Lasagna, M.; Ducci, D.; Sellerino, M.; Mancini, S.; De Luca, D.A. Meteorological Variability and Groundwater Quality: Examples in Different Hydrogeological Settings. Water 2020, 12, 1297. [Google Scholar] [CrossRef]
- Dragoni, W.; Sukhija, B.S. Climate Change and Groundwater: A Short Review. Geol. Soc. Lond. Spec. Publ. 2008, 288, 1–12. [Google Scholar] [CrossRef]
- Pollack, H.N.; Huang, S.; Shen, P.-Y. Climate Change Record in Subsurface Temperatures: A Global Perspective. Science 1998, 282, 279–281. [Google Scholar] [CrossRef]
- Taylor, R.G.; Scanlon, B.; Döll, P.; Rodell, M.; van Beek, R.; Wada, Y.; Longuevergne, L.; Leblanc, M.; Famiglietti, J.S.; Edmunds, M.; et al. Ground Water and Climate Change. Nat. Clim Chang. 2013, 3, 322–329. [Google Scholar] [CrossRef]
- Bovolo, C.I.; Parkin, G.; Sophocleous, M. Groundwater Resources, Climate and Vulnerability. Environ. Res. Lett. 2009, 4, 035001. [Google Scholar] [CrossRef]
- Holman, I.P. Climate Change Impacts on Groundwater Recharge- Uncertainty, Shortcomings, and the Way Forward? Hydrogeol. J. 2006, 14, 637–647. [Google Scholar] [CrossRef]
- Döll, P.; Flörke, M. Frankfurt Hydrology Paper 3-Global-Scale Estimation of Diffuse Groundwater Recharge; Frankfurt University: Frankfurt, Germany, 2005; p. 26. [Google Scholar]
- Gunawardhana, L.N.; Kazama, S. Climate Change Impacts on Groundwater Temperature Change in the Sendai Plain, Japan. Hydrol. Process. 2011, 25, 2665–2678. [Google Scholar] [CrossRef]
- Kurylyk, B.L.; MacQuarrie, K.T.B.; Caissie, D.; McKenzie, J.M. Shallow Groundwater Thermal Sensitivity to Climate Change and Land Cover Disturbances: Derivation of Analytical Expressions and Implications for Stream Temperature Modeling. Hydrol. Earth Syst. Sci. 2015, 19, 2469–2489. [Google Scholar] [CrossRef] [Green Version]
- Benz, S.A.; Bayer, P.; Winkler, G.; Blum, P. Recent Trends of Groundwater Temperatures in Austria. Hydrol. Earth Syst. Sci. 2018, 22, 3143–3154. [Google Scholar] [CrossRef]
- Hemmerle, H.; Bayer, P. Climate Change Yields Groundwater Warming in Bavaria, Germany. Front. Earth Sci. 2020, 8, 575894. [Google Scholar] [CrossRef]
- Wang, S.-J.; Lee, C.-H.; Yeh, C.-F.; Choo, Y.F.; Tseng, H.-W. Evaluation of Climate Change Impact on Groundwater Recharge in Groundwater Regions in Taiwan. Water 2021, 13, 1153. [Google Scholar] [CrossRef]
- World Meteor Organization. The Global Climate in 2015–2019; World Meteor Organization: Mechelen, Belgium, 2019. [Google Scholar]
- Masson-Delmotte, V.; Zhai, P.; Pörtner, H.O.; Roberts, D.; Skea, J.; Shukla, P.R.; Pirani, A.; Moufouma-Okia, W.; Péan, C.; Pidcock, R.; et al. Global Warming of 1.5 °C. An IPCC Special Report on the Impacts of Global Warming of 1.5 °C above Pre-Industrial Levels and Related Global Greenhouse Gas Emission Pathways, in the Context of Strengthening the Global Response to the Threat of Climate Change, Sustainable Development, and Efforts to Eradicate Poverty; Intergovernmental Panel on Climate Change: Geneva, Switzerland, 2018. [Google Scholar]
- Green, T.R.; Taniguchi, M.; Kooi, H.; Gurdak, J.J.; Allen, D.M.; Hiscock, K.M.; Treidel, H.; Aureli, A. Beneath the Surface of Global Change: Impacts of Climate Change on Groundwater. J. Hydrol. 2011, 405, 532–560. [Google Scholar] [CrossRef]
- Kovács, A.; Jakab, A. Modelling the Impacts of Climate Change on Shallow Groundwater Conditions in Hungary. Water 2021, 13, 668. [Google Scholar] [CrossRef]
- Shah, T. Climate Change and Groundwater: India’s Opportunities for Mitigation and Adaptation. Environ. Res. Lett. 2009, 4, 035005. [Google Scholar] [CrossRef]
- Arnell, N.W. Climate Change and Water Resources in Britain. Clim. Chang. 1998, 39, 83–110. [Google Scholar] [CrossRef]
- Alley, W.M. Ground Water and Climate. Ground Water 2001, 39, 161. [Google Scholar] [CrossRef]
- Bucci, A.; Lasagna, M.; De Luca, D.A.; Acquaotta, F.; Barbero, D.; Fratianni, S. Time Series Analysis of Underground Temperature and Evaluation of Thermal Properties in a Test Site of the Po Plain (NW Italy). Environ. Earth Sci. 2020, 79, 185. [Google Scholar] [CrossRef]
- Bucci, A.; Barbero, D.; Lasagna, M.; Forno, M.G.; De Luca, D.A. Shallow Groundwater Temperature in the Turin Area (NW Italy): Vertical Distribution and Anthropogenic Effects. Environ. Earth Sci. 2017, 76, 221. [Google Scholar] [CrossRef]
- Taylor, C.A.; Stefan, H.G. Shallow Groundwater Temperature Response to Climate Change and Urbanization. J. Hydrol. 2009, 375, 601–612. [Google Scholar] [CrossRef]
- Colombani, N.; Giambastiani, B.M.S.; Mastrocicco, M. Use of Shallow Groundwater Temperature Profiles to Infer Climate and Land Use Change: Interpretation and Measurement Challenges. Hydrol. Process. 2016, 30, 2512–2524. [Google Scholar] [CrossRef]
- Mastrocicco, M.; Busico, G.; Colombani, N. Groundwater Temperature Trend as a Proxy for Climate Variability. Proceedings 2018, 2, 630. [Google Scholar] [CrossRef]
- Bastiancich, L.; Lasagna, M.; Mancini, S.; Falco, M.; De Luca, D.A. Temperature and Discharge Variations in Natural Mineral Water Springs Due to Climate Variability: A Case Study in the Piedmont Alps (NW Italy). Environ. Geochem. Health 2021, 44, 1971–1994. [Google Scholar] [CrossRef]
- Acque per il consumo umano—Arpa Piemonte. Available online: http://www.arpa.piemonte.it/approfondimenti/temi-ambientali/acqua/acque-potabili (accessed on 8 July 2021).
- Brussolo, E.; Palazzi, E.; von Hardenberg, J.; Masetti, G.; Vivaldo, G.; Previati, M.; Canone, D.; Gisolo, D.; Bevilacqua, I.; Provenzale, A.; et al. Aquifer Recharge in the Piedmont Alpine Zone: Historical Trends and Future Scenarios. Hydrol. Earth Syst. Sci. 2022, 26, 407–427. [Google Scholar] [CrossRef]
- De Luca, D.A.; Lasagna, M.; Debernardi, L. Hydrogeology of the Western Po Plain (Piedmont, NW Italy). J. Maps 2020, 16, 265–273. [Google Scholar] [CrossRef]
- Il Piemonte nel Cambiamento Climatico—Arpa Piemonte. Available online: http://www.arpa.piemonte.it/pubblicazioni-2/pubblicazioni-anno-2007/il-piemonte-nel-cambiamento-climatico (accessed on 7 July 2021).
- Forno, M.G.; De Luca, D.A.; Festa, V.; Bonasera, M.; Bucci, A.; Gianotti, F.; Lasagna, M.; Longhitano, S.G.; Lucchesi, S.; Petruzzelli, M.; et al. Synthesis on the Turin Subsoil Stratigraphy and Hydrogeology (NW Italy). AMQ 2018, 31, 147–170. [Google Scholar] [CrossRef]
- Debernardi, L.; De Luca, D.A.; Lasagna, M. Correlation between Nitrate Concentration in Groundwater and Parameters Affecting Aquifer Intrinsic Vulnerability. Environ. Geol. 2008, 55, 539–558. [Google Scholar] [CrossRef]
- Castagna, S.E.D.; De Luca, D.A.; Lasagna, M. Eutrophication of Piedmont Quarry Lakes (North-Western Italy): Hydrogeological Factors, Evaluation of Trophic Levels and Management Strategies. J. Environ. Assess. Policy Manag. 2015, 17, 1550036. [Google Scholar] [CrossRef]
- Barbero, D.; De Luca, D.A.; Forno, M.G.; Lasagna, M. Preliminary Results on Temperature Distribution in the Quaternary Fluvial and Outwash Deposits of the Piedmont Po Plain (NW Italy): A Statistical Approach. Rend. Online Soc. Geol. It. 2016, 41, 272–275. [Google Scholar] [CrossRef]
- Irace, A.; Clemente, P.; Natalicchio, M.; Ossella, L.; Trenkwalder, S.; De Luca, D.A.; Mosca, P.; Piana, F.; Polino, R.; Violanti, D. Geologia e Idrostratigrafia Profonda Della Pianura Padana Occidentale (Regione Piemonte); La NuovaLito: Firenze, Italy, 2009. [Google Scholar]
- Barbero, D.; Bucci, A.; Forno, M.G.; Lasagna, M.; De Luca, D.A. Thermal Model of the Piedmont Po Plain Shallow Aquifer (NW Italy) with the Statistical Temperature Distribution. Geothermics 2020, 87, 101833. [Google Scholar] [CrossRef]
- Arpa Piemonte Arpa Piemonte—Home Page. Available online: http://rsaonline.arpa.piemonte.it/meteoclima50/clima_ed_indicatori.htm (accessed on 7 July 2021).
- Lasagna, M.; De Luca, D.A. The Use of Multilevel Sampling Techniques for Determining Shallow Aquifer Nitrate Profiles. Environ. Sci. Pollut. Res 2016, 23, 20431–20448. [Google Scholar] [CrossRef]
- Bucci, A.; Barbero, D.; Lasagna, M.; Forno, M.G.; De Luca, D.A. Urban Groundwater Warming in Turin Area (NW Italy). Rend. Online Soc. Geol. It. 2019, 47, 2–6. [Google Scholar] [CrossRef]
- GREASE. Available online: http://www.regione.piemonte.it/monitgis/jsp/cartografia/mappa.do;jsessionid=497GgHpLyjP9vxGXGhWvwZGVWJfTh1MKWCrTvpVk8l2pnQDjjq19!-1934697681!-449251782 (accessed on 14 June 2021).
- Accesso Ai Dati “Annali Meteorologici Ed Idrologici ” Banca Dati Meteorologica. Available online: https://www.arpa.piemonte.it/rischinaturali/accesso-ai-dati/annali_meteoidrologici/annali-meteo-idro/banca-dati-meteorologica.html (accessed on 14 June 2021).
- Braca, G.; Bussettini, M.; Lastoria, B.; Mariani, S. Linee Guida per l’analisi e l’elaborazione Statistica Di Base Delle Serie Storiche Di Dati Idrologici; ISPRA, Manuali e Linee GuidaL: Ispra, Itlay, 2013; ISBN 978-88-448-0584-5. [Google Scholar]
- Voronoï, G. Nouvelles Applications Des Paramètres Continus à La Théorie Des Formes Quadratiques. Premier Mémoire. Sur Quelques Propriétés Des Formes Quadratiques Positives Parfaites. J. Reine Angew. Math. 1908, 1908, 97–178. [Google Scholar] [CrossRef]
- Voronoï, G. Nouvelles Applications Des Paramètres Continus à La Théorie Des Formes Quadratiques. Deuxième Mémoire. Recherches Sur Les Parallélloèdres Primitifs. J. Reine Angew. Math. 1908, 1908, 198–287. [Google Scholar] [CrossRef]
- Mann, H.B. Nonparametric Tests Against Trend. Econometrica 1945, 13, 245. [Google Scholar] [CrossRef]
- Kendall, M.G. Rank Correlation Measures; Charles Griffin & Co., Ltd.: London, UK, 1955; p. 202. [Google Scholar]
- Sen, P.K. Estimates of the Regression Coefficient Based on Kendall’s Tau. J. Am. Stat. Assoc. 1968, 39, 1379–1389. [Google Scholar] [CrossRef]
- Singh, A.; Maichle, R.; Singh, A.K.; Lee, S.E.; Armbya, N. PROUCL Version 4.00. 02 User Guide 2007; United States Environmental Protection Agency: Washington, DC, USA, 2007. [Google Scholar]
- Lasagna, M.; Mancini, S.; De Luca, D.A. Groundwater Hydrodynamic Behaviours Based on Water Table Levels to Identify Natural and Anthropic Controlling Factors in the Piedmont Plain (Italy). Sci. Total Environ. 2020, 716, 137051. [Google Scholar] [CrossRef]
- Patle, G.T.; Singh, D.K.; Sarangi, A.; Rai, A.; Khanna, M.; Sahoo, R.N. Time Series Analysis of Groundwater Levels and Projection of Future Trend. J. Geol. Soc. India 2015, 85, 232–242. [Google Scholar] [CrossRef]
- Mancini, S.; Egidio, E.; Luca, D.A.D.; Lasagna, M. Application and Comparison of Different Statistical Methods for the Analysis of Groundwater Levels over Time: Response to Rainfall and Resource Evolution in the Piedmont Plain (NW Italy). Sci. Total Environ. 2022, 846, 157479. [Google Scholar] [CrossRef]
- Baroni, C.; Bondesan, A.; Carturan, L.; Chiarle, M. Annual Glaciological Survey Of Italian Glaciers (2020); Italian Glaciological Committee: Torino, Italy, 2020. [Google Scholar]
- Egidio, E.; Lasagna, M.; Mancini, S.; Luca, D.A.D. Climate Impact Assessment to the Groundwater Levels Based on Long Time-Series Analysis in a Paddy Field Area (Piedmont Region, NW Italy): Preliminary Results. Acque Sotter. Ital. J. Groundw. Sotter. 2022, 9. [Google Scholar] [CrossRef]
- Lasagna, M.; Caviglia, C.; De Luca, D.A. Simulation Modelling for Groundwater Safety in an Overexploitation Situation: The Maggiore Valley Context (Piedmont, Italy). Bull. Eng. Geol. Environ. 2014, 73, 341–355. [Google Scholar] [CrossRef]
- Avataneo, C.; Belluso, E.; Capella, S.; Cocca, D.; Lasagna, M.; Pigozzi, G.; De Luca, D.A. Groundwater Asbestos Pollution from Naturally Occurring Asbestos (NOA): A Preliminary Study on the Lanzo Valleys and Balangero Plain Area, NW Italy. Ital. J. Eng. Geol. Environ. 2021, 1, 5–19. [Google Scholar] [CrossRef]
- Lasagna, M.; Franchino, E.; De Luca, D.A. Areal and Vertical Distribution of Nitrate Concentration in Piedmont Plain Aquifers (North-Western Italy). In Engineering Geology for Society and Territory; Lollino, G., Arattano, M., Rinaldi, M., Giustolisi, O., Marechal, J.-C., Grant, G.E., Eds.; Springer International Publishing: Cham, Switzerland, 2015; Volume 3, pp. 389–392. ISBN 978-3-319-09053-5. [Google Scholar]

Publisher’s Note: MDPI stays neutral with regard to jurisdictional claims in published maps and institutional affiliations. |
© 2022 by the authors. Licensee MDPI, Basel, Switzerland. This article is an open access article distributed under the terms and conditions of the Creative Commons Attribution (CC BY) license (https://creativecommons.org/licenses/by/4.0/).