
Comparison of Two Types of Survey Designs for Acoustic Estimates of Fish Resources in the Three Gorges Reservoir, China

 ,
,  ,
,  ,
,
Abstract
:1. Introduction
2. Materials and Methods
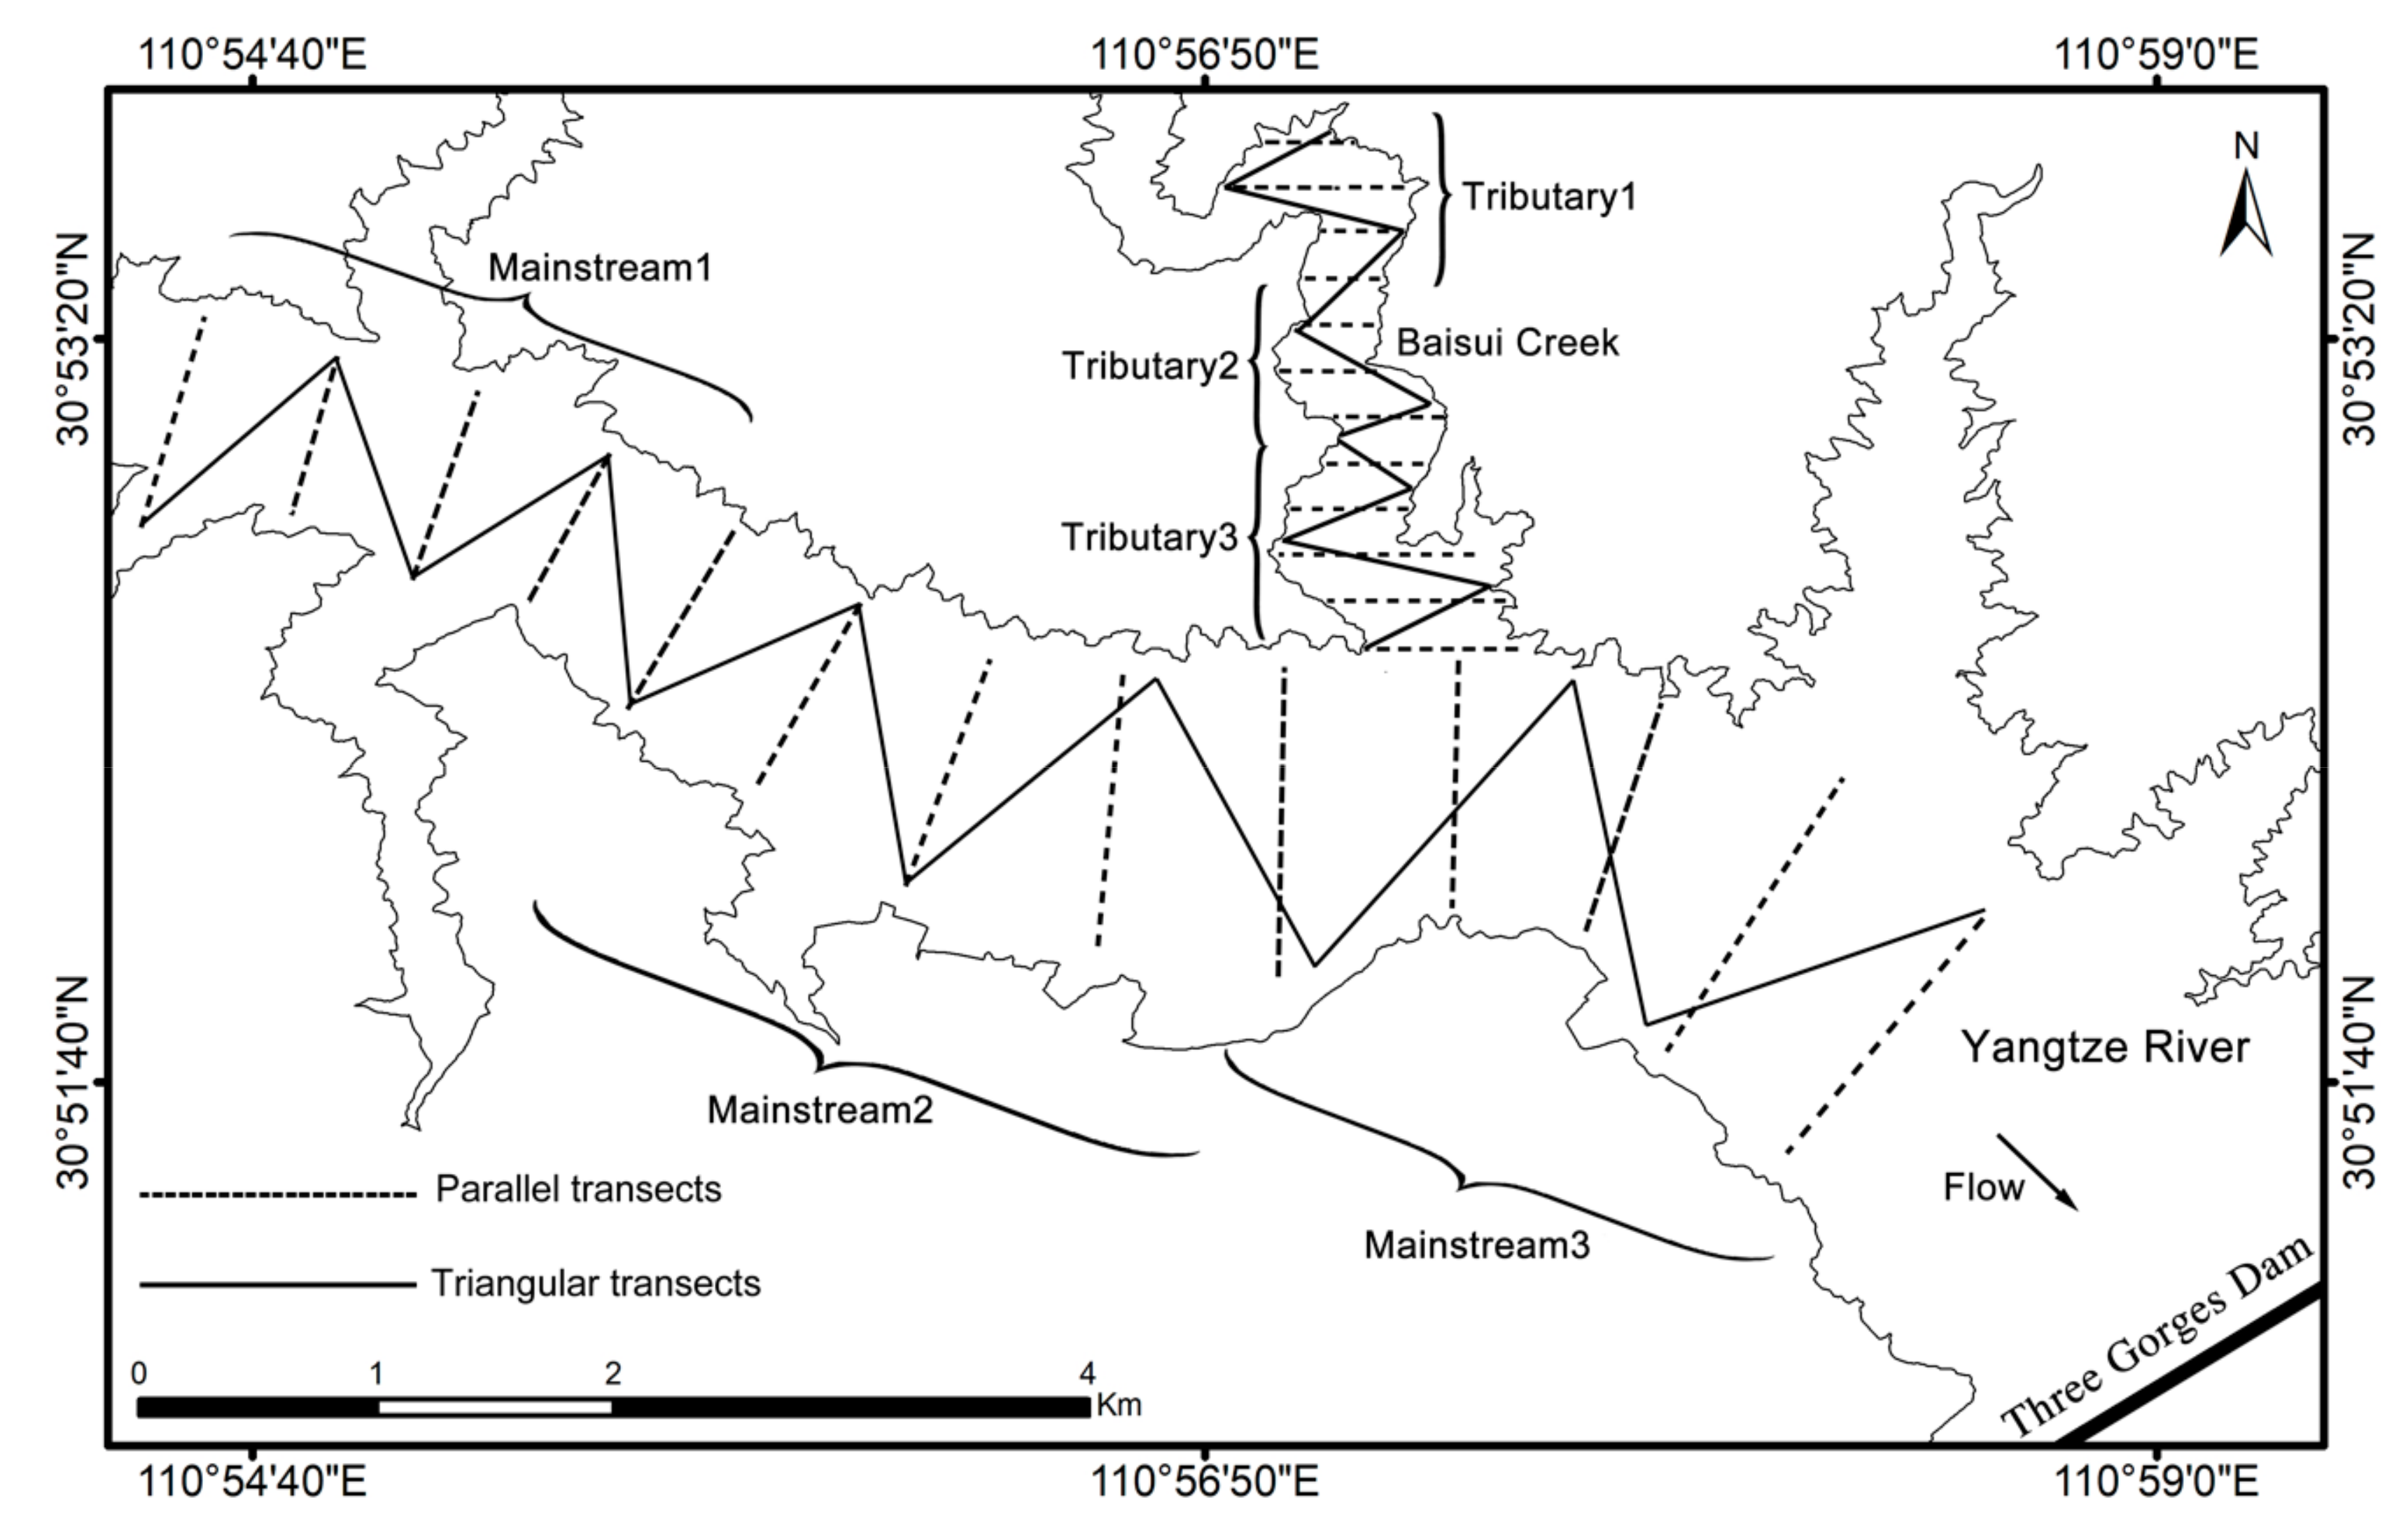
2.1. Study Area and Survey Design
2.2. Hydroacoustic Survey
2.3. Data Processing
2.4. Statistical Analysis
3. Results
3.1. Reservoir Morphometry and Survey Coverage
3.2. Comparison of Fish Density Estimates
3.3. Comparison of Size Distribution
4. Discussion
5. Conclusions
Author Contributions
Funding
Institutional Review Board Statement
Informed Consent Statement
Data Availability Statement
Acknowledgments
Conflicts of Interest
References
- CEN. EN 15910; Water Quality—Guidance on Estimation of Fish Abundance with Mobile Hydroacoustic Methods. Comité Européen de Normalisation: Brussels, Belgium, 2014.
- Pollom, R.A.; Rose, G.A. A Global Review of the Spatial, Taxonomic, and Temporal Scope of Freshwater Fisheries Hydroacoustics Research. Environ. Rev. 2016, 24, 333–347. [Google Scholar] [CrossRef]
- Simmonds, J.; MacLennan, D. Fisheries Acoustics: Theory and Practice, 2nd ed.; Wiley-Blackwell: Oxford, UK, 2005. [Google Scholar]
- Aglen, A. Random Errors of Acoustic Fish Abundance Estimates in Relation to the Survey Grid Density Applied; FAO Fisheries Report (FAO); FAO: Rome, Italy, 1983. [Google Scholar]
- Aglen, A. Reliability of Acoustic Fish Abundance Estimates. Ph.D. Thesis, University of Bergen, Bergen, Norway, 1989. [Google Scholar]
- Godlewska, M.; Długoszewski, B.; Doroszczyk, L.; Jóźwik, A. The Relationship between Sampling Intensity and Sampling Error—Empirical Results from Acoustic Surveys in Polish Vendace Lakes. Fish. Res. 2009, 96, 17–22. [Google Scholar] [CrossRef]
- Parker-Stetter, S.L.; Rudstam, L.G.; Sullivan, P.J.; Warner, D.M. Standard Operating Procedures for Fisheries Acoustic Surveys in the Great Lakes; Great Lakes Fishery Commission: Ann Arbor, MI, USA, 2009. [Google Scholar]
- Rivoirard, J.; Simmonds, E.J.; Foote, K.; Fernandes, P.G.; Bez, N. Geostatistics for Estimating Fish Abundance; Blackwell Science Ltd.: Oxford, UK, 2000. [Google Scholar]
- Simmonds, E.J.; Williamson, N.J.; Gerlotto, F.; Aglen, A. Acoustic Survey Design and Analysis Procedure: A Comprehensive Review of Current Practice; ICES Cooperative Research Report; ICES: Copenhagen, Denmark, 1992. [Google Scholar]
- Guillard, J.; Verges, C. The repeatability of fish biomass and size distribution estimates obtained by hydroacoustic surveys using various sampling strategies and statistical analyses. Int. Rev. Hydrobiol. 2007, 92, 605–617. [Google Scholar] [CrossRef]
- Doroszczyk, L.; Długoszewski, B.; Godlewska, M. Comparison of Acoustical Estimates of Fish Abundance for Different Coverage and Survey Design. Hydroacoustics 2007, 10, 33–38. [Google Scholar]
- Zhang, H.J.; Yang, D.G.; Wei, Q.W.; Du, H.; Zhang, H.; Chen, X.H. Hydroacoustic Survey on Fishes in the Reach from Gezhouba Dam to Gulaobei of the Yangtze River. Resour. Environ. Yangtze Basin 2007, 16, 86–91, (In Chinese with English abstract). [Google Scholar]
- Tao, J.P.; Chen, Y.B.; Qiao, Y.; Tan, X.C.; Chang, J.B. Hydroacoustic Surveys on Spatial Distribution of Fishes in the Three Gorges Reservoir During the First Impoundment. J. Hydroecology 2008, 1, 25–33, (In Chinese with English abstract). [Google Scholar]
- Lian, Y.; Ye, S.; Godlewska, M.; Huang, G.; Wang, J.; Chen, S.; Zhao, X.; Du, X.; Liu, J.; Li, Z. Diurnal, Seasonal and Inter-Annual Variability of Fish Density and Distribution in the Three Gorges Reservoir (China) Assessed with Hydroacoustics. Limnologica 2017, 63, 97–106. [Google Scholar] [CrossRef]
- Ministry of Water Resources, China; National Bureau of Statistics, China. Bulletin of First National Census for Water; China Water & Power Press: Beijing, China, 2013. [Google Scholar]
- Thornton, K.W.; Kimmel, B.L.; Payne, F.E. Reservoir Limnology: Ecological Perspectives; Wiley: New York, NY, USA, 1990. [Google Scholar]
- Prchalová, M.; Kubečka, J.; Vašek, M.; Peterka, J.; Sed’a, J.; Jůza, T.; Říha, M.; Jarolím, O.; Tušer, M.; Kratochvíl, M.; et al. Distribution Patterns of Fishes in a Canyon-Shaped Reservoir. J. Fish Biol. 2008, 73, 54–78. [Google Scholar] [CrossRef]
- Foote, K.G.; Knudsen, H.P.; Vestnes, G.; Maclennan, D.N.; Simmonds, E.J.N. Calibration of Acoustic Instruments for Fish Density Estimation: A Practical Guide; Cooperative Research Report No.144; International Council for the Exploration of the Sea: Copenhagen, Denmark, 1987. [Google Scholar]
- Zar, J.H. Biostatistical Analysis, 5th ed.; Pearson Education Limited: Edinburgh, UK, 2014. [Google Scholar]
- Gimona, A.A. Conditional Simulation of Acoustic Survey Data: Advantages and Potential Pitfalls. Aquat. Living Resour. 2003, 16, 123–129. [Google Scholar] [CrossRef]
- Järvalt, A.; Krause, T.; Palm, A. Diel Migration and Spatial Distribution of Fish in a Small Stratified Lake. Hydrobiologia 2005, 547, 197–203. [Google Scholar] [CrossRef]
- Vašek, M.; Kubečka, J.; Peterka, J.; Čech, M.; Draštík, V.; Hladík, M.; Prchalová, M.; Frouzová, J. Longitudinal and Vertical Spatial Gradients in the Distribution of Fish within a Canyon-Shaped Reservoir. Int. Rev. Hydrobiol. 2004, 89, 352–362. [Google Scholar] [CrossRef]
- Gliwicz, Z.M.; Slon, J.; Szynkarczyk, I. Trading Safety for Food: Evidence from Gut Contents in Roach and Bleak Captured at Different Distances Offshore from Their Daytime Littoral Refuge. Freshw. Biol. 2006, 51, 823–839. [Google Scholar] [CrossRef]
- Říha, M.; Kubečka, J.; Mrkvička, T.; Prchalová, M.; Čech, M.; Draštík, V.; Frouzová, J.; Hladík, M.; Hohausová, E.; Jarolím, O.; et al. Dependence of Beach Seine Net Efficiency on Net Length and Diel Period. Aquat. Living Resour. 2008, 21, 411–418. [Google Scholar] [CrossRef]


| Parameter | Mainstream1 | Mainstream2 | Mainstream3 | Tributary1 | Tributary2 | Tributary3 |
|---|---|---|---|---|---|---|
| Maximum depth (m) | 139 | 141 | 143 | 42 | 49 | 75 |
| Mean depth (m) | 76.8 | 81.1 | 77.8 | 22.1 | 30.4 | 37.7 |
| Mean width (km) | 0.8 | 1.2 | 1.35 | 0.3 | 0.3 | 0.5 |
| Area (km2) | 1.6 | 2.6 | 3.1 | 0.2 | 0.2 | 0.3 |
| Total length of parallel transects (km) | 4.8 | 5.9 | 6.7 | 1.7 | 1.9 | 2.8 |
| Total length of triangle transects (km) | 4.7 | 5.7 | 6.5 | 1.8 | 1.8 | 2.9 |
| Coverage of parallel transects | 3.8 | 3.6 | 3.8 | 3.7 | 4.1 | 4.9 |
| Coverage of triangle transects | 3.7 | 3.5 | 3.7 | 3.9 | 3.8 | 5.0 |
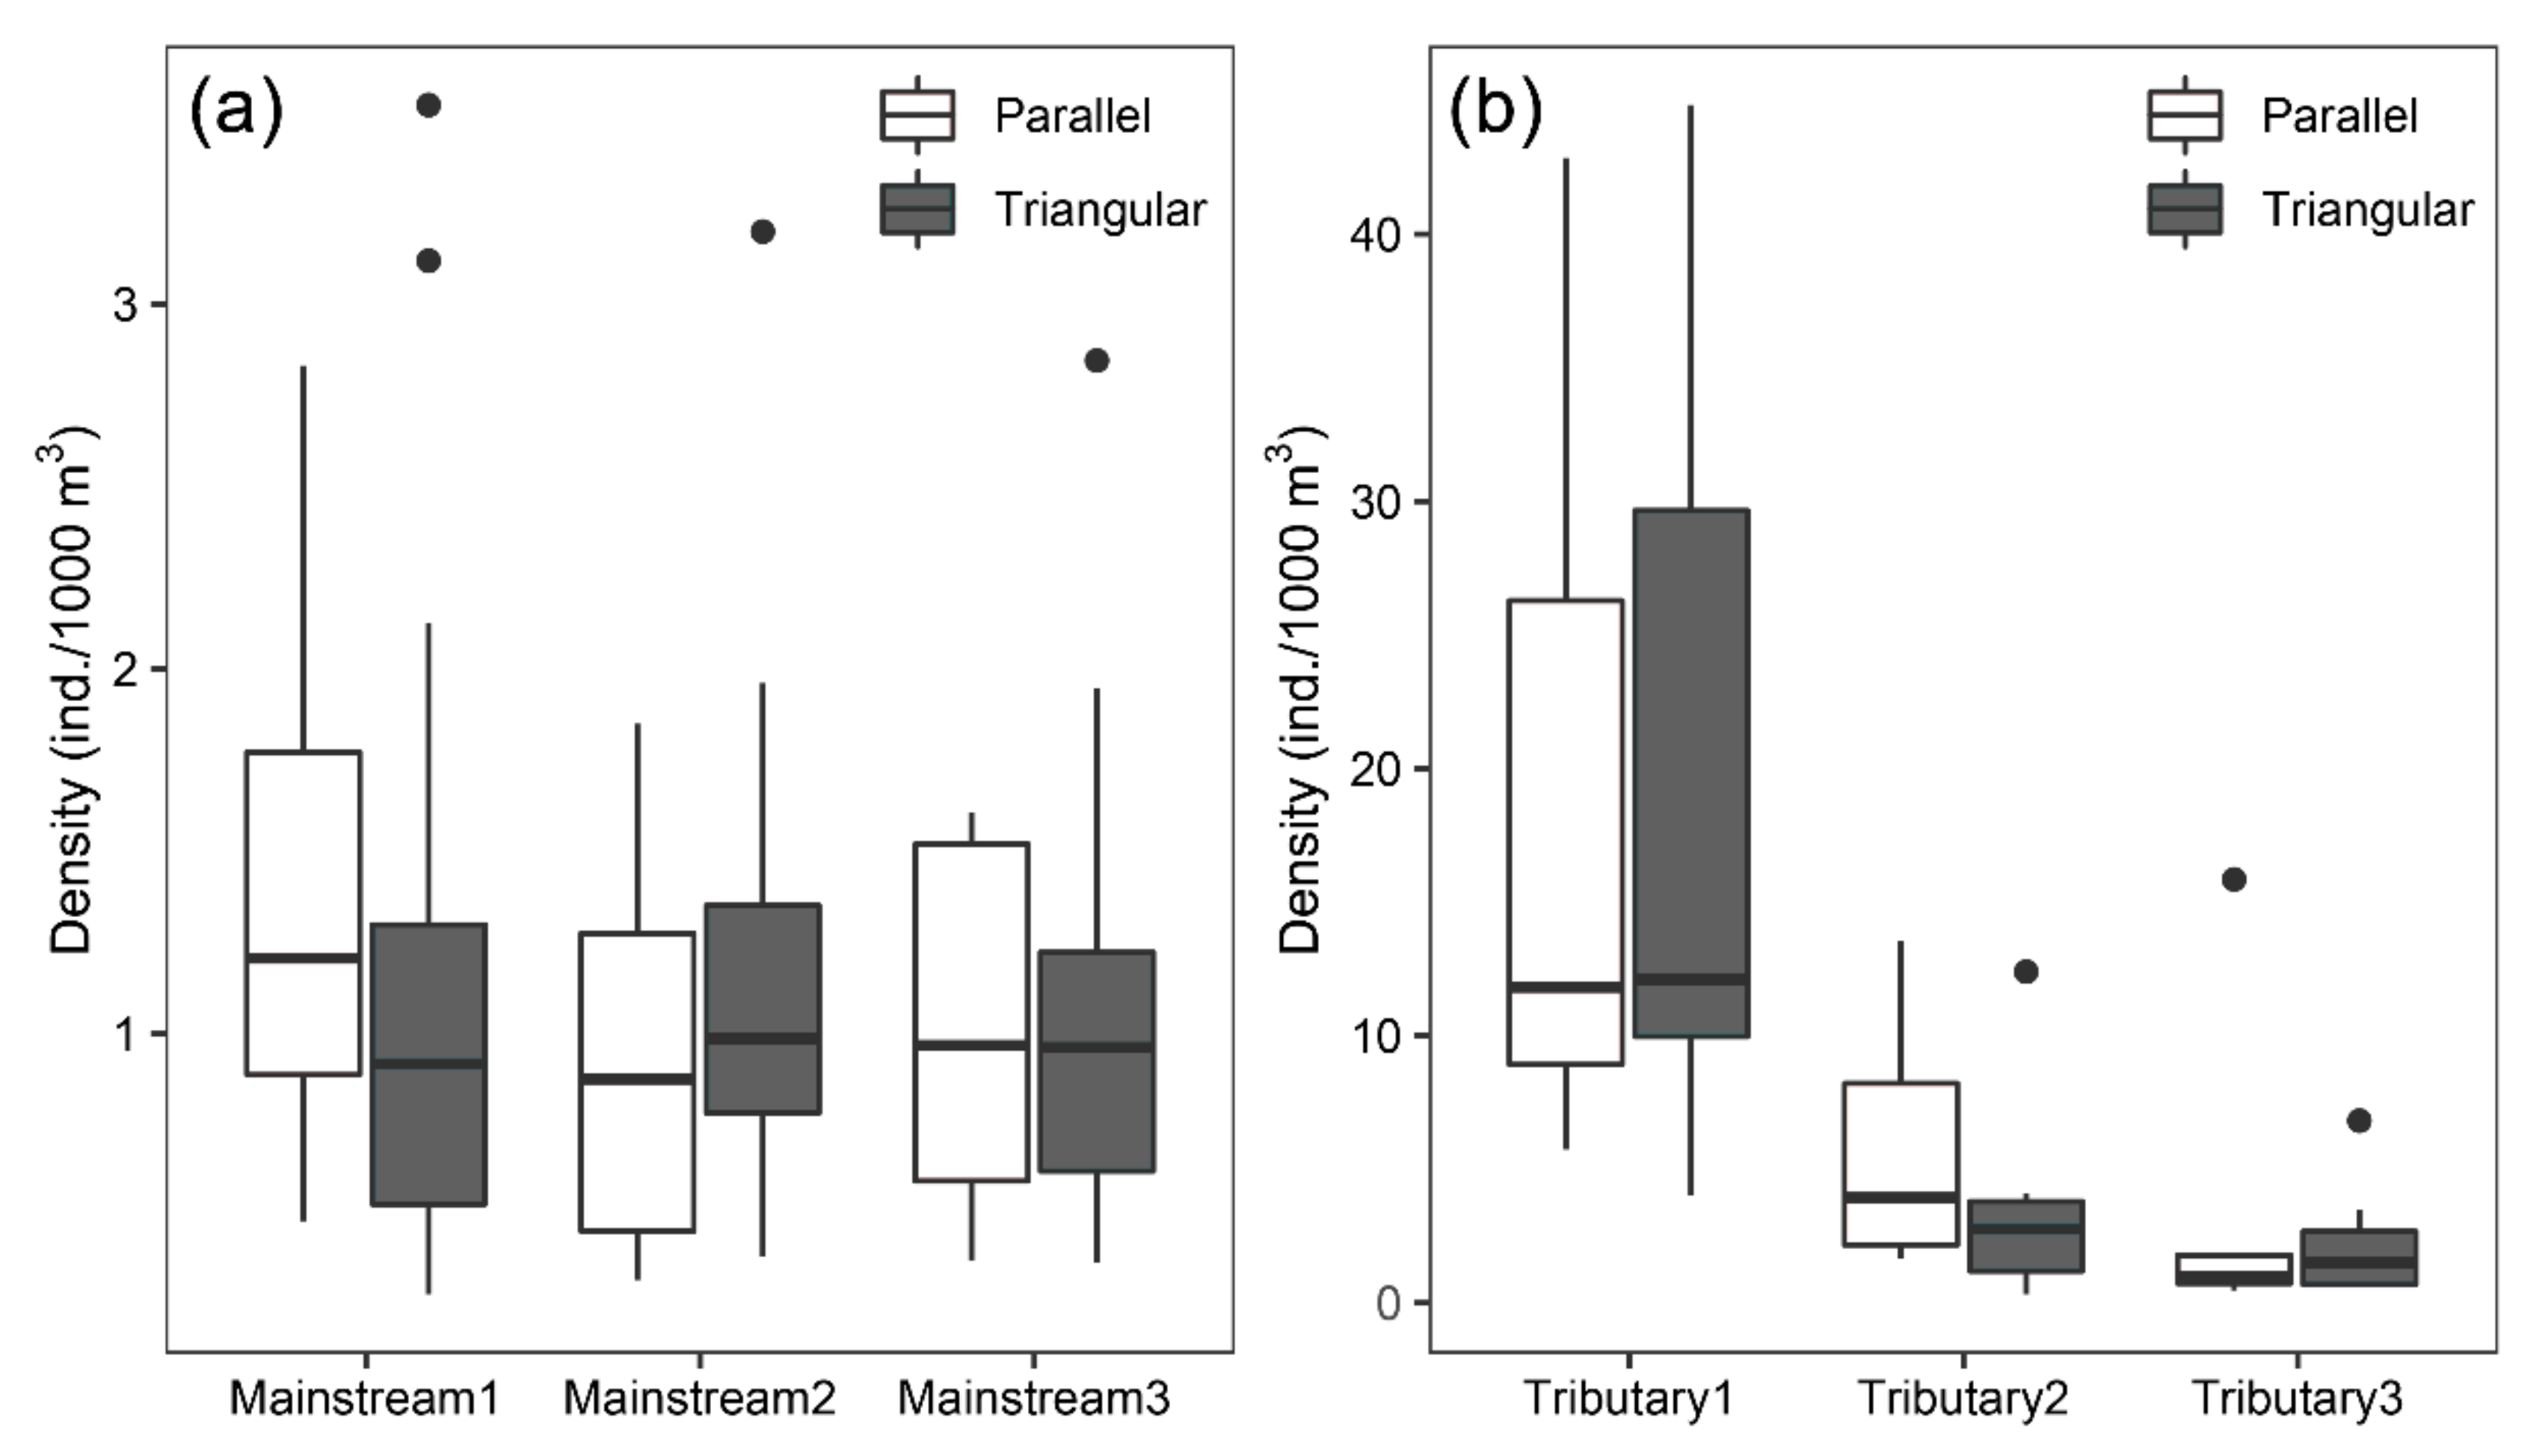
| Survey Unit | Survey Design | Density (ind./1000 m3) | Shapiro–Wilk Test | t-Test | |||||
|---|---|---|---|---|---|---|---|---|---|
| Minimum | Maximum | Mean | SD | W | p | df | p | ||
| Mainstream1 | Parallel | 0.49 | 2.83 | 1.35 | 0.67 | 0.987 | 0.998 | 32 | 0.225 |
| Triangular | 0.29 | 3.55 | 1.15 | 0.87 | 0.970 | 0.732 | |||
| Mainstream2 | Parallel | 0.32 | 1.85 | 0.95 | 0.58 | 0.928 | 0.496 | 23 | 0.267 |
| Triangular | 0.39 | 3.20 | 1.16 | 0.66 | 0.976 | 0.907 | |||
| Mainstream3 | Parallel | 0.38 | 1.61 | 1.02 | 0.55 | 0.861 | 0.194 | 20 | 0.835 |
| Triangular | 0.37 | 2.85 | 1.08 | 0.65 | 0.971 | 0.856 | |||
| Tributary1 | Parallel | 5.74 | 42.85 | 18.68 | 12.09 | 0.926 | 0.518 | 12 | 0.927 |
| Triangular | 4.01 | 44.83 | 20.03 | 11.31 | 0.958 | 0.803 | |||
| Tributary2 | Parallel | 1.64 | 13.53 | 5.90 | 4.99 | 0.947 | 0.715 | 9 | 0.320 |
| Triangular | 0.32 | 12.39 | 3.84 | 4.42 | 0.960 | 0.816 | |||
| Tributary3 | Parallel | 0.47 | 15.85 | 3.19 | 5.61 | 0.835 | 0.089 | 12 | 0.888 |
| Triangular | 0.62 | 6.82 | 2.23 | 2.26 | 0.904 | 0.356 | |||
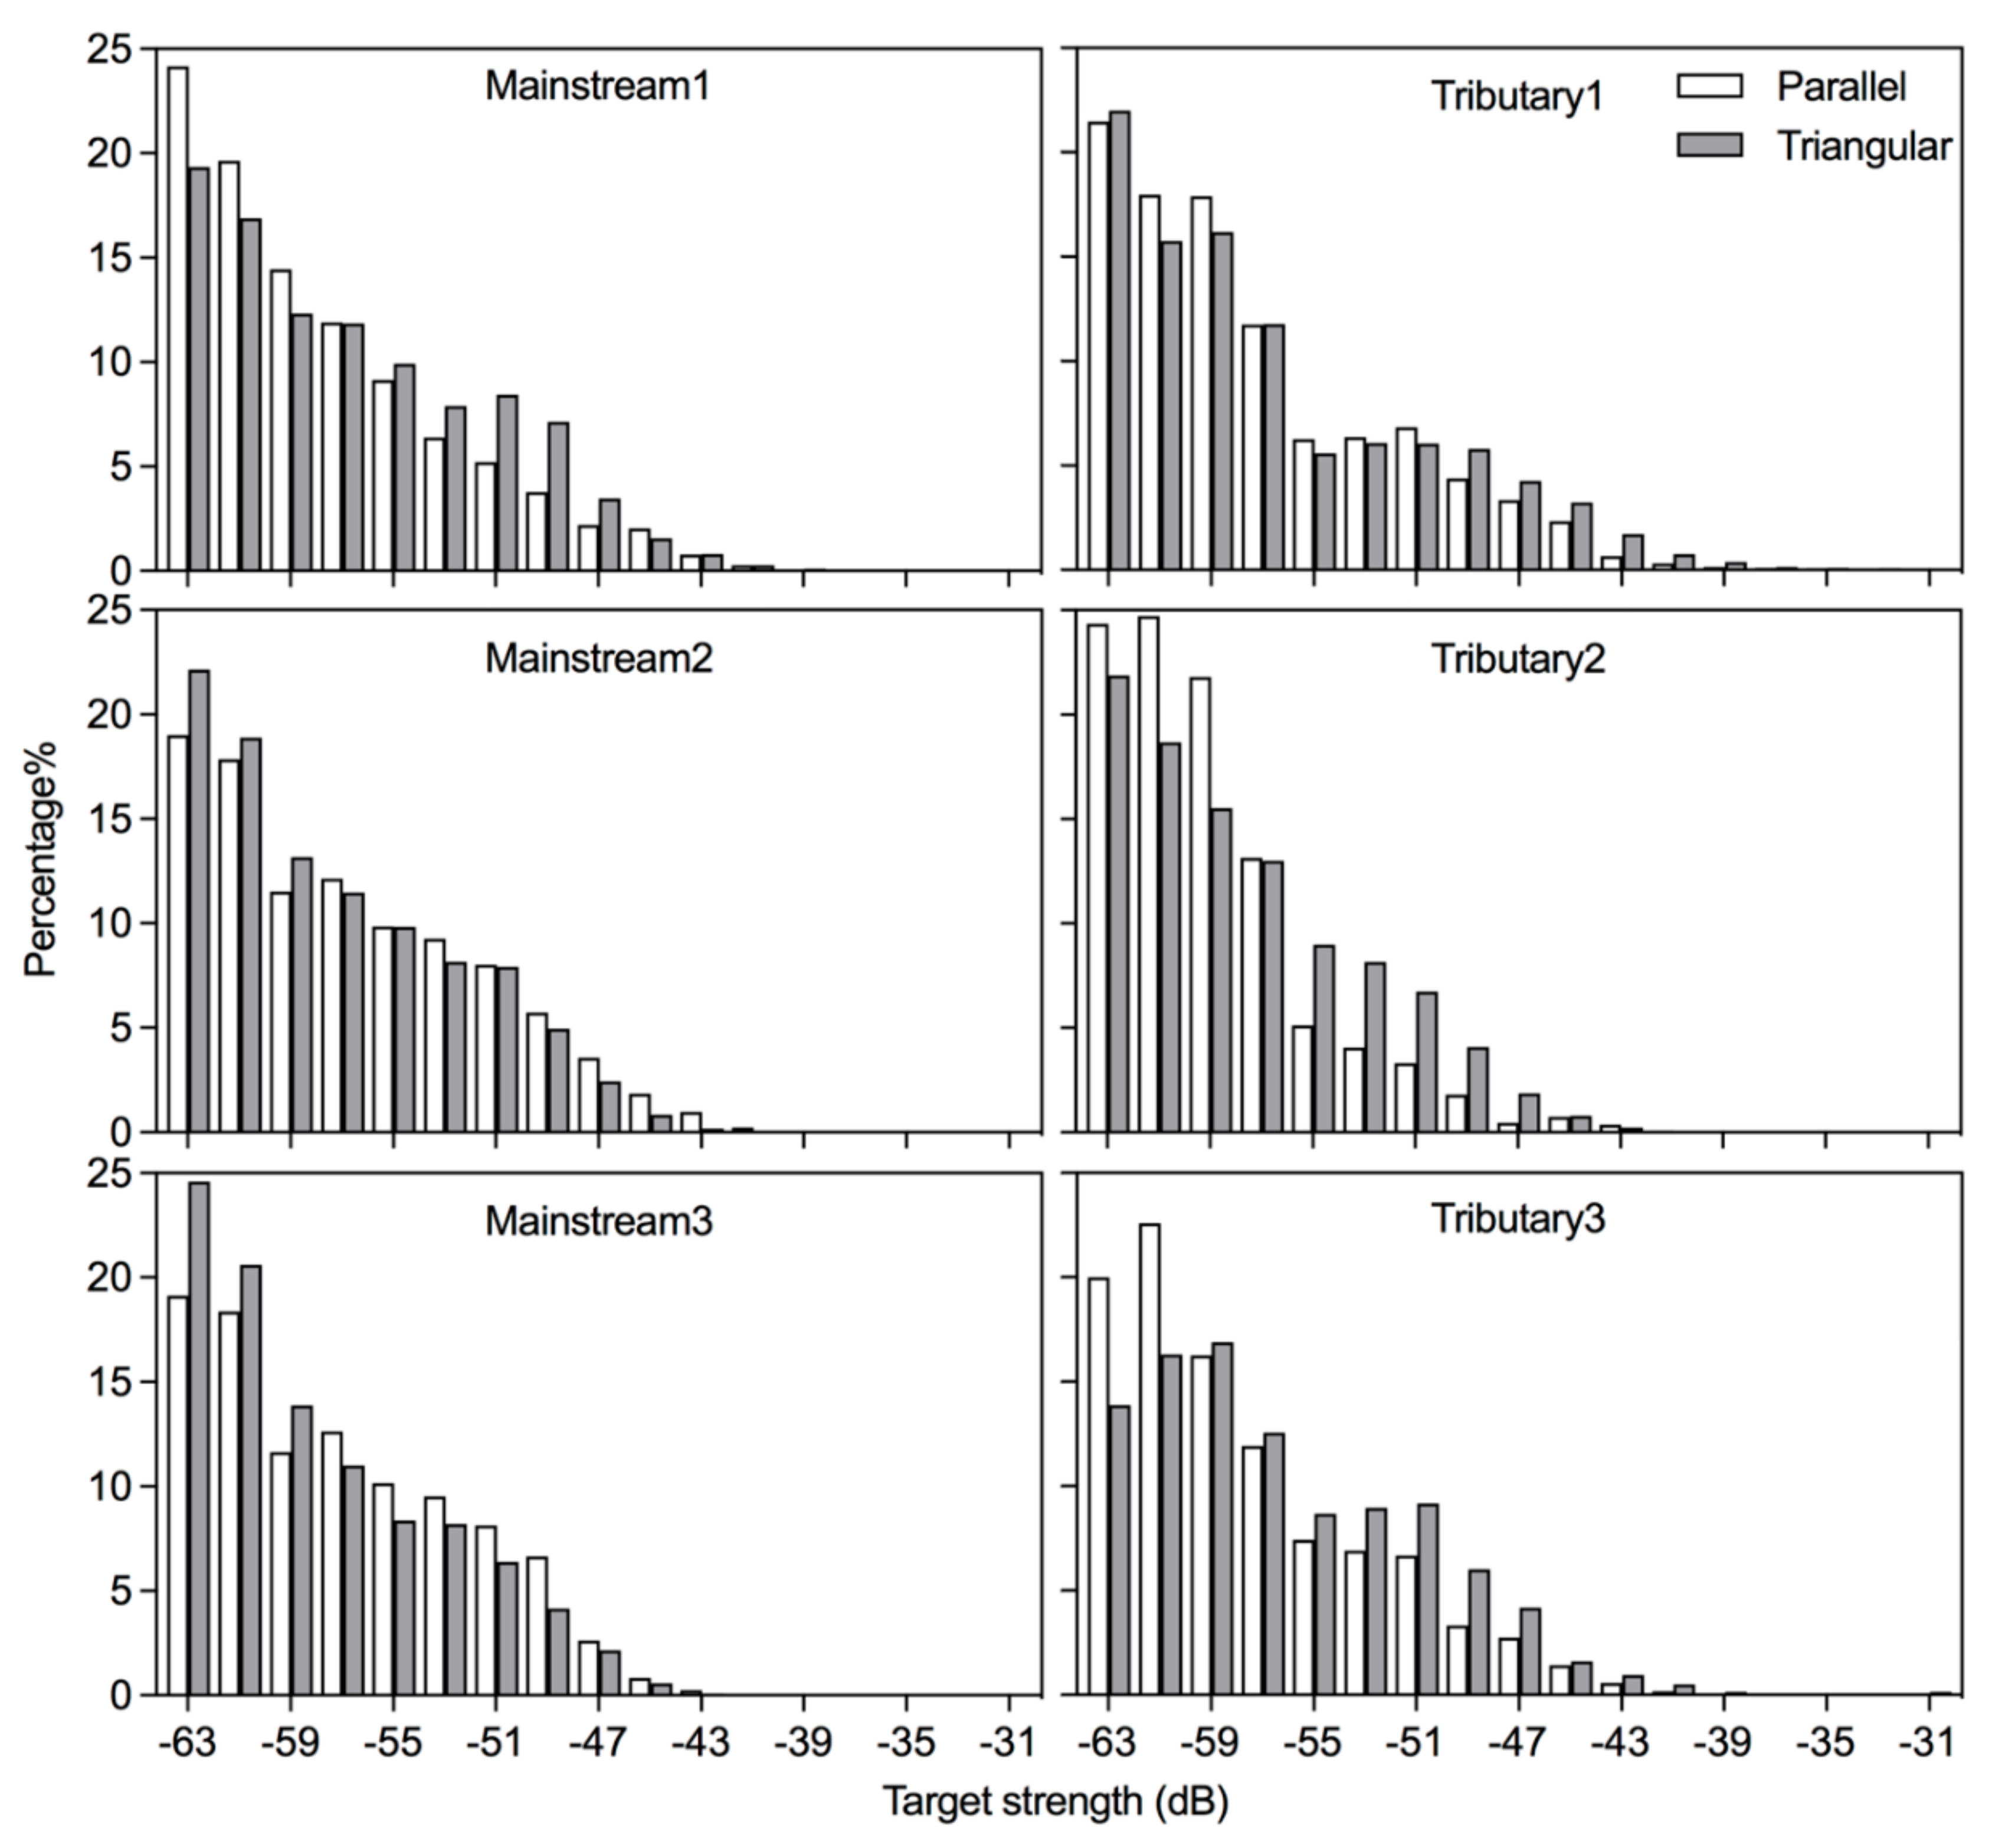
| Survey Unit | Survey Design | Target Strength (dB) | Fisher’s Exact Test | |||||
|---|---|---|---|---|---|---|---|---|
| Minimum | Maximum | Mean | SD | N | df | p | ||
| Mainstream1 | Parallel | −64.0 | −40.2 | −56.2 | 6.0 | 6612 | 16 | 0.980 |
| Triangular | −64.0 | −39.7 | −54.8 | 6.5 | 6096 | |||
| Mainstream2 | Parallel | −64.0 | −40.2 | −55.0 | 6.5 | 5803 | 16 | 0.999 |
| Triangular | −64.0 | −42.8 | −57.2 | 5.8 | 6107 | |||
| Mainstream3 | Parallel | −64.0 | −42.0 | −55.8 | 6.2 | 5020 | 16 | 0.958 |
| Triangular | −64.0 | −42.9 | −57.0 | 5.7 | 6172 | |||
| Tributary1 | Parallel | −64.0 | −34.7 | −54.5 | 6.1 | 1759 | 16 | 0.999 |
| Triangular | −64.0 | −32.2 | −52.8 | 6.7 | 1712 | |||
| Tributary2 | Parallel | −64.0 | −36.3 | −57.8 | 4.9 | 4544 | 16 | 0.495 |
| Triangular | −64.0 | −37.9 | −56.4 | 5.7 | 5018 | |||
| Tributary3 | Parallel | −64.0 | −26.5 | −52.6 | 5.8 | 1759 | 16 | 0.919 |
| Triangular | −64.0 | −26.6 | −50.4 | 6.4 | 1712 | |||
Publisher’s Note: MDPI stays neutral with regard to jurisdictional claims in published maps and institutional affiliations. |
© 2022 by the authors. Licensee MDPI, Basel, Switzerland. This article is an open access article distributed under the terms and conditions of the Creative Commons Attribution (CC BY) license (https://creativecommons.org/licenses/by/4.0/).
Share and Cite
Lian, Y.; Ye, S.; Godlewska, M.; Huang, G.; Wang, J.; Liu, J.; Li, Z. Comparison of Two Types of Survey Designs for Acoustic Estimates of Fish Resources in the Three Gorges Reservoir, China. Water 2022, 14, 2745. https://doi.org/10.3390/w14172745
Lian Y, Ye S, Godlewska M, Huang G, Wang J, Liu J, Li Z. Comparison of Two Types of Survey Designs for Acoustic Estimates of Fish Resources in the Three Gorges Reservoir, China. Water. 2022; 14(17):2745. https://doi.org/10.3390/w14172745
Chicago/Turabian StyleLian, Yuxi, Shaowen Ye, Małgorzata Godlewska, Geng Huang, Jiacheng Wang, Jiashou Liu, and Zhongjie Li. 2022. "Comparison of Two Types of Survey Designs for Acoustic Estimates of Fish Resources in the Three Gorges Reservoir, China" Water 14, no. 17: 2745. https://doi.org/10.3390/w14172745
APA StyleLian, Y., Ye, S., Godlewska, M., Huang, G., Wang, J., Liu, J., & Li, Z. (2022). Comparison of Two Types of Survey Designs for Acoustic Estimates of Fish Resources in the Three Gorges Reservoir, China. Water, 14(17), 2745. https://doi.org/10.3390/w14172745