
Hazard Zonation and Risk Assessment of a Debris Flow under Different Rainfall Condition in Wudu District, Gansu Province, Northwest China

Abstract
:1. Introduction
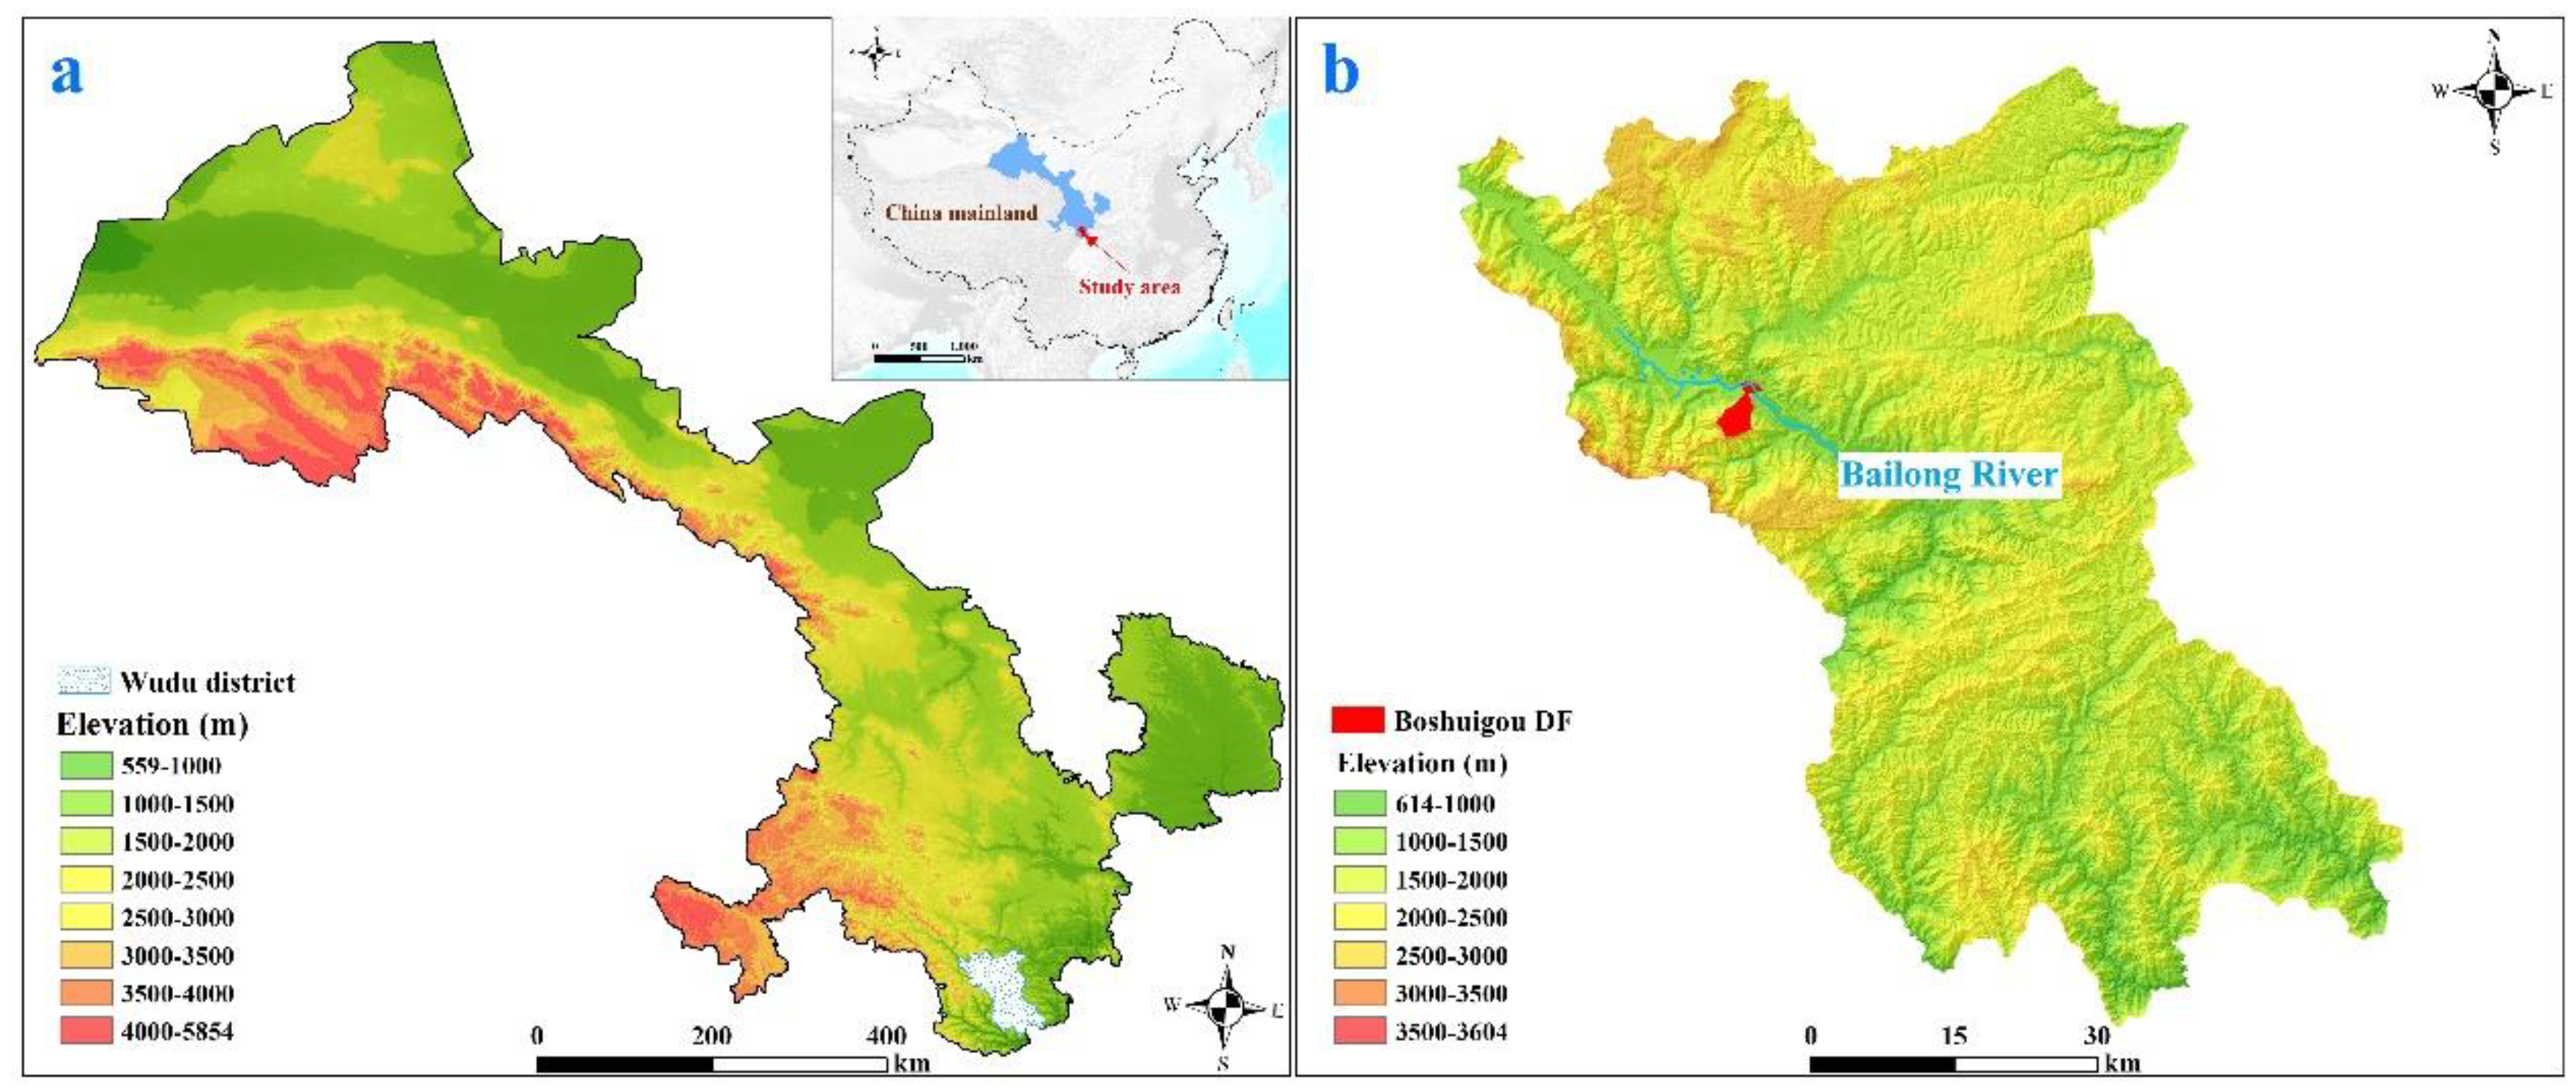
2. Site Features
2.1. Geomorphological and Topographic Features
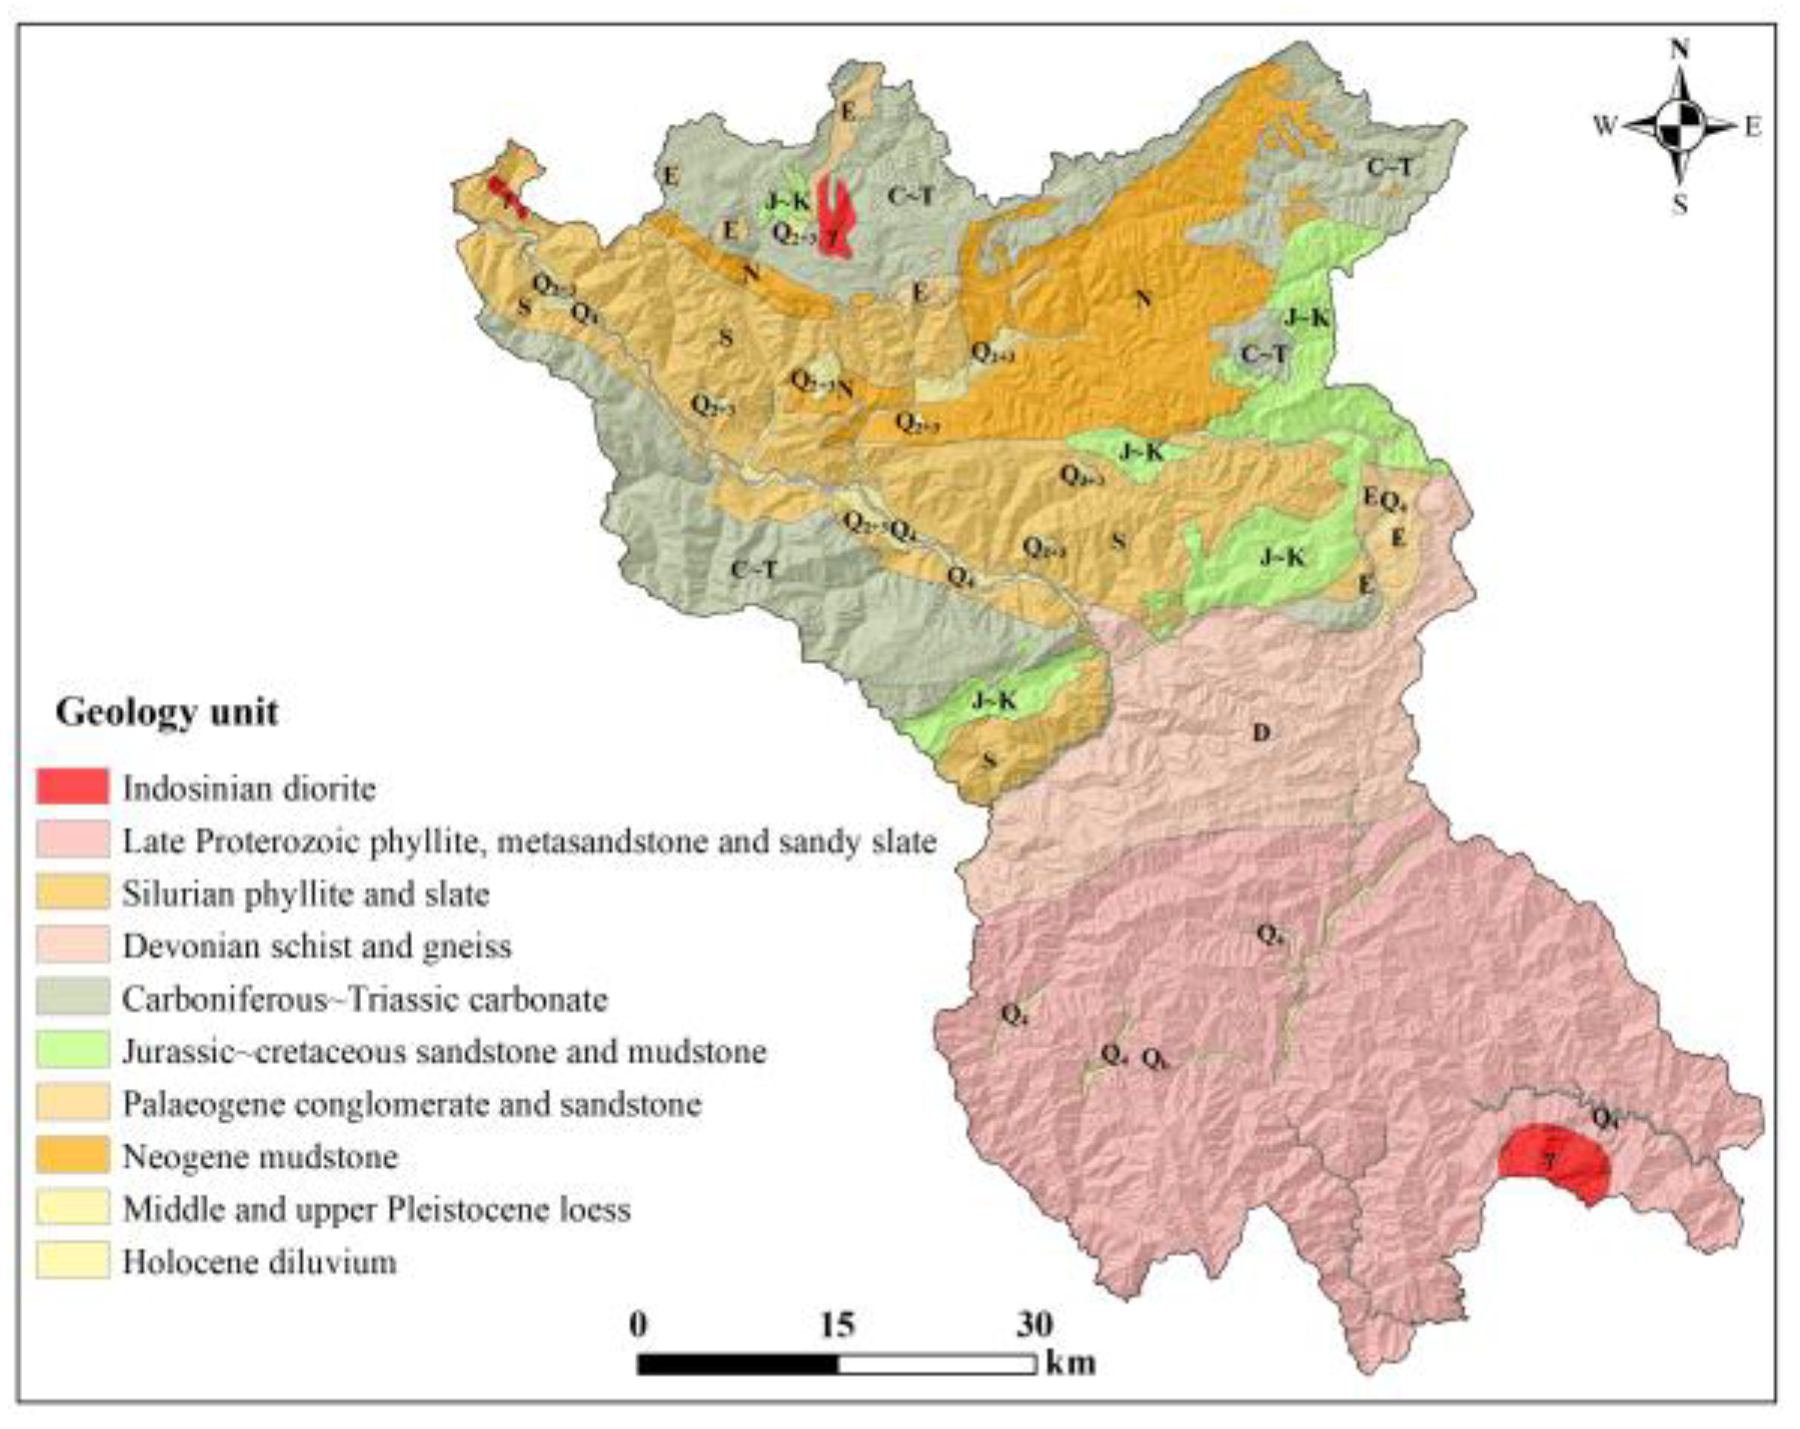
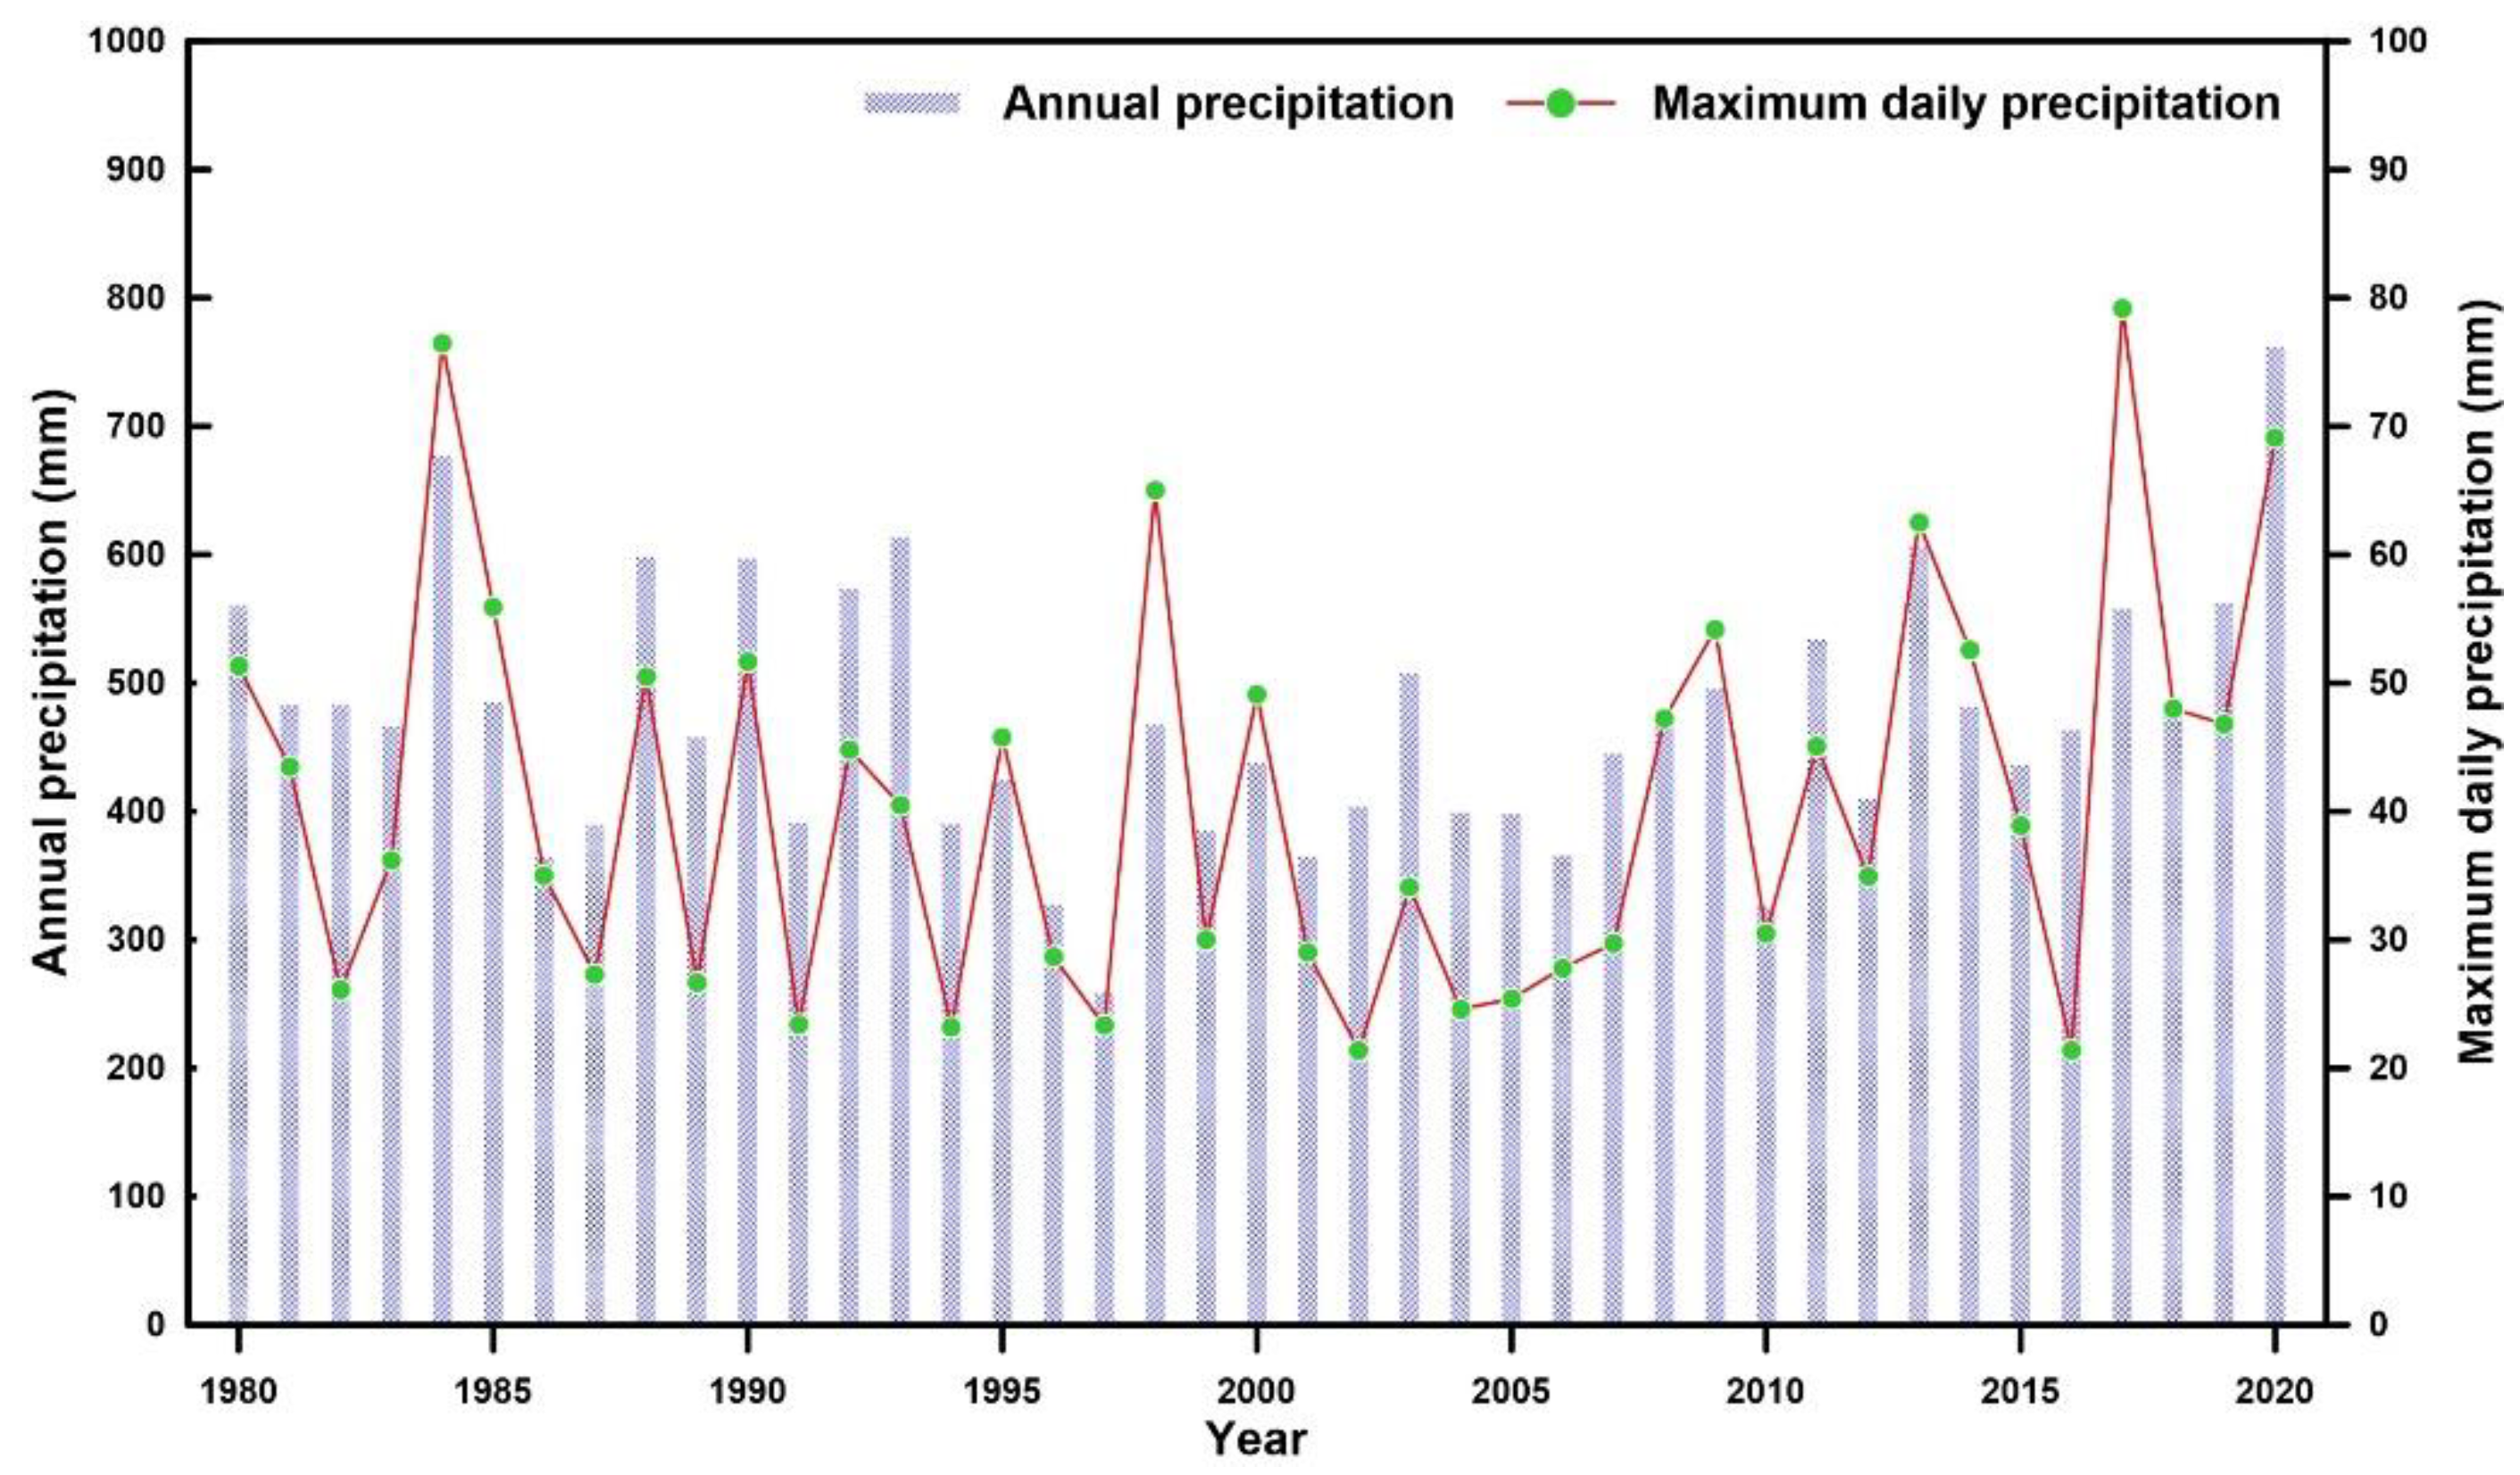
2.2. Geological Setting and Precipitation Condition
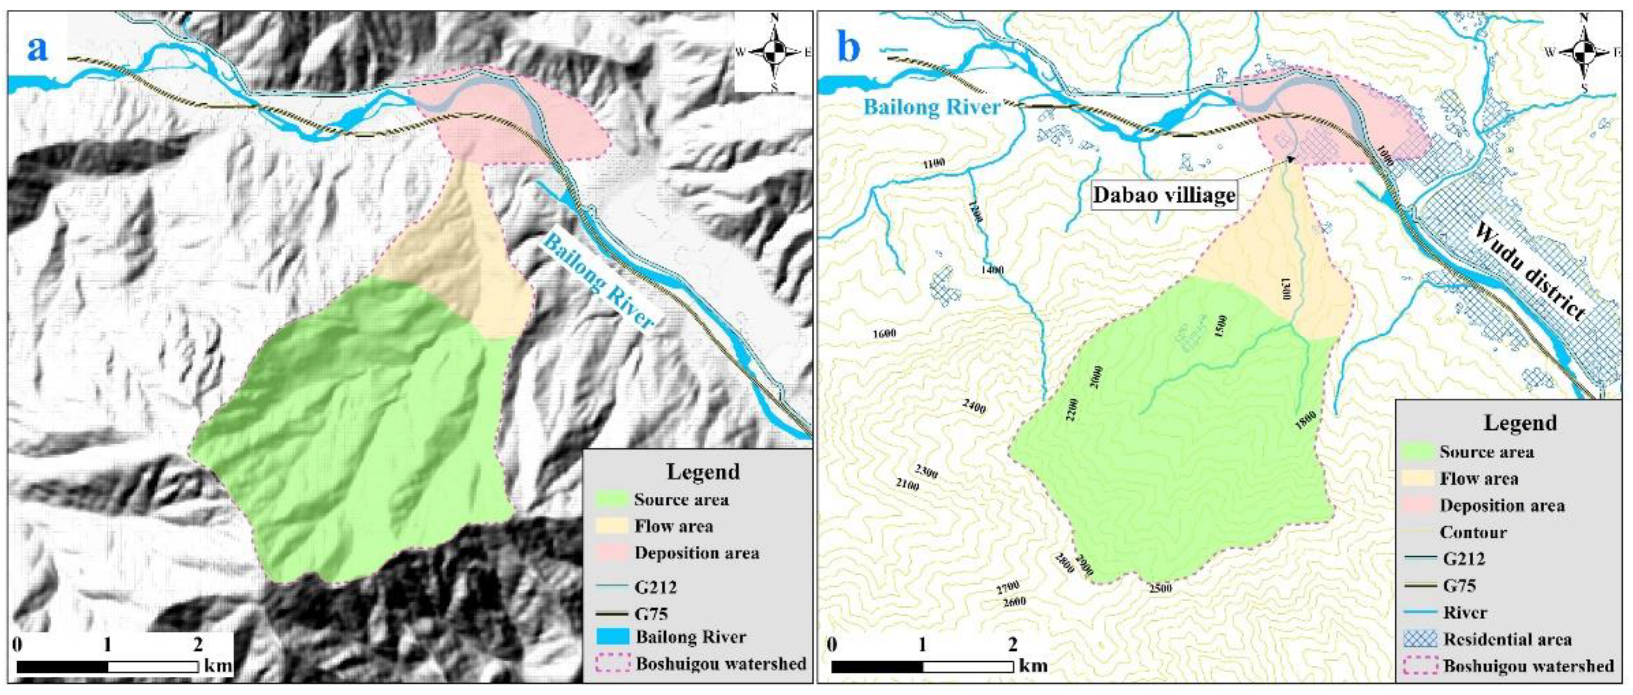
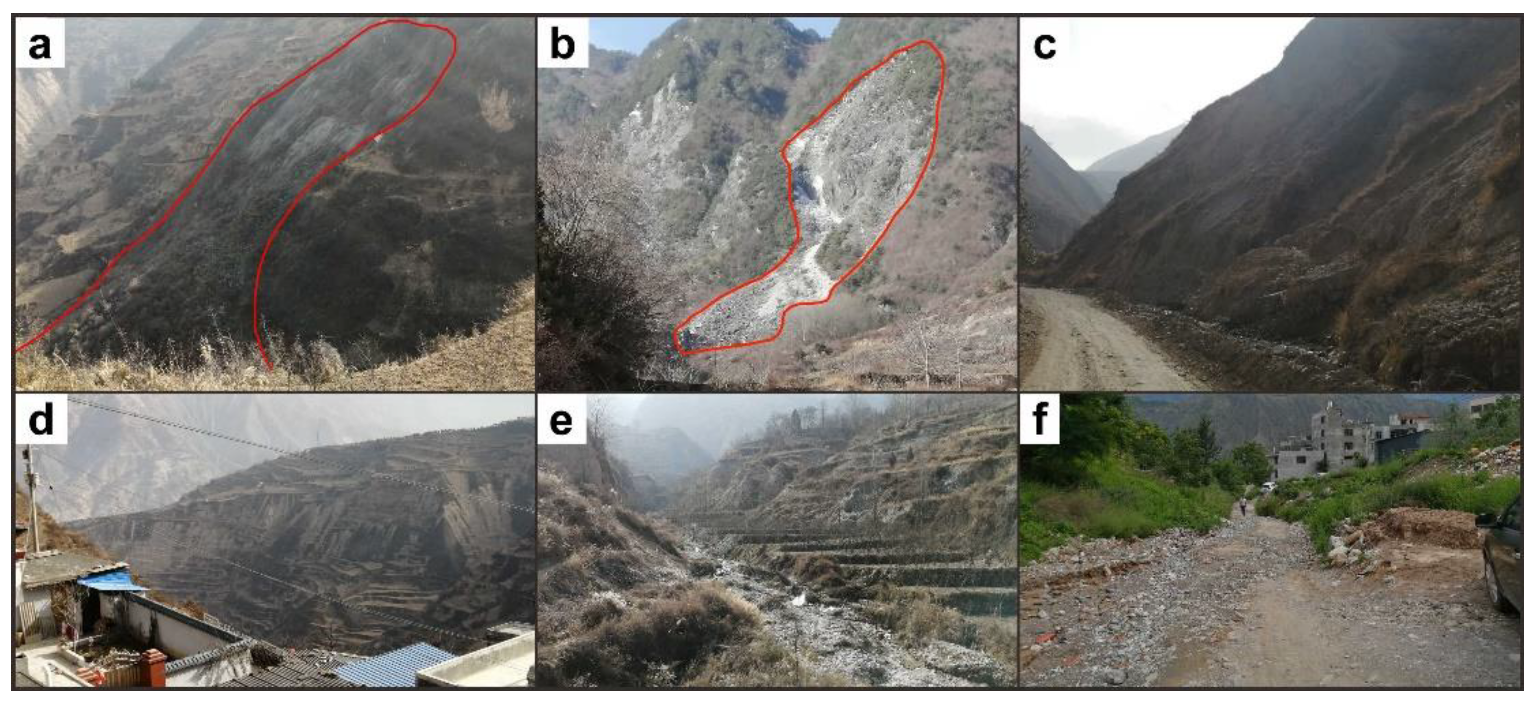
3. Characteristics and Source of the Boshuigou Debris Flow
3.1. Formation Feature
3.2. Main Source of the Debris Flow
4. Flow Simulation under Different Return-Period Rainfalls
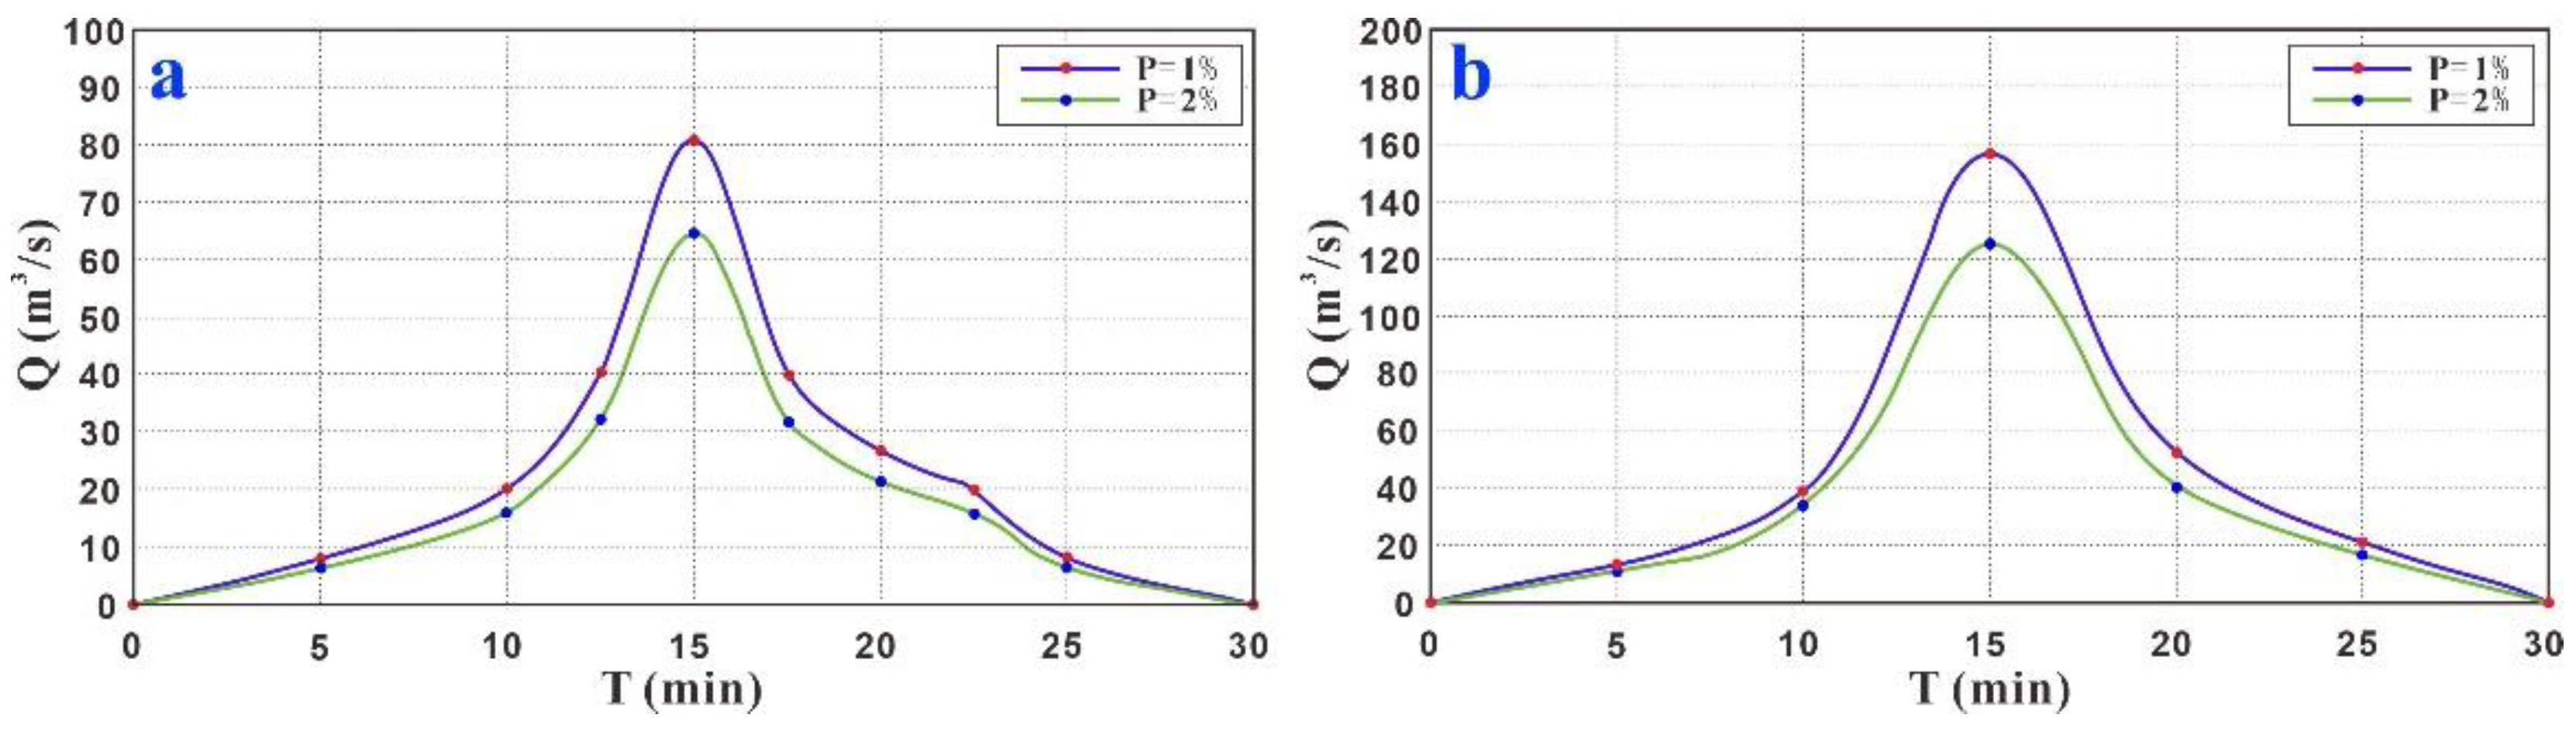
4.1. Fluid Feature of the Debris Flow
4.2. Key Parameters of the FLO-2D Simulation
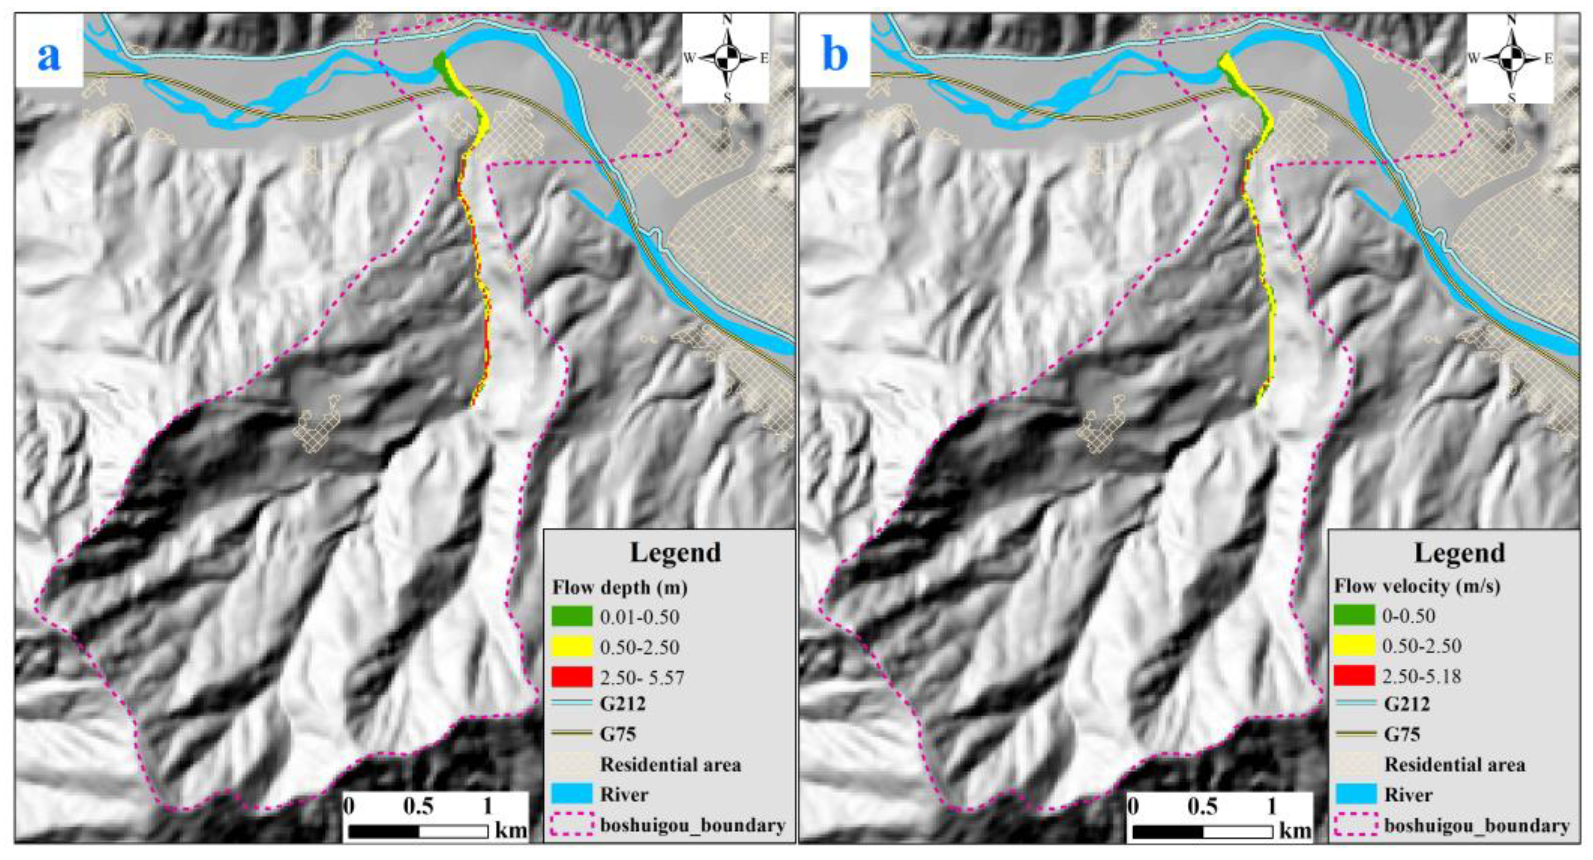
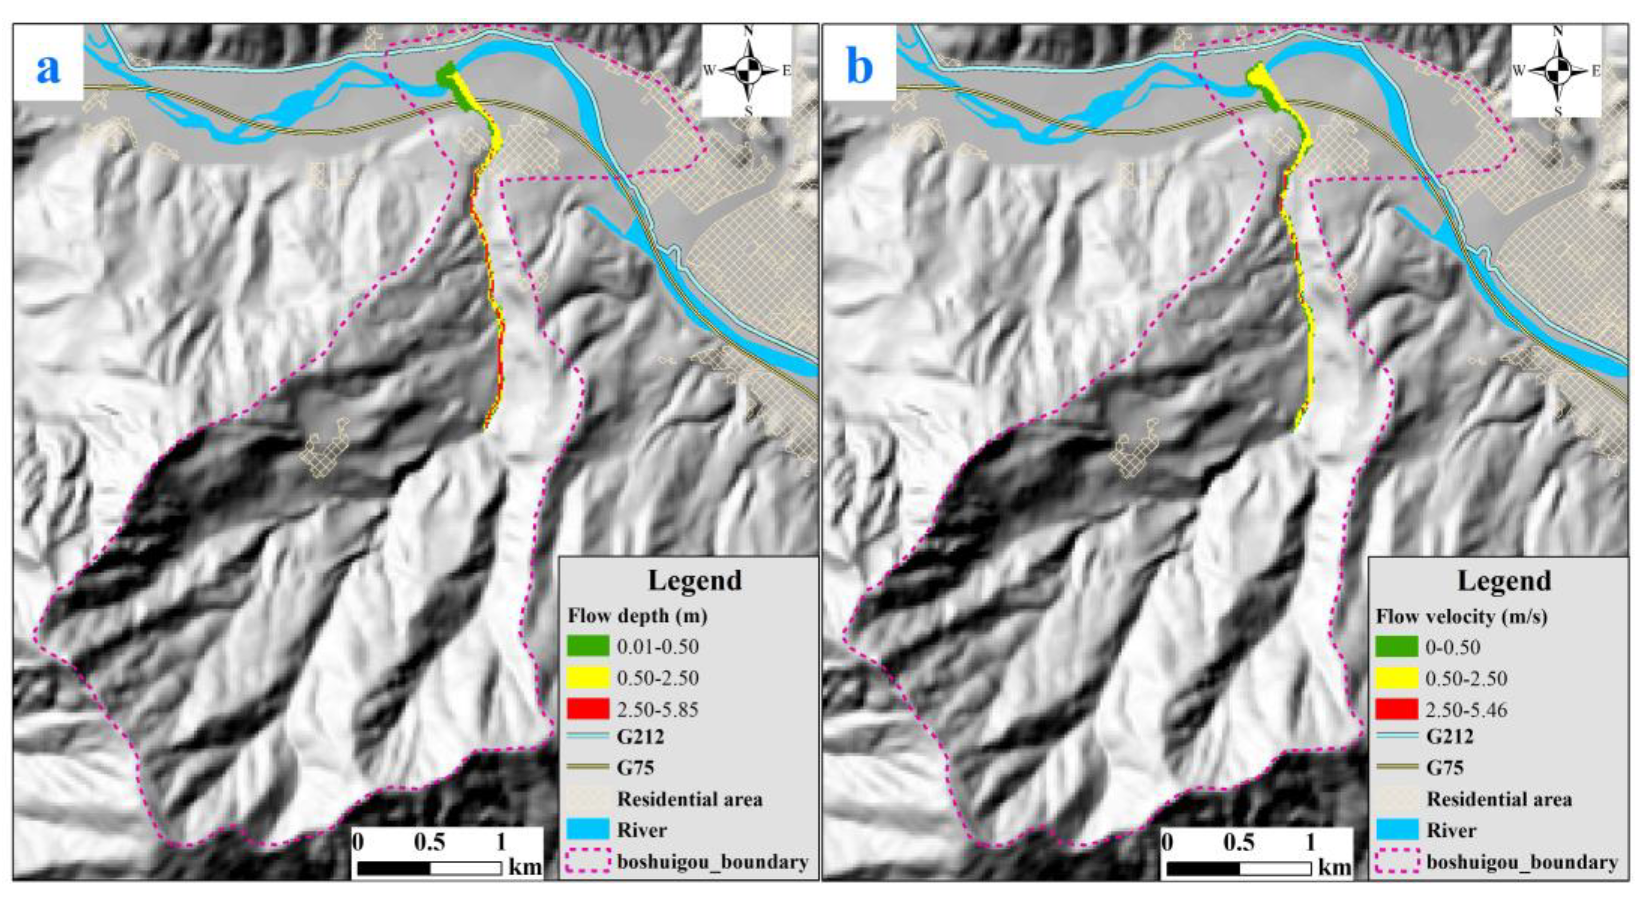
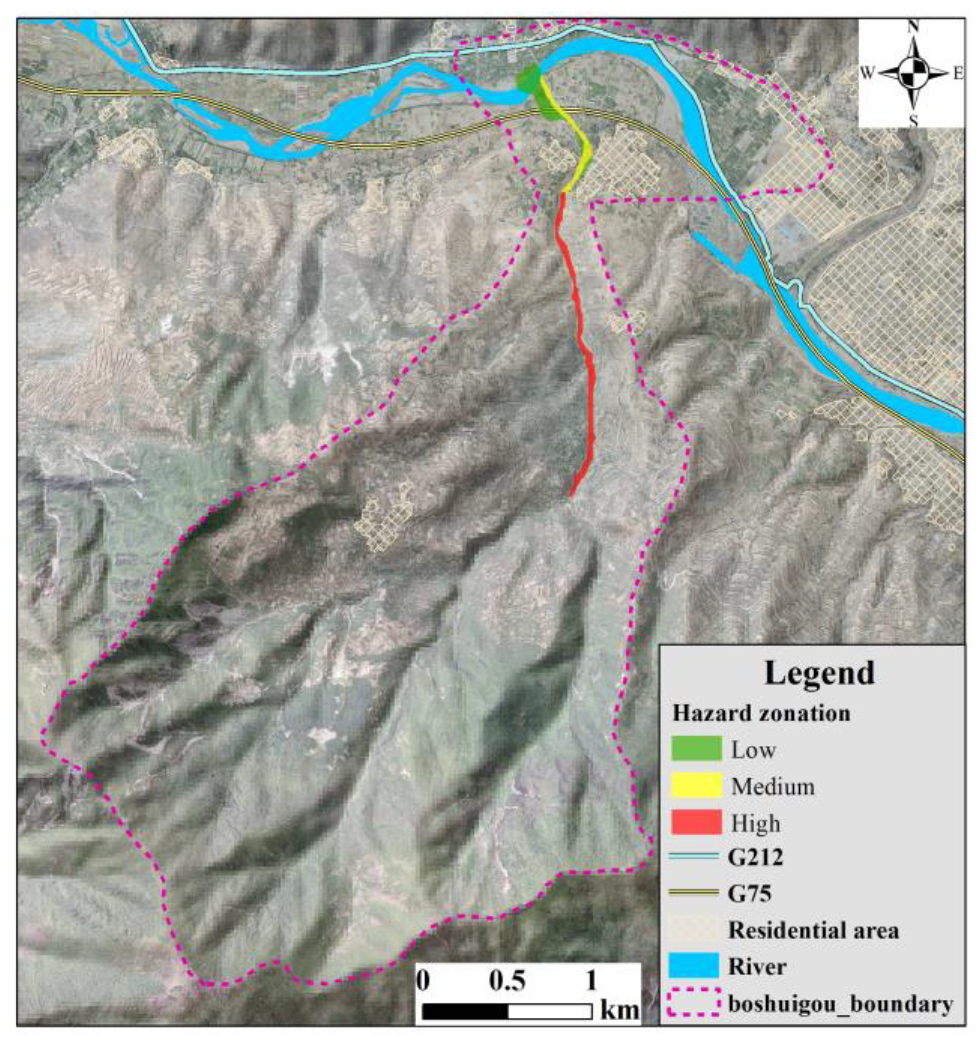
4.3. Simulation Result and Hazard Zonation
5. Risk Assessment
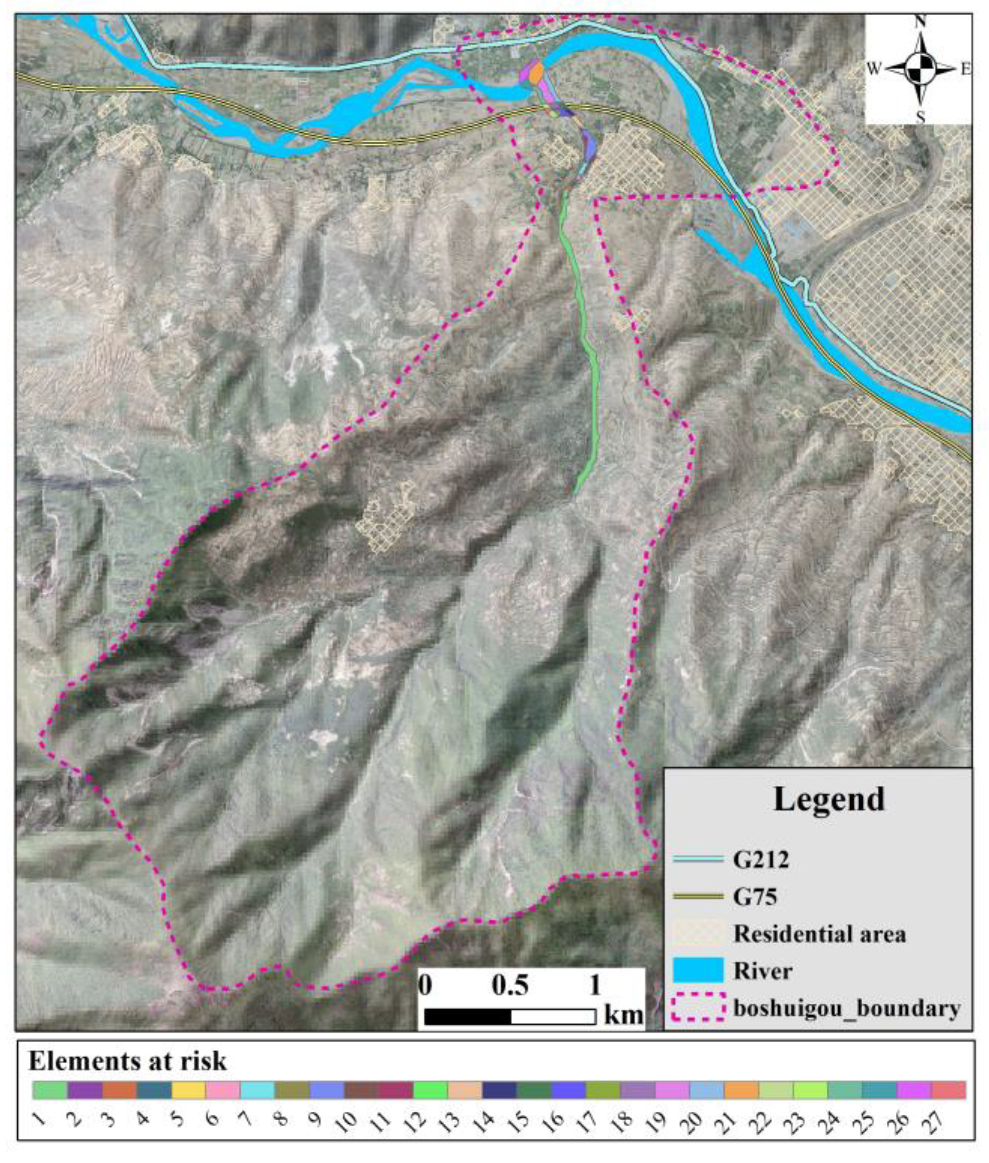
5.1. Classification of Assessment Unit and Their Vulnerability Assessment
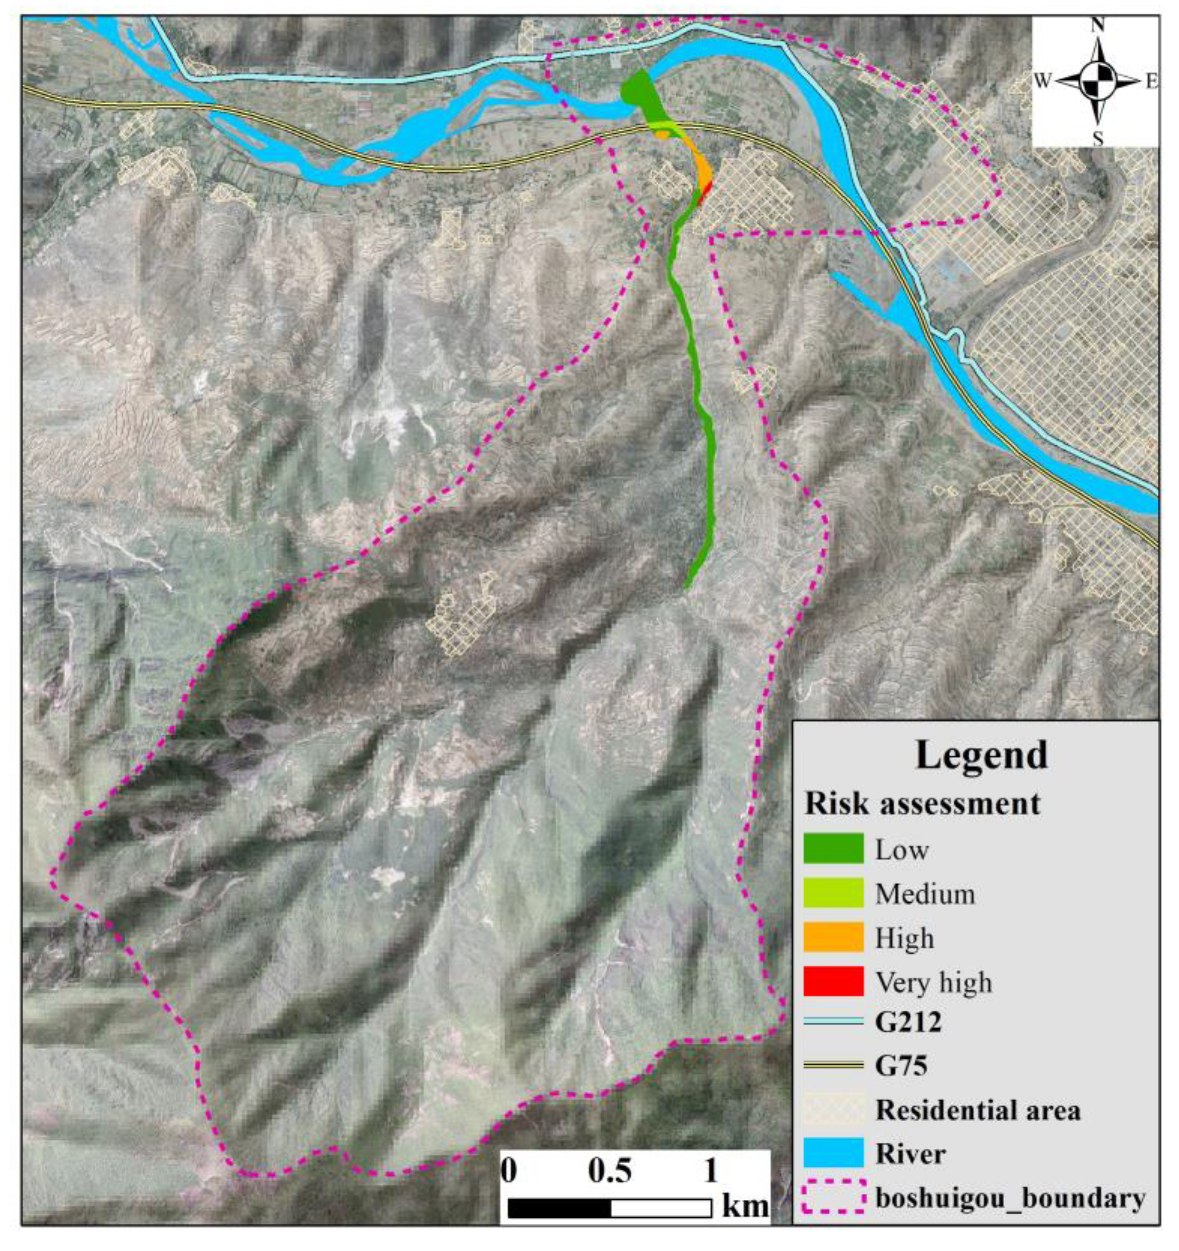
5.2. Risk Assessment and Risk Zonation
6. Discussion and Conclusions
Author Contributions
Funding
Institutional Review Board Statement
Informed Consent Statement
Data Availability Statement
Acknowledgments
Conflicts of Interest
References
- Fiorillo, F.; Wilson, R.C. Rainfall induced debris flows in pyroclastic deposits, Campania (southern Italy). Eng. Geol. 2004, 75, 263–289. [Google Scholar] [CrossRef]
- Lu, G.Y.; Chiu, L.S.; Wong, D.W. Vulnerability assessment of rainfall-induced debris flows in Taiwan. Nat. Hazards 2007, 43, 223–244. [Google Scholar] [CrossRef]
- Zhang, N.; Matsushima, T. Simulation of rainfall-induced debris flow considering material entrainment. Eng. Geol. 2016, 214, 107–115. [Google Scholar] [CrossRef]
- Ietto, F.; Perri, F. Flash flood event (October 2010) in the Zinzolo catchment (Calabria, southern Italy). Rend. Online Soc. Geol. Ital. 2015, 35, 170–173. [Google Scholar] [CrossRef]
- John, C.K.; Pu, J.H.; Pandey, M.; Moruzzi, R. Impacts of sedimentation on rainwater quality: Case study at Ikorodu of Lagos, Nigeria. Water Supply 2021, 21, 3356–3369. [Google Scholar] [CrossRef]
- John, C.K.; Pu, J.H.; Moruzzi, R.; Pandey, M. Health-risk assessment for roof-harvested rainwater via QMRA in Ikorodu area, Lagos, Nigeria. J. Water Clim. Chang. 2021, 12, 2479–2494. [Google Scholar] [CrossRef]
- Sepulveda, S.A.; Rebolledo, S.; McPhee, J.; Lara, M.; Cartes, M.; Rubio, E.; Silva, D.; Correia, N.; Vasquez, J.P. Catastrophic, rainfall-induced debris flows in Andean villages of Tarapaca, Atacama Desert, northern Chile. Landslides 2014, 11, 481–491. [Google Scholar] [CrossRef]
- DeGraff, J.V.; Wagner, D.L.; Gallegos, A.J.; DeRose, M.; Shannon, C.; Ellsworth, T. The remarkable occurrence of large rainfall-induced debris flows at two different locations on July 12, 2008, Southern Sierra Nevada, CA, USA. Landslides 2011, 8, 343–353. [Google Scholar] [CrossRef]
- García-Delgado, H.; Machuca, S.; Medina, E. Dynamic and geomorphic characterizations of the Mocoa debris flow (March 31, 2017, Putumayo Department, southern Colombia). Landslides 2019, 16, 597–609. [Google Scholar] [CrossRef]
- Zhang, S.; Wang, F.; Li, R. First insight into the catastrophic Atami debris flow induced by a rain gush on 3 July 2021 in Shizuoka, Japan. Landslides 2022, 19, 527–532. [Google Scholar] [CrossRef]
- Xiao, H.; Luo, Z.; Niu, Q.; Chang, J. The 2010 Zhouqu mudflow disaster: Possible causes, human contributions, and lessons learned. Nat. Hazards 2013, 67, 611–625. [Google Scholar] [CrossRef]
- Zhai, Z.H.; Shen, W.; Li, T.L.; Zhang, Z.H.; Yin, X.D.; Zhang, G.W. Analysis and simulation of the landslide-debris flow hazard in Dagou village, Tianshui city. J. Eng. Geol. 2017, 25, 400–406. [Google Scholar]
- Li, Y.; Chen, J.; Li, Z.; Han, X.; Zhai, S.; Li, Y.; Zhang, Y. A case study of debris flow risk assessment and hazard range prediction based on a neural network algorithm and finite volume shallow water flow model. Environ. Earth Sci. 2021, 80, 275. [Google Scholar] [CrossRef]
- Hou, S.; Cao, P.; Li, A.; Chen, L.; Feng, Z.; Liu, J.; Wang, L. Debris flow hazard assessment of the Eryang River watershed based on numerical simulation. Hydrogeol. Eng. Geol. 2021, 48, 143–151. [Google Scholar] [CrossRef]
- Giannecchini, R.; Naldini, D.; Avanzi, G.D.A.; Puccinelli, A. Modelling of the initiation of rainfall-induced debris flows in the Cardoso basin (Apuan Alps, Italy). Quat. Int. 2007, 171, 108–117. [Google Scholar] [CrossRef]
- Zhou, J.W.; Cui, P.; Yang, X.G.; Su, Z.M.; Guo, X.J. Debris flows introduced in landslide deposits under rainfall conditions: The case of Wenjiagou gully. J. Mt. Sci. 2013, 10, 249–260. [Google Scholar] [CrossRef]
- Hu, W.; Xu, Q.; Van Asch, T.W.J.; Zhu, X.; Xu, Q.Q. Flume tests to study the initiation of huge debris flows after the Wenchuan earthquake in SW China. Eng. Geol. 2014, 182, 121–129. [Google Scholar] [CrossRef]
- Li, Q.; Huang, D.; Pei, S.; Qiao, J.; Wang, M. Using Physical Model Experiments for Hazards Assessment of Rainfall-Induced Debris Landslides. J. Earth Sci. 2021, 32, 1113–1128. [Google Scholar] [CrossRef]
- Zhang, F.; Zhang, L.; Zhou, J. Risk assessment of debris flow in Ruoru Village, Tibet Based on FLO-2D. J. Water Resour. Water Eng. 2019, 30, 95–102. [Google Scholar]
- Ouyang, C.; Wang, Z.; An, H.; Liu, X.; Wang, D. An example of a hazard and risk assessment for debris flows—A case study of Niwan Gully, Wudu, China. Eng. Geol. 2019, 263, 105351. [Google Scholar] [CrossRef]
- Lee, D.H.; Lee, S.R.; Park, J.Y. Numerical simulation of debris flow behavior at Mt. Umyeon using the DAN3D model. J. Korean Soc. Hazard Mitig. 2019, 19, 195–202. [Google Scholar] [CrossRef]
- Cesca, M.; D’Agostino, V. Comparison between FLO-2D and RAMMS in debris-flow modelling: A case study in the Dolomites. WIT Trans. Eng. Sci. 2008, 60, 197–206. [Google Scholar]
- O’Brien, J.D. FLO-2D User’s Manual; Version 2007.06; FLO Engineering: Nutrioso, AZ, USA, 2007. [Google Scholar]
- Erena, S.H.; Worku, H.; De Paola, F. Flood hazard mapping using FLO-2D and local management strategies of Dire Dawa city, Ethiopia. J. Hydrol. Reg. Stud. 2018, 19, 224–239. [Google Scholar] [CrossRef]
- Kim, S.; Paik, J.; Kim, K.S. Run-out modeling of debris flows in Mt. Umyeon using FLO-2D. KSCE J. Civ. Environ. Eng. Res. 2013, 33, 965–974. [Google Scholar]
- Calligaris, C.; Boniello, M.A.; Zini, L. Debris flow modelling in Julian Alps using FLO-2D. WIT Trans. Eng. Sci. 2008, 60, 81–88. [Google Scholar]
- He, P.; Wang, X.; Song, C.; Wang, Q.; Deng, L.; Zhong, S. Cenozoic evolution of the Western Qinling Mt. Range based on thermochronologic and sedimentary records from the Wudu Basin, NE Tibetan Plateau. J. Asian Earth Sci. 2017, 138, 484–494. [Google Scholar] [CrossRef]
- Zhao, B.; Wang, Y.; Chen, M.; Luo, Y.; Liang, R.; Li, J. Typical characteristics of large-scale landslides in the transition belt between the Qinghai-Tibet Plateau and the Loess Plateau. Arab. J. Geosci. 2019, 12, 470. [Google Scholar] [CrossRef]
- Yang, X.; Dong, Y.; Xiang, L.; Feng, Y.; Liu, D.; Luo, L.; Sun, J.; Li, D.; Li, X.; Shen, N.; et al. Two phases of Cenozoic deformation in the Wudu Basin, West Qinling (Central China): Implications for outward expansion of the Tibetan Plateau. J. Asian Earth Sci. 2022, 229, 105152. [Google Scholar] [CrossRef]
- Chang, M.; Tang, C.; Van Asch, T.W.J.; Cai, F. Hazard assessment of debris flows in the Wenchuan earthquake-stricken area, South West China. Landslides 2017, 14, 1783–1792. [Google Scholar] [CrossRef]
- Chang, M.; Liu, Y.; Zhou, C.; Che, H. Hazard assessment of a catastrophic mine waste debris flow of Hou Gully, Shimian, China. Eng. Geol. 2020, 275, 105733. [Google Scholar] [CrossRef]
- Kim, T.Y.; Yun, H.S.; Kwon, J.H. A Study on the Debris Flow Hazard Mapping Method using SINMAP and FLO-2D. J. Korean Soc. Geospat. Inf. Syst. 2016, 24, 15–244. [Google Scholar] [CrossRef]
- Zhang, P.; Ma, J.; Shu, H.; Han, T.; Zhang, Y. Simulating debris flow deposition using a two-dimensional finite model and Soil Conservation Service-curve number approach for Hanlin gully of southern Gansu (China). Environ. Earth Sci. 2015, 73, 6417–6426. [Google Scholar] [CrossRef]
- Li, T.; Lee, G.; Kim, G. Case Study of Urban Flood Inundation—Impact of Temporal Variability in Rainfall Events. Water 2021, 13, 3438. [Google Scholar] [CrossRef]
- Stancanelli, L.M.; Foti, E. A comparative assessment of two different debris flow propagation approaches—Blind simulations on a real debris flow event. Nat. Hazards Earth Syst. Sci. 2015, 15, 735–746. [Google Scholar] [CrossRef]
- O’Brien, J.S. Physical Process, Rheology and Modeling of Mudflows. Ph.D. Thesis, Colorado State University, Fort Collins, CO, USA, 1986; p. 172. [Google Scholar]
- O’Brien, J.S.; Julien, P.Y. Laboratory Analysis of Mudflow Properties. J. Hydraul. Eng. 1988, 114, 877. [Google Scholar] [CrossRef] [Green Version]
- Julien, P.Y.; O’Brien, J.S. Dispersive and turbulent stresses in hyperconcentrated sediment flows. 1998; unpublished paper. [Google Scholar]


| Parameters | Watershed Area (km2) | Solid Source Volume (106 m3) | Solid Source Per Unit (104 m3/km2) | Unit Weight (kN/m3) |
|---|---|---|---|---|
| Value | 10.50 | 3.75 | 35.7 | 16.27 |
| Parameters | F (km2) | D | |||||
|---|---|---|---|---|---|---|---|
| Value | 10.50 | 80.73 | 64.58 | 1.624 | 1.2 | 157.33 | 125.85 |
| Parameters | |||||||
|---|---|---|---|---|---|---|---|
| Value | 2280 | 0.15~0.25 | 0.00461 | 11.25 | 0.812 | 13.71 | 0.59 |
| Frequency | Maximum Flow Depth (m) | Maximum Flow Velocity (m/s) | Maximum Runout of the Deposition (m) | Maximum Width of the Deposition (m) |
|---|---|---|---|---|
| 1% | 5.85 | 5.46 | 935 | 183 |
| 2% | 5.57 | 5.18 | 880 | 138 |
| Grade | Flow Depth (m) | Logical Relation | Flow Velocity × Flow Depth (m2/s) |
|---|---|---|---|
| High | H ≥ 2.5 | or | Vh ≥ 2.5 |
| Medium | 0.5 ≤ h < 2.5 | and | 0.5 ≤ Vh < 2.5 |
| Low | 0.001 ≤ h < 0.5 | and | Vh < 0.5 |
| Impact Grade | High | Medium | Low | |
|---|---|---|---|---|
| Recurrence Period | ||||
| 100-year | High | Medium | Low | |
| 50-year | Medium | Low | Low | |
| NO | Recurrence Period | Area (m2) | Population | Properties (103 RMB) | Property Loss | Environmental Loss | ||||
|---|---|---|---|---|---|---|---|---|---|---|
| Construction | Land | Road | Other | Total | ||||||
| 1 | 50-year | 59,962.9 | 0 | 0 | 730 | 390 | 0 | 1120 | Serious | Severe |
| 2 | 50-year | 415.2 | 8 | 285 | 0 | 0 | 0 | 285 | Serious | Not severe |
| 3 | 50-year | 1655.1 | 0 | 0 | 101 | 0 | 0 | 101 | Not severe | Serious |
| 4 | 50-year | 911.7 | 0 | 0 | 0 | 0 | 10 | 10 | Not severe | Not severe |
| 5 | 50-year | 231.4 | 0 | 0 | 0 | 23 | 0 | 23 | Not severe | Serious |
| 6 | 50-year | 612.2 | 0 | 0 | 0 | 0 | 30 | 30 | Not severe | Not severe |
| 7 | 50-year | 2079.5 | 0 | 0 | 122 | 0 | 0 | 122 | Not severe | Serious |
| 8 | 50-year | 912.1 | 0 | 0 | 0 | 91 | 0 | 91 | Not severe | Serious |
| 9 | 50-year | 8154.6 | 13 | 300 | 487 | 0 | 0 | 787 | Serious | Serious |
| 10 | 50-year | 2612.7 | 73 | 1660 | 0 | 0 | 30 | 1690 | Severe | Serious |
| 11 | 50-year | 2112.5 | 6 | 180 | 122 | 0 | 0 | 302 | Serious | Serious |
| 12 | 50-year | 273.0 | 0 | 0 | 0 | 27 | 0 | 27 | Not severe | Not severe |
| 13 | 50-year | 2482.5 | 4 | 0 | 162 | 0 | 50 | 212 | Not severe | Serious |
| 14 | 50-year | 1798.8 | 3 | 0 | 0 | 0 | 50 | 50 | Not severe | Not severe |
| 15 | 50-year | 1435.9 | 0 | 0 | 0 | 1250 | 0 | 1250 | Serious | Severe |
| 16 | 50-year | 2421.1 | 0 | 0 | 146 | 0 | 0 | 146 | Not severe | Serious |
| 17 | 50-year | 710.51 | 12 | 0 | 0 | 0 | 30 | 30 | Not severe | Not severe |
| 18 | 50-year | 1639.7 | 0 | 0 | 0 | 1500 | 0 | 1500 | Serious | Severe |
| 19 | 50-year | 7628.6 | 0 | 0 | 467 | 0 | 0 | 467 | Not severe | Serious |
| 20 | 50-year | 5654.1 | 0 | 0 | 0 | 0 | 10 | 10 | Not severe | Not severe |
| 21 | 50-year | 9433.7 | 0 | 0 | 0 | 0 | 10 | 10 | Not severe | Not severe |
| 22 | 100-year | 1758.4 | 20 | 0 | 0 | 0 | 80 | 80 | Not severe | Serious |
| 23 | 100-year | 1156.6 | 0 | 0 | 0 | 1250 | 0 | 1250 | Serious | Severe |
| 24 | 100-year | 3023.8 | 0 | 0 | 183 | 0 | 0 | 183 | Not severe | Serious |
| 25 | 100-year | 3056.9 | 0 | 0 | 0 | 0 | 0 | 0 | Not severe | Not severe |
| 26 | 100-year | 5543.7 | 0 | 0 | 0 | 0 | 200 | 200 | Not severe | Serious |
| 27 | 100-year | 907.2 | 0 | 0 | 57 | 0 | 0 | 57 | Not severe | Serious |
| NO | Recurrence Period | Area (m2) | Population | Personnel Vulnerability | Personnel Temporal and Spatial Probability | Properties (103 RMB) | Properties Vulnerability | Property Temporal and Spatial Probability | Annual Probability of Personnel Loss | Annual Probability of Property Loss |
|---|---|---|---|---|---|---|---|---|---|---|
| 1 | 50-year | 59,962.93 | 0.00 | 0.70 | 0.33 | 1120 | 0.40 | 1.00 | 0.00 | 8.96 |
| 2 | 50-year | 415.15 | 8.00 | 0.80 | 0.58 | 285 | 0.70 | 1.00 | 0.07 | 3.99 |
| 3 | 50-year | 1655.12 | 0.00 | 0.70 | 0.33 | 101 | 0.40 | 1.00 | 0.00 | 0.81 |
| 4 | 50-year | 911.74 | 0.00 | 0.60 | 0.50 | 10 | 0.40 | 1.00 | 0.00 | 0.08 |
| 5 | 50-year | 231.37 | 0.00 | 0.60 | 0.50 | 23 | 0.70 | 1.00 | 0.00 | 0.32 |
| 6 | 50-year | 612.15 | 0.00 | 0.50 | 0.50 | 30 | 0.40 | 1.00 | 0.00 | 0.24 |
| 7 | 50-year | 2079.53 | 0.00 | 0.70 | 0.33 | 122 | 0.50 | 1.00 | 0.00 | 1.22 |
| 8 | 50-year | 912.08 | 0.00 | 0.60 | 0.50 | 91 | 0.70 | 1.00 | 0.00 | 1.28 |
| 9 | 50-year | 8154.58 | 13.00 | 0.60 | 0.58 | 787 | 0.50 | 1.00 | 0.09 | 7.87 |
| 10 | 50-year | 2612.72 | 73.00 | 0.80 | 0.58 | 1690 | 0.70 | 1.00 | 0.68 | 23.66 |
| 11 | 50-year | 2112.54 | 6.00 | 0.80 | 0.58 | 302 | 0.50 | 1.00 | 0.06 | 3.02 |
| 12 | 50-year | 272.99 | 0.00 | 0.60 | 0.50 | 27 | 0.70 | 1.00 | 0.00 | 0.38 |
| 13 | 50-year | 2482.54 | 4.00 | 0.80 | 0.58 | 212 | 0.50 | 1.00 | 0.04 | 2.12 |
| 14 | 50-year | 1798.76 | 3.00 | 0.60 | 0.33 | 50 | 0.50 | 1.00 | 0.01 | 0.50 |
| 15 | 50-year | 1435.86 | 0.00 | 0.90 | 0.50 | 1250 | 0.90 | 1.00 | 0.00 | 22.50 |
| 16 | 50-year | 2421.11 | 0.00 | 0.70 | 0.33 | 146 | 0.70 | 1.00 | 0.00 | 2.04 |
| 17 | 50-year | 710.51 | 12.00 | 0.60 | 0.50 | 30 | 0.40 | 1.00 | 0.07 | 0.24 |
| 18 | 50-year | 1639.73 | 0.00 | 0.90 | 0.50 | 1500 | 0.90 | 1.00 | 0.00 | 27.00 |
| 19 | 50-year | 7628.64 | 0.00 | 0.70 | 0.33 | 467 | 0.50 | 1.00 | 0.00 | 4.67 |
| 20 | 50-year | 5654.10 | 0.00 | 0.50 | 0.33 | 10 | 0.30 | 1.00 | 0.00 | 0.06 |
| 21 | 50-year | 9433.71 | 0.00 | 0.00 | 0.00 | 10 | 0.00 | 1.00 | 0.00 | 0.00 |
| 22 | 100-year | 1758.44 | 20.00 | 0.60 | 0.50 | 80 | 0.40 | 1.00 | 0.06 | 0.32 |
| 23 | 100-year | 1156.55 | 0.00 | 0.90 | 0.50 | 1250 | 0.90 | 1.00 | 0.00 | 11.25 |
| 24 | 100-year | 3023.76 | 0.00 | 0.70 | 0.33 | 183 | 0.70 | 1.00 | 0.00 | 1.28 |
| 25 | 100-year | 3056.90 | 0.00 | 0.00 | 0.00 | 0 | 0.00 | 1.00 | 0.00 | 0.00 |
| 26 | 100-year | 5543.71 | 0.00 | 0.50 | 0.33 | 200 | 0.50 | 1.00 | 0.00 | 1.00 |
| 27 | 100-year | 907.19 | 0.00 | 0.60 | 0.50 | 57 | 0.70 | 1.00 | 0.00 | 0.40 |
| Risk Grade (R) | Annual Probability of Personnel Loss (p) | ||||
|---|---|---|---|---|---|
| p > 0.1 | 0.01 < p ≤ 0.1 | 0.001 < p ≤ 0.01 | p ≤ 0.001 | ||
| Annual probability of property loss | R > 150 | Very high | Very high | Very high | Very high |
| 50 < R ≤ 150 | Very high | High | High | High | |
| 10 < R ≤ 50 | Very high | High | Medium | Medium | |
| R ≤ 10 | Very high | High | Medium | Low | |
| NO | Recurrence Period | Area (m2) | Annual Probability of Personnel Loss | Annual Probability of Property Loss | Hazard Grade | Risk Grade |
|---|---|---|---|---|---|---|
| 1 | 50-year | 59,962.93 | 0.00 | 8.96 | high | low |
| 2 | 50-year | 415.15 | 0.07 | 3.99 | high | medium |
| 3 | 50-year | 1655.12 | 0.00 | 0.81 | medium | low |
| 4 | 50-year | 911.74 | 0.00 | 0.08 | medium | low |
| 5 | 50-year | 231.37 | 0.00 | 0.32 | medium | low |
| 6 | 50-year | 612.15 | 0.00 | 0.24 | medium | low |
| 7 | 50-year | 2079.53 | 0.00 | 1.22 | medium | low |
| 8 | 50-year | 912.08 | 0.00 | 1.28 | medium | low |
| 9 | 50-year | 8154.58 | 0.09 | 7.87 | medium | high |
| 10 | 50-year | 2612.72 | 0.68 | 23.66 | low | very high |
| 11 | 50-year | 2112.54 | 0.06 | 3.02 | low | high |
| 12 | 50-year | 272.99 | 0.00 | 0.38 | medium | low |
| 13 | 50-year | 2482.54 | 0.04 | 2.12 | medium | high |
| 14 | 50-year | 1798.76 | 0.01 | 0.50 | medium | medium |
| 15 | 50-year | 1435.86 | 0.00 | 22.50 | medium | medium |
| 16 | 50-year | 2421.11 | 0.00 | 2.04 | low | low |
| 17 | 50-year | 710.51 | 0.07 | 0.24 | low | high |
| 18 | 50-year | 1639.73 | 0.00 | 27.00 | low | medium |
| 19 | 50-year | 7628.64 | 0.00 | 4.67 | low | low |
| 20 | 50-year | 5654.10 | 0.00 | 0.06 | medium | low |
| 21 | 50-year | 9433.71 | 0.00 | 0.00 | low | low |
| 22 | 100-year | 1758.44 | 0.06 | 0.32 | low | high |
| 23 | 100-year | 1156.55 | 0.00 | 11.25 | low | medium |
| 24 | 100-year | 3023.76 | 0.00 | 1.28 | low | low |
| 25 | 100-year | 3056.90 | 0.00 | 0.00 | low | low |
| 26 | 100-year | 5543.71 | 0.00 | 1.00 | low | low |
| 27 | 100-year | 907.19 | 0.00 | 0.40 | low | low |
Publisher’s Note: MDPI stays neutral with regard to jurisdictional claims in published maps and institutional affiliations. |
© 2022 by the authors. Licensee MDPI, Basel, Switzerland. This article is an open access article distributed under the terms and conditions of the Creative Commons Attribution (CC BY) license (https://creativecommons.org/licenses/by/4.0/).
Share and Cite
Zhang, S.; Sun, P.; Zhang, Y.; Ren, J.; Wang, H. Hazard Zonation and Risk Assessment of a Debris Flow under Different Rainfall Condition in Wudu District, Gansu Province, Northwest China. Water 2022, 14, 2680. https://doi.org/10.3390/w14172680
Zhang S, Sun P, Zhang Y, Ren J, Wang H. Hazard Zonation and Risk Assessment of a Debris Flow under Different Rainfall Condition in Wudu District, Gansu Province, Northwest China. Water. 2022; 14(17):2680. https://doi.org/10.3390/w14172680
Chicago/Turabian StyleZhang, Shuai, Ping Sun, Yanlin Zhang, Jian Ren, and Haojie Wang. 2022. "Hazard Zonation and Risk Assessment of a Debris Flow under Different Rainfall Condition in Wudu District, Gansu Province, Northwest China" Water 14, no. 17: 2680. https://doi.org/10.3390/w14172680
APA StyleZhang, S., Sun, P., Zhang, Y., Ren, J., & Wang, H. (2022). Hazard Zonation and Risk Assessment of a Debris Flow under Different Rainfall Condition in Wudu District, Gansu Province, Northwest China. Water, 14(17), 2680. https://doi.org/10.3390/w14172680