
An SEM-REM-Based Study on the Driving and Restraining Mechanisms and Potential of Reclaimed Water Utilization in China

Abstract
:1. Introduction
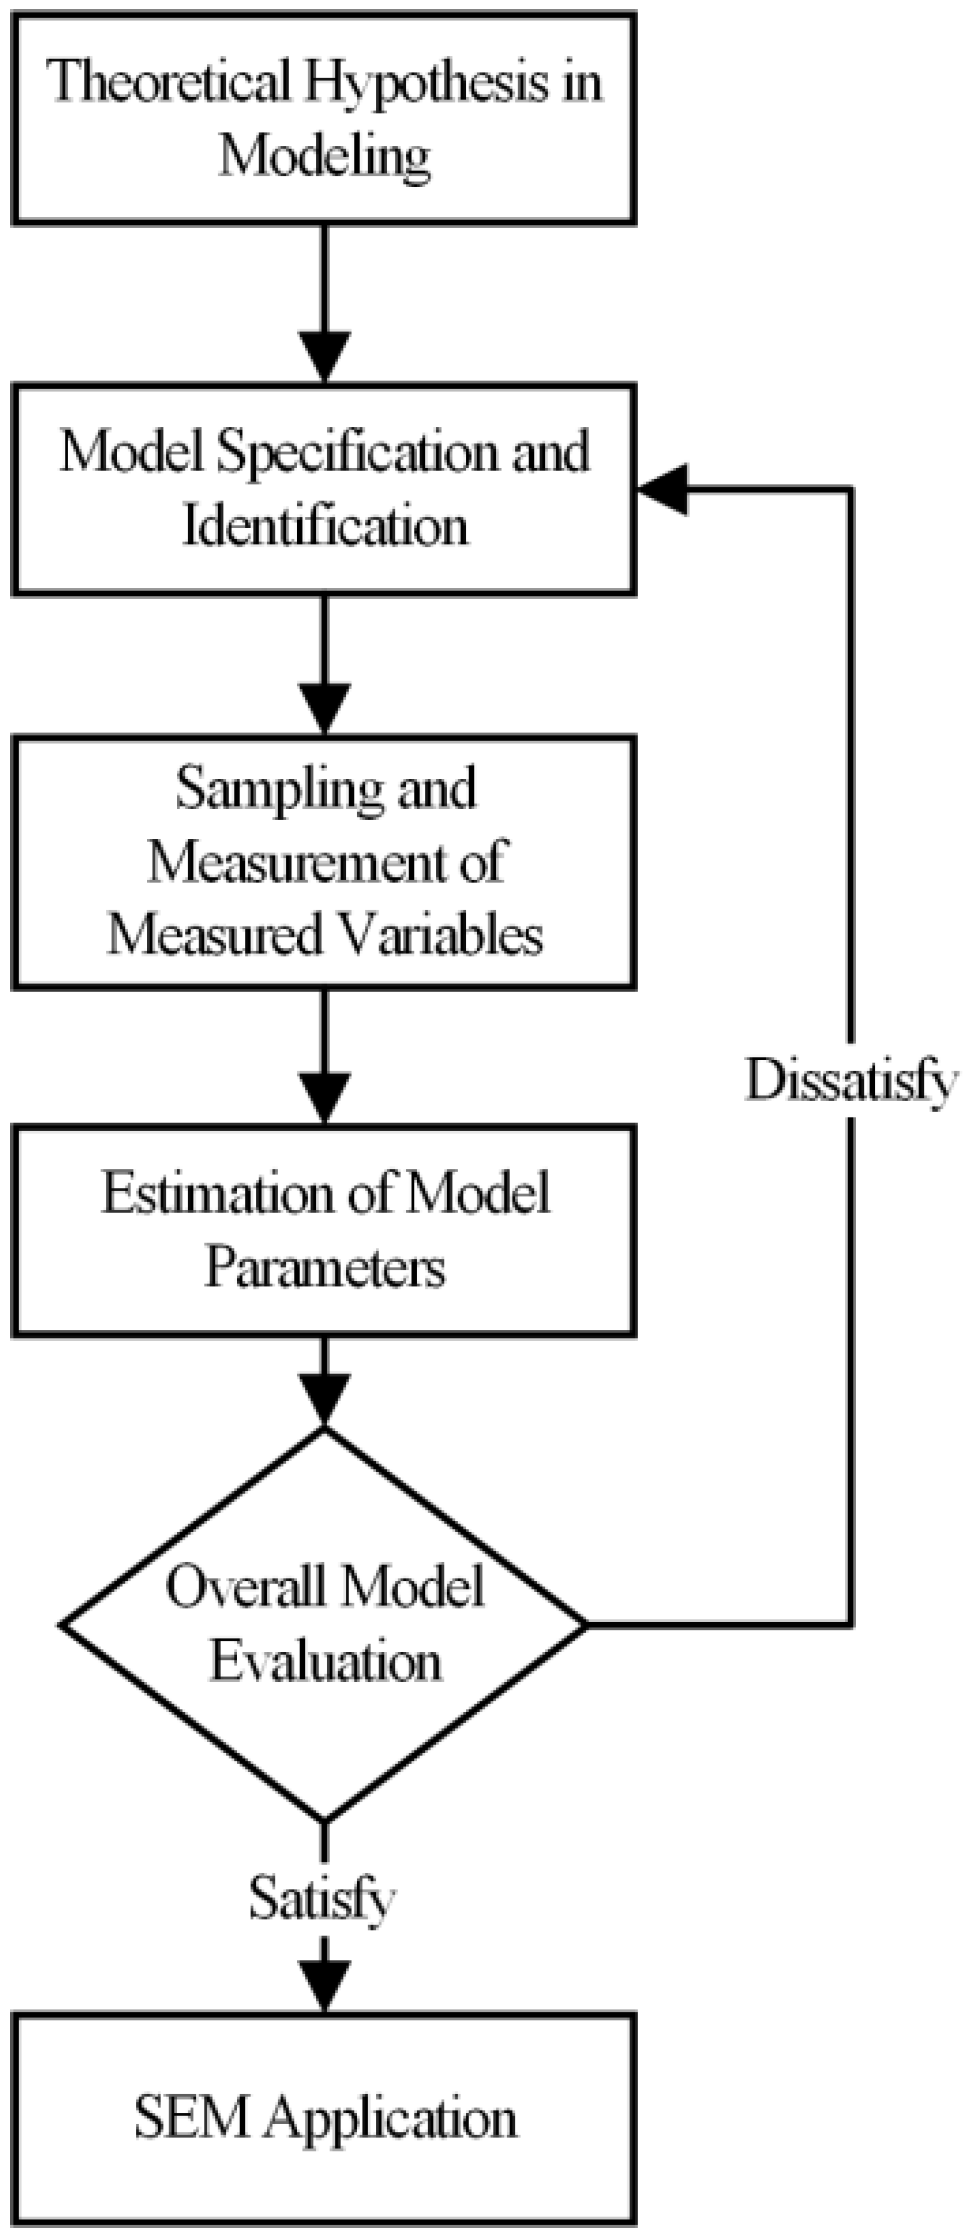
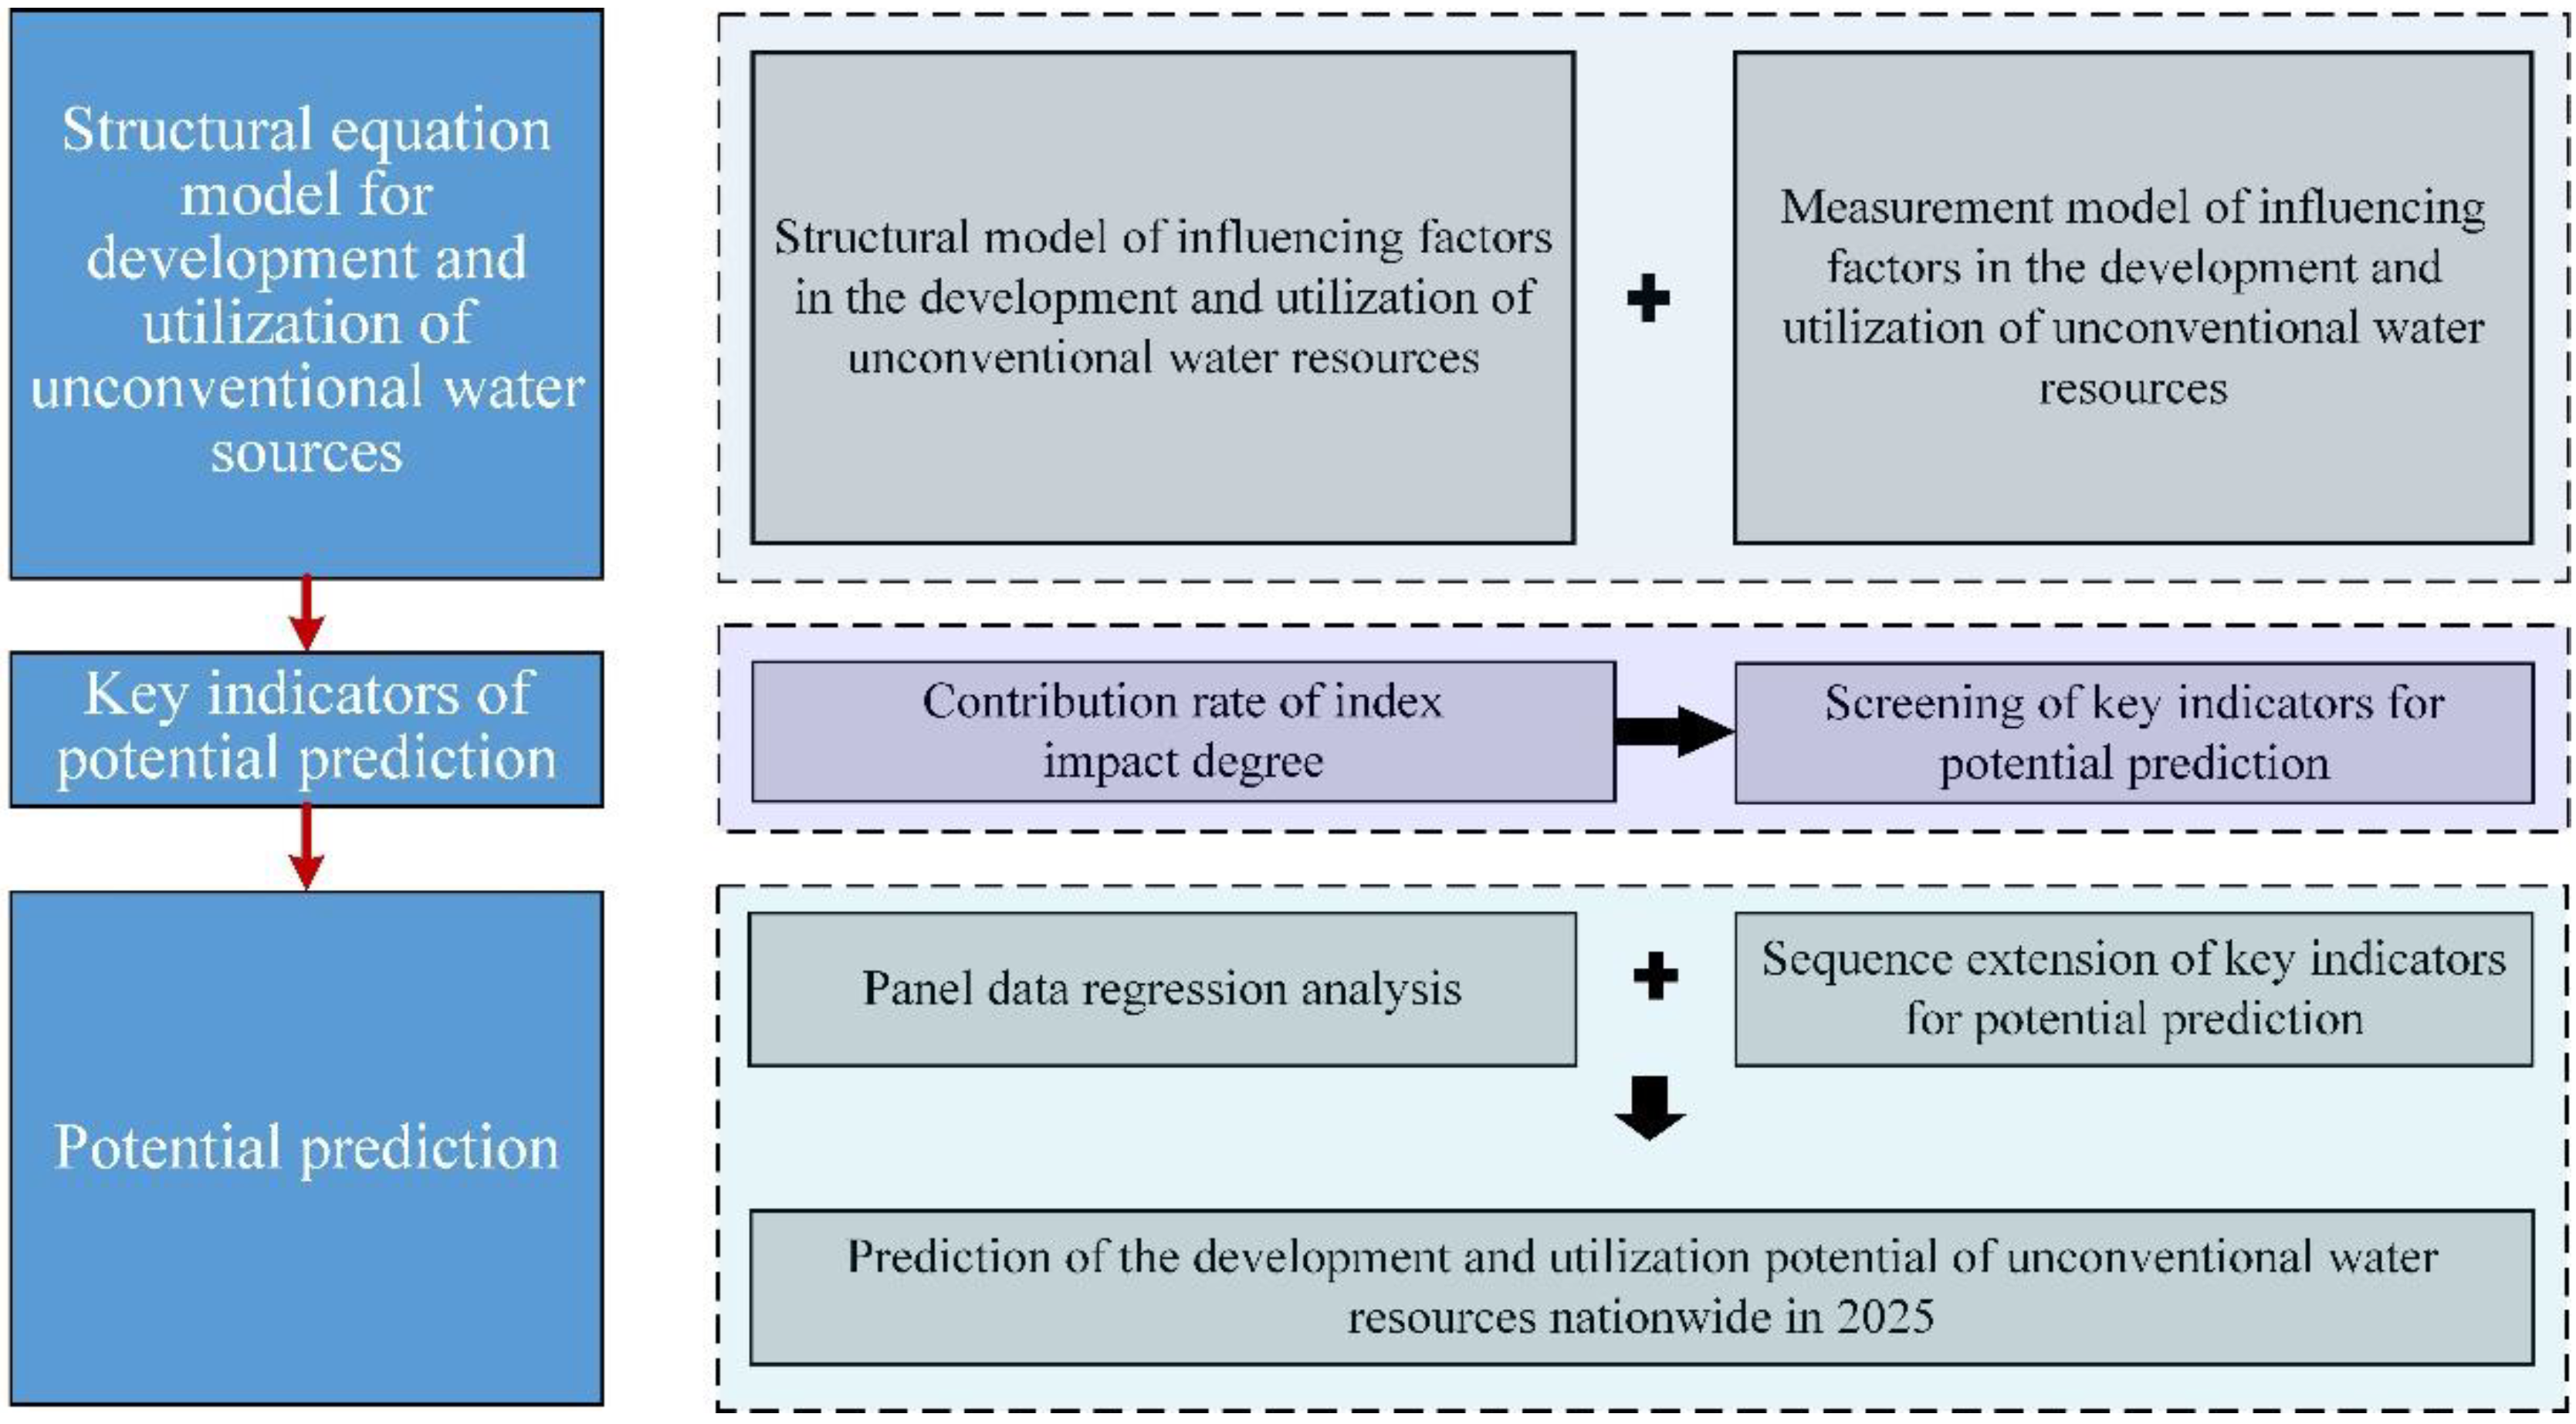
2. Research Method
2.1. Structural Equation Modeling
2.2. Calculation of the Contribution of Affecting Factors
3. Research Design
4. Results and Discussions
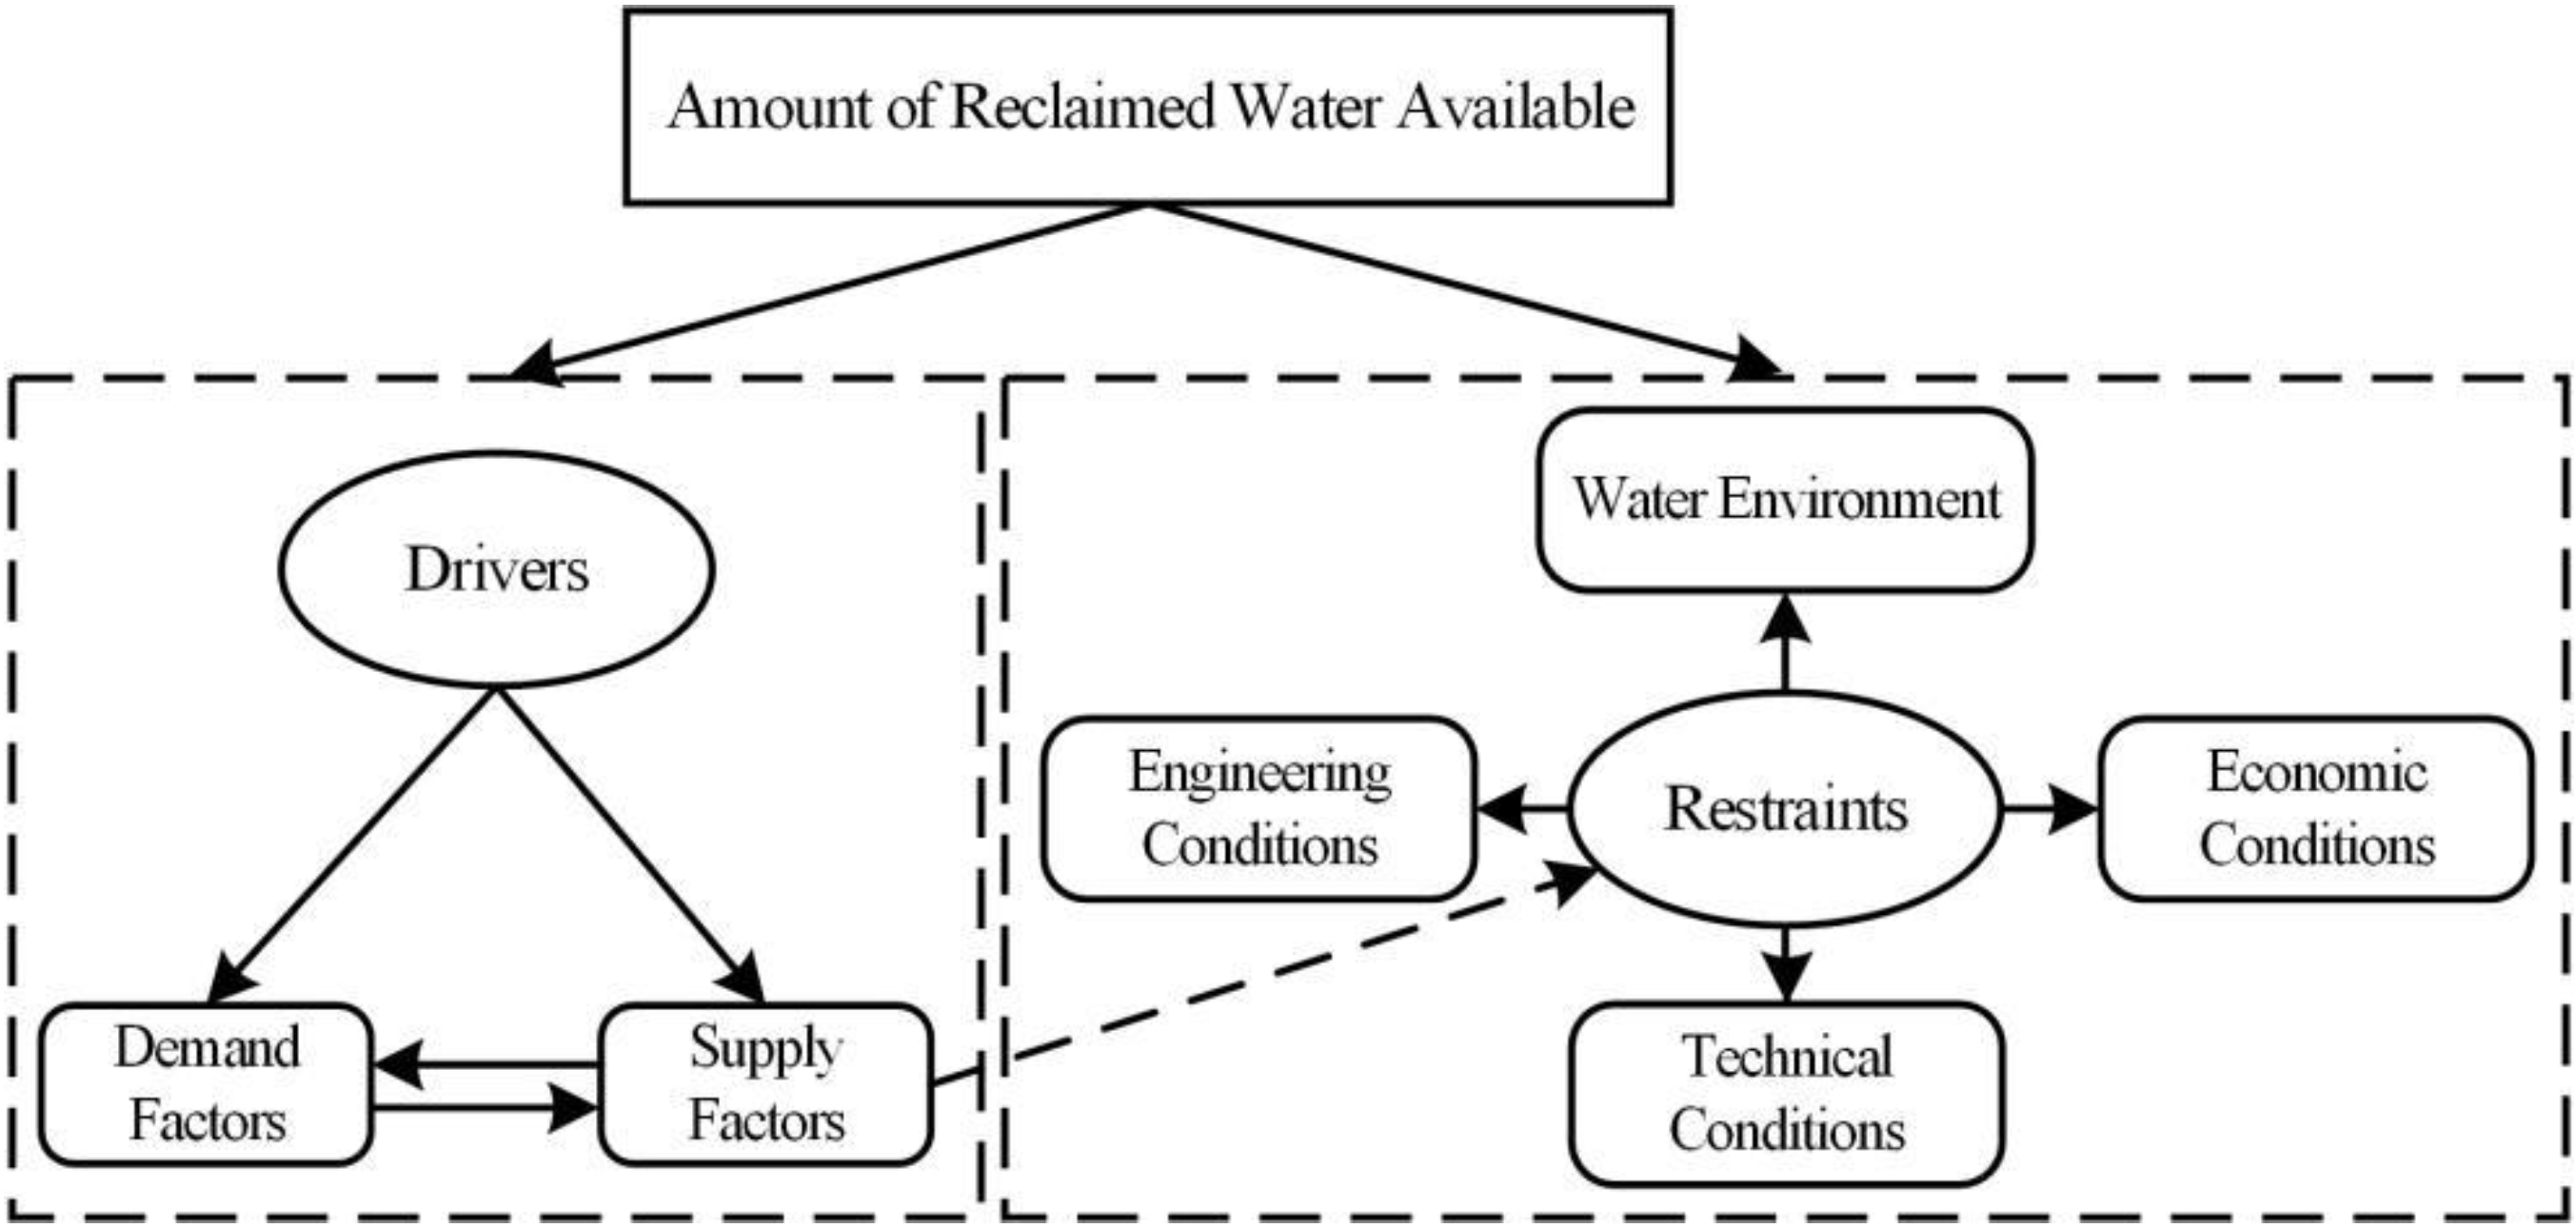
4.1. Structural Model of the Influencing Factors in the Development and Utilization of Reclaimed Water
4.1.1. Non-Recursive Structural Mechanism for Water Supply and Demand
4.1.2. Mechanism for Supply Restraints
4.1.3. Major Factors of the Restraining Mechanism
- (1)
- Engineering [22]: the availability of reclaimed water is limited by water source characteristics and existing water conservancy facilities. That means stepped-up efforts to improve the facilities in plants for reclaimed water or wastewater treatment and the network of auxiliary pipelines hold the key to motivating reclaimed water use.
- (2)
- Economic conditions [23]: projects on utilizing reclaimed water are a public investment from the perspective of the structure of the national economy, and factors such as local economic growth, treatment facilities, and the cost of construction should be taken into account.
- (3)
- Techniques [24]: the progress of water quality treatment techniques is of great importance to reclaimed water application. The advanced treatment technology that reclaimed water plants boast has evolved from biological aerated filtering in the 1980s to today’s hyperfiltration (reverse osmosis), superconducting magnetic separation, and membrane bioreactor. As a result, the efficiency of reclaimed water treatment has been increased considerably.
- (4)
- Water environment [25]: there are certain impacts of reclaimed water use on the current water environment, specifically on the quantity and quality of existing water resources. For water quantity, reclaimed water, dubbed the second water source in urban areas, is water upon advanced treatment by sewage treatment plants before being supplied to downstream users. With reclaimed water utilization scaling up, the amount of water available in the natural water cycle will decrease, consequently creating negative impacts on the water environment. Regarding water quality, the standards of replenishing the natural environment with reclaimed water improved as China recommits its endeavors. The move helps make a better water environment, but given the weak spots in risk control of reclaimed water utilization, unreasonable behaviors still pose risks of damaging the water environment.
4.2. Measurement Model of the Influencing Factors for the Development and Utilization of Reclaimed Water
4.2.1. Selection of the Measured Variables of the Driving Factors
- (1)
- Supply factors: to study the impacts of supply factors on reclaimed water utilization, we selected four indicators, namely, the total water resources, the average per capita water resources, the amount of wastewater treated, and the population of workers in water treatment. Among them, total water resources and average per capita water resources indicate the water resources endowment, which reflects the potential replenishment of local water resources to reclaimed water sources. Since the water that reclaimed water plants process is the tailwater upon treatment of sewage treatment plants, the amount of sewage treated is highly relevant to the stability of reclaimed water supply. Finally, the population of water treatment workers suggests how market forces and relevant policies drive the reclaimed water industry.
- (2)
- Demand factors: increasing the availability of reclaimed water holds the key to basing urban development on the local water system. That means the utilization of reclaimed water is intertwined with urbanization, which is a sure way towards new-type urbanization. Therefore, we selected total urban area and urban population density as demand factors for this study as they reveal the progress of urbanization and the demand for reclaimed water use in this process. In China, the amount of reclaimed water used in each field remains unclear. Studies, however, have found that reclaimed water has an increasingly important role in business operations, public services, people’s daily life, and the environment, and the correlation between the consumption of reclaimed water and water use in each area increases progressively every year. Hence, this paper also considered the indicator of water utilization on each front to drive the demand for reclaimed water use.
4.2.2. Selection of the Measured Variables of the Restraints
- (1)
- Engineering: having considered such factors as the quantity and quality of reclaimed water, and the reality of the auxiliary pipeline network, we identified seven indicators—the daily capacity of urban wastewater treatment, density of water supply pipelines in built-up areas, capacity of plants with grades II and III wastewater treatment technology, wastewater treatment rate, number of wastewater treatment plants, and production capacity of water supply—as the measured variables of engineering conditions that restrain reclaimed water use.
- (2)
- Economic conditions: the study regarded five indicators, namely, the gross regional product (GRP), per capita GRP index, investment in industrial wastewater management, investment in wastewater treatment facilities, and investment in reclaimed water treatment facilities, as the measured variables of economic conditions that restrain reclaimed water use.
- (3)
- Technical strength: considering treatment techniques and the adoption of technical measures, among others, we deemed the number of processed applications for water treatment patents as the measured variable of technical strength restraining reclaimed water use.
- (4)
- Water environment: this paper considered the average annual precipitation, average annual evaporation, groundwater resources, underground water resources, proportion of rivers with a rating lower than grade V, and water use intensity as the measured variables of the water environment that restrain reclaimed water use.
4.3. Screening of Key Indicators for Potential Prediction
4.3.1. SEM Model Fitting Effect
4.3.2. Contribution of Indicator Impacts
4.3.3. Key Indicators for Potential Prediction
- (1)
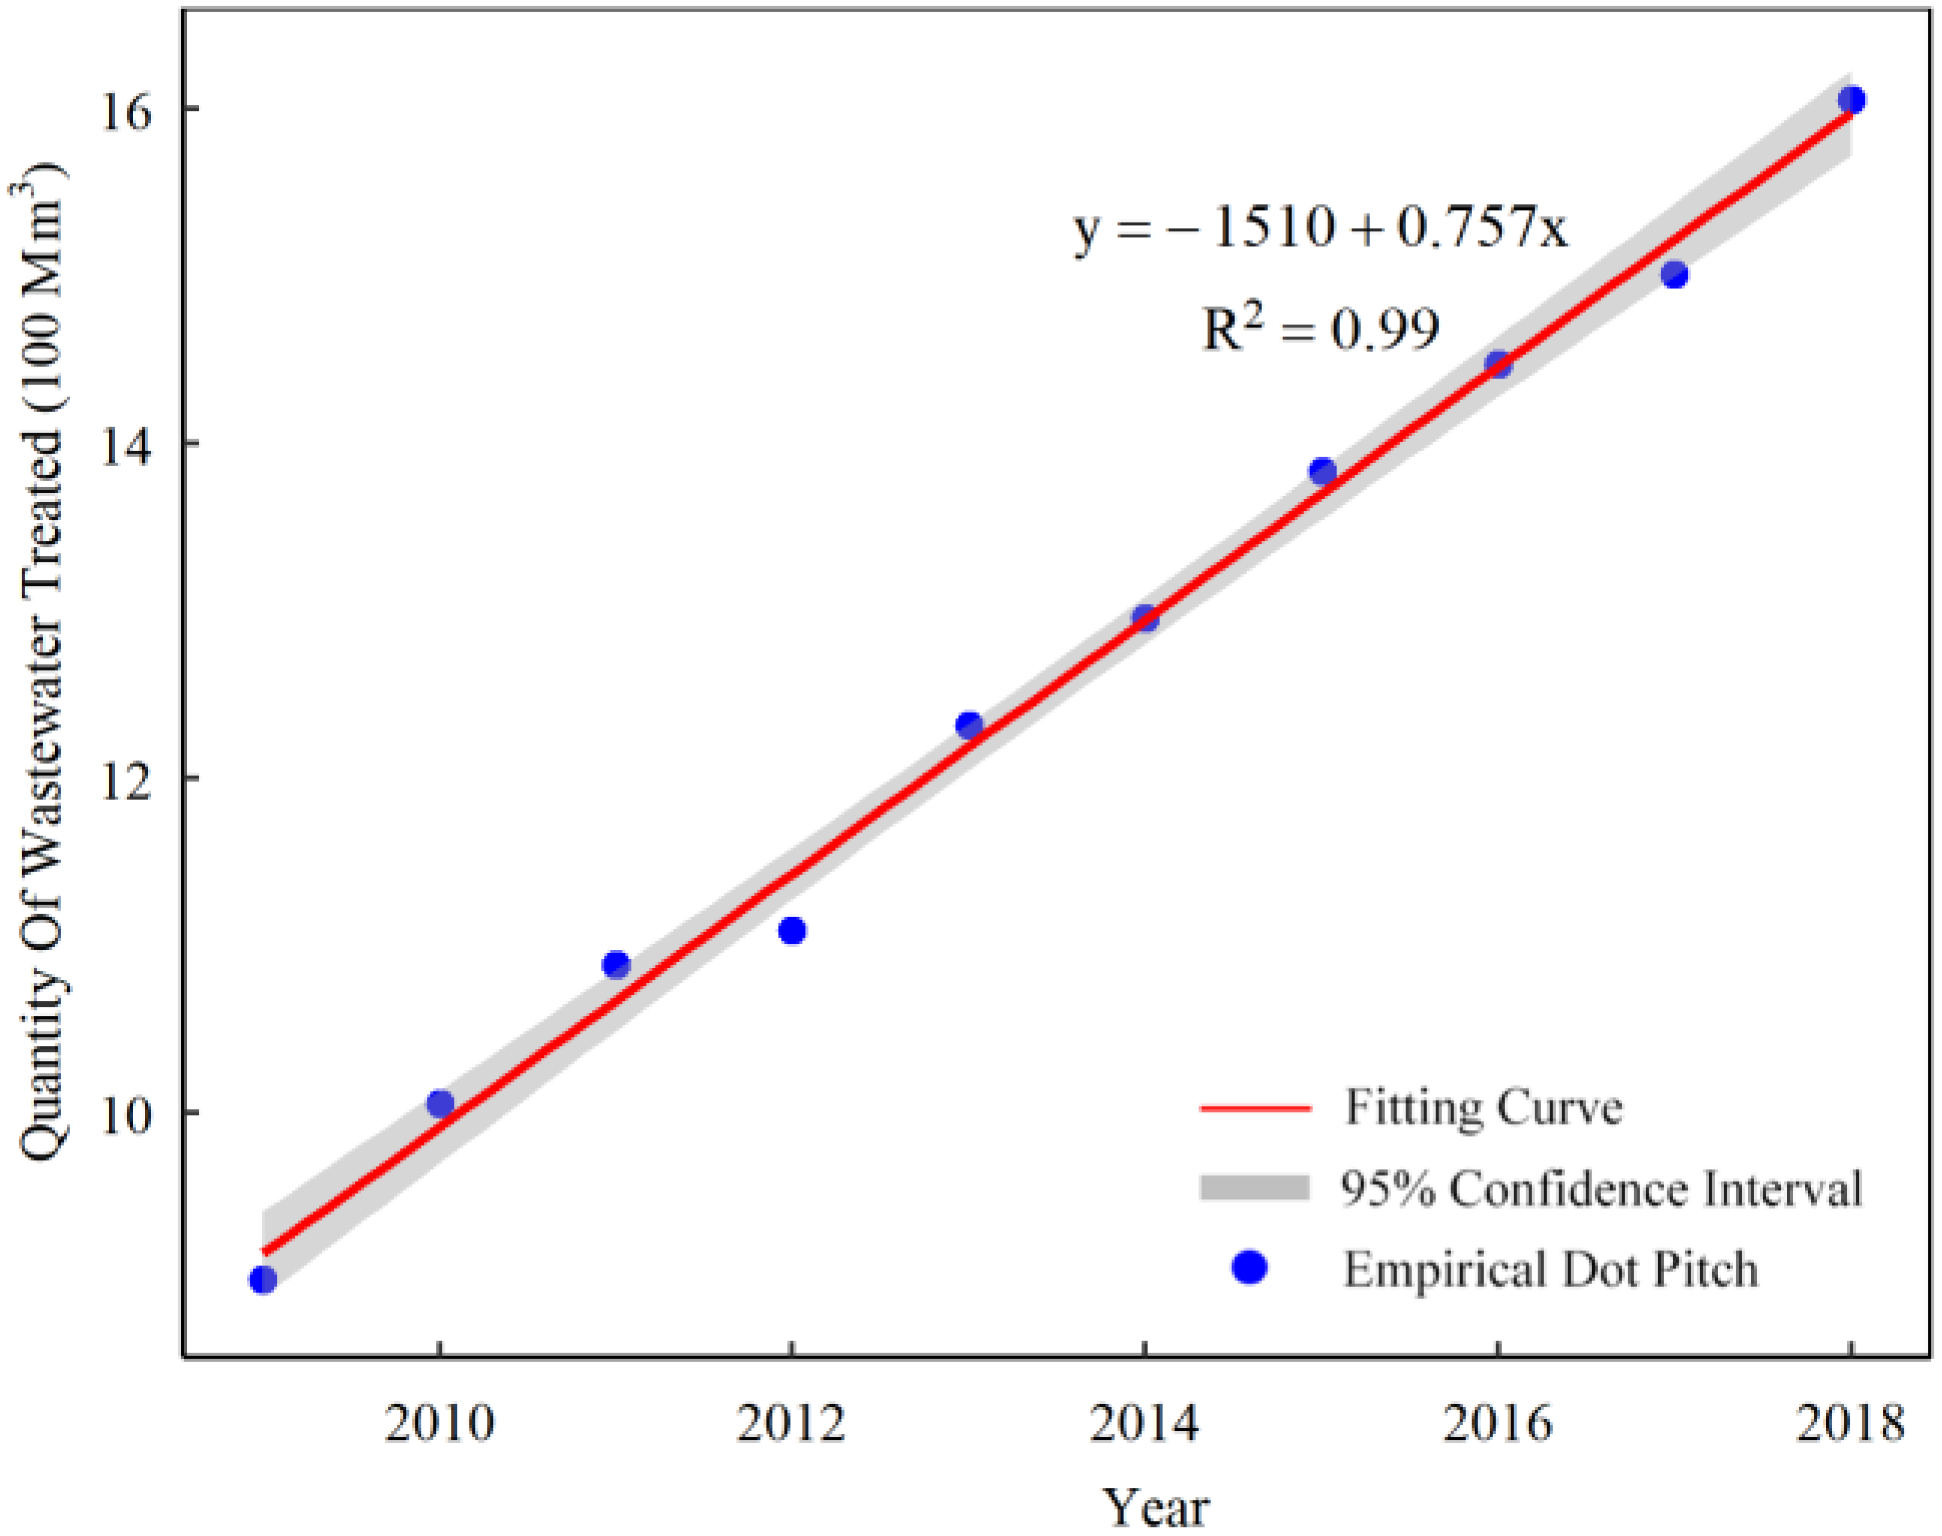
- The quantity of wastewater treated refers to the actual amount of wastewater processed by wastewater treatment plants (or facilities), including the amount treated by physical, biological, and chemical means.
- (2)
- The density of water supply pipelines in built-up areas shows how water supply pipelines are distributed in built-up areas. The calculation equation is as follows.
- (3)
- Investment in reclaimed water treatment facilities refers to reclaimed water treatment projects with a planned investment of more than RMB 50,000 each, which include the renovation, rebuilding, extension, and establishment of fixed assets.
- (4)
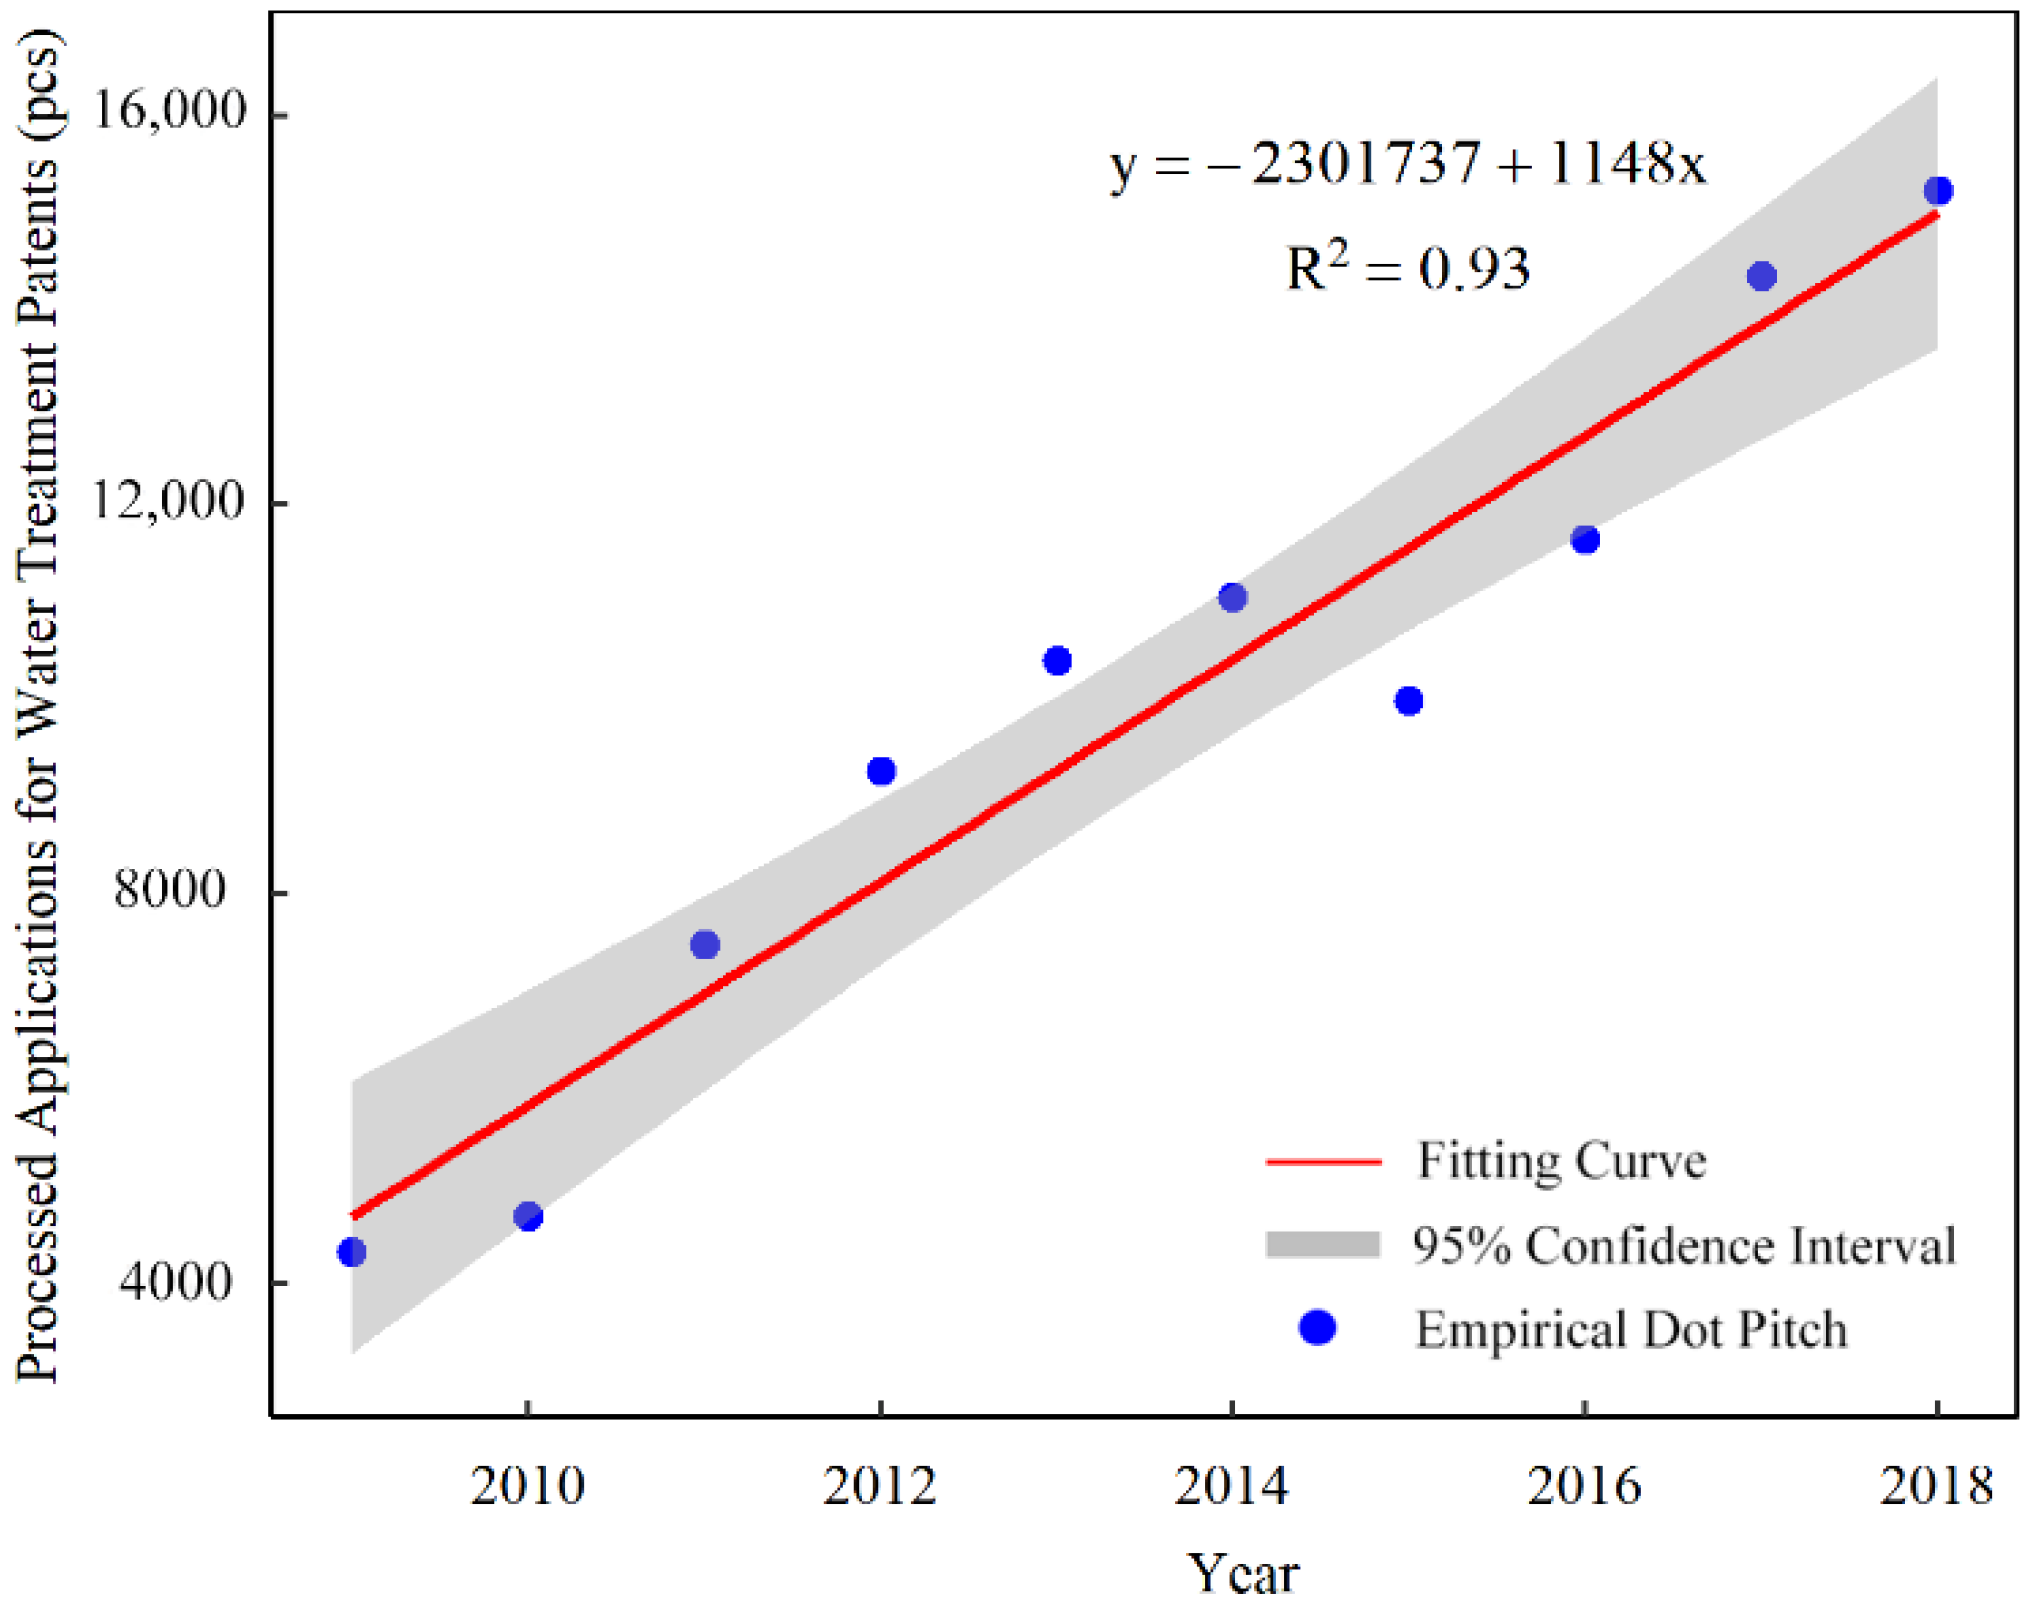
- The number of processed applications for water treatment patents shows the number of processed patent applications in the treatment of water, wastewater, sewage, and sludge.
4.4. Panel Data Regression Analysis Results
4.4.1. Unit Root Test
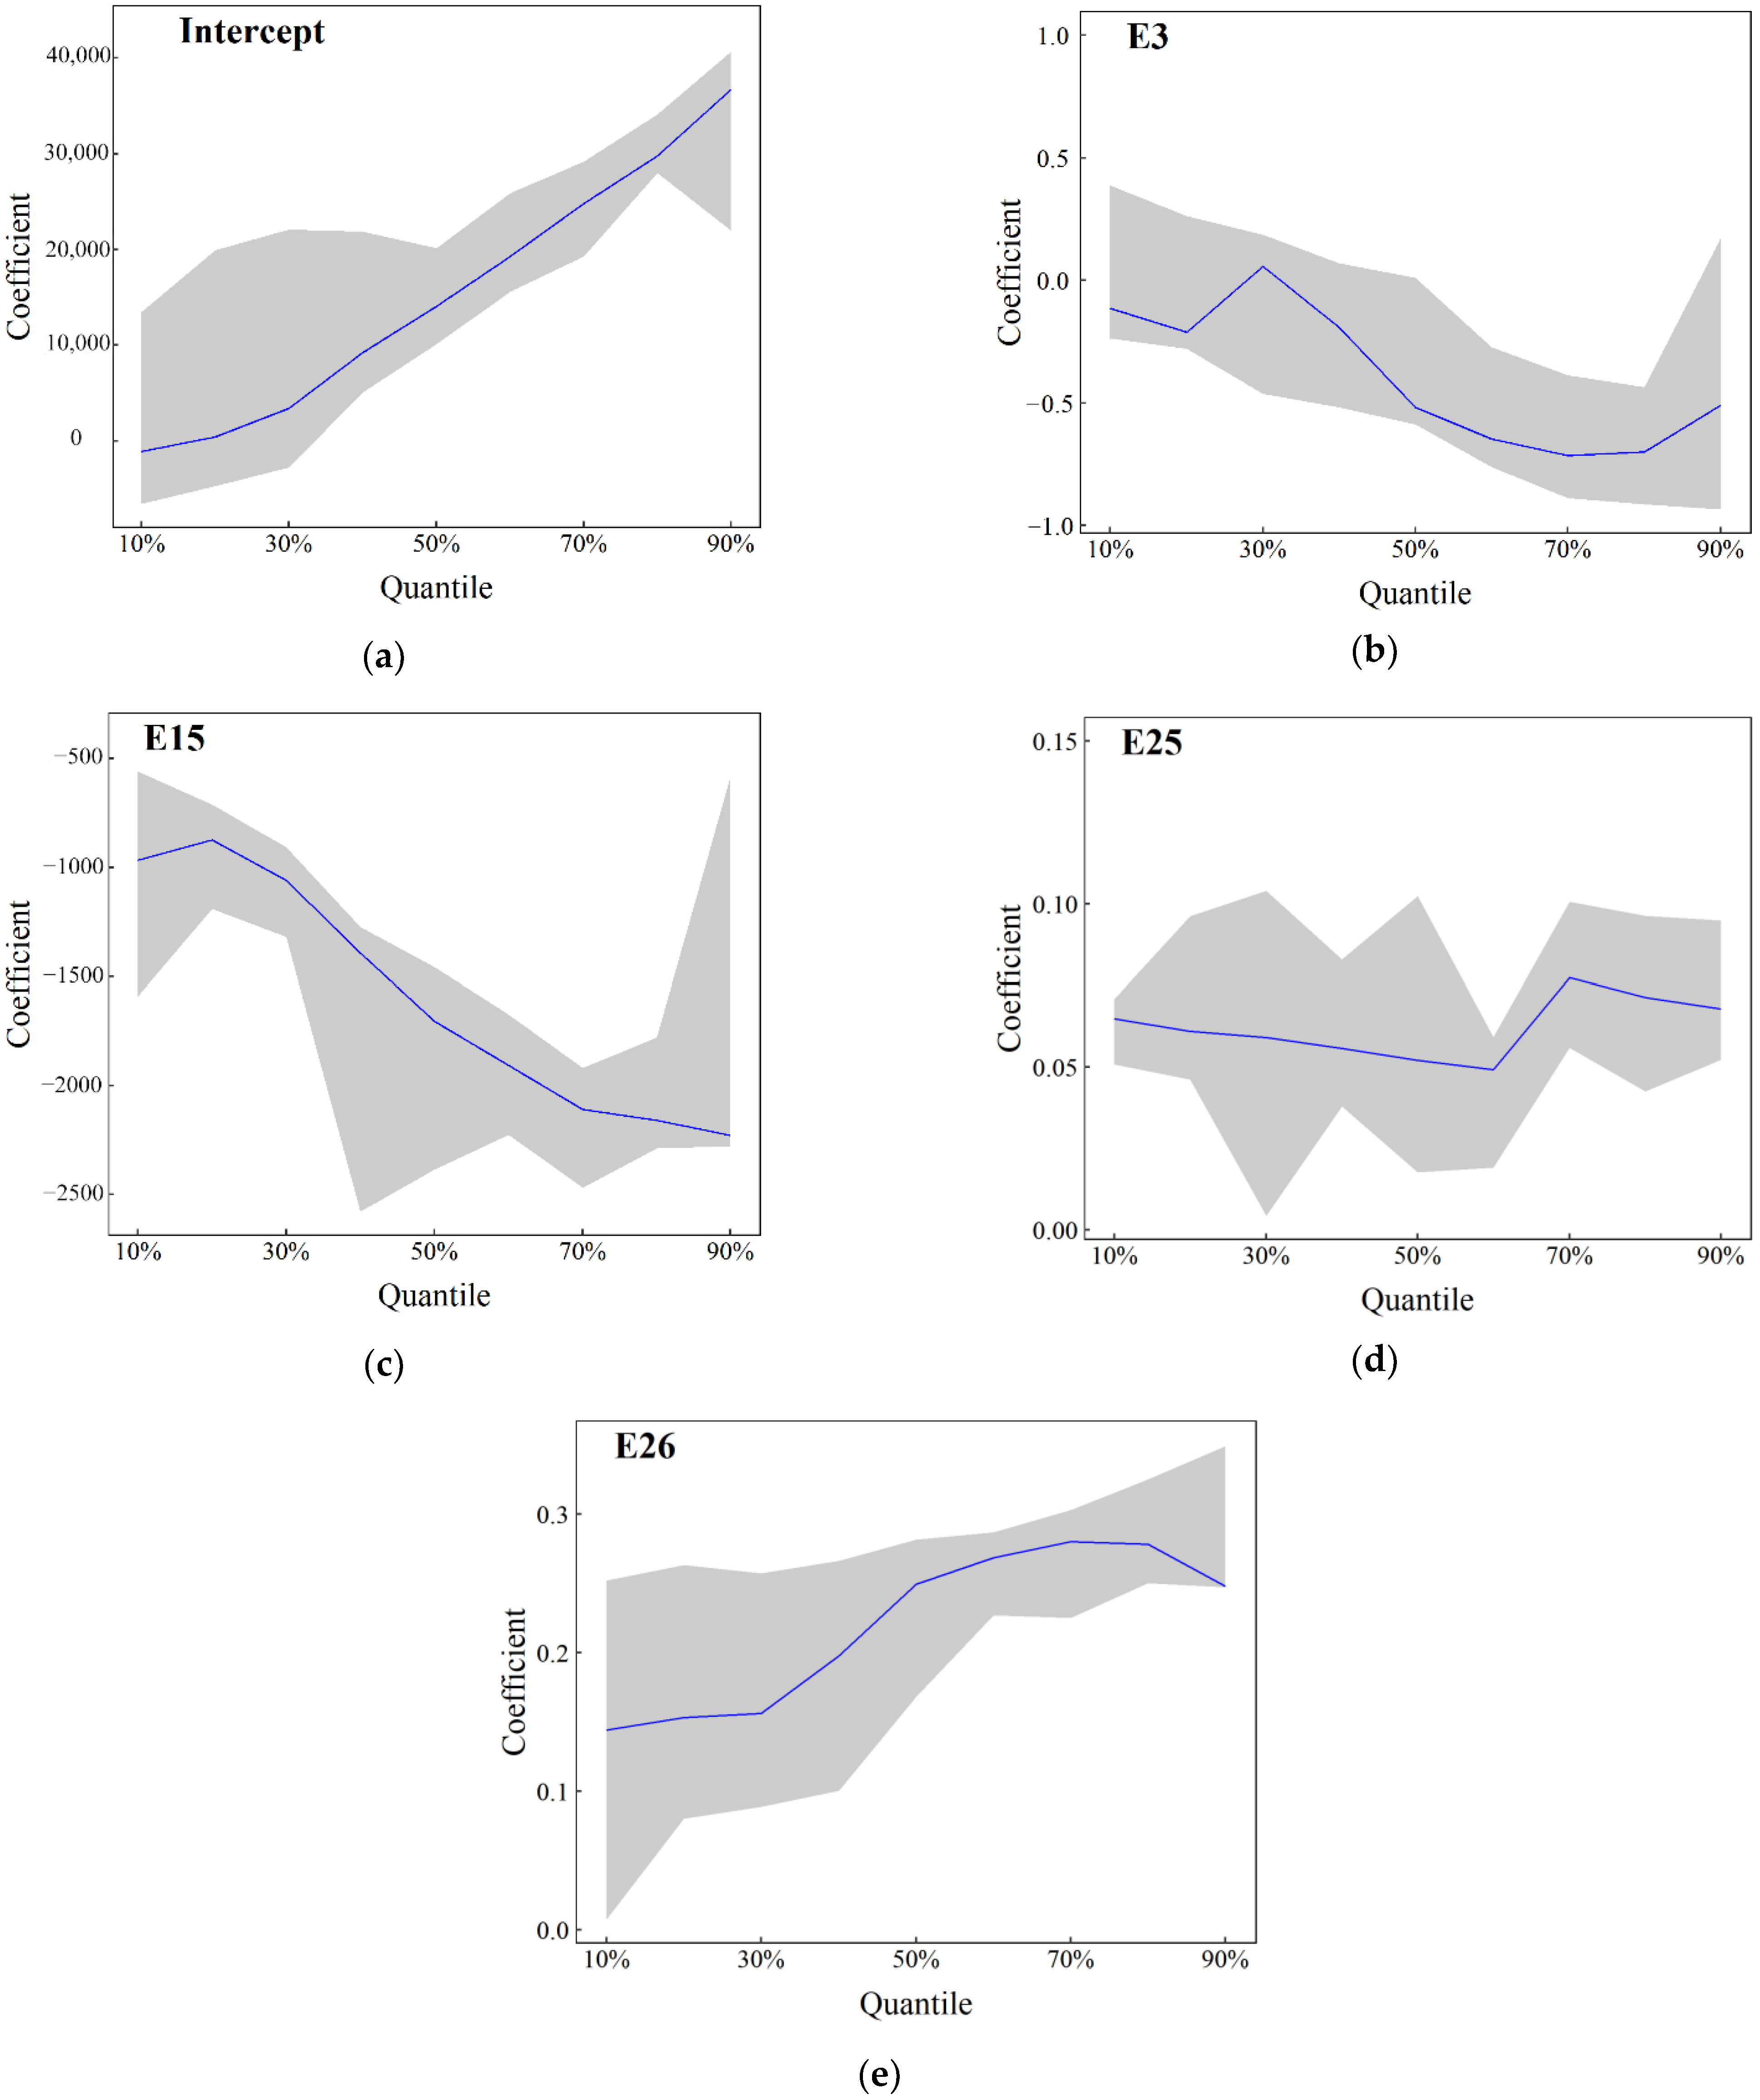
4.4.2. REM for Potential Prediction
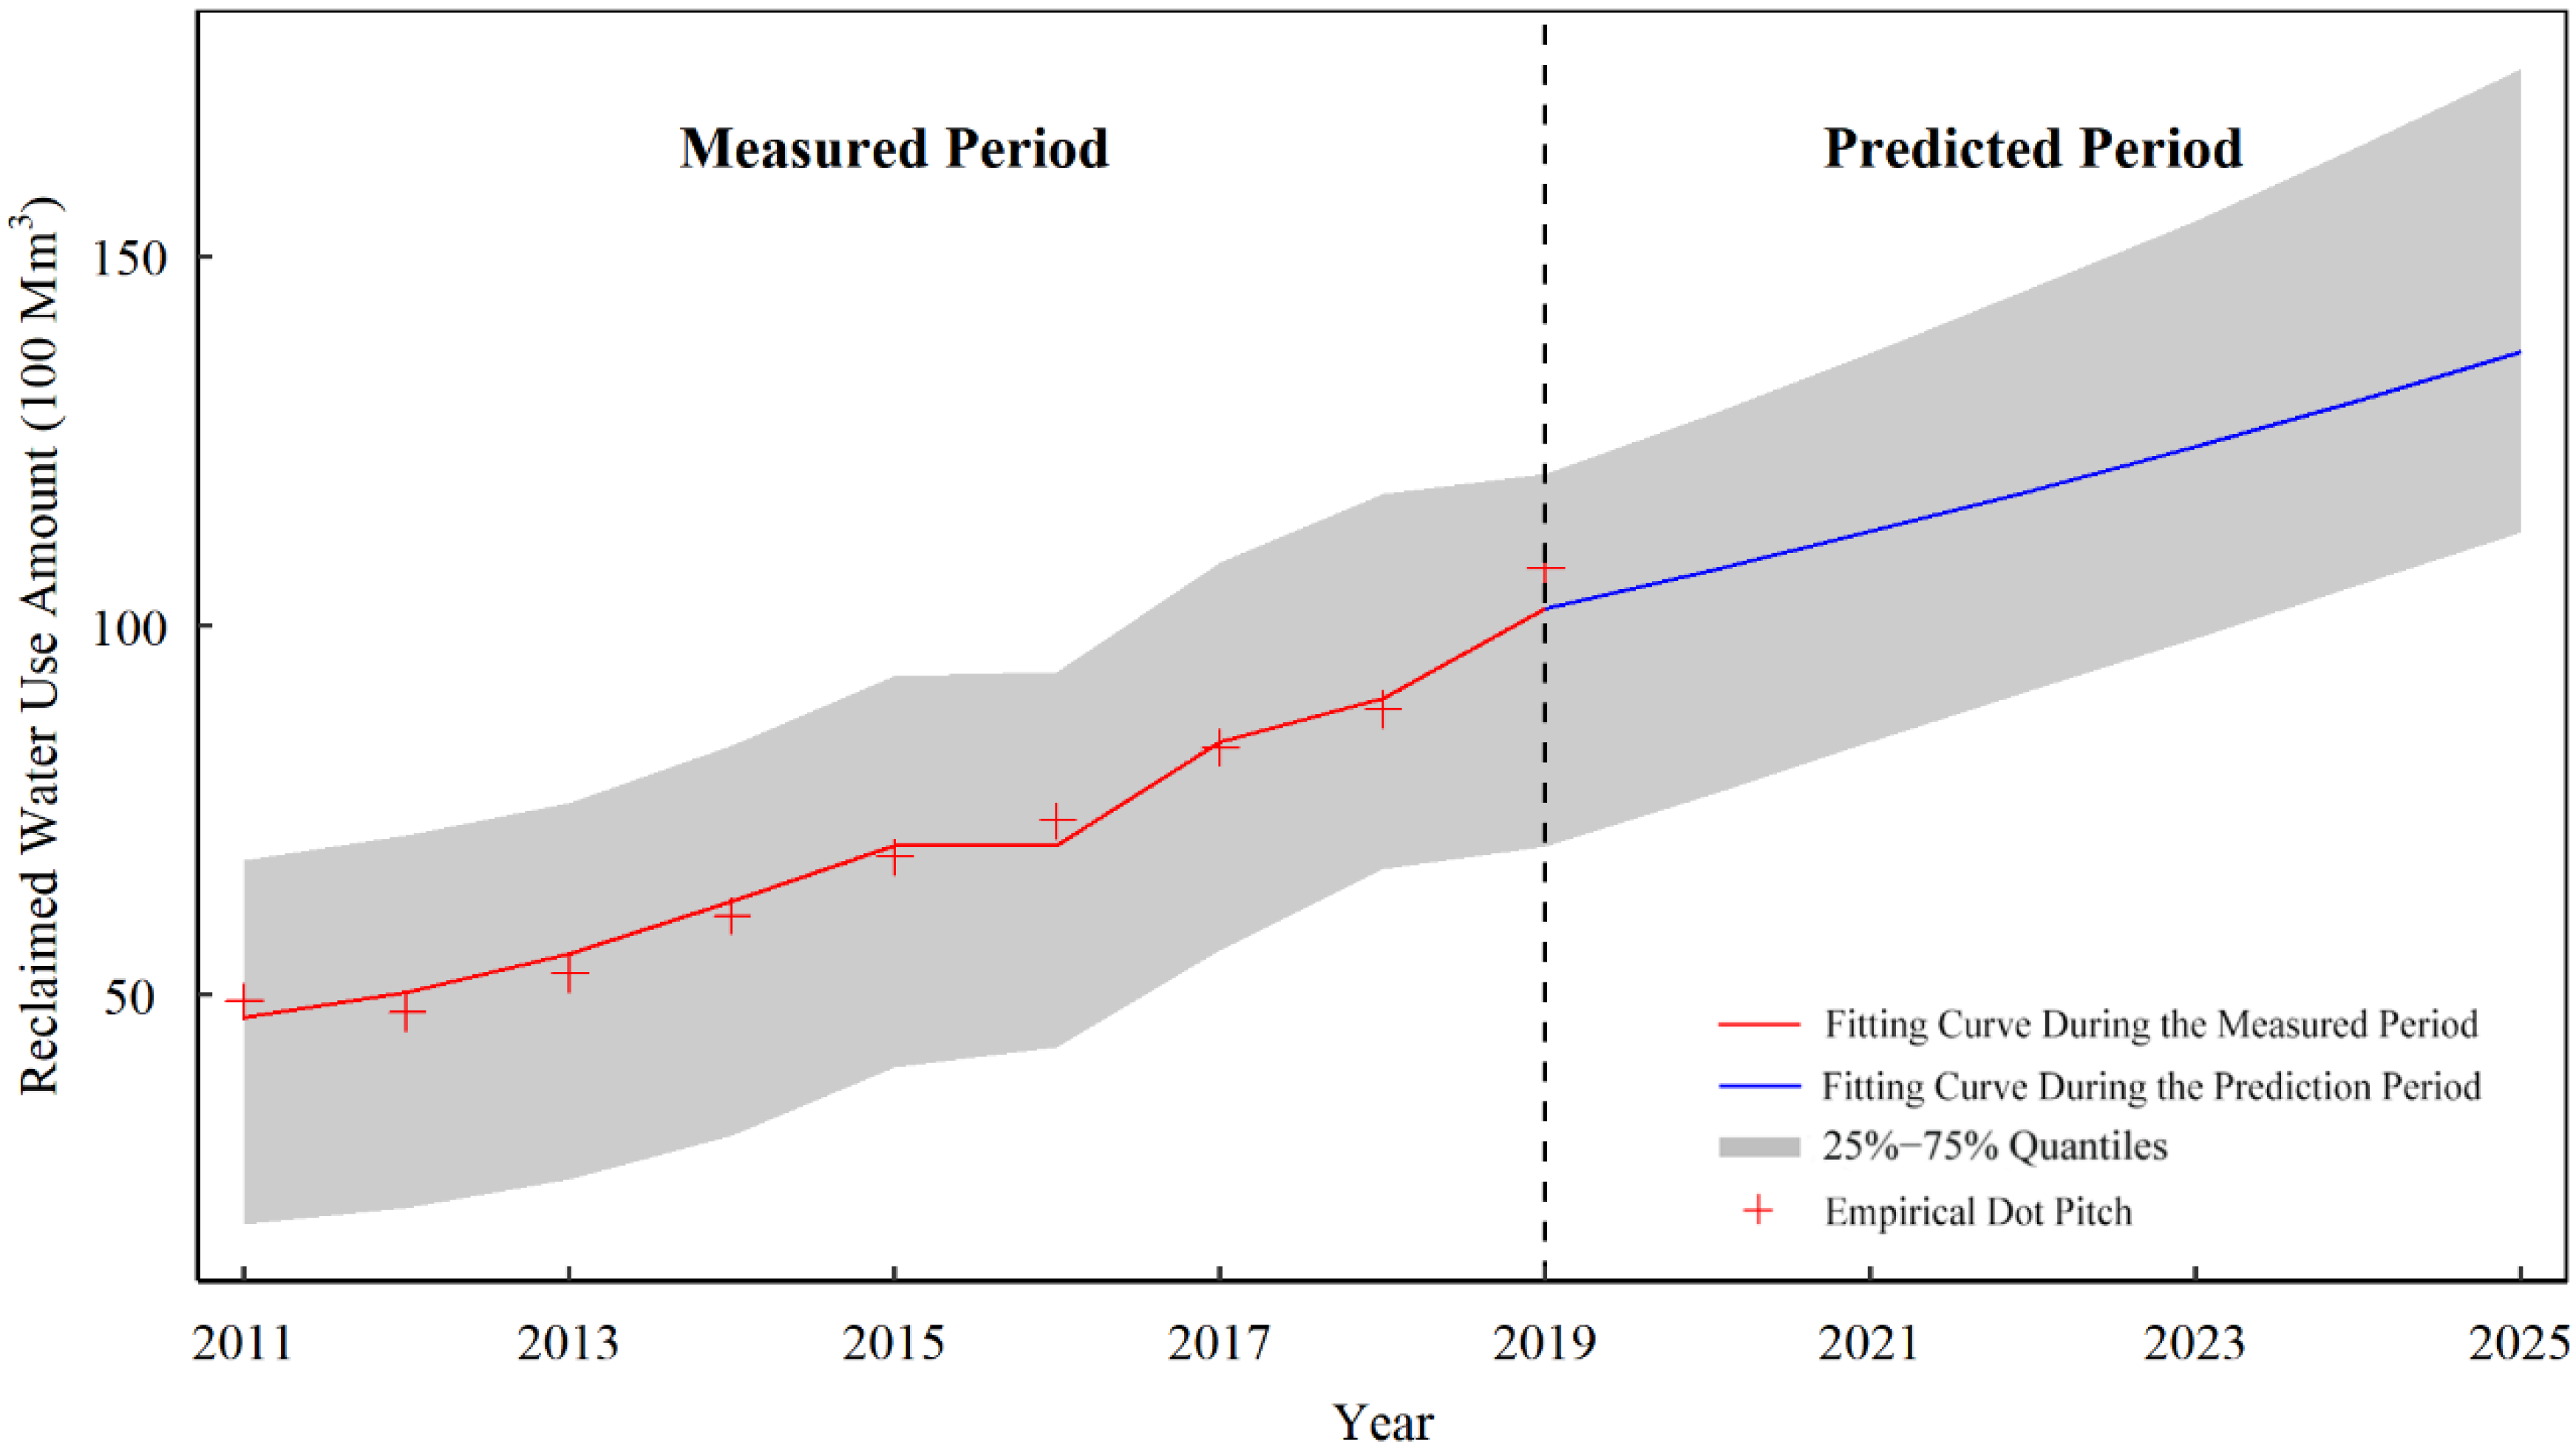
4.5. Potential Prediction Results
4.5.1. Extension of Key Indicator Sequence for Potential Prediction
4.5.2. Prediction on Potential Availability
4.5.3. Fitting Error Analysis
4.6. Model Results Discussions
5. Conclusions
- (1)
- For reclaimed water development and utilization, the driving factors outweigh the restraints, which indicates a high potential for development. Among the driving factors, the supply factor has the largest contribution (60%) to the development and utilization of reclaimed water, which is 10 times as large as that of the demand factor. Among the restraints, the lack of improved engineering conditions makes the largest contribution, followed by backward economic and technical conditions, and the water resource environment has the most negligible contribution.
- (2)
- The structural equation model (SEM) was built to portray the inter-factor transmission pathways and quantify the contributions of influencing factors. Consequently, four indicators with the largest contribution to reclaimed water development and utilization (∑P ≥ 68.8%) were identified, namely, the total amount of wastewater treated, the density of water pipelines in built-up areas, investment in facilities for reclaimed water treatment, and the processing of applications for water treatment patents. These four indicators could well explain the changes in the volume of reclaimed water utilization and hence could serve as the key indicators for predicting the potential availability of reclaimed water.
- (3)
- With a good fitting accuracy (R2 = 0.847), the established REM could effectively show how the empirical dot pitch fluctuated. Moreover, the potential prediction analysis found that China would maintain the rapid growth in reclaimed water utilization in the future, and up to 13.7 billion cubic meters of reclaimed water is expected to be available by 2025. This will help drive the efficiency of regional water recycling, while optimizing the structure of the urban water supply. It is worth noting that this paper used the SEM-REM model to calculate the amount of reclaimed water that could be developed and utilized in the future in China. By default, the reclaimed water quality meets the minimum water quality standards of the Chinese reclaimed water utilization regulations. In fact, the quality of the reclaimed water has different grades. The principle of high quality and superior use is very important for the graded development and utilization of reclaimed water. This involves a series of complex issues such as the choice of reclaimed water quality treatment process and the acceptability of water users for different levels of reclaimed water prices, which warrant further discussion in the future.
Author Contributions
Funding
Institutional Review Board Statement
Informed Consent Statement
Data Availability Statement
Acknowledgments
Conflicts of Interest
References
- Liang, J.; Hu, K.; Dai, T. Ecological Network Analysis Quantifying the Sustainability of Regional Economies: A Case Study of Guangdong Province in China. Chin. Geogr. Sci. 2018, 28, 127–136. [Google Scholar] [CrossRef] [Green Version]
- Jensen, O.; Nair, S. Integrated Urban Water Management and Water Security: A Comparison of Singapore and Hong Kong. Water 2019, 11, 785. [Google Scholar] [CrossRef] [Green Version]
- Wang, Y.B.; Liu, D.; Cao, X.C.; Yang, Z.Y.; Song, J.F.; Chen, D.Y.; Sun, S.K. Agricultural water rights trading and virtual water export compensation coupling model: A case study of an irrigation district in China. Agric. Water Manag. 2017, 180, 99–106. [Google Scholar] [CrossRef]
- Yi, L.; Jiao, W.; Chen, X.; Chen, W. An overview of reclaimed water reuse in China. J. Environ. Sci. 2011, 23, 1585–1593. [Google Scholar] [CrossRef]
- Gallego-Schmid, A.; Tarpani, R. Life cycle assessment of wastewater treatment in developing countries: A review. Water Res. 2019, 153, 63–79. [Google Scholar] [CrossRef] [Green Version]
- Harmon, D.; Gauvain, M. Influence of Internet-Based Messages and Personal Motivations on Water-Use Decisions. Basic Appl. Soc. Psychol. 2019, 41, 1–18. [Google Scholar] [CrossRef]
- Al-Hagla, K.S. Sustainable urban development in historical areas using the tourist trail approach: A case study of the Cultural Heritage and Urban Development (CHUD) project in Saida, Lebanon. Cities 2010, 27, 234–248. [Google Scholar] [CrossRef]
- Silva, F.; Scalize, P.S.; Cruvinel, K.; Albuquerque, A. Characterization of residual soil used for infiltration of reclaimed water. Eng. Sanit. E Ambient. 2017, 22, 95–102. [Google Scholar] [CrossRef] [Green Version]
- Palacios-Díaz, M.P.; Mendoza-Grimón, V.; Fernández-Vera, J.R.; Rodríguez-Rodríguez, F.; Tejedor-Junco, M.T.; Hernández-Moreno, J.M. Subsurface drip irrigation and reclaimed water quality effects on phosphorus and salinity distribution and forage production. Agric. Water Manag. 2009, 96, 1659–1666. [Google Scholar] [CrossRef]
- Wang, F.; Yu, L.; Jiang, L.; Cai, B.; Zhang, W.; Jiang, H.; Pan, H.; Li, F. Tracing China’s inter-regional cost transfer of air pollution through domestic supply chains. J. Clean. Prod. 2020, 268, 121488. [Google Scholar] [CrossRef]
- Dong, Z.; Wang, J. Quantitative standard of eco-compensation for the water source area in the middle route of the South-to-North Water Transfer Project in China. Front. Environ. Sci. Eng. China 2011, 5, 459. [Google Scholar] [CrossRef]
- Lin, J.; Kang, J.; Bai, X.; Li, H.; Lv, X.; Kou, L. Modeling the urban water-energy nexus: A case study of Xiamen, China. J. Clean. Prod. 2019, 215, 680–688. [Google Scholar] [CrossRef]
- He, P.J.; Phan, L.; Gu, G.W.; Hervouet, G. Reclaimed municipal wastewater-a potential water resource in China. Water Sci. Technol. 2001, 43, 51–58. [Google Scholar]
- Maestre-Valero, J.F.; Gonzalez-Ortega, M.J.; Martinez-Alvarez, V.; Gallego-Elvira, B.; Conesa-Jodar, F.J.; Martin-Gorriz, B. Revaluing the nutrition potential of reclaimed water for irrigation in southeastern Spain. Agric. Water Manag. 2019, 218, 174–181. [Google Scholar] [CrossRef]
- Fukasawa, B.N.; Mierzwa, J.C. Identification of water reuse potential in Metropolitan Regions using the Analytic Hierarchy Process. Environ. Sustain. Indic. 2020, 8, 1–14. [Google Scholar] [CrossRef]
- Tang, L.; Zhang, W.B. Research on Assessment Index System for Sustainable Utilization of Urban Water Resources. Appl. Mech. Mater. 2012, 212–213, 569–573. [Google Scholar] [CrossRef]
- Hochstrat, R.; Wintgens, T.; Melin, T.; Jeffrey, P. Assessing the European wastewater reclamation and reuse potential-a scenario analysis. Desalination 2006, 188, 1–8. [Google Scholar] [CrossRef] [Green Version]
- Romano, G.; Guerrini, A.; Vernizzi, S. Ownership, Investment Policies and Funding Choices of Italian Water Utilities: An Empirical Analysis. Water Resour. Manag. 2013, 27, 3409–3419. [Google Scholar] [CrossRef]
- Tang, L.; Zhang, W.B. Sustainable Utilization of Regional Water Resource in Yin Chuan City Based on Fuzzy Matter-Element Model. Adv. Mater. Res. 2013, 779, 1309–1313. [Google Scholar] [CrossRef]
- Jak, S.; Cheung, W.L. Meta-analytic structural equation modeling with moderating effects on SEM parameters. Psychol. Methods 2019, 25, 430. [Google Scholar] [CrossRef] [Green Version]
- Joreskog, K.G.; Sorbom, D.A. LISREL 8.54 and PRELIS 2.54; Scientific Software: Chicago, IL, USA, 2006. [Google Scholar]
- Barker, Z.A.; Stillwell, A.S. Implications of Transitioning from De Facto to Engineered Water Reuse for Power Plant Cooling. Environ. Sci. Technol. 2016, 50, 5379–5388. [Google Scholar] [CrossRef]
- Pardo, M.A.; Ángela, P.M.; Moya-Llamas, M.J. Using reclaimed water in dual pressurized water distribution networks. Cost analysis. J. Water Process. Eng. 2020, 40, 101766. [Google Scholar] [CrossRef]
- Goncalves, R.F.; de Oliveira, V.L.; Peres, M.; Merlo, S.S. Microbiological risk from non-potable reuse of greywater treated by anaerobic filters associated to vertical constructed wetlands. J. Water Process. Eng. 2020, 39, 101751. [Google Scholar] [CrossRef]
- Salerno, F.; Viviano, G.; Manfredi, E.C.; Caroli, P.; Thakuri, S.; Tartari, G. Multiple Carrying Capacities from a management-oriented perspective to operationalize sustainable tourism in protected areas. J. Environ. Manag. 2013, 128, 116–125. [Google Scholar] [CrossRef] [PubMed]
- Ministry of Water Resources of China. China Water Resources Bulletin 2019; China Waterpower Press: Beijing, China, 2020. [Google Scholar]
- Ministry of Housing and Urban–Rural Development of China. China Urban-Rural Construction Statistical Yearbook 2019; China Planning Press: Beijing, China, 2020. [Google Scholar]
- National Bureau of Statistics of China. China Statistical Yearbook 2019; China Statistics Press: Beijing, China, 2020.
- Satorra, A.; Saris, W.E. Power of the likelihood ratio test in covariance structure analysis. Psychometrika 1985, 50, 83–90. [Google Scholar] [CrossRef]
- Browne, M.W.; Cudeck, R. Alternative ways of assessing model fit-Institute for Social and Economic Research (ISER). Clin. Diagn. Lab. Immunol. 1992, 7, 161–167. [Google Scholar]
- Evermann, J.; Tate, M. Assessing the predictive performance of structural equation model estimators. J. Bus. Res. 2016, 69, 4565–4582. [Google Scholar] [CrossRef]
- Dolado, J.J.; Jenkinson, T.; Sosvilla-Rivero, S. Cointegration and unit roots. J. Econ. Surv. 2010, 4, 249–273. [Google Scholar] [CrossRef] [Green Version]
- Horváth, L.; Kokoszka, P.; Rice, G. Testing stationarity of functional time series. J. Econom. 2014, 179, 66–82. [Google Scholar] [CrossRef]
- Zhang, W.B.; Tang, L. Settlement and Deformation Laws of High Loess-Filled Embankment Based on Centrifugal Model Test. Appl. Mech. Mater. 2011, 90–93, 222–229. [Google Scholar] [CrossRef]
- Chu, J.; Chen, J.; Wang, C.; Fu, P. Wastewater reuse potential analysis: Implications for China’s water resources management. Water Res. 2004, 38, 2746–2756. [Google Scholar] [CrossRef]
- Aljanabi, A.; Mays, L.; Fox, P. Optimization Model for Agricultural Reclaimed Water Allocation Using Mixed-Integer Nonlinear Programming. Water 2018, 10, 1291. [Google Scholar] [CrossRef] [Green Version]
- Jódar-Abellán, A.; Ortiz, M.; Melgarejo, J. Wastewater Treatment and Water Reuse in Spain. Current Situation and Perspectives. Water 2019, 11, 1551. [Google Scholar] [CrossRef] [Green Version]


| Level I Latent Variables | Level II Latent Variables | Measured Variables | No. | Unit | Source |
|---|---|---|---|---|---|
| Drivers | Supply Factors | Total Water Resources | E1 | 100 Mm3 | [26] |
| Average Per Capita Water Resources | E2 | m3/capita | [26] | ||
| Quantity of Wastewater Treated | E3 | 100 Mm3 | [27] | ||
| Population of Water Treatment Workers | E4 | people | [28] | ||
| Demand Factors | Total Urban Area | E5 | km2 | [27] | |
| Density of Urban Population | E6 | people/km2 | [27] | ||
| Total Amount of Water Consumption | E7 | 100 Mm3 | [26] | ||
| Water Consumption in Agriculture | E8 | 100 Mm3 | [26] | ||
| Water Consumption in Industry | E9 | 100 Mm3 | [26] | ||
| Water Consumption in Daily Life | E10 | 100 Mm3 | [26] | ||
| Water Consumption in Ecology | E11 | 100 Mm3 | [26] | ||
| Per Capita Water Consumption | E12 | L/capita | [26] | ||
| Water Consumption in Production | E13 | 100 Mm3 | [26] | ||
| Restraints | Engineering Conditions | Daily Capacity of Urban Wastewater Treatment | E14 | 10,000 m3 | [27] |
| Density of Water Supply Pipelines in Built-up Areas | E15 | km/km2 | [27] | ||
| Density of Drainage Pipelines in Built-up Areas | E16 | km/km2 | [27] | ||
| Capacity of Plants with Grade II and III Wastewater Treatment Technology | E17 | 10,000 m3 | [27] | ||
| Wastewater Treatment Rate | E18 | % | [27] | ||
| Wastewater Treatment Plants | E19 | — | [27] | ||
| Production Capacity of Water Supply | E20 | 10,000 m3/d | [28] | ||
| Economic Conditions | GRP | E21 | 100 M RMB | [28] | |
| Per Capita GRP Index | E22 | — | [28] | ||
| Investment in Industrial Wastewater Management | E23 | 10,000 RMB | [28] | ||
| Investment in Wastewater Treatment Facilities | E24 | 10,000 RMB | [27] | ||
| Investment in Reclaimed Water Treatment Facilities | E25 | 10,000 RMB | [27] | ||
| Technical Strength | Number of Processed Applications for Water Treatment Patents | E26 | pcs | [28] | |
| Water Environment | Average Annual Precipitation | E27 | mm | [26] | |
| Average Annual Evaporation | E28 | mm | [26] | ||
| Groundwater Resources | E29 | 100 Mm3 | [26] | ||
| Underground Water Resources | E30 | 100 Mm3 | [26] | ||
| Proportion of Rivers with a Rating Lower than Grade V | E31 | % | [26] | ||
| Water Use Intensity | E32 | % | [27] |
| Result Type | Chi-Square Test | Goodness of Fit Index | Alternative Index | Residual Analysis | ||
|---|---|---|---|---|---|---|
| χ2/df | GFI | NFI | CFI | RMSEA | SRMR | |
| Standard Value | 1~3 | >0.90 | >0.90 | >0.95 | <0.08 | <0.08 |
| Fitting Value | 1.236 | 0.914 | 0.902 | 0.987 | 0.063 | 0.031 |
| Serial Number | Variables | Application Direction | Variables | Standardized Regression Weights | Serial Number | Variables | Application Direction | Variables | Standardized Regression Weights |
|---|---|---|---|---|---|---|---|---|---|
| 1 | Drivers | ← | Reclaimed Water Use | 0.79 | 23 | E12 | ← | Demand Factors | 0.01 |
| 2 | Restraints | ← | Reclaimed Water Use | 0.36 | 24 | E13 | ← | Demand Factors | 0.10 |
| 3 | Supply Factors | ← | Drivers | 0.84 | 25 | E14 | ← | Engineering Conditions | 0.97 |
| 4 | Demand Factors | ← | Drivers | 0.11 | 26 | E15 | ← | Engineering Conditions | 0.26 |
| 5 | Restraints | ← | Supply Factors | 0.25 | 27 | E16 | ← | Engineering Conditions | 0.19 |
| 6 | Engineering Conditions | ← | Restraints | 0.96 | 28 | E17 | ← | Engineering Conditions | 0.94 |
| 7 | Economic Conditions | ← | Restraints | 0.87 | 29 | E18 | ← | Engineering Conditions | 0.31 |
| 8 | Technical Strength | ← | Restraints | 0.88 | 30 | E19 | ← | Engineering Conditions | 0.95 |
| 9 | Water Environment | ← | Restraints | −0.03 | 31 | E20 | ← | Engineering Conditions | 0.93 |
| 10 | Demand Factors | ← | Supply Factors | −0.14 | 32 | E21 | ← | Economic Conditions | 0.95 |
| 11 | Supply Factors | ← | Demand Factors | 0.23 | 33 | E22 | ← | Economic Conditions | −0.04 |
| 12 | E1 | ← | Supply Factors | 0.20 | 34 | E23 | ← | Economic Conditions | 0.68 |
| 13 | E2 | ← | Supply Factors | −0.18 | 35 | E24 | ← | Economic Conditions | 0.42 |
| 14 | E3 | ← | Supply Factors | 0.95 | 36 | E25 | ← | Economic Conditions | −0.02 |
| 15 | E4 | ← | Supply Factors | 0.63 | 37 | E26 | ← | Technical Strength | 0.96 |
| 16 | E5 | ← | Demand Factors | −0.01 | 38 | E27 | ← | Water Environment | 0.40 |
| 17 | E6 | ← | Demand Factors | 0.00 | 39 | E28 | ← | Water Environment | 0.81 |
| 18 | E7 | ← | Demand Factors | 0.95 | 40 | E29 | ← | Water Environment | −0.17 |
| 19 | E8 | ← | Demand Factors | 0.93 | 41 | E30 | ← | Water Environment | 0.20 |
| 20 | E9 | ← | Demand Factors | 0.88 | 42 | E31 | ← | Water Environment | 0.90 |
| 21 | E10 | ← | Demand Factors | 0.73 | 43 | E32 | ← | Water Environment | −0.16 |
| 22 | E11 | ← | Demand Factors | 0.26 |
| Level I Latent Variables | Contribution (%) | Level II Latent Variables | Contribution (%) | Measured Variables | Contribution (%) |
|---|---|---|---|---|---|
| Drivers | 65.6% | Supply Factors | 60.4% | Total Water Resources | 5.9% |
| Average Per Capita Water Resources | 4.4% | ||||
| Quantity of Wastewater Treated | 45.2% | ||||
| Population of Water Treatment Workers | 4.9% | ||||
| Demand Factors | 5.2% | Total Urban Area | 0.1% | ||
| Density of Urban Population | 0.1% | ||||
| Total Amount of Water Consumption | 0.8% | ||||
| Water Consumption in Agriculture | 0.9% | ||||
| Water Consumption in Industry | 1.2% | ||||
| Water Consumption in Daily Life | 0.7% | ||||
| Water Consumption in Ecology | 0.8% | ||||
| Per Capita Water Consumption | 0.1% | ||||
| Water Consumption in Production | 0.5% | ||||
| Restraints | 34.4% | Engineering Conditions | 11.8% | Daily Capacity of Urban Wastewater Treatment | 1.2% |
| Density of Water Supply Pipelines in Built-up Areas | 7.6% | ||||
| Density of Drainage Pipelines in Built-up Areas | 0.4% | ||||
| Capacity of Plants with Grade II and III Wastewater Treatment Technology | 1.1% | ||||
| Wastewater Treatment Rate | 0.7% | ||||
| Wastewater Treatment Plants | 0.3% | ||||
| Production Capacity of Water Supply | 0.5% | ||||
| Economic Conditions | 9.6% | GRP | 0.1% | ||
| Per Capita GRP Index | 0.2% | ||||
| Investment in Industrial Wastewater Management | 1.3% | ||||
| Investment in Wastewater Treatment Facilities | 1.7% | ||||
| Investment in Reclaimed Water Treatment Facilities | 6.3% | ||||
| Technical Strength | 9.7% | Number of Processed Applications for Water Treatment Patents | 9.7% | ||
| Water Environment | 3.3% | Average Annual Precipitation | 0.5% | ||
| Average Annual Evaporation | 1.0% | ||||
| Groundwater Resources | 0.2% | ||||
| Underground Water Resources | 0.3% | ||||
| Proportion of Rivers with a Rating Lower than Grade V | 1.1% | ||||
| Water Use Intensity | 0.2% |
| Variables | ADF Test | KPSS Test | Stability | First-Order Difference | Stability |
|---|---|---|---|---|---|
| E3 | −3.84 (0.02) | 0.051 (>0.1) | Stable | — | — |
| E15 | −4.59 (<0.01) | 0.203 (>0.1) | Stable | — | — |
| E25 | −3.15 (0.10) | 0.068 (>0.1) | Unstable | 0.035 (>0.1) | Stable |
| E26 | −4.43 (<0.01) | 0.285 (>0.1) | Stable | — | — |
| Coefficient | FEM | REM | MEM |
|---|---|---|---|
| Intercept | — | 14,080.9 (0.009) | 14,982 (0.02) |
| E3 | 0.443 (0.129) | −0.517 (0.007) | −0.356 (0.000) |
| E15 | −223.6 (0.674) | −1706.4 (0.000) | −1819.6 (0.000) |
| E25 | −0.002 (0.886) | 0.052 (0.000) | 0.066 (0.000) |
| E26 | 0.161 (0.236) | 0.209 (0.000) | 0.239 (0.019) |
| Tests | Statistic | p-Value |
|---|---|---|
| F Test | 15.043 | <0.001 |
| Hausman Test | 2.718 | 0.746 |
| Year | E3 (100 Mm3) | E15 (km/km2) | E25 (RMB 100 M) | E26 (pcs) |
|---|---|---|---|---|
| 2019 | 16.7 | 14.7 | 99.4 | 16,075 |
| 2020 | 17.5 | 14.9 | 114.7 | 17,223 |
| 2021 | 18.2 | 15.1 | 131.9 | 18,371 |
| 2022 | 19.0 | 15.3 | 150.8 | 19,519 |
| 2023 | 19.8 | 15.6 | 171.5 | 20,667 |
| 2024 | 20.5 | 15.8 | 194.0 | 21,815 |
| 2025 | 21.3 | 16.0 | 218.3 | 22,963 |
| Year | Measured Amount (100 Mm3) | Fitting Amount (100 Mm3) | Fitting Error (%) |
|---|---|---|---|
| 2011 | 49.1 | 47.0 | −4.3 |
| 2012 | 47.6 | 50.4 | 5.9 |
| 2013 | 52.9 | 55.6 | 5.2 |
| 2014 | 60.7 | 62.7 | 3.3 |
| 2015 | 68.7 | 70.2 | 2.2 |
| 2016 | 73.6 | 70.2 | −4.6 |
| 2017 | 83.5 | 84.3 | 1.0 |
| 2018 | 88.7 | 90.2 | 1.7 |
Publisher’s Note: MDPI stays neutral with regard to jurisdictional claims in published maps and institutional affiliations. |
© 2021 by the authors. Licensee MDPI, Basel, Switzerland. This article is an open access article distributed under the terms and conditions of the Creative Commons Attribution (CC BY) license (https://creativecommons.org/licenses/by/4.0/).
Share and Cite
Zheng, J.; Liu, J.; Ma, T.; Peng, A.; Deng, X. An SEM-REM-Based Study on the Driving and Restraining Mechanisms and Potential of Reclaimed Water Utilization in China. Water 2022, 14, 52. https://doi.org/10.3390/w14010052
Zheng J, Liu J, Ma T, Peng A, Deng X. An SEM-REM-Based Study on the Driving and Restraining Mechanisms and Potential of Reclaimed Water Utilization in China. Water. 2022; 14(1):52. https://doi.org/10.3390/w14010052
Chicago/Turabian StyleZheng, Jintao, Jiufu Liu, Tao Ma, Anbang Peng, and Xiyuan Deng. 2022. "An SEM-REM-Based Study on the Driving and Restraining Mechanisms and Potential of Reclaimed Water Utilization in China" Water 14, no. 1: 52. https://doi.org/10.3390/w14010052
APA StyleZheng, J., Liu, J., Ma, T., Peng, A., & Deng, X. (2022). An SEM-REM-Based Study on the Driving and Restraining Mechanisms and Potential of Reclaimed Water Utilization in China. Water, 14(1), 52. https://doi.org/10.3390/w14010052