Article

Priority Pollutants Monitoring and Water Quality Assessment in the Siret River Basin, Romania

1
Department of Environmental Engineering and Management, Cristofor Simionescu Faculty of Chemical Engineering and Environmental Protection, Gheorghe Asachi Technical University of Iasi, Bd. D. Mangeron 73, 700050 Iasi, Romania
2
Siret River Water Basin Administration, 600401 Bacau, Romania
*
Authors to whom correspondence should be addressed.
Water 2022, 14(1), 129; https://doi.org/10.3390/w14010129
Submission received: 8 December 2021 / Revised: 23 December 2021 / Accepted: 31 December 2021 / Published: 5 January 2022
(This article belongs to the Section Water Quality and Contamination)

Abstract

:
The Integrated Water Resources Management regulations aim to ensure a good status of surface water quality and its sustainable use. Water quality monitoring of various water users supports the identification of pollution sources and their environmental impacts. The priority pollutants generated by wastewater discharges from municipal, industrial wastewater treatment plants or agricultural areas are of great interest due to their eco-toxicological effects and bio-accumulative properties. The aim of this study was to monitor the priority organic and inorganic pollutants from the Siret River basin, in Romania, with the purpose of assessing the surface water quality status and evaluating it by the Water Quality Index (WAWQI) method. The monitoring of inorganic priority pollutants (e.g., As, Cd, Hg, Ni, Pb) and organic priority pollutants (e.g., Naphthalene, Anthracene, Phenanthrene, Fluoranthene, Benzo(a)anthracene, Benzo(b)fluoranthene, Benzo(k)fluoranthene, Benzo(a)pyrene, Benzo(ghi)perylene, Indeno(1,2,3-cd)pyrene, α, β, and γ-Hexachlorocyclohexane, and Di-2-ethyl-hexyl-phthalate) was conducted within the Siret River basin, during the period 2015–2020. With this purpose, 21 sampling points (18 river sections and 3 lakes) were considered to assess the water quality. The results of this study proved that the water quality within the Siret River basin is generally classified in the 2nd or 3rd class. The spatial distribution of the water quality index values, using ARCGIS, also highlighted the fact that the water quality is mostly unsuitable for drinking water supplies, being influenced by the quality of its main tributaries, as well as by the effluent of wastewater treatment plants.

1. Introduction

As a response to the concerns related to the anthropogenic water pollution, water scarcity and for ensuring the safety of drinking water supplies in an integrated way, at the level of river basins, the Water Framework Directive (WFD), 2000/60/EC was developed and enforced at the European Union (EU) level, stating that by 2015, all waters (surface and ground waters) should achieve good status [1,2,3]. Since there is a direct relationship between WFD implementation and integrated water resources management, the implementation status of WFD is addressing specifically the River Basin Management Plans of all Member States and the monitoring programs designed for the control of current pollutants, but also for the priority and emerging ones [4]. The success of WFD implementation relies on the ability of the Member States to implement and develop sustainable actions through water management schemes at the river basin scale [5]. Industrial activities are responsible for the discharge of effluents with a wide range of inorganic and organic compounds that belong to the priority (PPs) and emerging pollutants (EPs) classes, pharmaceuticals and personal care products, pesticides, heavy metals, detergents, and flame-retardants being only a few examples of such pollutants. Through their presence, eco-toxicological and human health effects, bio-accumulative, and degradation characteristics may influence aquatic biota and the performance and costs of water and wastewater treatment plants [4].
The monitoring of priority pollutants included in the WFD and other water international conventions, such as the Convention for the Protection of the Marine Environment of the North-East Atlantic (OSPAR), is of major interest [6]. Persistent organic pollutants (POPs), polychlorinated biphenyls (PCBs), and polycyclic aromatic hydrocarbons (PAHs) have high toxicity [7,8], and, even if the measured concentrations are low, some of them are not fully biodegradable, with carcinogenic and mutagenic properties [9]. Among the most common pollutants, heavy metals have severely damaged aquatic ecosystems over time [10,11]. As in the case of other pollutants, they are released into the aquatic ecosystem by both natural and anthropogenic processes [12].
Nowadays, rivers are exposed to numerous micropollutants, including pesticides and solvents from the discharge of effluents from municipal or industrial wastewater treatment plants, which represent one of the most significant sources of pollution in the aquatic environment [13,14,15,16]. River water quality monitoring is indispensable to achieve an adequate water management, especially when river water serves as a water supply for various purposes [17,18]. The frequency of monitoring and evaluation of water quality helps to develop management strategies for controlling surface water pollution, generated by increased urbanization and economic development [14]. Pollution prevention and environmental protection may be assured if the sampling, data collection, analysis, and interpretation of results are integrated into the decision-making process; this, in turn, contributes to refining the monitoring requirements, pollution prevention measures, and decision-making processes [14,19]. All changes observed in the water system can offer fast evidence of improvement measures that are already implemented or can indicate that it is necessary to take different actions for pollution control [20].
Developing countries are facing significant problems when it comes to water supply and water management. Water quality management requires the collection and analysis of large sets of water quality indicators, data that can be difficult to assess and synthesize [21]. A helpful model for water quality control is the water quality index (WQI), used in many studies for national rivers (Jiu river [22,23], Prut river [24,25], Suceava river [26], Danube river [27]), and other international studies that refer to water quality [12,28,29]. It was proved that WQI represents one of the important evaluation tools that are based on an aggregation function, which allows the analysis of large temporally and spatially-varying water quality datasets turned into a single value [14,21,30,31,32,33]. Thus, this final value can be easily understood, representing a numerical expression that converts complex water quality data and it is accepted by all national and international water organizations [14,34].
With all the progresses made in the last period, it is a reality that Romania still has an economy based on intensive resources’ consumption, a society and an administration still looking for a unitary vision, while the natural capital is affected by the risk of global damage that might become irreversible [35]. According to the National Strategy for Sustainable Development of Romania, Horizons 2013–2020–2030, only 57.5% of the total monitored river length is suitable for drinking purposes, and because of the surface water pollution level, just 45.5% is technically usable [36].
In this context, the objectives of this study considered the following aspects:
  • The monitoring of the priority organic and inorganic pollutants from the Siret River basin, Romania, in the view of the implementation of the WFD requirements, and
  • The evaluation of the water quality of the Siret River basin, based on measured concentration of the organic and inorganic priority pollutants using the WQI method, with the purpose to establish the water quality status that will contribute to the Second river basin management plan evaluation.
The survey was conducted during the period 2015–2020, in various surface water sections of the Siret River basin, considering 21 sampling points, distributed as follows: 18 river sections and three lake sections. An important role of this study is that the Siret River basin includes Sites of Community Importance, Natura 2000 sites, such as: ROSCI0391—Middle Siret—Bucecea, ROSCI0162—Lower Siret meadow, and Special Bird Protection Areas: ROSPA0110—The Rogojești—Bucecea accumulations, ROSPA0072—Meadow of the Middle Siret, ROSPA0071—Lower Siret meadow [37].
The analysis of the Siret River basin considered the concentrations of inorganic pollutants (e.g., heavy metals Ni, Cd, Pb, Hg, and As) and organic priority pollutants (e.g., Naphthalene, Anthracene, Phenanthrene, Fluoranthene, Benzo(a)anthracene, Benzo(b)fluoranthene, Benzo(k)fluoranthene, Benzo(a)pyrene, Benzo(ghi)perylene, Indeno (1,2,3-cd)pyrene, organochlorine pesticides (OCPs)—alpha-Hexachlorocyclohexane (α-HCH), beta-Hexachlorocyclohexane (β-HCH), gamma-Hexachlorocyclohexane (γ-HCH), Dichloromethane, Chloroform, and Di (2-ethylhexyl)phthalate (DEHP)).
To the best of our knowledge, this is the first integrated approach of monitoring both inorganic and organic priority pollutants at the Siret River basin level and correlation with the WQI assessment for a better inclusion in the decision-making processes. This study has a major contribution to the survey and implementation of the national management of river basins plans and the Danube River master plan for ensuring a good status of all waters according to the Water Framework Directive.

2. Materials and Methods

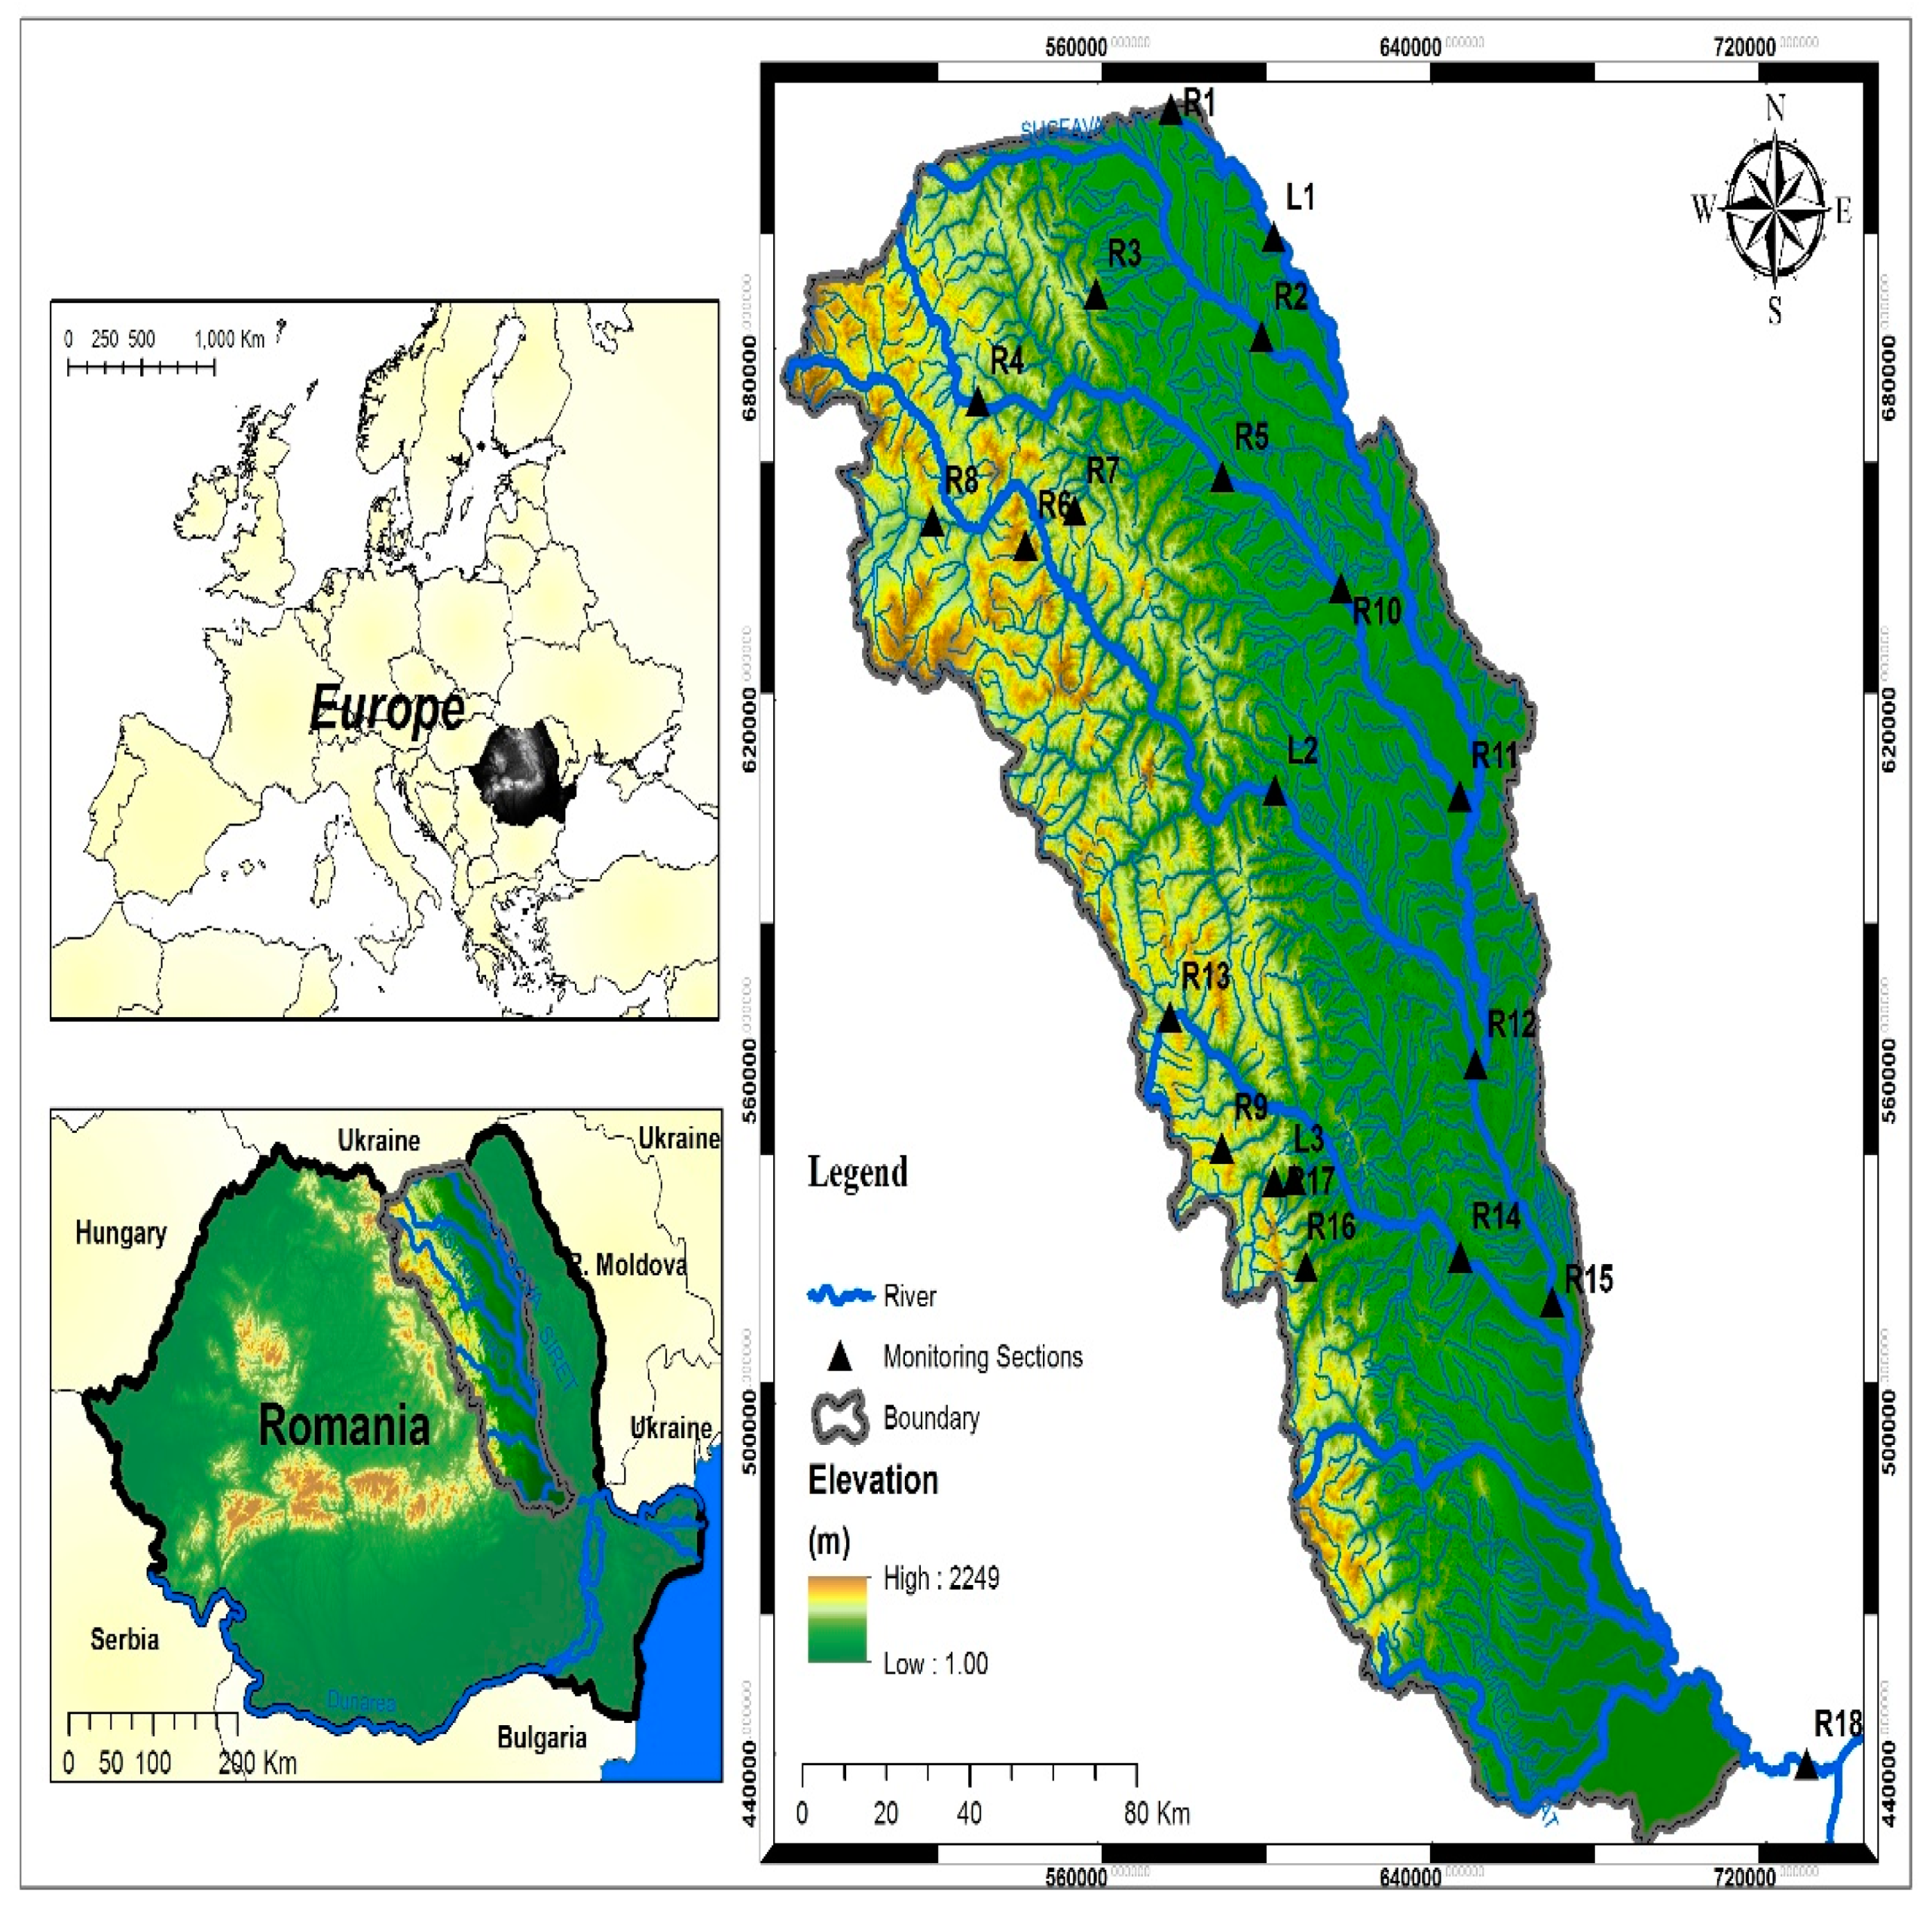
2.1. Study Area and Monitoring Strategy

The Siret River drains the central and eastern part of the Eastern Carpathians, Eastern Sub-Carpathians, Moldavian Plateau and the Siret Lower Plain [38] (Figure 1), covering 706 km, out of which 596 km are in Romania and 110 km in Ukraine. The basin comprises the largest watercourse in Romania (with 28,116 km2), collecting about 17% of the total volume of Romania’s water resources. Siret River is one of the main tributaries of Danube, with a multi-annual flow rate of 250 m3/s [39].
The hydrographic basin of Siret River is populated by 288 human agglomerations without wastewater treatment plants, and 43 wastewater treatment plants, out of which only one fulfills the environmental standards imposed by the European Directive 91/271/EEC [39]. The main anthropic activities for this region are agriculture, chemical industry (production of detergents, rubbers, insecticides, fungicides, herbicides, and disinfectants), wastewater treatment plants, non-ferrous and radioactive mining extractions, and metallurgical industry. The Hydrographic Management Plan of the Siret Basin [39] highlights the presence of water users that can produce accidental pollution and which, under the coordination of the Siret Waters Department, have developed their own plans for the prevention and control of such accidental pollution. Generally, these pollution sources use, produce, store, and dispose of substances that can accidentally reach the water resources.
The main tributary rivers for this basin are: Suceava, Moldova, Bistrița, and Trotuș, while the most important water accumulations are: Rogojești, Bucecea, Dragomirna, Somuz II Moara, Izvorul Muntelui, and Poiana Uzului, which can significantly influence the water quality of the entire basin.
This study aimed to identify the major environmental impacts of different inorganic and organic priority pollutants considering 21 sampling sites, the samples being taken yearly by 2/4/8/12 times, during the period 2015–2020 (as presented in Table 1 and Figure 1). The sampling points were established with the purpose of: (1) cover the natural water course and impacted areas; (2) evaluate all aspects that can influence the water quality (i.e., treatment sections, industrial platforms, wastewater, and the discharges of treated wastewaters); (3) assess the spatial evolution of the water quality.

2.2. Analysis Methods

Special attention was given to the sampling procedures, storage, and analysis to avoid contamination. The sampling strategy considered the special requirements imposed by the existing ISO quality standards (ISO 5667-4:1987 [40], ISO 5667-6:2014 [41] and ISO 5667-3:2018 [42]) for sampling, handling, and preservation of water samples specific for these types of priority pollutant analyzes. The analysis of priority pollutants was performed in the water quality accredited laboratory (ISO 17025/2018) from the Siret River Basin Water Administration (ABAS), using atomic absorption spectrometer-AAS (for Cd, Ni, Pb), atomic fluorescence spectrometer (i.e., Hg), inductively coupled plasma mass spectrometer-ICP-MS (i.e., As, Cd, Hg, Pb), high performance chromatograph with fluorescent detector (i.e., PAH), gas chromatograph coupled with an electron capture detector (for organochlorine pesticides and DEHP) (as presented in Table 2). The activity of the Siret River Basin Water Administration complies with the ISO 9001: 2015 quality management standard [43].

2.3. Water Quality Index Method Description

The Water Quality Index is a number that combines the values of a wide range of water quality parameters, and is usually used by various experts to present annual cycles, spatial and temporal variations, even at low concentrations, in an efficient and short time [26,52]. Initially, the WQI was developed by Horton (1965) in the United States by selecting 10 water quality parameters such as dissolved oxygen, pH, conductivity, alkalinity, chlorides etc. [30,33,53]. Around the world, various methods for WQI were developed after Horton’s method [1,21], such as: the National Sanitation Foundation Water Quality Index, the Scottish Research Development Department, the River Status Index, the Canadian Council of Ministers of the Environment Water Quality Index, the British Columbia Water Quality Index, the Overall Index of Pollution, the Oregon Water Quality Index, the Bhargava Method Water Quality Index, the Malaysia Water Quality Index, the Water Contamination Index, the Vaal Water Quality Index, etc. [33,34,54]. Subsequently, WQI was widely applied and accepted in European, African, and Asian countries [26,30]. Recently, many changes to the WQI concept have been considered due to the studies conducted over time by scientists and experts. The involved methodologies present the common steps of the WQI approach [26,33,55]:
  • Selecting the water quality parameters (physical, chemical, biological);
  • Combining the parameters into sub-indices;
  • Assigning the parameter weights values;
  • Aggregating the weighted elements into a final index/results.
To calculate the water quality index in this study, an algorithm was used that considered the 19 monitored priority pollutants parameters, computing the influence of each parameter (Wi). The used method was the Weighted Arithmetic Water Quality Index (WAWQI), described in various studies [14,30,54,56,57]. This method was chosen because it has the advantage to incorporate multiple parameters into a simple equation, considering also the national standards for surface water quality regarding the priority pollutants. Another advantage is that each parameter contributes to the evaluation of water quality and that the method may be used to evaluate the water quality for human consumption.
The methodology consisted of the following steps: (a) data collection and annual averages account for all monitored parameters; (b) WAWQI calculation, using the following formulas (Equations (1)–(5)) [24,30,34,53,54,56,58]:
WAWQI =   W i q i   W i
where: Wi—the importance of parameter i for WQI index calculation (relative weight); qi—the relative value of the water quality, specific to each parameter i:
q i = 100 c i v 0 S i v 0
where: ci—the determined concentration of the ith analyzed parameter, μg/L;
v0—the ideal value of that analyzed parameter;
Si—the maximum allowed concentration by national or international standards, μg/L.
WQI is calculated considering the Romanian standards for surface waters, in our case Governmental Decision, 2016 [45] (where v0 represents the ideal value of the analyzed parameter and it is considered 0 for all parameters reasoned by their persistence, toxicity, endocrine disruption potential, carcinogenic, mutagenic, and teratogenic effects):
q i = 100 c i S i
W i = K S i
where: K—a constant which can be calculated by:
K = 1   ( 1 S i )
Depending on the water quality index, water can be included in one of the following quality classes/categories (as presented in Table 3) [30,54,59]. In the scientific literature the use of two scales were reported for WQI as follows [14,58,60]:
The scale further used in this study is that proposed by Ramakrishnaiah et al. [60] and the most applied in the last years [14,58], considering the fact that the sampling points are located near the industrial and agricultural pollution sources, as well as wastewater treatment plants’ discharges.

3. Results and Discussion

3.1. Monitoring of Priority Inorganic and Organic Pollutants

The contamination of surface water (used for drinking water production) with heavy metals and organic priority pollutants represents an important environmental problem and public health concern, due to their eco-toxicological, bio-accumulative properties and human health effects.
The monitoring of priority pollutants in the Siret River basin focused on priority inorganic and organic pollutants, considering the detection limits/quantification limits that allow compliance with the values of specific quality standards. Surface water monitoring techniques consider cause-and-effect interdependencies for both diffuse and point pollution sources. Water quality assessment considered sampling and analysis of priority pollutants with a frequency of 2/4/8/12 times/year as presented in Table 1. Sampling points have been set up to cover both the river’s natural course and affected areas, identifying all aspects that may influence the water quality downstream due to wastewater treatment plants, industrial platforms, and agriculture diffuse pollution sources. The monitoring results of the priority pollutants from the Siret River basin are presented in Figure 2a–s.

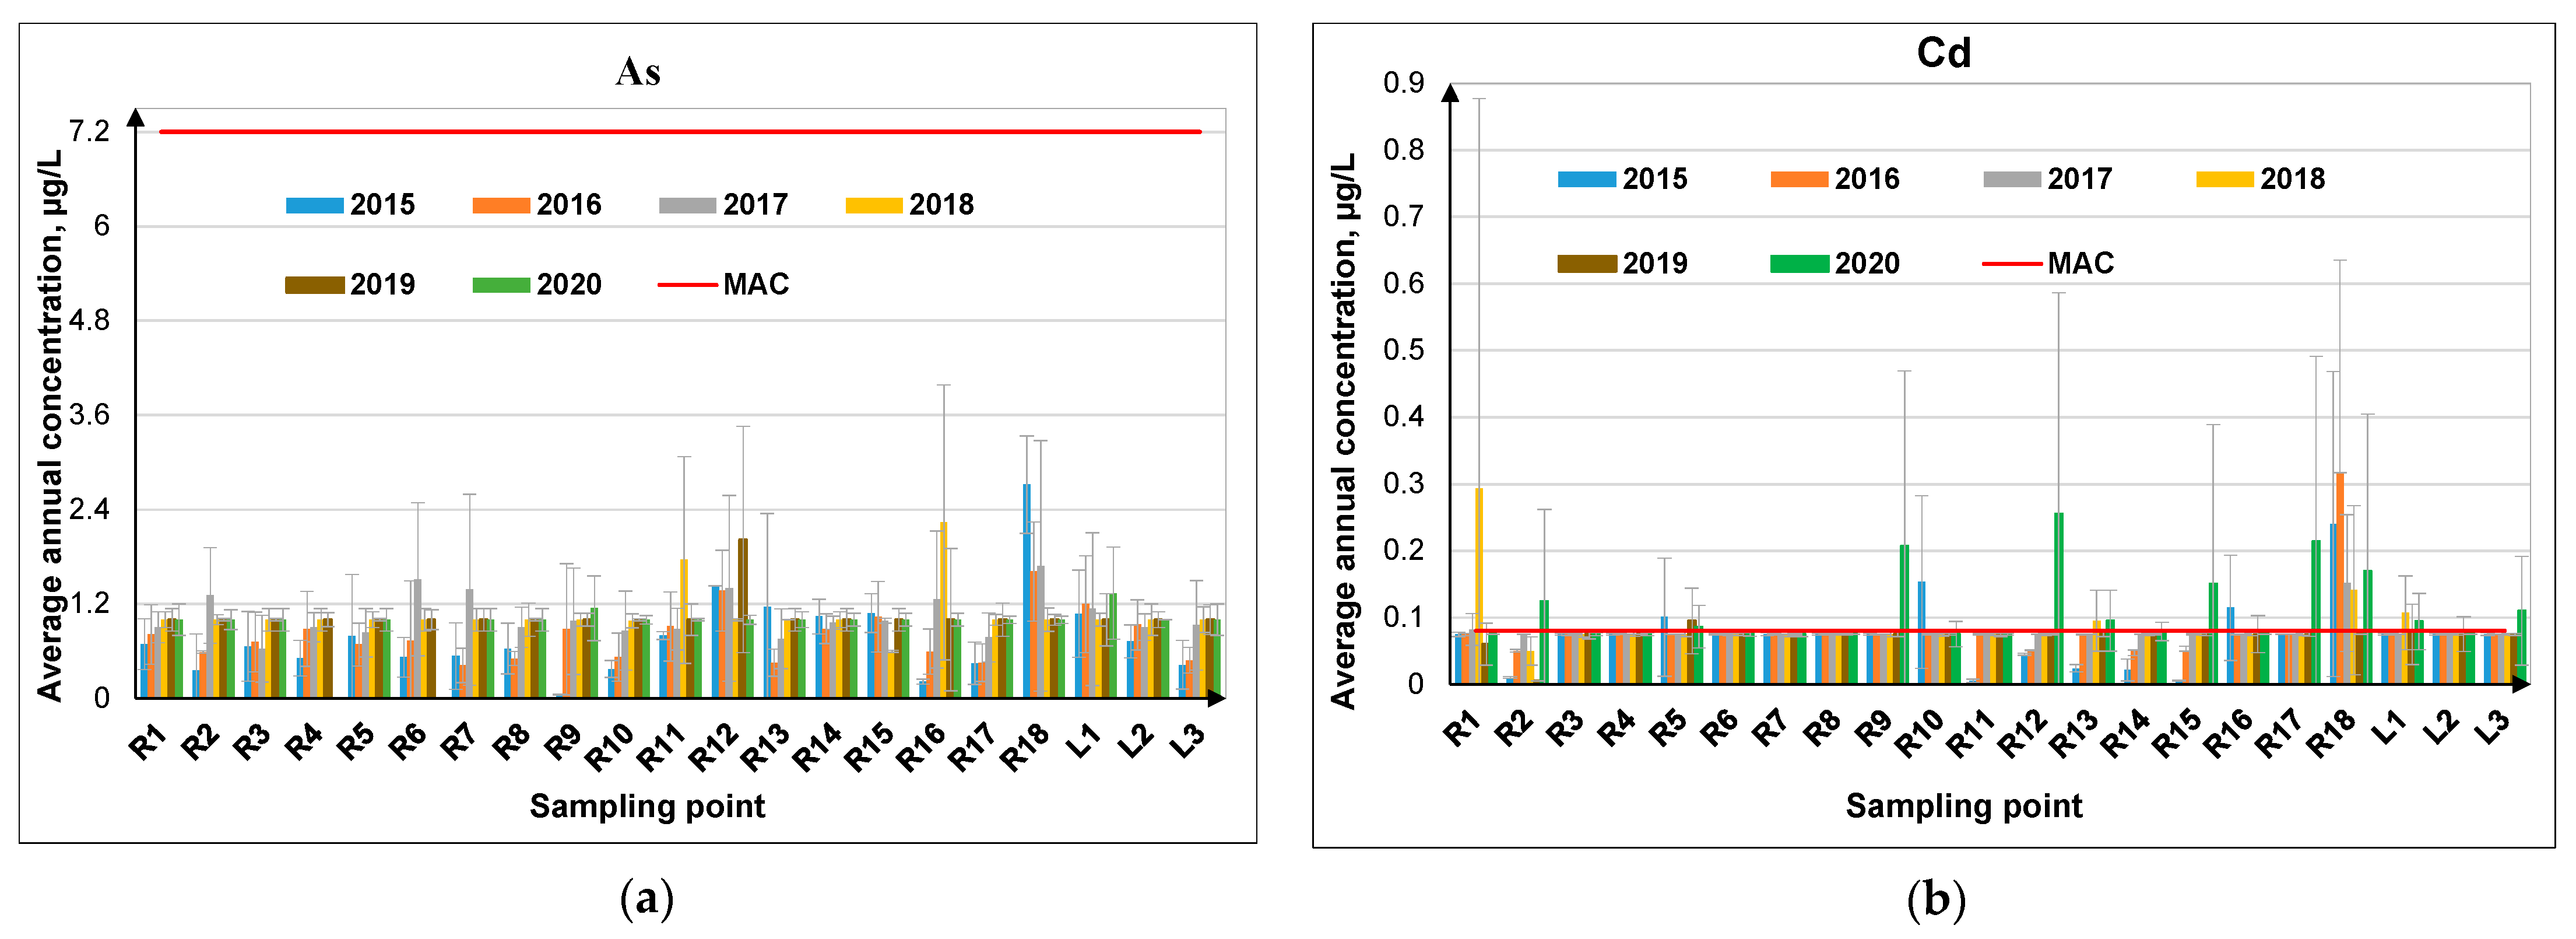
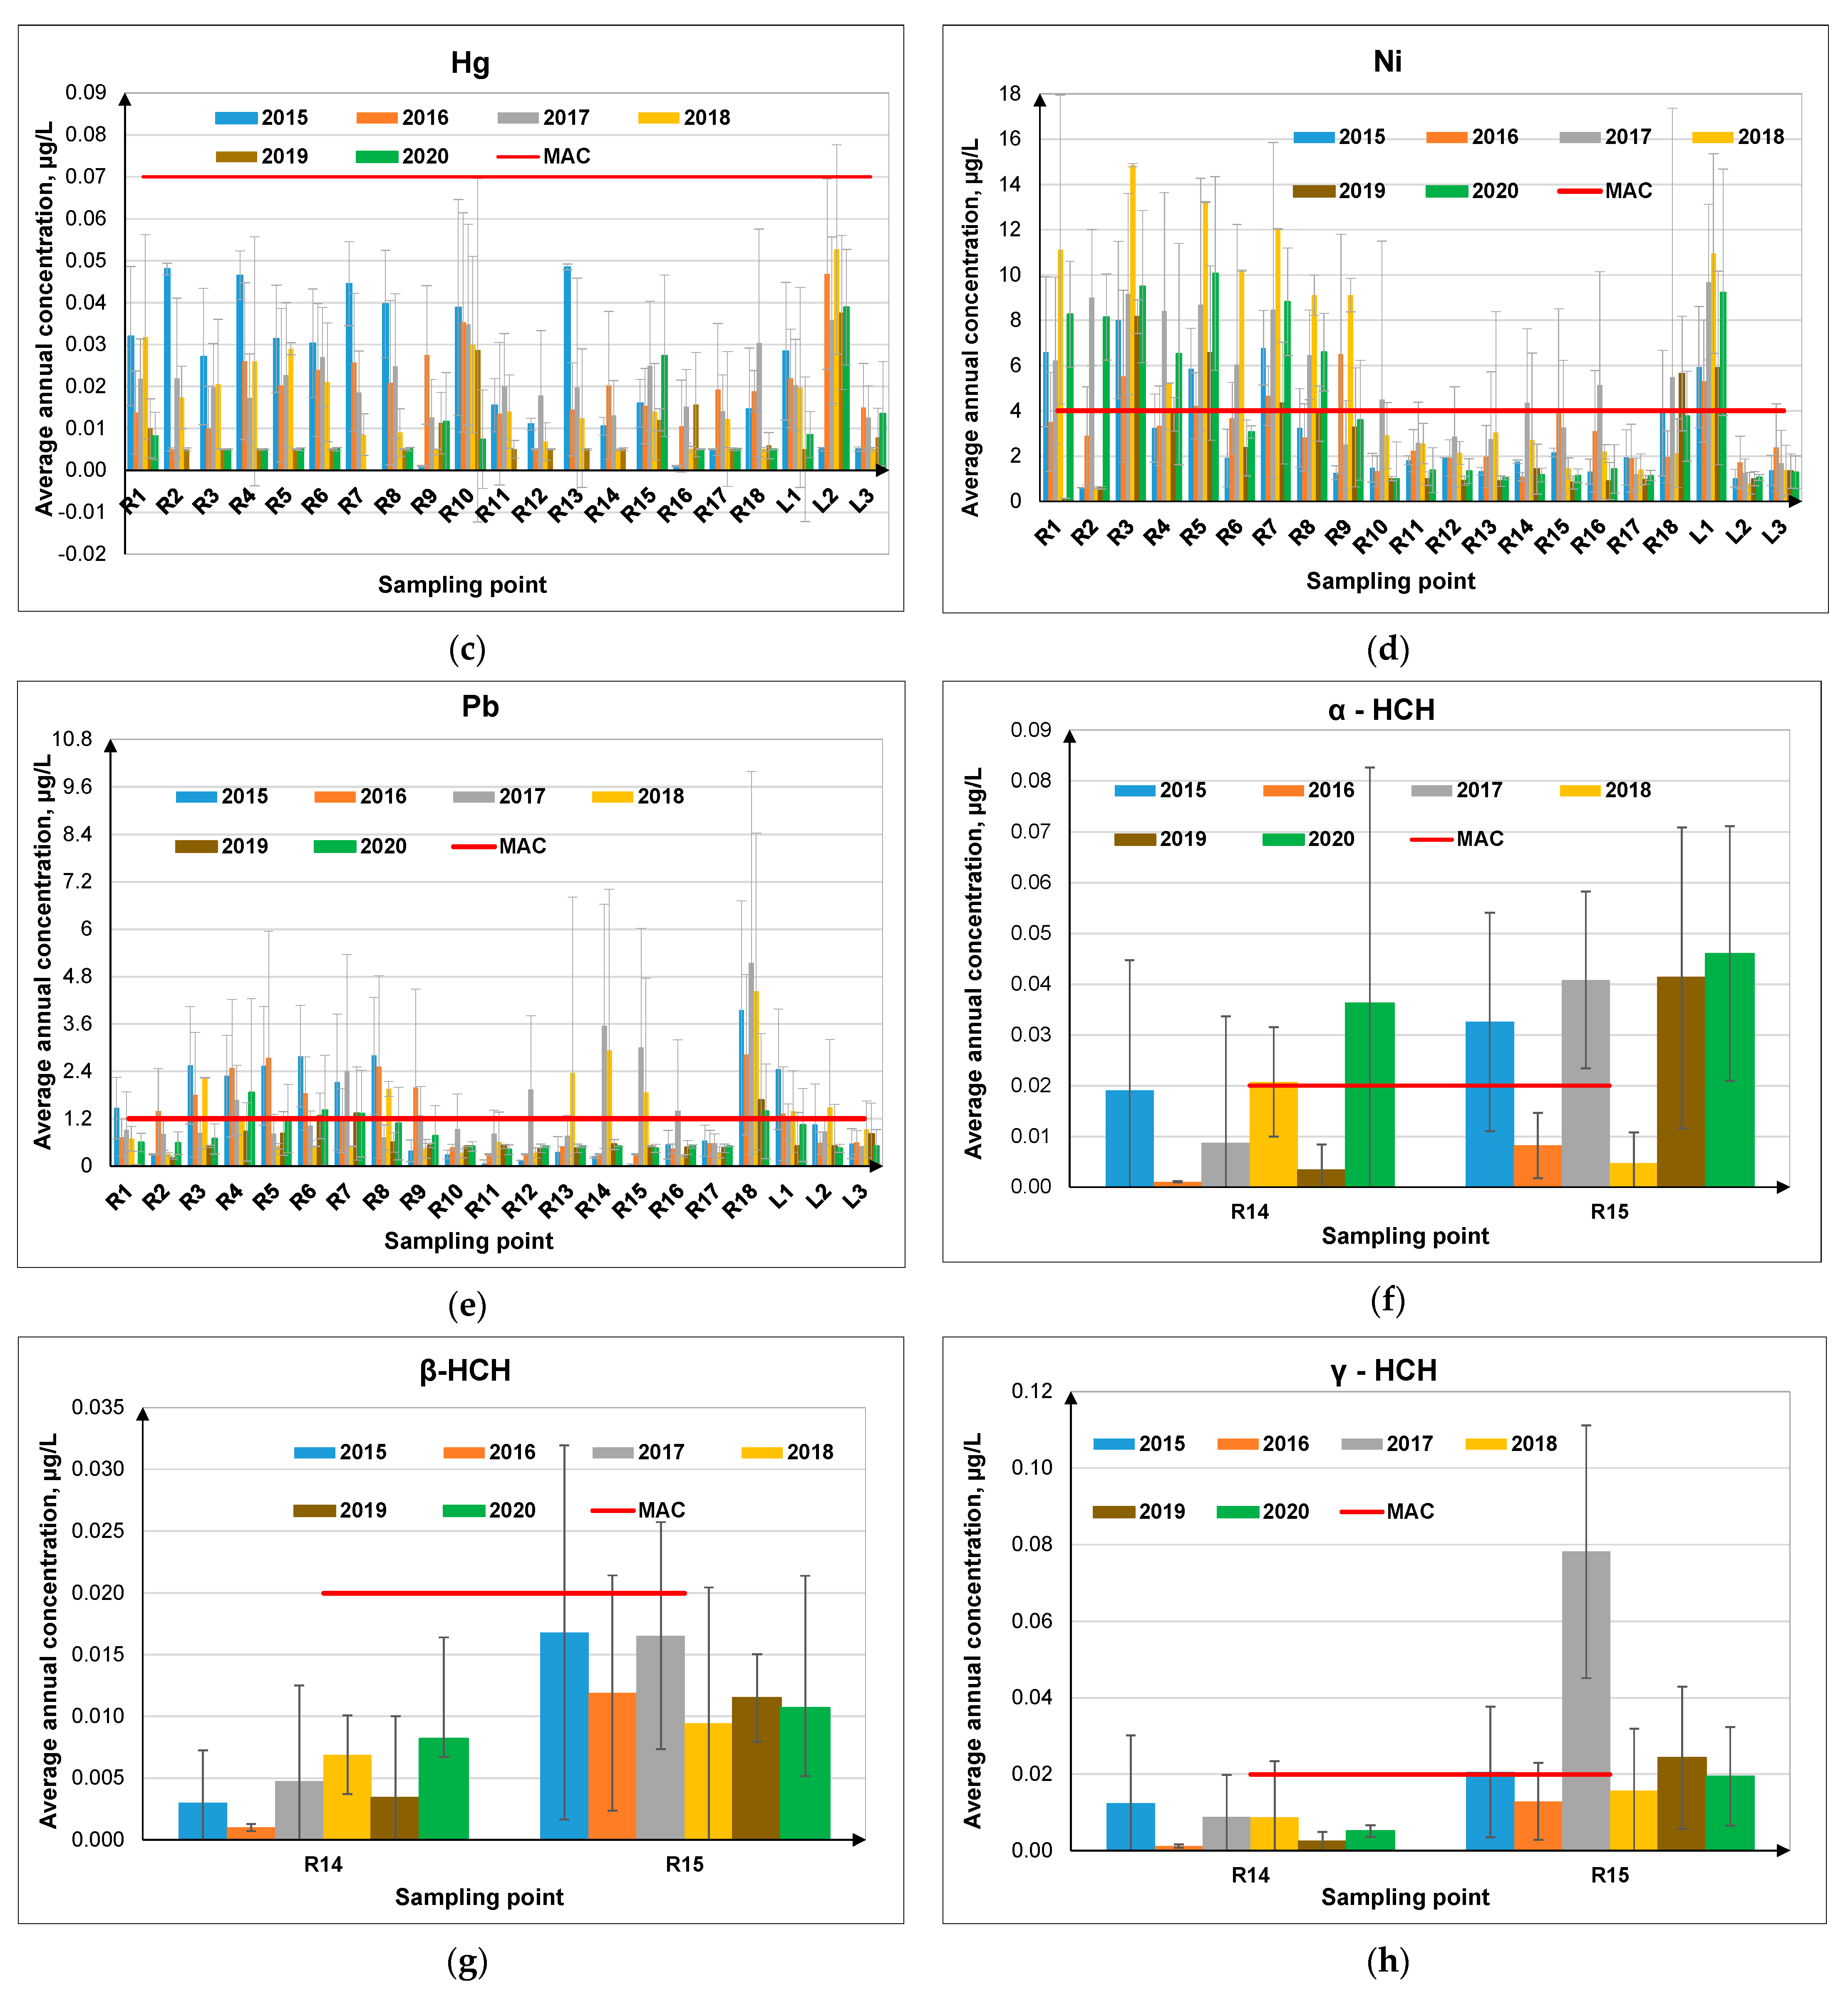
3.1.1. Priority Inorganic Pollutants

Based on the monitoring results expressed as average annual concentrations of heavy metals (As, Cd, Hg, Ni and Pb) measured in the study area, between 2015 and 2020 (Figure 2a–e), it can be observed that the value distribution is different considering the sampling stations, which may be due to variations in physical-chemical parameters in the water column (pH, salinity, redox potential, and concentration of organic ligands), spatial variations (depth or source of contamination), and sampling season. Cd, Ni and Pb had the highest concentration, exceeding the maximum allowed concentration (MAC) in some sampling points. In the case of As (Figure 2a), the average annual concentrations measured in all sampling stations were small and did not exceed the value of MAC (i.e., 7.2 μg/L). The average annual concentrations analyzed in the case of Cd (Figure 2b) show a trend of increased values since 2016, and in almost all monitored stations, the alert threshold (AT) value was exceeded (0.056 μg/L), except for the river sampling points R2, R12, R14 and R15. In 2015, the concentrations recorded for Cd varied from 0.005 ± 0.0028 μg/L in R11 to 0.239 ± 0.228 μg/L in R18 (before the confluence with the Danube River), being higher than the MAC value according to GD 570/2016 [45]. In 2016, the Cd concentration values varied from 0.05± 0.007 μg/L (R2, R12, R14, R15) to 0.318 ± 0.316 μg/L also in R18, as in the case of the previous year. In 2017, in all sections, higher values than AT were registered, and only for R1 the average value exceeded the MAC (0.08 μg/L). The average values of Cd concentrations for 2018 varied from 0.05 ± 0.021 μg/L in section R2 to 0.293 ± 0.584 μg/L in section R1, the value exceeding MAC. In 2019, the only sampling station in which the alert threshold was not exceeded was R2. By 2020, the average Cd concentrations exceeded AT in all sections and the highest values were recorded in 2020.
In the assessment period, the Hg values were, in almost all cases, lower than AT (0.049 μg/L), except for 2015 (Figure 2c) for R13 (0.049 ± 0.0007 μg/L) and in 2018 for L2 (0.0526 ± 0.025 μg/L). Section R13 is a reference sampling point near the source of Trotuș River, and L2 is an accumulation for water abstraction for drinking purposes. In 2018, the Hg concentration exceeded the MAC in L2, considering the standard deviation of the recorded values. The values recorded for Ni exceeded the MAC (4 μg/L) in several sections, over the entire study period (Figure 2d), as follows: R3, R5, and L1. In case of R7, the average concentrations for Ni exceeded the MAC for the years 2016–2020. In 2017, values above MAC were registered in 13 of the monitored sections, and the highest values of the average concentration for Ni were measured in 2018 in nine sections of the 21 monitored.
The values determined for Pb that exceeded the MAC (i.e., 1.2 μg/L) were recorded for the following sampling points: in 2015, for R1, R3, R5, R6, R8, R18, and L1; in 2016, for R2–R6, R8, R9, R18, and L1; in 2017, for R4, R7, R9, R12, R14–R16, R18, and L1; in 2018, for R3, R8, R13–R15, R18, L1, and L2; in 2019, for R7 and R18; in 2020, for R4–R7 and R18. As can be seen in Figure 2e, the Pb concentration exceeded the MAC in 2016 in nine section points, the main pollution sources being the chemical companies and industrial platform located nearby. Among the analyzed metals, Ni and Pb recorded significantly higher average annual concentrations, which exceeded the MAC in some of the sampling points. A possible cause may be due to municipal and industrial wastewaters, waste, precipitation, mining activities, and runoff water from agricultural activities.
In the case of heavy metals, it can be observed as a residual pollution, with long-term effects. Residues of these substances accumulate in soils, waters, and vegetal products and are found after decades or even more. For a river, water quality is the result of several independent parameters with local and temporal variations that are also influenced by the water flow.

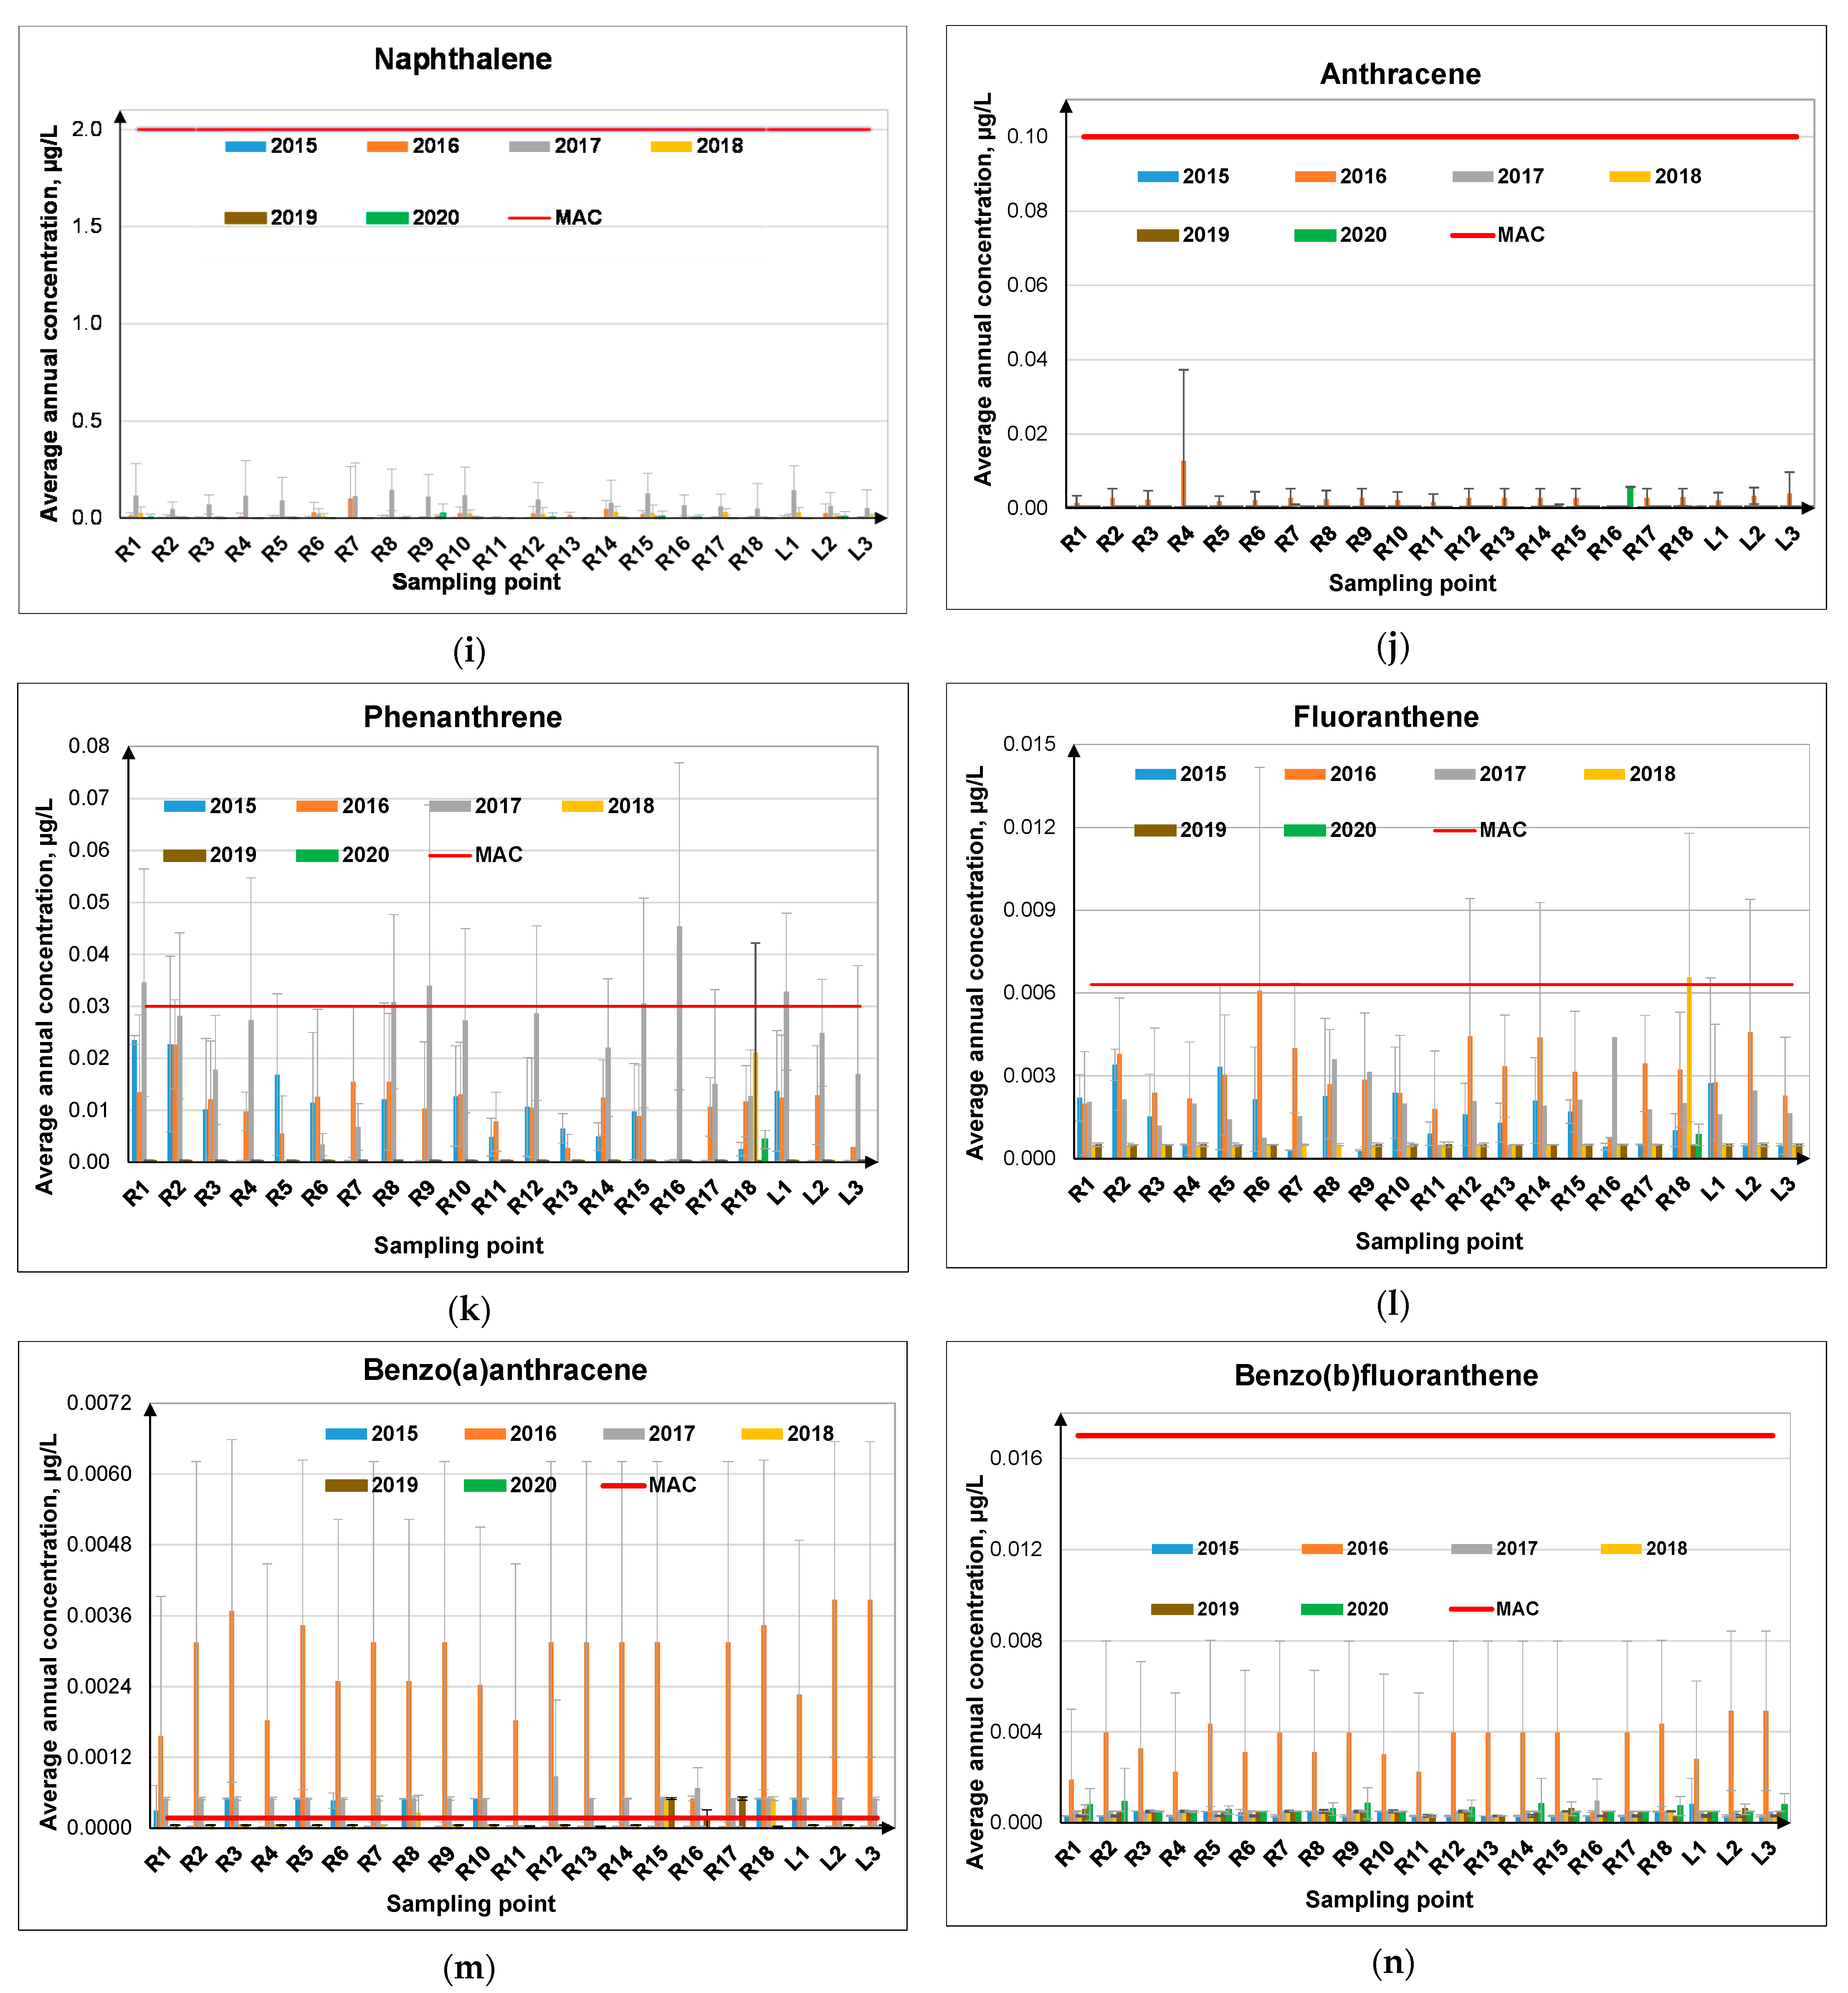
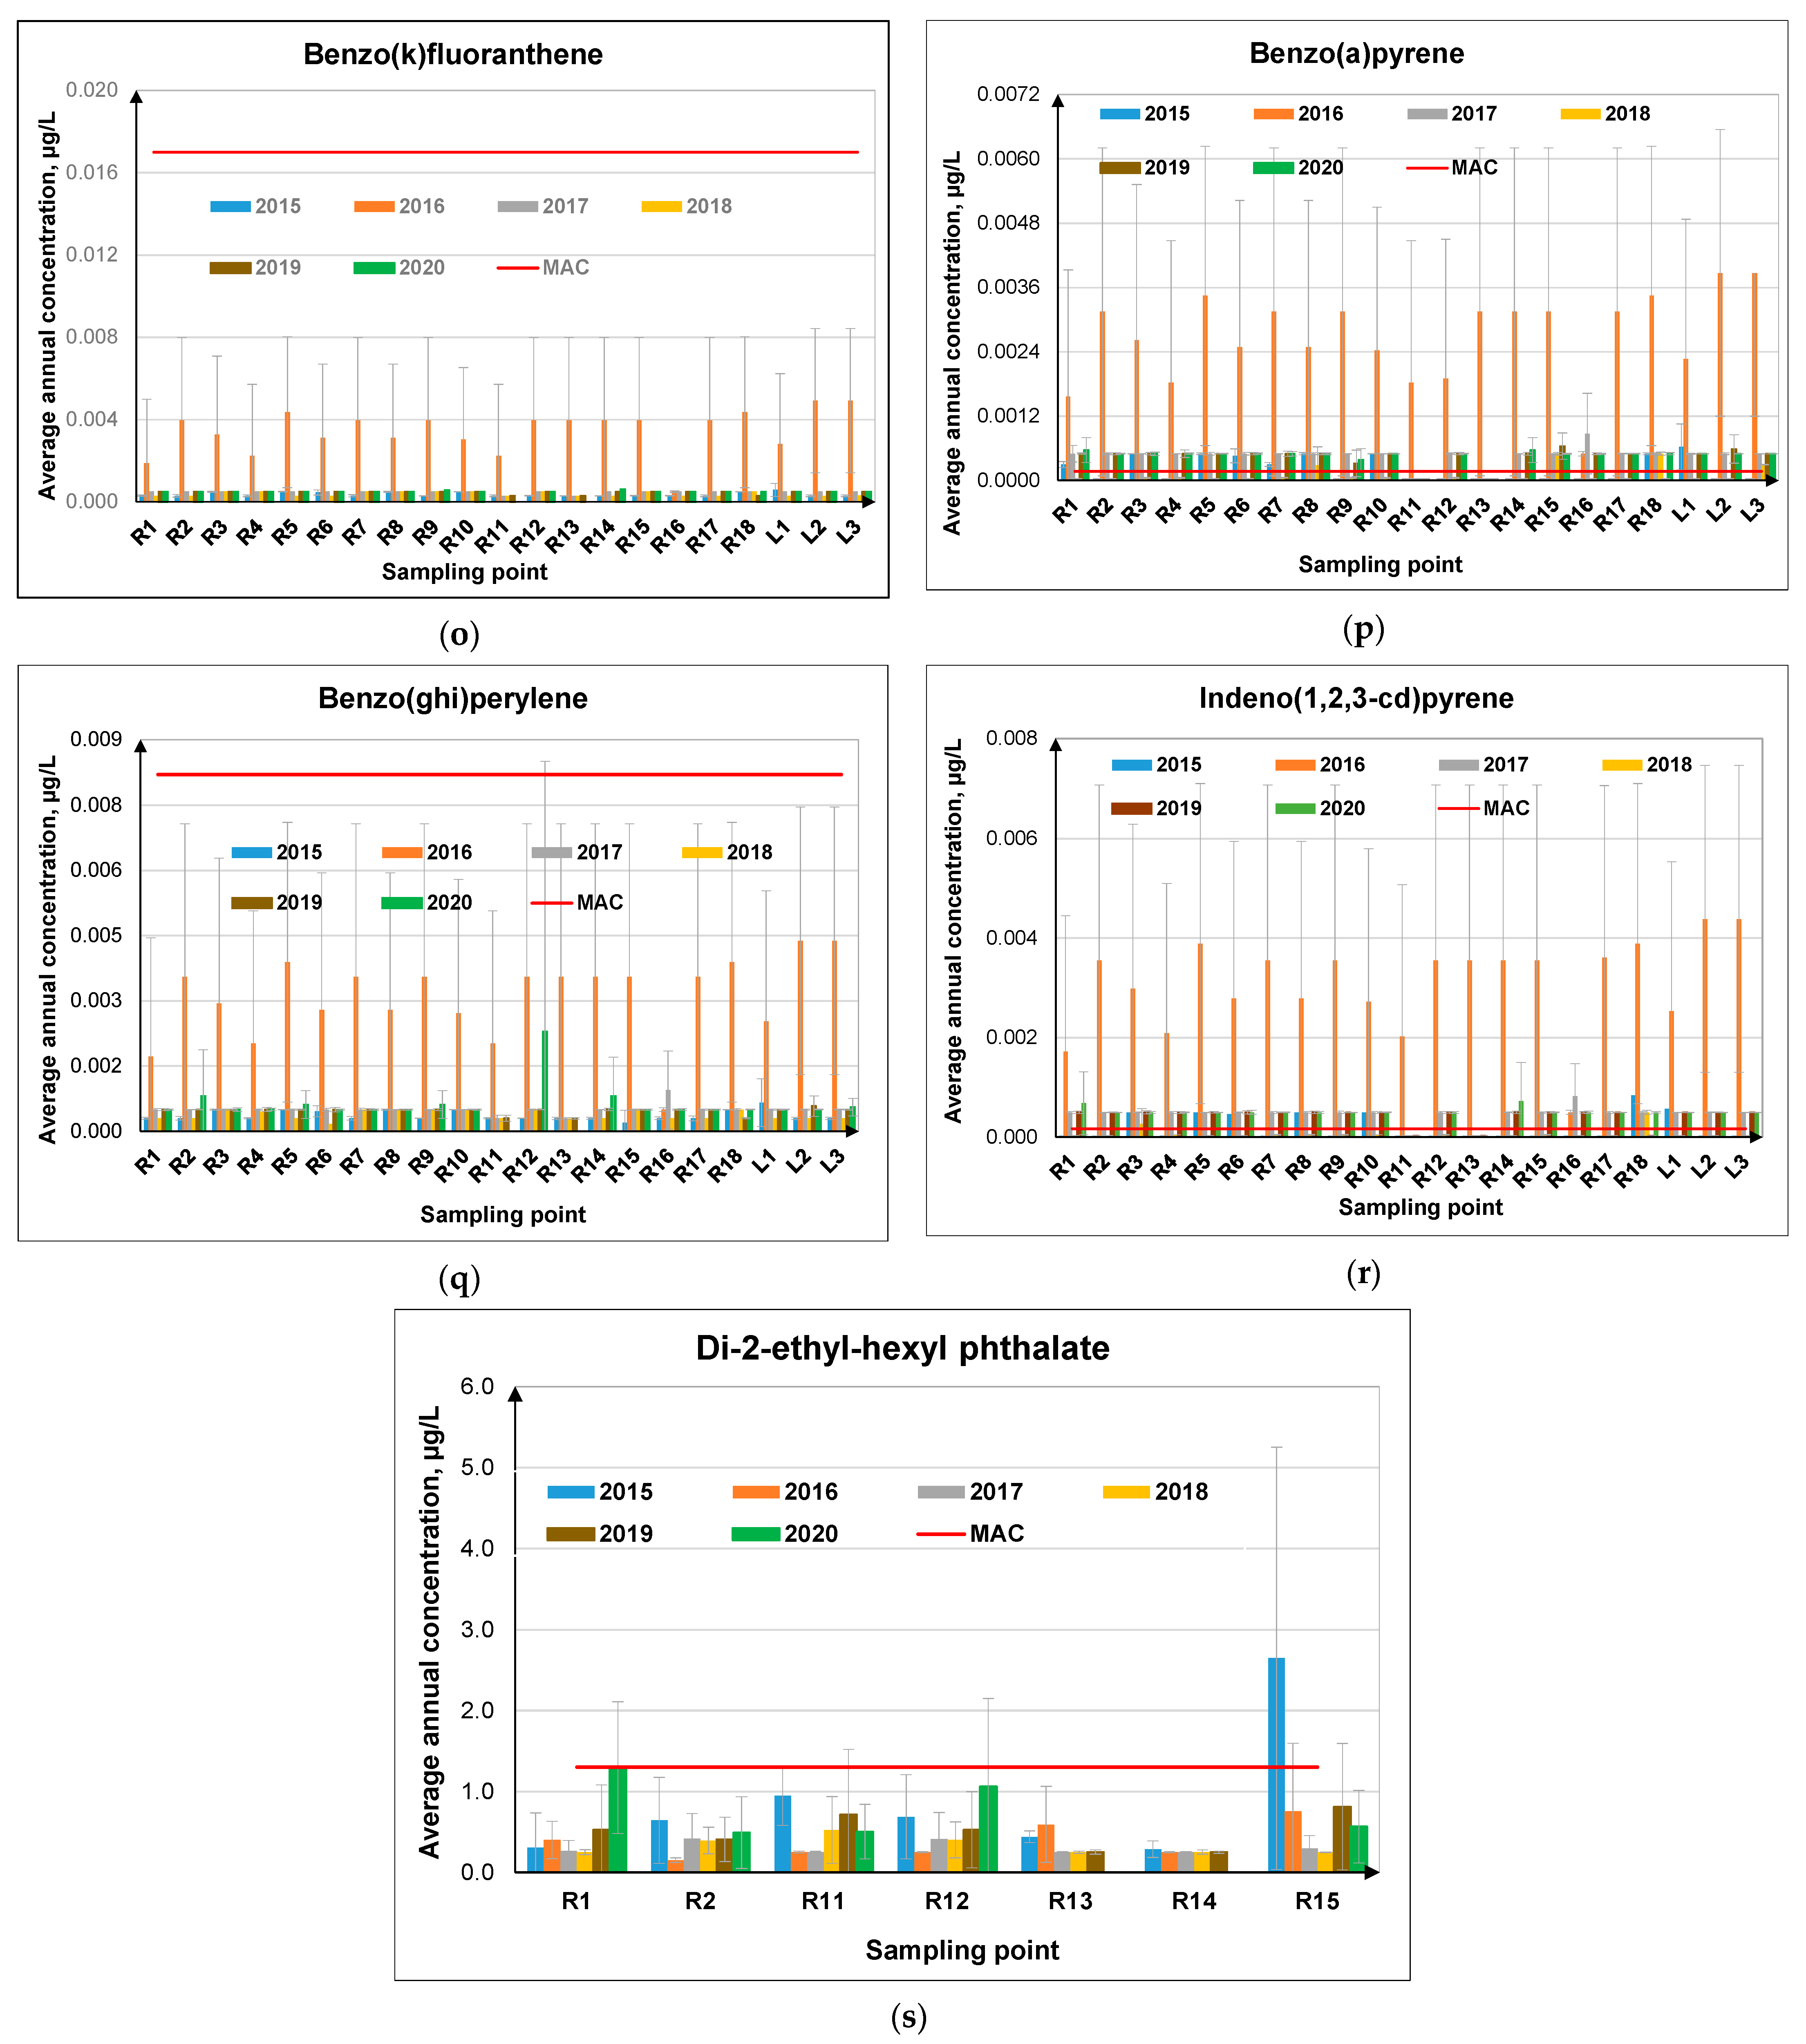
3.1.2. Priority Organic Pollutants

A wide variety of priority pollutants are present in river water, including polycyclic aromatic hydrocarbons, organochlorine pesticides, and phthalic esters. The priority organic pollutants monitored in this study are classified as persistent according to the Stockholm Convention: naphthalene, phenanthrene, fluoranthene, benzo(a)pyrene, benzo(b)fluoranthene, benzo(k)fluoranthene, benzo(ghi)perylene, and DEHP. Among the priority pollutants, organochlorine pesticides residues from the hexachlorocylohexane isomer category (α-HCH, β-HCH, γ-HCH—lindane) were identified. Relevant concentrations were obtained in two of the monitored sections in the Siret River basin between 2015 and 2020, namely R14 and R15 (Figure 2f–h).
Values of mean concentrations for α-HCH higher than MAC (0.02 μg/L) were re-corded in section R14 in 2018 (0.02074 ± 0.01078 μg/L) and 2020 (0.03621 ± 0.04639 μg/L), and in R15 in the following years: 2015 (0.03255 ± 0.02157 μg/L), 2017 (0.04084 ± 0.01745 μg/L), 2019 (0.04126 ± 0.02962 µg/L) and 2020 (0.04602 ± 0.02511 μg/L). In the case of β-HCH, the recorded values in the study period were lower than MAC. In sampling station R15, considering the standard deviation of the mean values, the concentration of this pollutant was higher than in R14, exceeding MAC (0.02 μg/L), with the exception of 2017.
In the case of lindane (γ-HCH), the values of the average concentrations exceeded the MAC for R15 in 2015 (0.02060 ± 0.01711 μg/L), in 2017 (0.07817 ± 0.03303 μg/L) and in 2019 (0.02429 ± 0.01856 μg/L). Meanwhile, in 2018 and 2020 they exceeded the value of 0.014 μg/L, corresponding to AT. For R14, the values exceeded the MAC in 2015, 2017, and 2018 considering the standard deviation of the analyzed concentrations. These two sections are downstream of the chemical industrial platform. Hexachlorocyclohexane stereoisomers have been widely used as plant insecticides (including those produced in greenhouses) for treating fruits, seeds, and wood products. All isomers are toxic to animals to varying degrees and are persistent in the environment. Lindane (γ-HCH) was also used as a medicine (1% concentration) in the composition of lotions, creams, shampoos [61].
PAHs were identified in all sections in the period studied. The values for naphthalene (Figure 2i) were lower than the MAC (2 μg/L) in all monitored sections during 2015–2020. In 2017, naphthalene falls within normal limits, but with higher values than in other years. The highest average was registered in R8 (0.1466 ± 0.1064 μg/L).
For anthracene, all values of average concentrations recorded (Figure 2j) did not exceed the MAC value (0.1 μg/L). The highest values were observed in 2016. The highest anthracene concentration was determined for the sampling station R4, i.e., 0.01275 ± 0.0245 μg/L.
Regarding phenanthrene, the average concentrations exceeded MAC (0.03μg/L) only in 2017 for the sections: R1, R8, R9, R15, R16, and L1 (Figure 2k). Some values higher than MAC were recorded in 2015 for R2, R5, R8; in 2016 for R2 and in 2018 for R18.
The highest concentration for fluoranthene, which exceeded the MAC value (0.0063 μg/L), was found in the section R18 (0.00657 ± 0.00523 μg/L), in 2018. The level of AT = 0.044 µg/L) was exceeded in 2016 in the case of fluoranthene in four sections: R6 (0.00608 ± 0.00808 µg/L), R12 (0.00444 ± 0.00499 μg/L), R14 (0.0044 ± 0.0049 μg/L), and L2 (0.00458 ± 0.00481µg/L) (Figure 2l).
For benzo(a)anthracene, it can be observed (Figure 2m) that the concentration was exceeding MAC in 2015 (R1, R3, R5, R6, R8, R10, R18, L1), 2016 (all sampling points), 2017 (all sections except R11), 2018 (R8, R15, R18), and 2019 (R15, R16, R17).
Benzo(a)pyrene recorded values higher than MAC (0.00017 μg/L) in 2016 and 2020, in all sections. In 2015, higher values were measured in R1, R3, R5–R8, R10, R18, L1; in 2017 in all sections except R11 and R13. In 2018, higher values were observed in R8, R15, R18 and L3 (Figure 2p). One of the most dangerous PAHs is benzo(a)pyrene due to its toxicity. Benzo(a)pyrene can be considered a marker for other polycyclic aromatic hydrocarbons, so only benzo(a)pyrene should be monitored according to HG570/2016 [45] for comparison with the corresponding MAC for water.
The values recorded in the period 2015–2020 in the surface waters of the Siret River basin were lower than the MAC values (0.017μg/L) for benzo(b)fluoranthene (Figure 2n), benzo(k)fluoranthene (Figure 2o), and for benzo(ghi)perylene (Figure 2q). One exception was observed in the case of benzo(ghi)perylene in 2020 when some values were higher than the MAC (0.02292± 0.0062 μg/L).
Indeno(1,2,3-cd)pyrene presented values higher than MAC (0.00017 μg/L) in all sections in 2016, 2017 (except R11 and R13) and 2020. In 2018, higher values were observed in R3 and R18. The smallest values were determined in R11 and R13, for all periods except 2016 (Figure 2r). In 2020, PAHs were not measured for R11 and R13.
The values of the average PAHs concentrations recorded in 2016 were the highest as compared to the other years, being predominant in most samples. PAHs can accumulate in sediments, can be adsorbed onto suspended particles [62,63,64], can be transported over long distances, and in hydrodynamic conditions (leaks from slopes, floods, precipitation) can reach the water mass again.
The values of DEHP (Figure 2s) recorded in section R15 exceeds MAC (1.3 μg/L). If we take into consideration the standard deviation of the recorded values, it can be observed that the legislative limit was exceeded as follows: for R11 (0.9495± 0.3684 μg/L) and R15 (2.645 ± 2.6092 μg/L) in 2015; for R11 (0.25 ± 0.01066 μg/L) and R15 (0.29611 ± 0.15972 μg/L) in 2017; and for R1 (1.294 ± 0.815μg/L) and R12 (1.06017 ± 1.09043 μg/L) in 2020.
The number of water bodies with good quality status increased in the last year as compared to 2015, respectively, from 80% in 2015 to 93% in 2021. Overall, the water quality has improved in 2020 as compared to the previous years, with the exception of some pollutants, such as cadmium, nickel, indeno(1,2,3-cd)pyrene, benzo(a)pyrene, α-HCH and β HCH, di-2-ethyl-hexyl-phthalate. It can be observed that the water quality in the studied area is relatively low in the sampling points that are located nearby the locations where agricultural and industrial activities take place. Even so, the observed trend is a decreasing in the pollution level, so that the good water status for all water bodies may be achieved by 2027, as stated by the Danube River master plan.

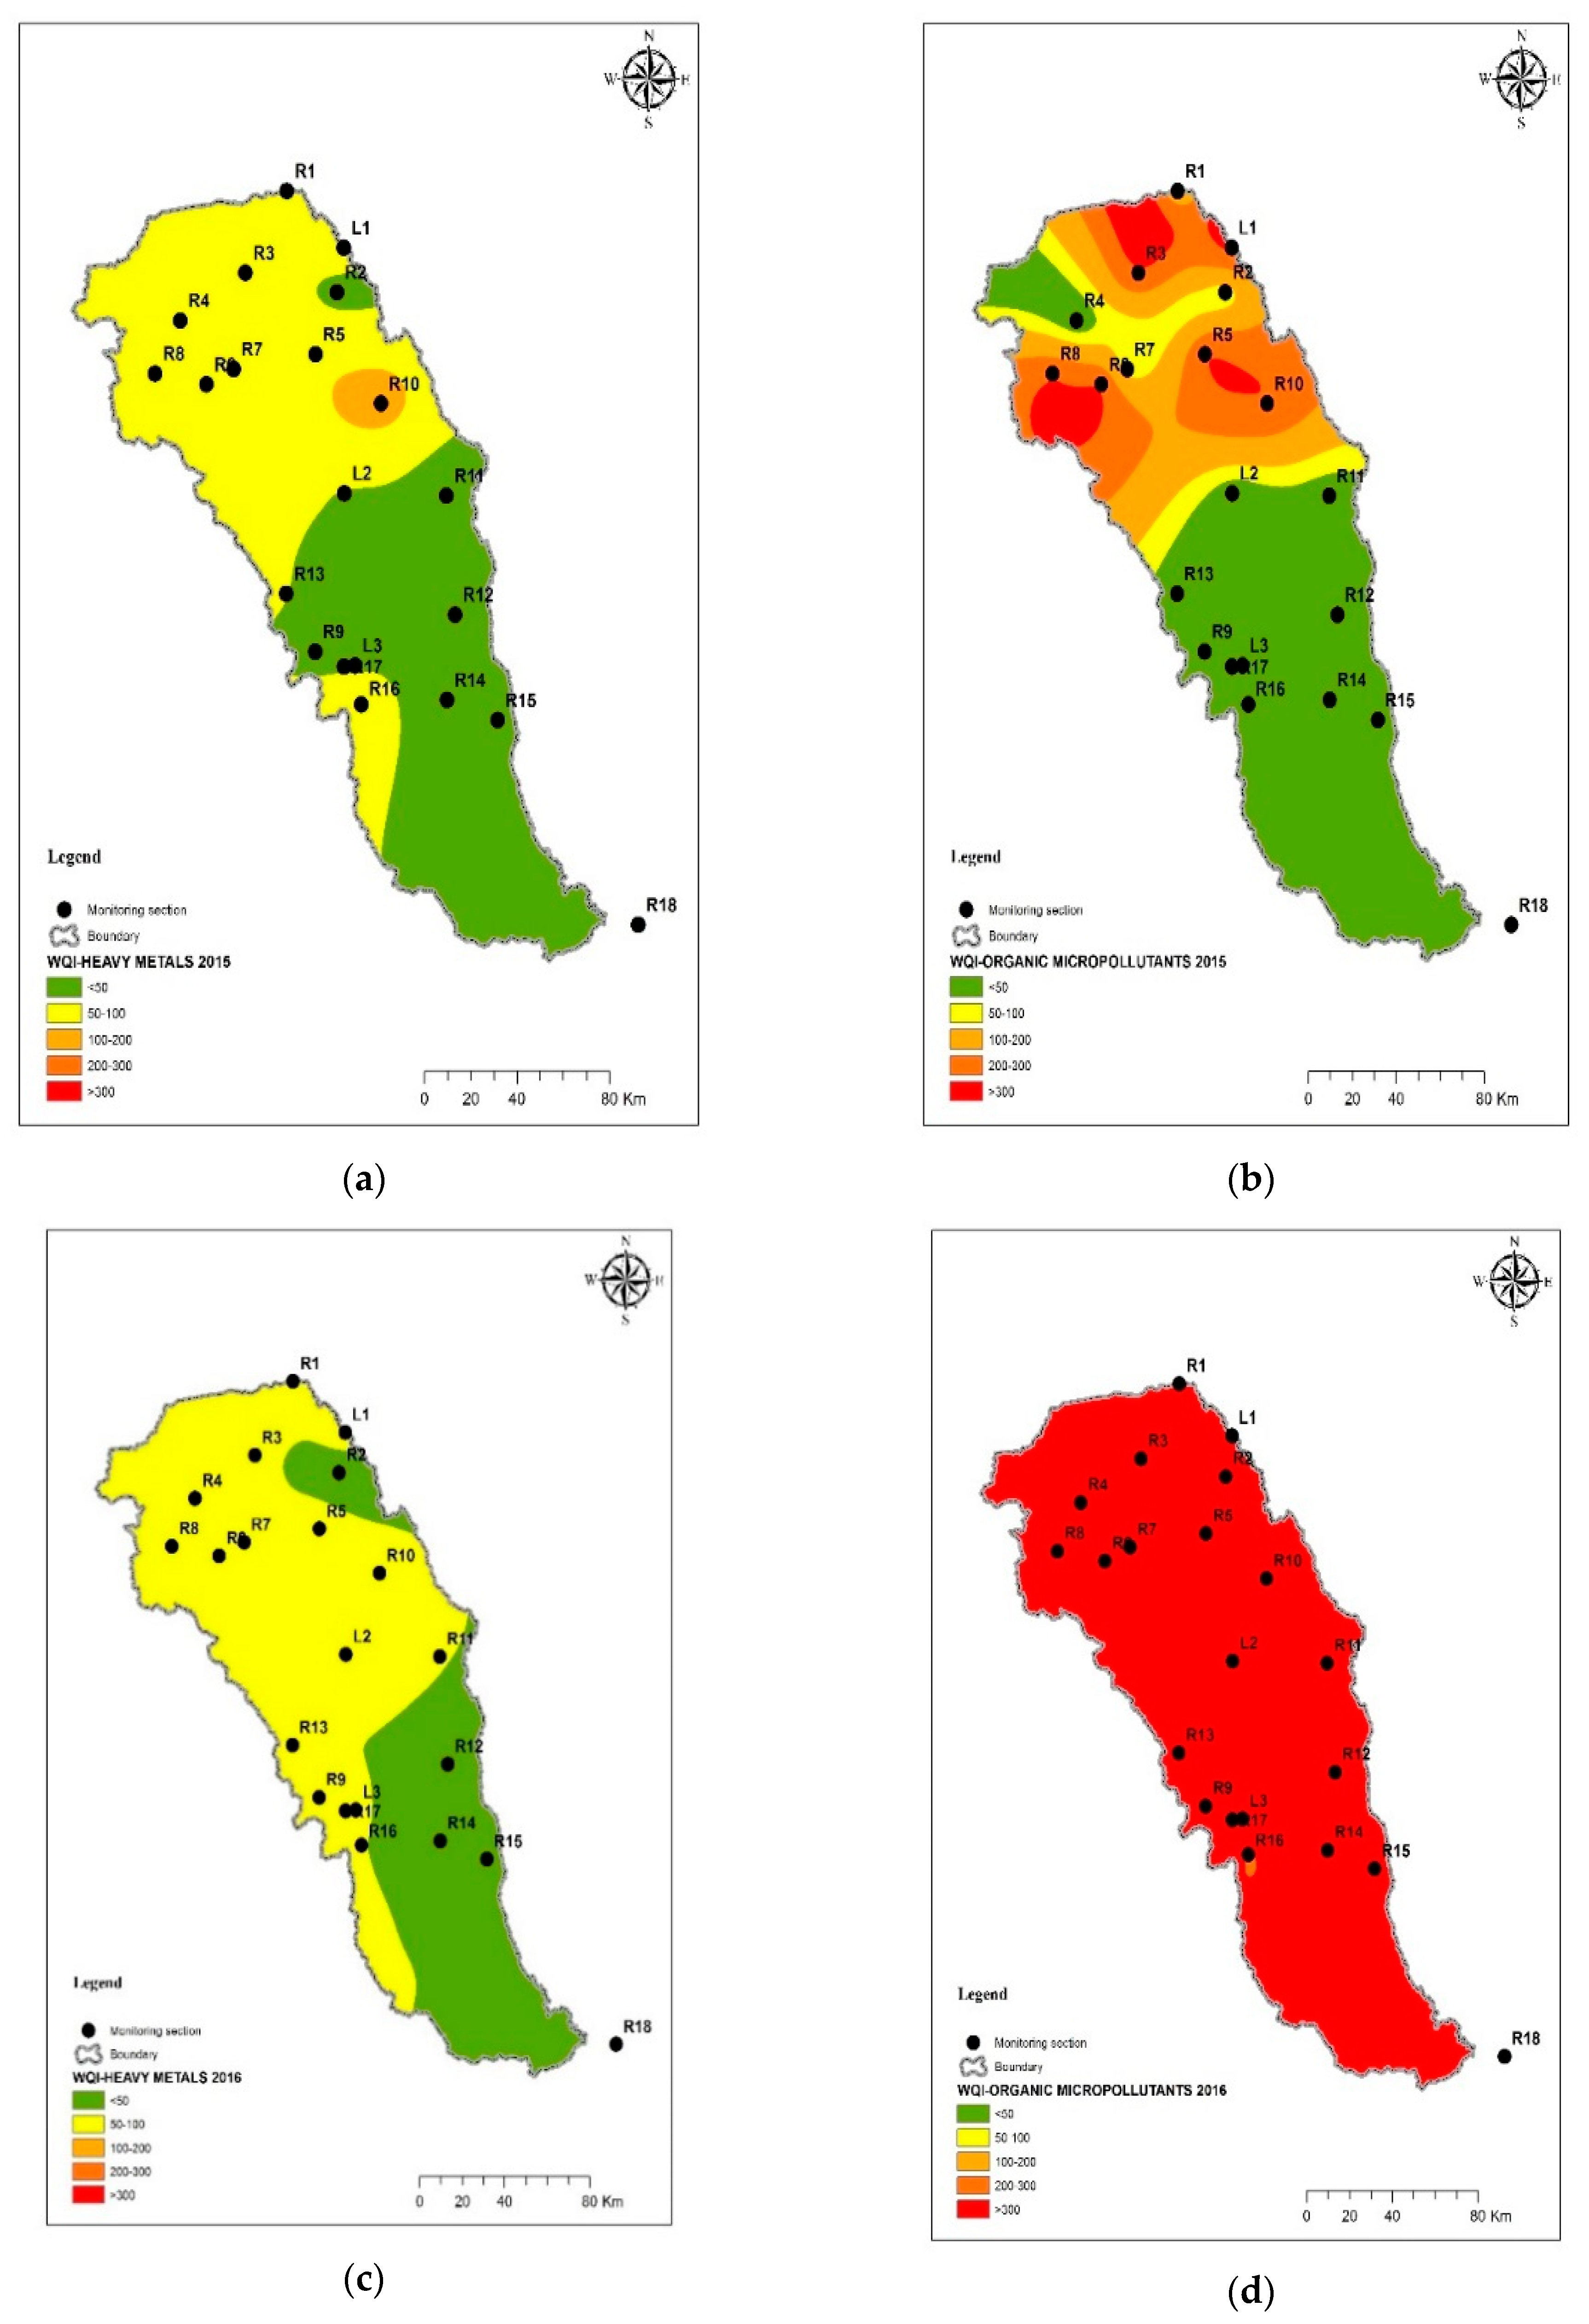
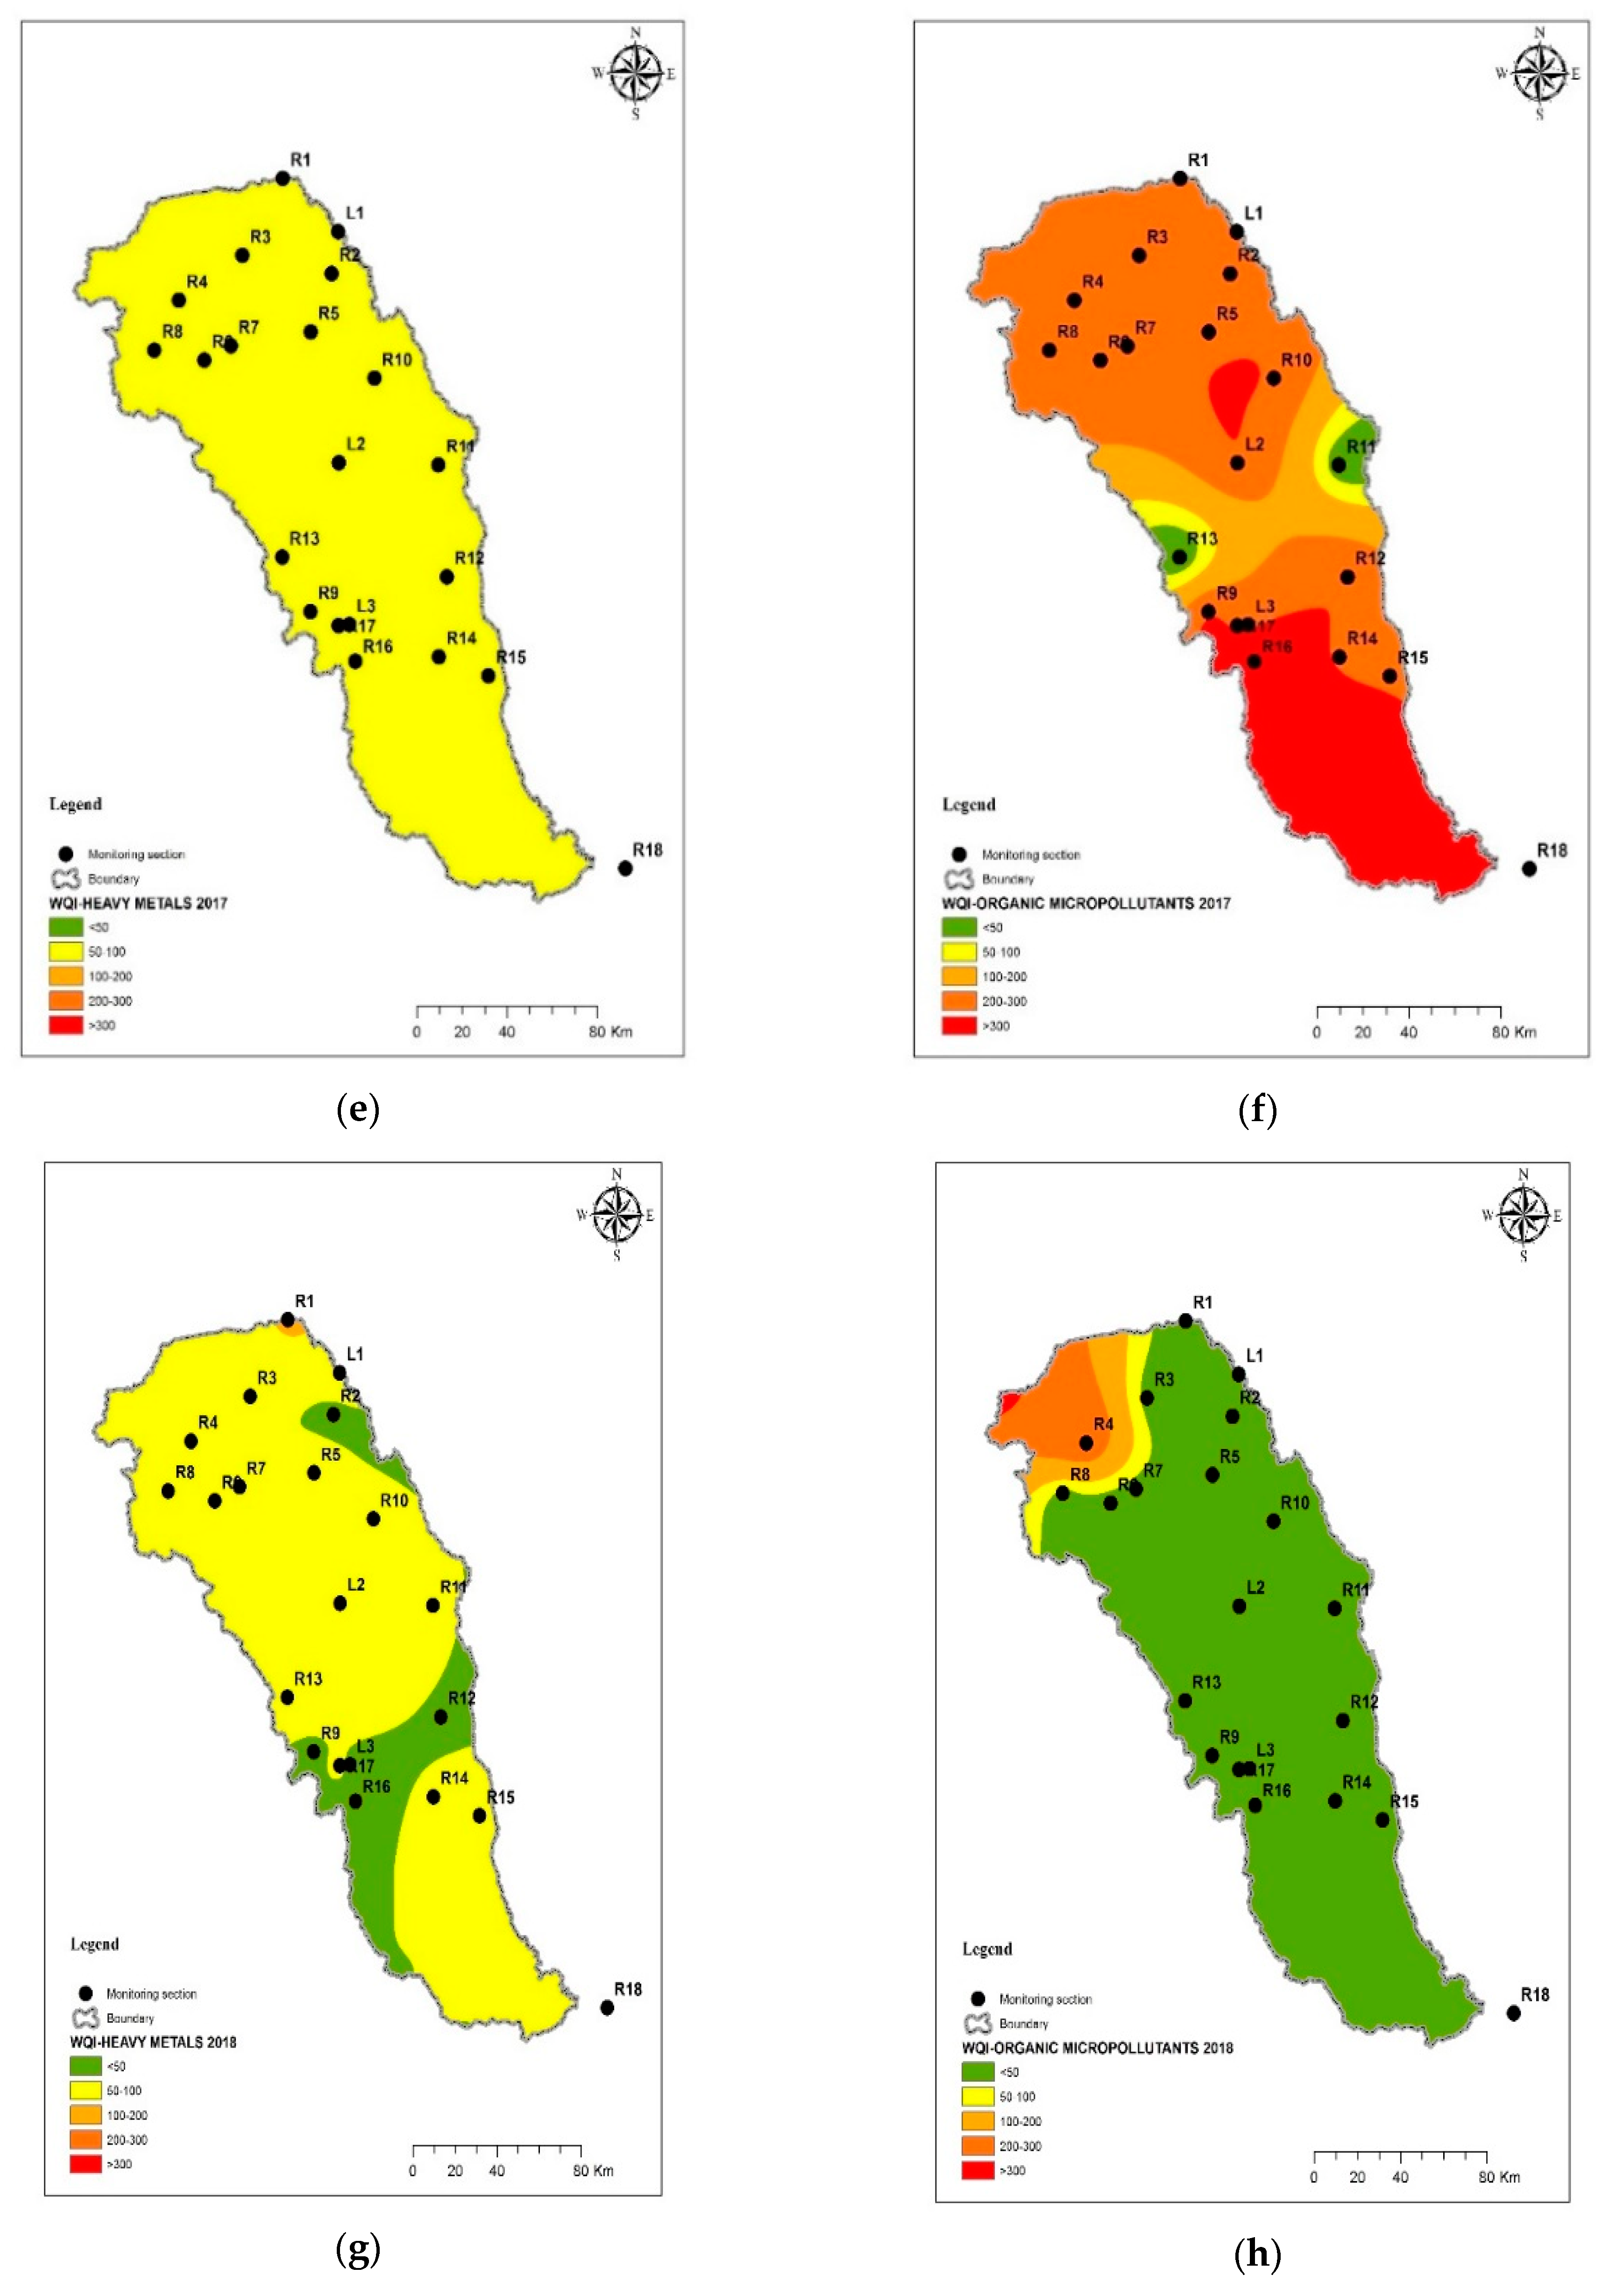
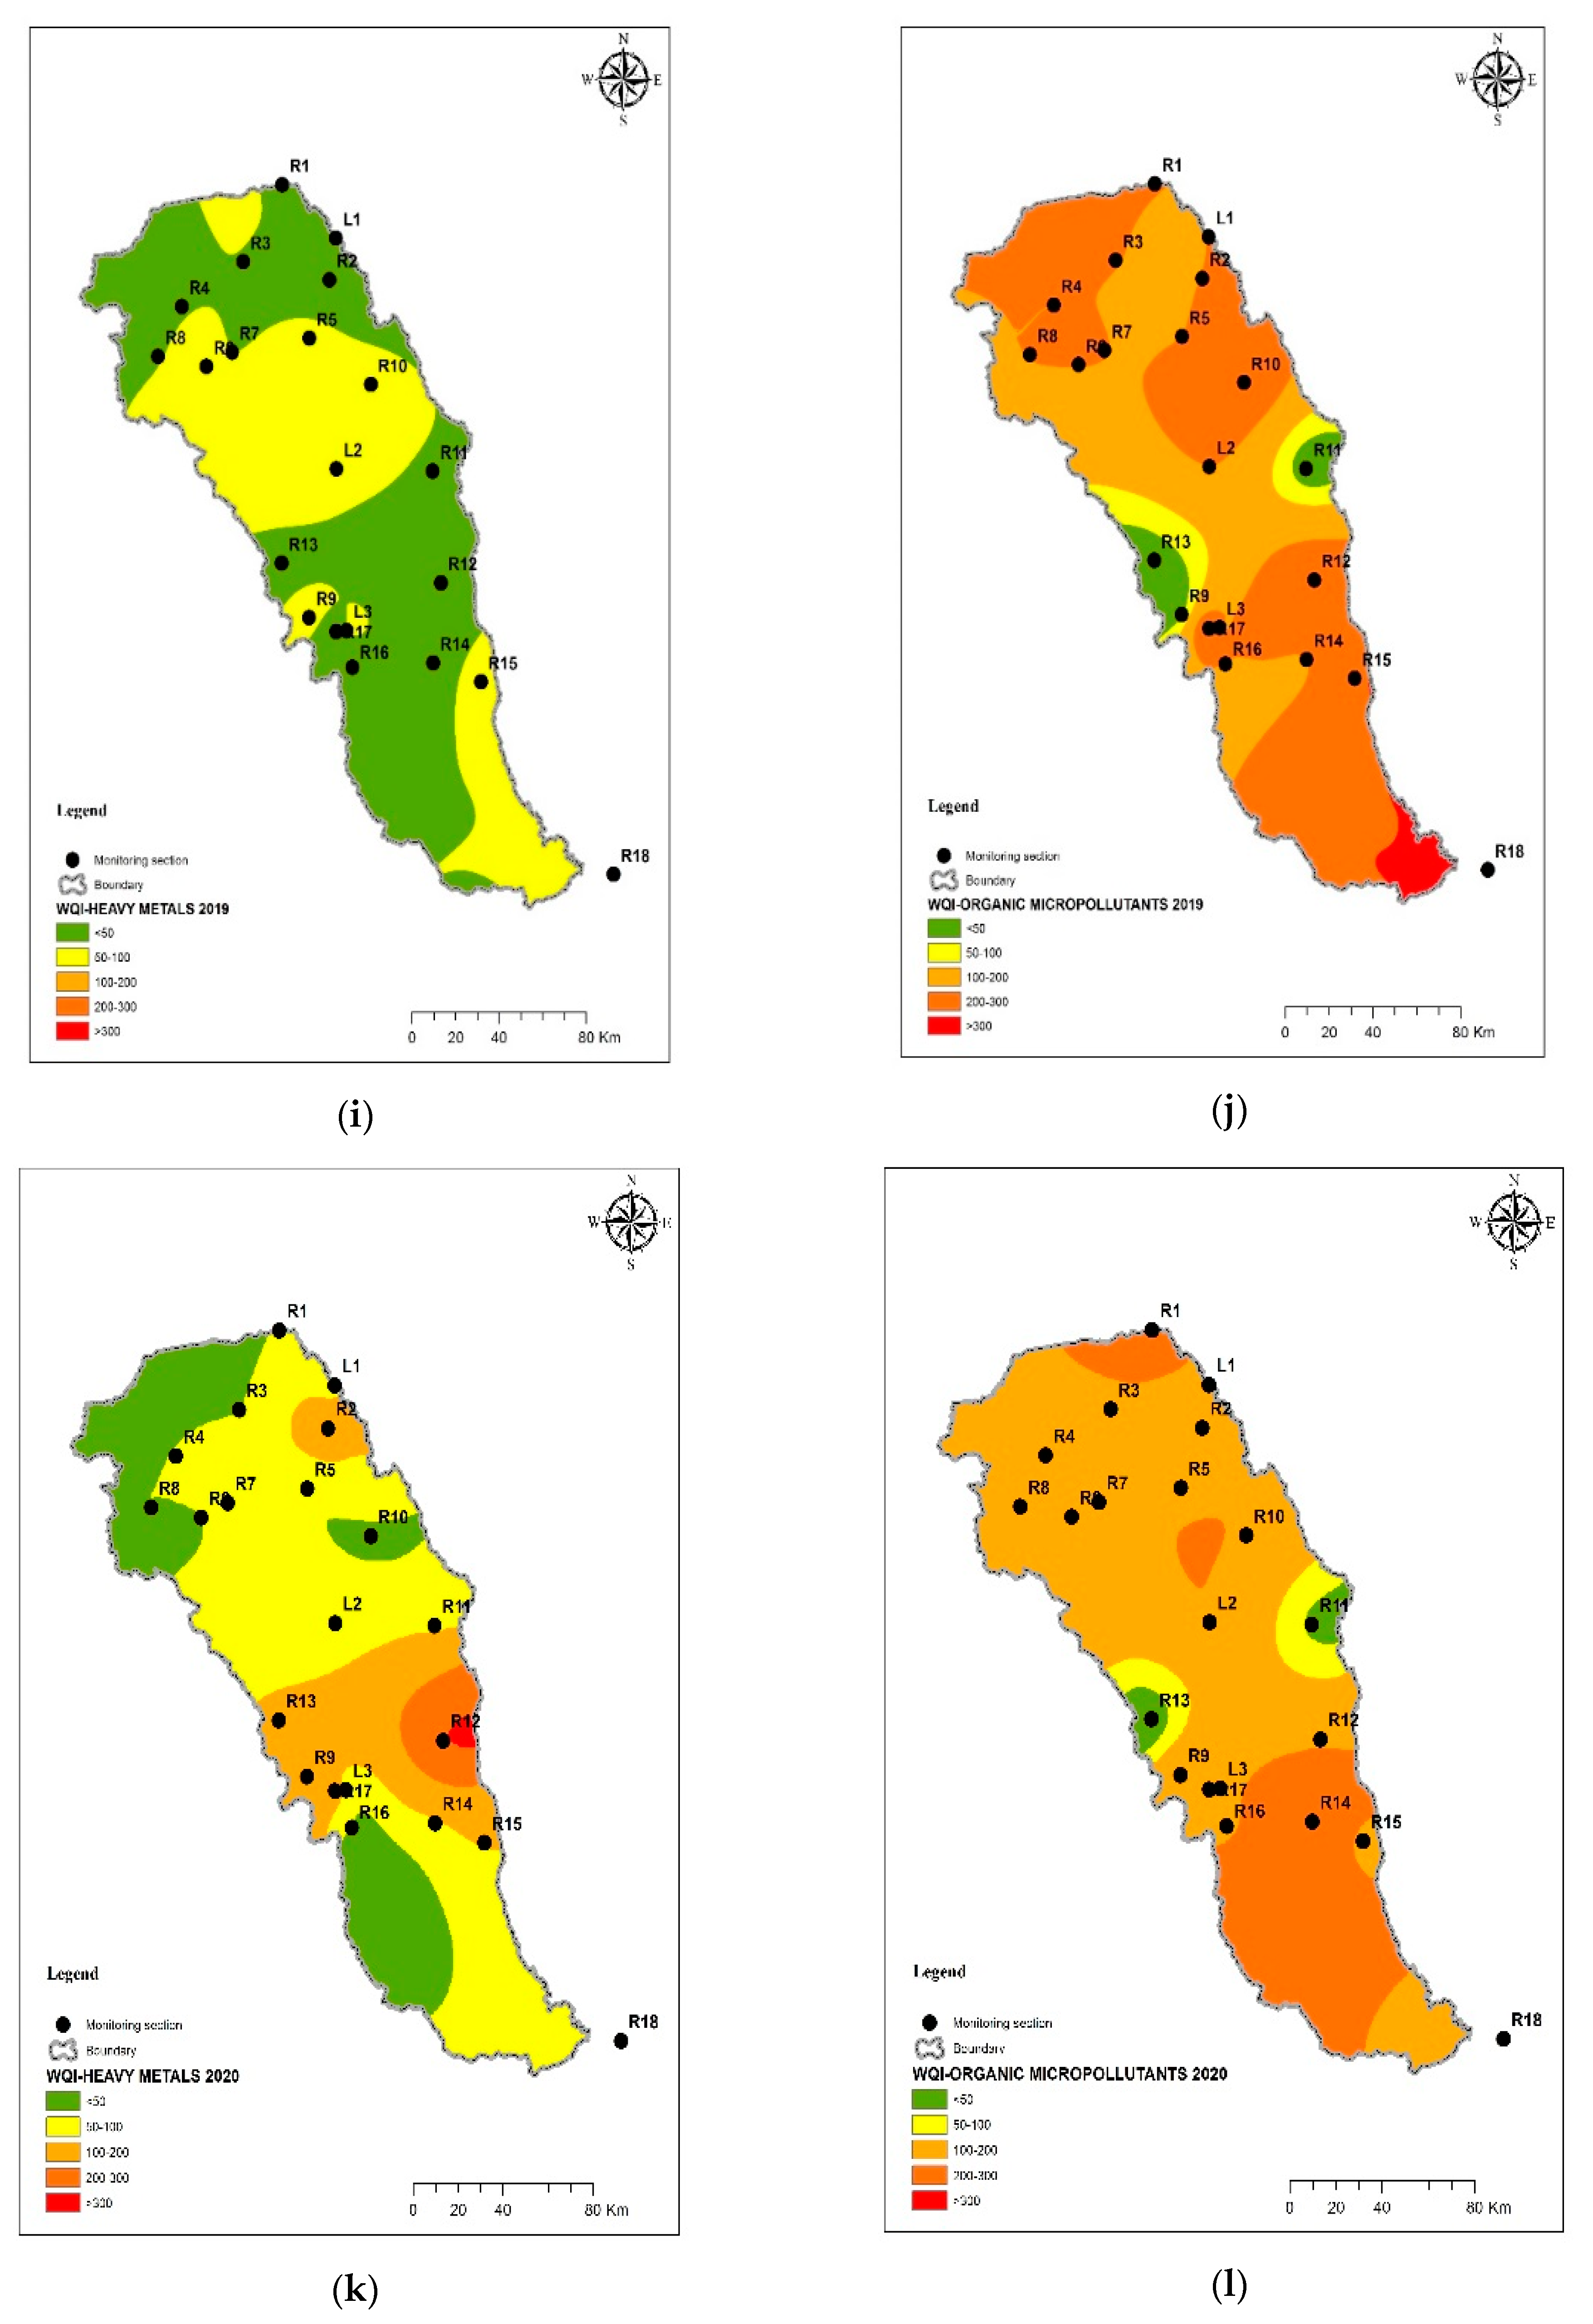
3.2. Water Quality Assessment

In this section, the water quality of Siret River basin is discussed by using the water quality index results, determined by considering all the identified priority pollutants (heavy metals and organic micropollutants). An important part of any environmental monitoring program is the results presentation. In the case of water quality monitoring, it is useful to use a method to reduce the complexity associated with numerous measurement variables. The WQI index will mathematically combine all water quality parameters and provide a general and rapid assessment. The results obtained by WQI were illustrated using ArcGIS 10. 7 to represent the quality classes for each chosen sampling point (Figure 3a–l and Table 3). The spatial variations of the WQI for the monitoring period (2015–2020) are illustrated in Figure 3a–l and Table 4. The classification of surface water quality in the Siret River basin considers the category described by Ramakrishnaiah et al. [60] (Table 3). In Table 4 are presented the WQI values considering heavy metals and organic micropollutants. It must be mentioned that in 2020, in some sampling points, few pollutants were not determined: Hg (R2, R7, R11, R12, R13, and R14), As (R4 and R6) and PAHs (R11 and R13), thus they were not taken into account for WQI assessment. Figure 3b,d,f,h,j,l and Table 4 are suggestive of the fact that the values for WQ-OM (water quality index calculated for organic micropollutants) are close to the WQI calculated, considering all monitored parameters for each section. Thus, generally the registered values for WQI-OM are higher than the WQI-HM (water quality index calculated for heavy metals) for the monitored period, except for 2018. A significant difference was observed for 2016, when the majority of sampling points belong to class E (i.e., unsuitable for drinking), the highest value being registered for L2 (2317,14) for OM (Table 4). Referring to the rivers from Romania, several studies have been carried out using WQI [25,26,34,65] considering the physical-chemical, biological parameters, but without including the priority pollutants. The assessment of the surface water quality in the Siret River basin was also made by Năstuneac et al. [20], using the global pollution index for current physical-chemical parameters and heavy metals from 2010 to 2014. The results of this study show that the water quality did not improve in the last five years, even if the monitoring actions were applied in 2014, based on national and European regulations.
WQI-HM for 2015 emphasizes that the Northern half of the basin has a good water quality, the score being between 50 and 100, while the Southern part shows an excellent quality (WQI < 50) (Figure 3a and Table 4). In the Northern part of the basin, in the case of OM, water has a “very poor” quality (WQI = 200–300), only one section having an excellent quality (WQI < 50). Generally, in 2015, based on the computed WQI-HM values, 42.9% of the sampling points are found in the “Excellent” category (class A), 47.6% in the “Good” (class B), and 9.5% in the “Poor” (class C), while based on the WQI-OM, the sampling points’ distribution was: 52.4% were rated as “Excellent”, 9.5% as “Good”, 4.8% as “Poor”, 23.8% as “Very Poor” (class D), and 9.5% as “Unsuitable for drinking” (class E).
The WQI results obtained are explained by the fact that along the river basin are counted about 100 pollution sources that mainly consist in wastewater treatment plants, both municipal (47) and industrial (52). From the 47 municipal wastewater treatment plants of the Siret River basin, only one is fully meeting the environmental standards (according to EU Directive 91/271/CEE), while the rest have negative significant impacts on the surface water quality. In the case of industrial wastewater treatment plants, the main pollutants are heavy metals and part of organic micropollutants that are not totally removed from wastewater because of the inadequate treatment processes applied. Separately, the agricultural activities negatively influence the water quality, mostly with organic micropollutants [39].
During 2015–2020, the values of WQI-HM were included in “Good” quality class, excepting 2019, when the values fall in the excellent quality class (Table 4). The highest value of WQI-HM (90,62) was found in 2020. In 2016, a degradation of water quality was observed, the WQI-HM being 19% in the “Excellent” category (class A), 76.2% in “Good” (class B) and 4.8% in “Poor” (class C). In 2016, the WQI-OM falls to 95.2% in “Unsuitable for drinking” (class E), and 4.8% in “Very Poor” (class D). The highest values of WQI-OM were obtained in 2016 (Figure 3d). All nineteen parameters considered for WQI assessment significantly contribute to WQI, the polycyclic aromatic hydrocarbons having a special contribution in the ranking. Compared to the previous year, in 2016, several quality indicators were monitored complying with the governmental decision GD 570/2016 [45], which reduced the maximum allowed values for PAHs and influenced the high scores obtained for water quality for that year. According to the graphical representation, starting with 2017, the results highlighted an improvement of the water quality for the Northern half of the river basin. The values for WQI calculated for HM in 2017 belong to class B “Good” for 100% (Figure 3e) and for WQI-OM can be observed improvements compared to values from 2016: 4.8% in “Unsuitable for drinking”, 85.7% in “Very poor” and 9.5% in “Excellent” category. For 2018, in the central part, the values of WQI-HM are distributed as follows: 23.81% in “Excellent” category, 4.76% in “Poor” and 71.43% in ”Good” (Figure 3g). For WQI-OM major improvements can be observed over the years, excepting the Northwestern part (Figure 3h). Regarding the heavy metals, in 2019 in the central and Northern part of the basin (Figure 3i), WQI showed slight improvements, while the values for WQI-OM increased, being comparable with 2017, except for the Southern part (Figure 3j).
A tendency for a decrease in water quality can be observed for 2020 in case of heavy metals, considering the following distribution: 23.8% in “Excellent” (class A), 42.8% in “Good” (class B) and 28.6% in “Poor” (class C), 4.8% in “Very Poor” (class D), while organic micropollutants show an improvement tendency of water quality: 9.5% in “Excellent” (class A), 81% in “Poor” (class C) and 9.5% in “Very Poor” (class D). The WQI values are directly corelated with the values of the measured concentrations and environmental standards. The results indicate that this water quality index is an accessible tool, facilitating data interpretation, and is recommended for surface water quality monitoring, being also an indicator of the ecological status of aquatic ecosystems.
The high WQI values obtained for certain sampling points are directly influenced by anthropogenic pollution sources such as municipal and villages’ wastewater discharges, which are insufficiently treated or untreated (R3, R5) and agricultural activities (e.g., livestock farms at R9). In the Northern part of the studied area, sections R4, R6, R7, R8, a major negative influence on the surface waters’ quality is given by mining activities, associated to heavy metals’ emissions. In most cases, the pollutants’ concentration values are higher downstream, due to the significant environmental stressors from the industrial platforms or chemical companies. In this case, it was found that the water quality is most affected in the following sections: R14, located downstream from the chemical industrial platform of Onești city and R15, located downstream from the chemical industrial platform of Borzești, one of the largest producers of chemical reagents and pesticides in Romania.
Other studies developed for Romanian river basins considered only the general physical-chemical parameters currently monitored, e.g., Romanescu et al. [65] evaluated the water quality index (WQI), in the case of Ozana River located in the North-East area of Romania, and the results revealed that the nitrites and phosphorus are the main pollutants in this area. The evaluation of water quality was developed for Danube River as well [56] based on the general physical-chemical indicators and considering the effluent of the wastewater treatment plant from the Galați city, located in the South-East area of Romania.

4. Conclusions

This study successfully showed that the monitoring of priority pollutants (heavy metals and organic micropollutants) is a very important stage in assessing the water quality suitable for drinking-water production in the Siret River basin, and contributing to the improvement of the River Basin Management Plan and implementation of WFD objective. The monitoring conducted in the last six years showed a wide variety of pollution sources, and the maximum allowed concentrations were exceeded for most water quality indicators in some sampling sections. The main pollution sources are the municipal or industrial wastewater treatment plants, agricultural activities, mining, or forestry. For instance, the polycyclic aromatic hydrocarbons were measured in all sampling points, as their spread in the environment is inevitable, induced by various anthropogenic sources such as pyrogenic processes: emissions from cars, airplanes, wood stoves, or sludge from wastewater treatment plants etc. Based on the results, it can be observed that the highest concentrations of the priority pollutants were measured in 2016.
It was shown that the water quality in the studied area is relatively low, mostly in the sampling points located nearby the areas where agricultural and industrial activities take place. Moreover, the spatial distribution of the WQI values, highlighted the fact that, in the Siret River basin, water quality is mostly influenced by the main tributaries’ quality (e.g., rivers Suceava, Moldova, Bistrița and Trotuș) and the quality of the wastewater treatment plants’ effluents. Generally, the water quality has decreased along the Siret River from its entrance in the country, in the northern part (R1—Siret—border with Ukraine) to the confluence with the Danube River (R18—Siret—Sendreni). Even so, it was noticed that the level of pollution decreased year after year, and it is expected to follow this trend in the following years. It is the first time that the case of the priority pollutants survey at the Siret River basin level and water quality assessment was conducted in an integrated manner, corelating the monitoring of data with the Water Quality Index and ARCGIS function. Thus, a clear perspective at the river basin is promoted, with importance for both the general public and the policy makers. Further work should consider the following directions:
-
Investigation of the influence on water quality of tributaries’ pollution sources, including not only the common indicators but also priority pollutants’ surveys. These experiments should cover more sampling points and longer periods of time (at least 5 years).
-
Correlation with measurements considering the sediments and biota quality, so as to understand the impacts on ecosystems and risks for human health.

Author Contributions

Conceptualization, R.Z., D.F., O.P., B.S. and C.T.; methodology, O.P., R.Z. and B.S.; software, D.F. and R.Z.; validation, O.P., B.S. and C.T.; formal analysis, R.Z. and D.F.; investigation, R.Z.; resources, O.P.; data curation, D.F.; writing—original draft preparation, R.Z., O.P. and D.F.; writing—review and editing, C.T., D.F. and B.S.; visualization, B.S. and D.F.; supervision, B.S. and C.T. All authors have read and agreed to the published version of the manuscript.

Funding

This research received no external funding.

Institutional Review Board Statement

Not applicable.

Informed Consent Statement

Not applicable.

Data Availability Statement

The data presented in this study are available on request from the first author.

Conflicts of Interest

The authors declare no conflict of interest.

Abbreviations

AT—Alert threshold; As—Arsenic; Cd-Cadmium; DEHP—Di (2-ethylhexyl) phthalate; EC—European Parliament and of the Council; EPs—emerging pollutants; GD—Government Decision; Hg—Mercury; HM—Heavy metals; HCH—Hexachlorocyclohexane; HPLC—High Performance Liquid Chromatography; ICP-MS—Inductively coupled plasma mass spectrometry; ISO—International Organization for Standardization; MAC—Maximum allowed concentration; Ni—Nickel; PAH—Polycyclic aromatic hydrocarbons; PCB—Polychlorinated biphenyl; POPs—Persistent organic pollutants; Pb—Lead; WAWQI—Weight Arithmetic Water Quality Index; WFD—Water Framework Directive; WQI—Water Quality Index; WQI—HM-Water Quality Index—heavy metal; WQI—OM-Water Quality Index—organic micropollutants.

References

  1. Gavrilescu, D.; Teodosiu, C.; David, M. Environmental assessment of wastewater discharges at river basin level by means of waste absorption footprint. Sustain. Prod. Consum. 2020, 21, 33–46. [Google Scholar] [CrossRef]
  2. Giri, S.; Mahato, M.K.; Bhattacharjee, S.; Singh, A.K. Development of a new noncarcinogenic heavy metal pollution index for quality ranking of vegetable, rice, and milk. Ecol. Indic. 2020, 113, 106214. [Google Scholar] [CrossRef]
  3. European Parliament; Council of the European Union. Directive 2000/60/EC of the European Parliament and of the Council Establishing a Framework for the Community Action in the Field of Water Policy. Available online: https://eur-lex.europa.eu/legal-content/en/ALL/?uri=CELEX%3A32000L0060 (accessed on 15 October 2021).
  4. Teodosiu, C.; Gilca, F.A.; Barjoveanu, G.; Fiore, S. Emerging pollutants removal through advanced drinking water treatment: A review on processes and environmental performances assessment. J. Clean. Prod. 2018, 197, 1210–1221. [Google Scholar] [CrossRef]
  5. Vega-Rodríguez, M.A.; Pérez, C.J.; Reder, K.; Flörke, M. A stage-based approach to allocating water quality monitoring stations based on the WorldQual model: The Jubba River as a case study. Sci. Total Environ. 2021, 762, 144162. [Google Scholar] [CrossRef]
  6. Tornero, V.; Hanke, G. Chemical contaminants entering the marine environment from sea-based sources: A review with a focus on European seas. Mar. Poll. Bull. 2016, 112, 17–38. [Google Scholar] [CrossRef]
  7. Nicola, G.G.; Parra, I.; Sáez, M.; Almodóvar, A.; Jiménez, B. Evaluation of PCBs and DDTs in endemic iberian barbel barbus bocagei (steindachner, 1864) populations. Sci. Total Environ. 2014, 479–480, 221–226. [Google Scholar] [CrossRef] [Green Version]
  8. Silva Barni, M.F.; Gonzalez, M.; Miglioranza, K.S.B. Assessment of persistent organic pollutants accumulation and lipid peroxidation in two reproductive stages of wild silverside (Odontesthes bonariensis). Ecotoxicol. Environ. Saf. 2014, 99, 45–53. [Google Scholar] [CrossRef] [PubMed]
  9. Solliec, M.; Roy-Lachapelle, A.; Storck, V.; Callender, K.; Greer, C.W.; Barbeau, B. A data-independent acquisition approach based on HRMS to explore the biodegradation process of organic micropollutants involved in a biological ion-exchange drinking water filter. Chemosphere 2021, 277, 130216. [Google Scholar] [CrossRef]
  10. Robu, B.; Jitar, O.; Teodosiu, C.; Strungaru, S.A.; Nicoara, M.; Plavan, G. Environmental impact and risk assessment of the main pollution sources from the Romanian black sea coast. Environ. Eng. Manag. J. 2015, 14, 331–340. [Google Scholar] [CrossRef]
  11. Neamtu, R.; Sluser, B.; Plavan, O.; Teodosiu, C. Environmental monitoring and impact assessment of Prut River cross-border pollution. Environ. Monit. Assess. 2021, 193, 340. [Google Scholar] [CrossRef]
  12. Nazeer, S.; Hashmi, M.Z.; Malik, R.N. Heavy metals distribution, risk assessment and water quality characterization by water quality index of the River Soan, Pakistan. Ecol. Indic. 2014, 43, 262–270. [Google Scholar] [CrossRef]
  13. Cho, E.; Khim, J.; Chung, S.; Seo, D.; Son, Y. Occurrence of micropollutants in four major rivers in Korea. Sci. Total Environ. 2014, 491–492, 138–147. [Google Scholar] [CrossRef] [PubMed]
  14. Kachroud, M.; Trolard, F.; Kefi, M.; Jebari, S.; Bourrié, G. Water quality indices: Challenges and application limits in the literature. Water 2019, 11, 361. [Google Scholar] [CrossRef] [Green Version]
  15. Jitar, O.; Teodosiu, C.; Oros, A.; Plavan, G.; Nicoara, M. Bioaccumulation of heavy metals in marine organisms from the Romanian sector of the Black Sea. New Biotechnol. 2015, 32, 369–378. [Google Scholar] [CrossRef] [PubMed]
  16. Dimri, D.; Daverey, A.; Kumar, A.; Sharma, A. Monitoring water quality of River Ganga using multivariate techniques and WQI (Water Quality Index) in Western Himalayan region of Uttarakhand, India. Environ. Nanotechnol. Monit. Manag. 2021, 15, 100375. [Google Scholar] [CrossRef]
  17. Mokarram, M.; Saber, A.; Sheykhi, V. Effects of heavy metal contamination on river water quality due to release of industrial effluents. J. Clean. Prod. 2020, 277, 123380. [Google Scholar] [CrossRef]
  18. Grecu, S.P.; Mihailescu, G.B.; Sluser, B.M. Statistical approach of environmental quality management and political decision-making at local level: Case study Iasi City, Romania. Environ. Eng. Manag. J. 2020, 19, 517–530. [Google Scholar] [CrossRef]
  19. Robu, B.; Macoveanu, M. Strategic environmental assessment for plans, programs, policies in Romania: Multi-criterial method. Environ. Eng. Manag. J. 2009, 8, 1451–1456. [Google Scholar] [CrossRef]
  20. Năstuneac, V.; Gavrilaș, S.; Munteanu, F.D. Assesment of the water quality in siret hydrographic basin. Sci. Study Res. Chem. Chem. Eng. Biotechnol. Food Ind. 2019, 20, 471–480. [Google Scholar]
  21. Uddin, M.G.; Nash, S.; Olbert, A.I. A review of water quality index models and their use for assessing surface water quality. Ecol. Indic. 2021, 122, 107218. [Google Scholar] [CrossRef]
  22. Faur, F.; Apostu, I.-M.; Lazăr, M. Study Regarding the Water Quality of Jiu River in Dolj County. Stand. Res. J. Agric. Sci. 2017, 49, 118–128. [Google Scholar]
  23. Badea, D.N.; Balacescu, A. Study for Evaluating the Water Quality of the Jiu River in Gorj County; Annals of the “Constantin Brancusi” University of Targu Jiu; Engineering Series; Brancusi Academic Publishing House: Târgu-Jiu, Romania, 2020. [Google Scholar]
  24. Duca, G.; Mereuta, A.; Velisco, N.; Tanaselia, C.; Mitina, T. Determination of quality indicators of Prut River water. Chem. J. Mold. 2019, 14, 61–67. [Google Scholar] [CrossRef]
  25. Lozba-Ştirbuleac, R.S.; Giurma-Handley, C.R.; Giurma, I. Water quality characterization of the Prut river. Environ. Eng. Manag. J. 2011, 10, 411–419. [Google Scholar] [CrossRef]
  26. Briciu, A.E.; Graur, A.; Oprea, D.I. Water quality index of suceava river in Suceava city metropolitan area. Water 2020, 12, 2111. [Google Scholar] [CrossRef]
  27. Iticescu, C.; Georgescu, L.P.; Murariu, G.; Topa, C.; Timofti, M.; Pintilie, V.; Arseni, M. Lower danube water quality quantified through WQI and multivariate analysis. Water 2019, 11, 1305. [Google Scholar] [CrossRef] [Green Version]
  28. Howladar, M.F.; Chakma, E.; Jahan Koley, N.; Islam, S.; Numanbakth, M.A.; Ahmed, Z.; Chowdhury, T.R.; Akter, S. The water quality and pollution sources assessment of Surma river, Bangladesh using, hydrochemical, multivariate statistical and water quality index methods. Groundw. Sustain. Dev. 2021, 12, 100523. [Google Scholar] [CrossRef]
  29. Pandit, D.N.; Kumari, R.; Shitanshu, S.K. A comparative assessment of the status of Surajkund and Rani Pond, Aurangabad, Bihar, India using overall Index of Pollution and Water Quality Index. Acta Ecol. Sin. 2020. [Google Scholar] [CrossRef]
  30. Tyagi, S.; Sharma, B.; Singh, P.; Dobhal, R. Water Quality Assessment in Terms of Water Quality Index. Am. J. Water Resour. 2020, 1, 34–38. [Google Scholar] [CrossRef]
  31. Ighalo, J.O.; Adeniyi, A.G. A comprehensive review of water quality monitoring and assessment in Nigeria. Chemosphere 2020, 260, 127569. [Google Scholar] [CrossRef]
  32. Giri, S. Water quality prospective in Twenty First Century: Status of water quality in major river basins, contemporary strategies and impediments: A review. Environ. Pollut. 2021, 271, 116332. [Google Scholar] [CrossRef]
  33. Akhtar, N.; Ishak, M.I.S.; Ahmad, M.I.; Umar, K.; Md Yusuff, M.S.; Anees, M.T.; Qadir, A.; Almanasir, Y.K.A. Modification of the water quality index (Wqi) process for simple calculation using the multi-criteria decision-making (mcdm) method: A review. Water 2021, 13, 905. [Google Scholar] [CrossRef]
  34. Călmuc, V.A.; Călmuc, M.; Ţopa, M.C.; Timofti, M.; Iticescu, C.; Georgescu, L.P. Various methods for calculating the water quality index. Ann. Dunarea De Jos Univ. Galati. Fascicle II Math. Phys. Theor. Mech. 2018, 41, 171–178. [Google Scholar] [CrossRef]
  35. National Management Plan for the International Hydrographic Basin of the Danube River which Is Included in the Territory of Romania 2016. Available online: http://www.mmediu.ro/articol/planul-national-de-management-aferent-portiunii-din-bazinul-hidrografic-international-al-fluviului-dunarea-care-este-cuprinsa-in-teritoriul-romanie/1530 (accessed on 14 January 2021).
  36. Romanian Government; National Strategy for the Sustainable Development of Romania. Horizons 2013–2020–2030. Available online: http://www.mmediu.ro/beta/domenii/dezvoltare-durabila/strategia-nationala-a-romaniei-2013-2020-2030/ (accessed on 8 March 2021).
  37. Protected areas of Romania. Available online: http://ananp.gov.ro/ariile-naturale-protejate-ale-romaniei/ (accessed on 15 March 2021).
  38. Vanmaercke, M.; Obreja, F.; Poesen, J. Seismic controls on contemporary sediment export in the Siret river catchment, Romania. Geomorphology 2014, 216, 247–262. [Google Scholar] [CrossRef] [Green Version]
  39. Draft Management Plan of the Hydrographic Space Siret. 2008. Available online: https://rowater.ro/wp-content/uploads/2020/12/Proiectul-Planului-de-Management-al-SH-Siret-octombrie-2009.pdf (accessed on 20 August 2021).
  40. SR ISO 5667-4; 1987-Water Quality-Sampling, Part 4: Guidance on Sampling from Lakes, Natural and Man-Made. ISO: Geneva, Switzerland, 1987.
  41. SR EN ISO 5667-6; 2014-Water Quality-Sampling, Part 6: Guidance On Sampling of Rivers and Streams. ISO: Geneva, Switzerland, 2014.
  42. SR EN ISO 5667-3; 2018-Water Quality-Sampling, Part 3: Preservation and Handling of Water Samples. ISO: Geneva, Switzerland, 2018.
  43. SR EN ISO 9001; 2015-Quality Management Systems—Requirements. ISO: Geneva, Switzerland, 2015.
  44. Romanian Ministry of Research and Inovation. Order No.161 of February 16, 2006 Approving the Norms Concerning the Classification of Surface Water Quality in order to Establish the Ecological Status of Water Bodies; Official Monitor: Bucharest, Romania, 2006. [Google Scholar]
  45. Government Decision No. 570 of August 10, 2016 on the Approval of the Program for the Phase-Out of Discharges, Emissions and Losses of Priority Hazardous Substances and other Measures for Major Pollutants; Romanian Government: Bucharest, Romania, 2016.
  46. SR EN ISO 17294-2; 2003-Water Quality-Application of Inductively Coupled Plasma Mass Spectrometry (ICP-MS), Part 2: Determination of 62 Elements. ISO: Geneva, Switzerland, 2003.
  47. SR EN ISO 15586; 2003-Water Quality-Determination of trace Metals Using Atomic Absorption Spectrometry with Graphite Furnace. ISO: Geneva, Switzerland, 2003.
  48. SR EN ISO 17852; 2006-Water Quality-Determination of Mercury, Method Using Atomic Fluorescence Spectrometry. ISO: Geneva, Switzerland, 2006.
  49. SR EN ISO 17993; 2002-Water Quality-Determination of 15 Polycyclic Aromatic Hydrocarbons (PAH) in Water by HPLC with Fluorescence Detection after Liquid-Liquid Extraction. ISO: Geneva, Switzerland, 2002.
  50. SR EN ISO 6468; 1996-Water Quality-Determination of Certain Organochlorine Insecticides, Polychlorinated Biphenyls and Chlorobenzenes, Gas Chromatographic Method after Liquid-Liquid Extraction. ISO: Geneva, Switzerland, 1996.
  51. SR EN ISO 10301; 1997-Water Quality-Determination of Highly Volatile Halogenated Hydrocarbons—Gas-Chromatographic Methods. ISO: Geneva, Switzerland, 1997.
  52. Hasan, M.A.; Nahiduzzaman, K.M.; Aldosary, A.S. Public participation in EIA: A comparative study of the projects run by government and non-governmental organizations. Environ. Impact Assess. Rev. 2018, 72, 12–24. [Google Scholar] [CrossRef]
  53. Chowdhury, R.M.; Muntasir, S.Y.; Hossain, M.M. Water Quality Index of water bodies along Faridpur-Barisal road in Bangladesh. Glob. Eng. Technol. Rev. 2007, 2, 2–9. [Google Scholar]
  54. Satish Chandra, D.; Asadi, S.S.; Raju, M.V.S. Estimation of water quality index by weighted arithmetic water quality index method: A model study. Int. J. Civ. Eng. Technol. 2017, 8, 1215–1222. [Google Scholar]
  55. Boyacioglu, H. Development of a water quality index based on a European classification scheme. Water SA 2007, 33, 101–106. [Google Scholar] [CrossRef] [Green Version]
  56. Iticescu, C.; Georgescu, L.P.; Topa, C.M. Assessing the Danube Water Quality Index in the City of Galati, Romania. Carpathian J. Earth Environ. Sci. 2013, 8, 155–164. [Google Scholar]
  57. Chauhan, A.; Singh, S. Evaluation of Ganga Water For Drinking Purpose By Water Quality. Rep. Opin. 2010, 2, 53–61. [Google Scholar] [CrossRef]
  58. Kothari, V.; Vij, S.; Sharma, S.K.; Gupta, N. Correlation of various water quality parameters and water quality index of districts of Uttarakhand. Environ. Sustain. Indic. 2021, 9, 100093. [Google Scholar] [CrossRef]
  59. Yadav, A.K.; Khan, P.; Sharma, S.K. Water quality index assessment of groundwater in todaraisingh tehsil of Rajasthan State, India-A greener approach. E-J. Chem. 2010, 7, S428–S432. [Google Scholar] [CrossRef]
  60. Ramakrishnaiah, C.R.; Sadashivaiah, C.; Ranganna, G. Assessment of water quality index for the groundwater in Tumkur taluk, Karnataka state, India. E-J. Chem. 2009, 6, 523–530. [Google Scholar] [CrossRef] [Green Version]
  61. Park, S.E.; Her, Y.; Kim, S.S.; Kim, C.W. Efficacy and safety of a lindane 1% treatment regimen for scabies, confirmed by dermoscopy-guided skin scraping with microscopic examination. Clin. Exp. Dermatol. 2015, 40, 611–616. [Google Scholar] [CrossRef] [PubMed]
  62. Lopes, C.; Persat, H.; Babut, M. Transfer of PCBs from bottom sediment to freshwater river fish: A food-web modelling approach in the RhOne River (France) in support of sediment management. Ecotoxicol. Environ. Saf. 2012, 81, 17–26. [Google Scholar] [CrossRef]
  63. Verhaert, V.; Covaci, A.; Bouillon, S.; Abrantes, K.; Musibono, D.; Bervoets, L.; Verheyen, E.; Blust, R. Baseline levels and trophic transfer of persistent organic pollutants in sediments and biota from the Congo River Basin (DR Congo). Environ. Int. 2013, 59, 290–302. [Google Scholar] [CrossRef]
  64. Blanchet-Letrouvé, I.; Zalouk-Vergnoux, A.; Vénisseau, A.; Couderc, M.; Le Bizec, B.; Elie, P.; Herrenknecht, C.; Mouneyrac, C.; Poirier, L. Dioxin-like, non-dioxin like PCB and PCDD/F contamination in European eel (Anguilla anguilla) from the Loire estuarine continuum: Spatial and biological variabilities. Sci. Total Environ. 2014, 472, 562–571. [Google Scholar] [CrossRef] [PubMed] [Green Version]
  65. Romanescu, G.; Iosub, M.; Sandu, I.; Minea, I.; Enea, A.; Dascalita, D.; Hapciuc, O.E. Spatio-temporal analysis of the water quality of the Ozana River. Rev. Chim. 2016, 67, 42–47. [Google Scholar]
Figure 1. Study area and sampling points in the Siret River basin.
Water 14 00129 g001
Figure 2. Monitoring results during 2015–2020 in the river sampling points (R1-R18) and lake sampling points (L1-L3): (a) Arsenic; (b) Cadmium; (c) Mercury; (d) Nickel; (e) Lead; (f) α—Hexachlorocyclohexane; (g) β—Hexachlorocyclohexane; (h) γ—Hexachlorocyclohexane; (i) Naphthalene; (j) Anthracene; (k) Phenanthrene; (l) Fluoranthene; (m) Benzo(a)anthracene; (n) Benzo(b)fluoranthene; (o) Benzo(k)fluoranthene; (p) Benzo(a)pyrene; (q) Benzo(ghi)perylene; (r) Indeno(1,2,3-cd)pyrene; (s) Di-2-ethyl-hexyl-phthalate.
Water 14 00129 g002aWater 14 00129 g002bWater 14 00129 g002cWater 14 00129 g002d
Figure 3. Spatial distribution for WQI calculated for organic and inorganic priority pollutants during 2015–2020 for Siret River basin: (a) 2015—HM, (b) 2015—OM; (c) 2016—HM; (d) 2016—OM; (e) 2017—HM; (f) 2017—OM; (g) 2018—HM; (h) 2018—OM; (i) 2019—HM; (j) 2019—OM; (k) 2020—HM; (l) 2020—OM.
Water 14 00129 g003aWater 14 00129 g003bWater 14 00129 g003c
Table 1. Sampling points and water quality indicators assessed, during the period 2015–2020.
RiverLatitudeLongitudeSection LocationNo. of Samples/YearsMeasured
Priority
Pollutants/
Water Quality Indicators
201520162017201820192020
R1—Siret—Siret47°58′58.08″ N26°2′11.85″ EUkrainian cross border 121212121212As, Cd, Hg, Ni, Pb, PAH, DEHP
R2—Suceava-Tisauti 47°37′45.96″ N26°19′8.13″ EDownstream of Suceava city241281212As, Cd, Hg, Ni, Pb, PAH, DEHP
R3—Solca—Solca47°42′3.67″ N25°47′28.62″ EWater abstraction point1244444As, Cd, Hg, Ni, Pb, PAH
R4—Moldova—Fundul Moldovei47°32′15.57″ N25°24′52.15″ EReference station444444As, Cd, Hg, Ni, Pb, PAH
R5—Moldova—Baia 47°24′55.22″ N26°11′20.88″ EWater abstraction points12128488As, Cd, Hg, Ni, Pb, PAH
R6—Barnarel—Crucea47°18′57.95″ N25°33′46.18″ E12124444As, Cd, Hg, Ni, Pb, PAH
R7—Baisescu—Ostra47°22′4.3″ N25°43′8.83″ E444444As, Cd, Hg, Ni, Pb, PAH
R8—Dorna—Dorna Candreni 47°21′16.58″ N25°16′6.74″ E12128488As, Cd, Hg, Ni, Pb, PAH
R9—Ciobanus—Ciobanus46°23′6.86″ N26°9′54.7″ E448488As, Cd, Hg, Ni, Pb, PAH
R10—Moldova—Timisesti47°14′27.05″ N26°33′35.6″ E1212128812As, Cd, Hg, Ni, Pb, PAH
R11—Moldova—Roman46°54′54.93″ N26°55′24.26″ EDownstream of Roman city2412888As, Cd, Hg, Ni, Pb, PAH, DEHP
R12—Bistrita—Downstream Bacau46°30′8.84″ N26°57′28.93″ EDownstream of the treatment plant—Bacau city24124812As, Cd, Hg, Ni, Pb, PAH, DEHP
R13—Trotus Downstream Lunca46°35′15.46″ N26°0′20.7″ ETrotus river spring24124812As, Cd, Hg, Ni, Pb, PAH, DEHP
R14—Trotus—Vranceni46°12′30.48″ N26°54′2.6″ EDownstream of Onesti industrial platform241281212As, Cd, Hg, Ni, Pb, PAH, α-HCH, β-HCH, γ-HCH, DEHP
R15—Trotus—Adjud46°7′59.99″ N27°11′0″ EUpstream of confluence with the Siret river24128812As, Cd, Hg, Ni, Pb, PAH, α-HCH, β-HCH, γ-HCH, DEHP
R16—Slanic—Slanic Moldova46°11′56.81″ N26°25′15.6″ EUpstream Slanic Moldova444484As, Cd, Hg, Ni, Pb, PAH
R17—Uz—Poiana Uzului46°19′54.5″ N26°19′36.73″ EUpstream of Uz Lake121212121212As, Cd, Hg, Ni, Pb, PAH
L1—Bucecea lake45°44′33.81″ N27°21′5.97″ EWater abstraction point121212121212As, Cd, Hg, Ni, Pb, PAH
L2—Batca Doamnei lake47°46′58.58″ N26°21′38.46″ E121212121212As, Cd, Hg, Ni, Pb, PAH
L3—Poiana Uzului lake46°55′55.81″ N26°20′34.2″ E121212121212As, Cd, Hg, Ni, Pb, PAH
R18—Siret—Sendreni46°20′5.55″ N26°23′18.39″ EUpstream of the confluence with the Danube river121212121212As, Cd, Hg, Ni, Pb, PAH
Table 2. The priority pollutants analyzed, associated methods, and maximum allowed concentrations [44,45].
Water Quality ParametersAnalysis MethodsMaximum Allowed
Concentration (MAC)
According to GD 570/2016 [45]
Unit
AsMethod of Inductively coupled plasma mass spectrometry (ICP-MS) according to ISO 17294-2:2003 [46] and
Method using atomic absorption spectrometry with graphite furnace according to ISO 15586:2003 [47]
7.2μg/L
Cd0.08μg/L
Ni4μg/L
Pb1.2μg/L
HgMethod using atomic fluorescence spectrometry according to ISO 17852:2006 [48]0.007μg/L
NaphthaleneMethod using High Performance Liquid Chromatography (HPLC) with fluorescence detection after liquid—liquid extraction according to ISO 17993:2002 [49]2μg/L
Anthracene0.1μg/L
Phenanthrene0.03μg/L
Fluoranthene0.0063μg/L
Benzo(b)fluoranthene0.017μg/L
Benzo(k)fluoranthene 0.017μg/L
Benzo(ghi)perylene0.0082μg/L
Benzo(a)pyrene0.00017μg/L
Benzo(a)anthracene0.00017μg/L
Indeno(1,2,3-cd)pyrene0.00017μg/L
α-HCH, β-HCH and γ-HCHGas chromatographic method after liquid-liquid extraction according to ISO 6468: 1996 [50]0.02μg/L
DEHPGas chromatographic method for determination of phthalates according to ISO10301:1997 [51]1.3μg/L
Table 3. Different water quality scales for WAWQI method [14,58,60].
Water Quality Status
References
WQIClass
[30,54,59] [14,58,60]
Excellent0–25<50A
Good26–5050–100B
Poor51–75100–200C
Very poor76–100200–300D
Unsuitable for drinking>100>300E
Table 4. The annual WQI average obtained values (HM and OM).
Section/
WQI Values
Years
201520162017201820192020
R1120.91925.01287.1317.59200.73244.65
R269.471882.29287.1017.36200.68196.12
R3286.931775.15286.9128.88200.75196.90
R417.391096.43287.08286.72200.75196.90
R5287.252059.15286.8417.40200.78196.92
R6287.001489.56286.7717.39200.78196.90
R768.931882.45286.9028.86200.75197.05
R8287.041483.29287.3328.87200.75196.90
R917.341882.26287.2828.8528.86175.55
R10287.131447.03287.0728.88286.72196.90
R1117.421084.4617.3917.3817.3785.64
R1217.631643.62287.0928.85286.68197.35
R1317.491882.1817.3917.4017.37111.62
R1417.901866.95284.9817.73199.21251.59
R1518.421879.14285.8429.04285.39196.45
R1617.37286.73454.6517.37196.92196.90
R1717.371894.17286.9517.35286.69197.02
R18351.882059.76296.60287.7317.38197.09
L1325.341350.22287.0617.42200.75196.92
L217.372317.14287.1517.43200.76196.93
L317.371446.94286.9617.37200.75196.95
Excellent Good Poor
Very poor Unsuitable for drinking
Publisher’s Note: MDPI stays neutral with regard to jurisdictional claims in published maps and institutional affiliations.

