Abstract
In this paper, a series of field surveys were carried out along the Nestos River watershed (NE Greece) to assess the influence of two hydropower dams (Thissavros and Platanovrisi) upon the hydrology, hydrochemistry and nutrients stoichiometry of the river. Results showed that Nestos hydrology, downstream of the reservoirs, is entirely governed by the man-induced hydropower-driven dam retention/release policy. Dams’ operation increased the retention of dissolved inorganic nitrogen (DIN) and total suspended solids (TSS) significantly, affecting their downstream fluxes, even under water release regime. On the contrary, dams’ construction and operation did not seem to influence the downstream fluxes of dissolved inorganic phosphorus (DIP) and silica (DSi), although these elements also depended on the releasing policy. DIN retention, combined with the dependence of DIP to the water level of Thissavros, resulted in alteration of the N:P ratio at the downstream part. Almost all nutrients were stored at the bottom layer of Thissavros reservoir, especially under the summer stratification regime. Platanovrisi reservoir acts as a buffer zone between Thissavros and the Nestos downstream part. Anoxic conditions in the reservoirs favour the transformation of nitrates into ammonia and the remineralization of phosphorus from sediments, creating a degraded environment for freshwater fauna.
1. Introduction
River runoffs are responsible for the transport of 95% of sediments [1], and the introduction of 232–483 × 105 tons of dissolved inorganic phosphorus (DIP) per year, worldwide, into the coastal ocean environment [2,3]. As for dissolved inorganic nitrogen (DIN), it is estimated that the average annual runoff from a relatively undisturbed riparian ecosystem is 100 kg N per km2 of catchment area, annually [4]. However, the pathway of these nutrients to the sea is interrupted by the construction of dams. Presently, about 50% of river water outflowing to the oceans is passing through dams, a percentage that is expected to increase to 90% by 2030 [5]. This accounts to more than 800,000 operational artificial reservoirs and lakes [6], 75,000 of which are considered large constructions with high storage capacity (surface area < 0.1 km2; [7]). According to Maavara et al. [8] around 12% of the total phosphorus loads transported through rivers are trapped inside reservoirs, a number expected to increase to 17%, while sediment flux retention from dams is estimated to 25–30% [9]. As for nitrogen (N), the removal from the aquatic environment caused by lakes and reservoirs (small and large) reaches 20% [10].
In the Mediterranean, water preservation inside reservoirs is a necessity due to the strong seasonality of the Mediterranean climate and the high water demand from the increased population. Dam construction is further widespread compared to regions with more humid conditions. The cumulative water storage capacity of the Mediterranean reservoirs is calculated to 237 km3, corresponding to 74% of the average annual riverine water of the region [11,12]. According to Sadaoui et al. [13], the sediment retention inside Mediterranean reservoirs reaches 35% of the total sediment transport. However, the effect of river impoundment behind dams may be more significant in the Mediterranean Sea due to the enclosed characteristics of the area and its oligotrophic nature [14].
A significant number of studies describe the adverse effects of dams on the hydrology, hydrochemistry, the biota and channel morphology of the downstream river part, the floodplains and the coastal zone [15,16,17,18,19,20]. Ward and Stanford [21] concluded that the increased resident time of the water inside the reservoir and the regular release of water from the hypocline could raise the downstream nutrient concentrations and produce eutrophication. Alteration was observed in terms of sediment transport [22], leading to bank erosion [23]. In many cases the downstream nutrient stoichiometry is affected, resulting to non-siliceous algal blooms in many occasions [24,25], while according to several authors [26,27,28], dams, small or large, have similarly negative effects not only upon water quality but to freshwater species as well.
The situation inside reservoirs is not ideal either. The hydrologic regime of the reservoirs is complex due to man-controlled flow, their levels are highly variable in an unnatural manner, and the ecosystems developed in reservoirs are simplistic and poor [29]. Eutrophication incidents are common inside reservoirs, due to high nutrient abundance and prolonged residence time [30,31]. Thermal stratification developed in reservoirs during summer produces anoxic condition at the bottom layer, degrading the water quality and endangering aquatic organisms. Anoxia leads to nutrient resuspension to the water column from sediments [32,33] and the thermocline breakdown occurring during winter is responsible for the transportation of these nutrients to the upper layer triggering primary production. Nutrient accumulation to bottom sediment is depended by various factors (pH, D.O. concentration, redox, organic matter and temperature) and according to Ammar [34], pollutants from the reservoir’s sediment can be redistributed to the water column during spill regimes, negatively affecting the quality of the hypolimnion and the water exiting the reservoir.
Of particular interest for the scientific community is the conditions at which reservoirs can act as nutrient sinks or sources for the downstream fluvial part. According to Teodorou and Werli [35], the Iron Gate I reservoir presented a slight increase in nutrient loads to the downstream compared to the upstream part. It is also proven that the nutrient release/retention function of reservoirs is proportional to water residence time and the retention capability is usually decreasing with nutrient loading [30,36]. The factors influencing the nitrogen and phosphorus transportation regarding their retention or release from reservoirs are different. For example, due to phosphorus binding to suspended sediments, its retention is depended mostly on hydraulic residence time (HRT, [8]), while on the other hand, the factors responsible for nitrogen storage apart from HRT are sedimentation, denitrification and uptake from aquatic flora [37]. Powers et al. [38] indicated that for a total of 186 reservoir outflow sites (99 for total phosphorus (TP) and 87 for total nitrogen (TN)) on agricultural landscapes of Midwestern US, all reservoirs acted as TN sinks but occasionally functioned as TP net sources for the downstream part. Other studies showed that the Three Gorges Reservoir (TGR) presented significant TP retention due to the considerable TGR efficacy of sediment trapping [39,40]. Reservoir use (storage, irrigation purposes and hydropower), size and location (upper/lower reaches, mountainous or plain) are essential features determining whether a reservoir will act as sink or source of nutrients. In some cases, small, deep release reservoirs are characterized as nutrient sources for the downstream part or do not play significant role regarding nutrient transportation along a river [41,42].
The aim of the present study is (1): to contribute to the global reservoir database with data regarding nutrient transportation along Thissavros and Platanovrisi hydropower dams of Nestos River (NE Greece) and to examine the response of the lower reaches to the construction of these dams, in terms of hydrology, hydrochemistry and stoichiometry, (2) to investigate the alterations of the water quality inside both dams due to seasonality and climatic conditions and (3) to determine the interactions between the freshwater bodies of Nestos River (main river route, tributaries and reservoirs). The attributes of the above water bodies are defining the hydro-chemical and stoichiometric balance of the water outflowing to the coastal sea, an area with significant economic and ecological importance.
2. Materials and Methods
2.1. Study Area
Nestos River has its source in Rila Mountains (southwestern Bulgaria), its total length is 230 km, and drains an area of approximately 5600 km2, of which 2800 km2 belong to Greece [43,44] (Figure 1). The population density in the drainage basin is low (33 inhabitants per km2), varying between 15 inhabitants per km2 in the Greek part and almost tripling in the Bulgarian part. The leading economic activity is agriculture, concentrated mostly at the lower deltaic zone (440 km2 [45,46]). River Nestos has approximately 50 tributaries. The biggest one, Despatis (catchment of 680 km2), originates from Bulgaria and meets the main Nestos riverbed in Greece, just upstream of Thissavros dam.
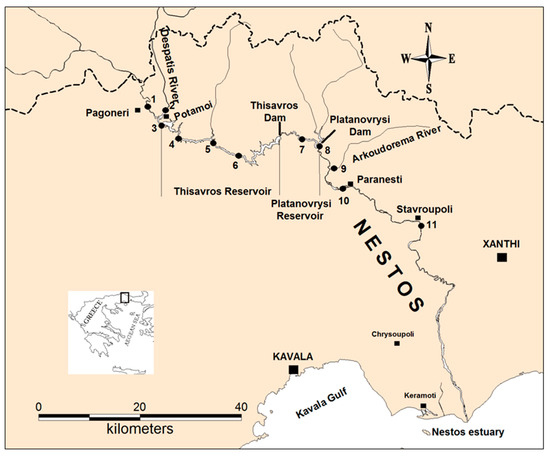
Figure 1.
Sampling sites locations at Nestos main riverbed, the tributaries and the reservoirs of Thissavros and Platanovrisi.
Nestos natural flow is interrupted by the construction of two dams since the late ’90s in the Greek part operating by the Public Power Corporation S.A.—Hellas (PPC) at the sites of Thissavros and Platanovrisi. Thissavros reservoir occupies an area of 18 km2 having an operational volume of 565 × 106 m3. Platanovrisi is a smaller gravity dam with service volume of approximately 11 × 106 m3 and surface coverage of 3 km2 [47]. Both sites are mountainous with gentle slope and low-density population.
Based on 1966–1996 natural river flow data recorded at the entry point to Greece, the mean pre-damming annual discharge was about 40 m3/s, characterized by substantial seasonal and inter-annual variability [48]. Koutroumanidis et al. [49] showed that the above pre-damming period could be divided into five different hydro-periods, with a gradually reduced mean annual flow. The hyrdo-period of 1986–2004 presented a reduced mean annual flow of 51.2%, compared to the corresponding flow of the first hydro-period (1966–1971). Such a reduction could be attributed to the Bulgarian Nestos River water use increase and climate change factors.
2.2. Reservoirs’ and Tributaries’ Water Influx-Outflux Estimation
Daily water volume inflows to Thissavros and outflows from Platanovrisi reservoirs were provided by PPC. These data were subsequently integrated at monthly level and used to understand the water balance of the dam complex and assess changes in the river’s hydrology. Moreover, dense measurements of discharge were being held at Despatis and Arkoudorema rivers in order to calculate the monthly fluxes of these tributaries to Nestos and inside the reservoirs. The water speed at each site was measured with the use of an RCM-9 current meter.
2.3. Water Sampling and Analytical Techniques
The physicochemical parameters along Nestos River, at the two mentioned tributaries (Despatis and Arkoudorema) and the two reservoirs (Thissavros and Platanovrisi) were monitored through nine field surveys July and October 2006 and March 2007 (three samplings each). For this reason, 11 monitoring sites were established covering the entire Nestos River basin within the Greek territory (Figure 1). Table 1 presents and describes the exact location of all sampling sites.

Table 1.
Station types, locations and details.
Freshwater physical characteristics (temperature, conductivity, density and dissolved oxygen) were measured in situ using a Seabird SBE 19plus CTD, equipped with an SBE43 oxygen sensor. Water samples were collected for the determination of five nutrients, TSS and chlorophyll-a concentrations. All river stations along Nestos and its tributaries were shallow (usually below 1 m depth); thus, only one water sample was taken from each sampling site. Inside reservoirs, the number of samples collected from the water column ranged between 2 and 6 per site, depending on station depth (from 15 to 65 m depth). For nutrient analyses, 500 mL of water samples were filtrated under vacuum pressure through 0.45 µM/L pre-weighted nitrocellulose filters and kept frozen at −20 °C. Nutrient determinations were achieved using the methods described by Parsons et al. [50]. The above “loaded” filters were used for the determination of TSS according to [51]. For chlorophyll-a analysis, 1000 mL of water sample were filtrated through 47 mm diameter GF/F glass fibre filters. Filters were diluted in 10 mL of 90% acetone, stored overnight in a dark place at 4 °C and analysed according to [51]. All analyses were accomplished using a HITACHI U-2001 spectrophotometer. Analytical precision was tested by analysing 40% of all samples in triplicates. Based on these samples, the standard error for all nutrients and chlorophyll-a concentrations was found relatively low (3.1–5.8%).
2.4. Nutrient Fluxes Estimation
The river discharge measurements at Nestos obtained from PPC, and the tributaries, as well as nutrient concentrations, were used to estimate the monthly nutrient fluxes at each site. All calculations were made on the assumption that both reservoirs are functioning as a single unit. To evaluate the role of the dams to the internal storage and transport of DIN, DIP, DSi and TSS, the mean monthly fluxes at the inlet and outlet of the reservoir system were estimated using field measurements at four sites: Stations 1 and 2, representing Thissavros influx through Nestos main river course and Despatis tributary; Stations 9 (Arkoudorema) and 10, representing the outflowing nutrient fluxes to the downstream part. For this reason, the following simple mass equation was used:
where Q(D) and Ci(D) is the monthly freshwater influx and the mean monthly concentration of the element i into Thissavros reservoir upstream of Nestos main river course; QDes and Ci(Des) the corresponding parameters for Despatis tributary; Q(P) the monthly freshwater outflow from Platanovrisi Reservoir and Ci(P) the mean monthly concentration of element i at Station 10 (downstream); and QArk and Ci(Ark) the respective values for Arkoudorema tributary. Water and nutrient fluxes from Arkoudorema should be subtracted from respective station 10 values, as Arkoudorema tributary outflows between Platanovrisi and station 10.
3. Results
3.1. Reservoirs’ Water Balance
The variability of monthly water volume entering and exiting the reservoirs are shown in Figure 2. During the June–December 2006 period, the reservoirs’ system was emptying, since outflows exceeded inflows. For this period, the volume deficit was estimated at 248 × 106 m3, representing nearly 56.9% of the cumulative reservoirs’ volume. The maximum volume loss occurred in August (65 × 106 m3). The water released is directly related to dam operation, aiming to cover the increased energy demand and irrigation needs during the peak season (July–September; [52]). On the contrary, water retention occurred in May–June 2006 (cumulative: 57.9 × 10⁶ m3) and January–March 2007 periods (cumulative: 56.1 × 10⁶ m3).
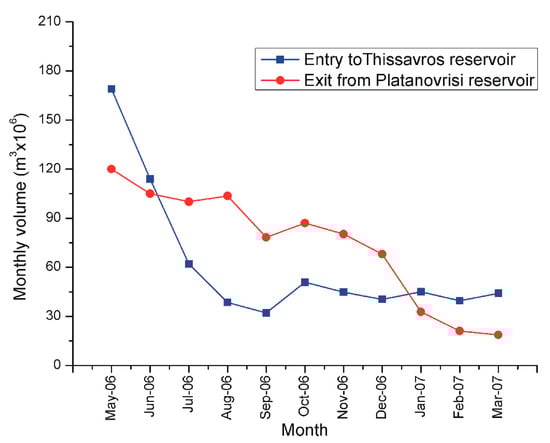
Figure 2.
Monthly freshwater fluxes at the entrance of Thissavros and the exit of Platanovrisi during the period May 2006–March 2007.
3.2. Nestos River Hydrochemistry
The spatial distributions of all examined parameters along the main Nestos River course are illustrated in Figure 3 and Figure 4, while in Table 2 the spatially mean values for all Nestos stations (upstream and downstream) are presented. Intense temperature alteration occurred during summer 2006 (Figure 3a), since upstream of the reservoirs, waters’ temperature was measured at 23.2 °C, while at the downstream part was found lower by 8.4 °C. Colder water was recorded at the upstream part during fall (Figure 3a), due to the cooler climate at the mountainous part of the basin [43], while spring showed limited reservoirs’ inflow-outflow temperature difference (inflow: 7.6 °C; outflow: 9.0 °C). pH appeared slightly decreased downstream (Table 2).
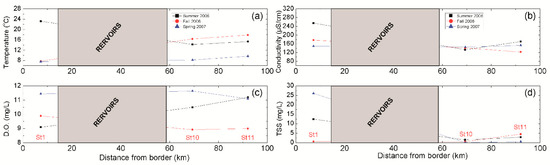
Figure 3.
Spatial distributions along Nestos riverbed for: (a) temperature, (b) conductivity, (c) dissolved oxygen and (d) TSS concentrations during summer 2006, fall 2006 and spring 2007.
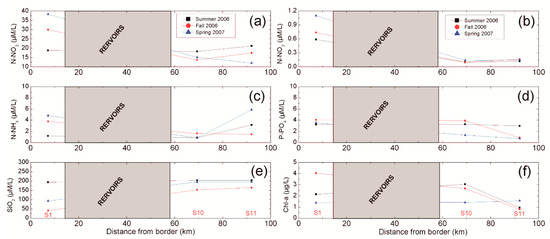
Figure 4.
Spatial distributions along Nestos riverbed for: (a) nitrate, (b) nitrite, (c) ammonium, (d) phosphate, (e) silicate and (f) chlorophyll-a concentrations during summer 2006, fall 2006 and spring 2007.
Table 2.
Average values (and standard deviation in parenthesis) of the physicochemical parameters in Nestos riverbed for all the examined periods.
Conductivity values presented similar distributions during summer and fall 2006 (Figure 3b). Nestos water appeared well-oxygenated (mean: 10.3 ± 1 mg/L). The highest concentrations of TSS were measured at the upstream part of Nestos River, during summer 2006 and spring 2007, respectively. Figure 3d clearly shows that suspended solids were entrapped by the reservoir system, with percentages ranging from 87.5 to 99.6% for these surveys.
Nitrate (N-NO3) showed limited seasonal variability (mean: 19.5, 20.4 and 21.8 µM/L for summer, fall and spring, respectively); however, its spatial distribution along the main river course depicted significant alterations (Table 2). Figure 4a shows that dam operation alters the nitrate concentrations to the downstream part. Nitrite (N-NO2) followed similar to nitrates pattern (Figure 4b) and presented higher values upstream (Table 2).
Ammonium (N-NH4) presented two peaks (Figure 4c), the first at the upstream and the second at the downstream part (Table 2; station 11). During fall, the maximum concentration was found upstream. Ammonium values were always lower at the reservoir exit (station 10). Phosphate concentrations (P-PO4) were equally distributed along Nestos river bed (Figure 4d) exhibiting the relatively limited impact of the reservoir complex on the downstream phosphate concentrations.
Silicates (SiO2) showed high values downstream of the reservoirs (Table 2), while another worth noticing point is the extremely low silicate values measured upstream during fall and spring (Table 2; Figure 4e). Chlorophyll-a presented its highest concentration at the upstream part (Figure 4f) and found lower downstream (Table 2).
3.3. Tributaries Hydrochemical Characteristics
The results of the physicochemical measurements at the tributaries are summarized in Table 3. Colder water was detected during fall in Despatis (Station 2) while at the same period the water appeared slightly warmer at Arkoudorema (Station 9). No differences were detected between these two tributaries for the other two sampling periods. Dissolved oxygen values were found at high levels for all the examined periods. TSS concentrations presented a maximum at Despatis, while almost negligible TSS levels were measured at Arkoudorema (Table 3).
Table 3.
Average values (and standard deviation in parenthesis) of the physicochemical parameters in tributary rivers for all the examined periods.
Nitrates, nitrites and ammonium appeared to be most abundant in Despatis for all sampling periods. Nitrate and ammonium presented a maximum during spring in Arkoudorema. Phosphates equally distributed to all tributaries and silicates showed limited spatial variation during summer (mean: 212 µM/L; std: 40 µM/L). Finally, chlorophyll-a presented only two noticeable high concentrations at Arkoudorema (summer) and Despatis (spring), with the rest of the values measured below 1.5 μg/L.
3.4. Thissavros and Platanovrisi Reservoirs
Results on the physicochemical parameters of Thissavros and Platanovrisi reservoirs are summarized in Table 4. Strong thermal stratification was detected during summer, between 6 and 15 m and from 3 to 9 m depth, for Thissavros and Platanovrisi reservoirs, respectively (Figure 5). During fall, stratification was absent, and the water column at Thissavros was entirely mixed (Table 4). For the same season, Platanovrisis’ water temperature was found stable until 40 m depth, and stratification was recorded at 55 m depth. In spring (Figure 5c) the thermal stratification was absent in both reservoirs. pH demonstrated reduction at the bottom of Thissavros (by 0.2–1.5) and Platanovrisi (by 0.2–0.8) compared to the surface layer.
Table 4.
Average seasonal values (and ranges) of the physicochemical parameters at the surface and bottom layer of Thissavros and Platanovrisi reservoirs.
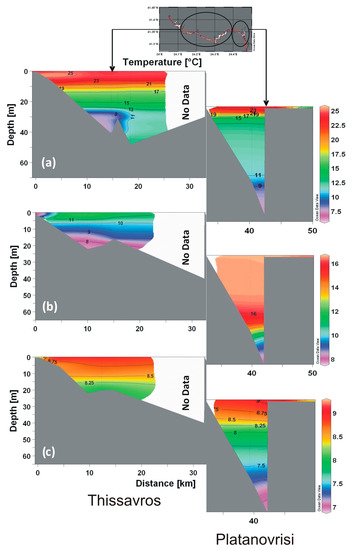
Figure 5.
Temperature distribution along Thissavros and Platanovrisi reservoirs during (a): summer 2006, (b): fall 2006 and (c): spring 2007. The blank area indicates the absence of measurements.
Dissolved oxygen demonstrated higher concentrations at the surface of both reservoirs and decreased towards the bottom during summer. In fall and under the water release regime, the bottom layer of Thissavros was gradually oxygenated (Table 4), while anoxic conditions prevailed at the bottom (>55 m depth) of Platanovrisi (DO: 0.3–0.4 mg/L). During spring, higher DO levels were detected in both reservoirs.
TSS showed similar behaviour for all the examined seasons in Thissavros, accumulating at the bottom of the reservoir (Table 4). On the contrary, it seems that Platanovrisi is characterized by TSS deficient. Nitrates, nitrites and phosphates presented similar bottom accumulation inside Thissavros (Table 4). Platanovrisi demonstrated lower nitrate and nitrite concentrations, while phosphate was found more abundant during summer and fall.
Ammonium appeared evenly distributed throughout the water column of Thissavros during summer (Figure 6a) and Platanovrisi displayed higher values at the surface (0.8–1.3 µM/L). During fall, ammonium was dramatically increased at the bottom of both Thissavros and Platanovrisi, reaching 35.4 and 42.5 µM/L, respectively (Figure 6b). In spring, ammonium demonstrated lower levels in both reservoirs (Figure 6c; Table 4). Similar to other nutrients, silicates accumulated at the bottom of Thissavros during summer and distributed equally in the water column of Platanovrisi (Table 4). An opposite behaviour observed during fall. In Platanovrisi, silicates were found at steady levels up to the thermocline (124–147 µM/L), while at the deeper anoxic layer silicates were measured up to 191 µM/L. During spring, silicates allocated uniformly in both Thissavros (100–147 µM/L) and Platanovrisi (166–212 µM/L).
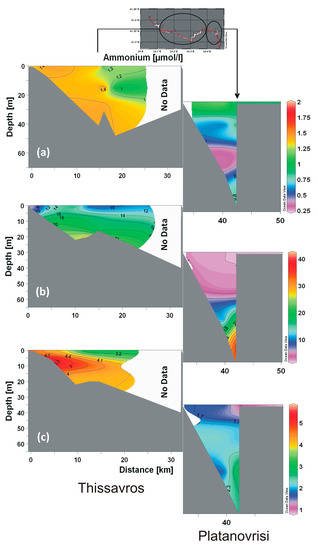
Figure 6.
Ammonium distribution along Thissavros and Platanovrisi reservoirs during (a): summer 2006, (b): fall 2006 and (c): spring 2007. The blank area indicates the absence of measurements.
Chlorophyll-a was measured at very high levels at the bottom of Thissavros during summer (Table 4), related to natural plankton mortality and sinking. Lower chlorophyll values found in Platanovrisi during the same period (0.3–2 mg/L), probably attributed to the lower primary productivity related to limited nutrient abundance. During fall, high chlorophyll concentrations were detected at the surface as well as the bottom layer of Thissavros (Table 4), while in Platanovrisi chlorophyll-a levels appeared lower (0.1–2.1 mg/L). In the anoxic layer, chlorophyll concentrations were measured at 6.3 mg/L. Spring presented low concentrations at the entire water column of Thissavros. On the contrary, Platanovrisi displayed higher levels at the surface (5.1–9.3 mg/L).
3.5. Nutrient and TSS Fluxes
In order to evaluate the role of Nestos River dams on the storage and transport of DIN, DIP, DSi and TSS, the monthly fluxes entering and exiting these reservoirs were calculated using Equation (1). Results are presented in Table 5. It is evident that in most cases the fluxes exiting Platanovrisi are higher than those entering Thissavros. The higher downstream fluxes occurred due to the water release from the dam-system during July–October. In October, the only retention observed was that of DIN, while the system was releasing DIP and DSi. During spring, the retention of all nutrients and suspended solids were observed since Nestos water was kept inside the reservoirs. Suspended solids were permanently trapped inside the reservoirs, even under the water-release regime.
Table 5.
Balance of freshwater, nitrogen, phosphorus, silicate and suspended solids upstream and downstream of the reservoir system. Positive values are indicating retention inside the reservoirs.
3.6. River Stoichiometry
The river N:P stoichiometric ratio was also affected by the hydropower management’s water spill/storage regime (Figure 7). For all the examined cases, the N:P ratio decreased downstream, while this reduction was more pronounced during fall 2006 (almost by 50%), where retention of DIN with a simultaneous release of the DIP was observed. Si:N ratio was found above unity in all cases (1.2–12.2), while Si:P ratio presented its minimum (~10) during fall at the upstream part due to low silicate concentrations.
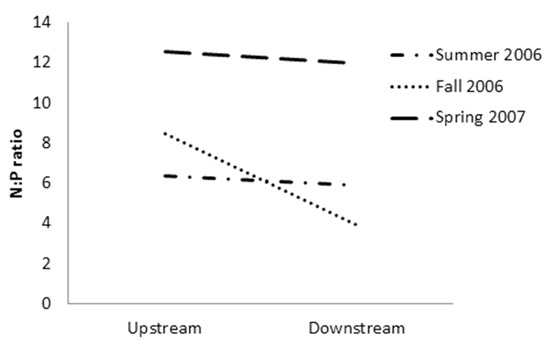
Figure 7.
N:P ratio fluctuation between the upstream and the downstream part of Nestos for all the examined seasons.
4. Discussion
4.1. The Impact of Dams on Nestos River Hydrochemistry
In this paper, an attempt to reveal the dam impact on the hydrology and the nutrients, as well as on the suspended solids’ fluxes along Nestos main river course was carried out. The construction of Thissavros and Platanovrisi hydropower dams resulted in the segmentation of river basin into three parts, with different hydrological and physicochemical characteristics: the upstream part, the reservoirs system and the downstream part.
The temperature reduction downstream of reservoirs is a common phenomenon in temperate rivers, and it is attributed to the thermal stratification and waters’ residence time inside the reservoirs [53]. In Nestos, the water used by the turbines for energy production in both reservoirs comes from the hypolimnion, and therefore the temperature downstream is determined by the stratification or vertical mixing conditions occurring inside the reservoirs. For this reason, the temperature measured directly downstream of Platanovrisi dam was colder during summer and warmer during fall and spring compared to upstream. According to literature, temperature alterations may affect the distribution, physiology, behaviour and survival of migratory fish fauna to the downstream [54,55]; however, no such case has been investigated for Nestos River fish fauna, although, according to Koutrakis et al. [28], the Nestos riverbed segmentation caused harmful effects to some rheophilic species due to the prohibition of free movement as well as flushing events.
Present results indicate the significant concentration reduction found for nitrates, nitrites, ammonium and TSS at the water exiting Platanovrisi reservoir compared to the upstream part, while DSi and DIP demonstrated similar or even higher values downstream. Since human activities are almost absent at the northern part of the sparse populated Greek basin, it becomes clear that these nitrogen-based compounds were transported from the Bulgarian part of the watershed. According to Sylaios and Burnaski [46], most of Bulgaria’s agriculture activities are concentrated to the south, near the Greek border, explaining these higher nutrient concentrations. Additionally, it is reported that in most cases the dam operation is preventing the free passage of nutrients and TSS to the downstream part [32,56,57,58,59,60,61]. This case also applies for Nestos since it appears that the dam construction enhances the DIN and TSS trapping inside the reservoirs. On the contrary, DIP mobility is not primarily affected by the dams’ operation (Figure 4d). The selective trapping/release of N:P downstream due to river fragmentation by dams has been reported by many scientific works [37,38,62]. It is mainly depended by several parameters developed inside the reservoirs (thermal stratification, dissolved oxygen levels, water residence time) and it will be further analysed below in the Discussion section.
Low silicate values at the upstream can be explained through chlorophyll concentrations. A significant negative relationship was found at the main riverbed between chlorophyll-a and silicates for all the examined seasons (r = −0.63, p < 0.05). Conversely, positive relation presented with DIN (r = 0.64, p < 0.05) and weaker with DIP (r = 0.54, p < 0.05), indicating the higher chlorophyll dependence on DIN. Silica is a natural element originating mostly from the weathering of silicate minerals and rocks [58,63], and its uptake by diatoms may lead to the reduction of silicate concentrations in the water column [64]. On the other hand, DIN DIP intake can be balanced by their further introduction in the system from anthropogenic activities.
4.2. The Situation Inside the Reservoirs
In general, Thissavros reservoir is characterized by higher nutrient concentrations compared to Platanovrisi due to prolonged HRT of the water which favours nutrient trapping through gravity and biological action [65,66]. As Van Cappelen and Maavara [7] note, the HRT extension through water impoundment or water’s velocity decrease is an effective way to promote primary productivity and nutrient retention in reservoirs. The higher nutrient availability boosted primary production, resulted in nutrients depletion at the epilimnion (Table 4), mainly in the stratified water column during the summer spill regime. The newly formed organic material is decomposed and precipitated to the bottom, a process accompanied by re-dilution of nutrients at deeper layers [58]. The chemical stratification index e% [34] expressed as:
where x is the concentration of a chemical. e% values indicates the extreme stratification for all the examined parameters in Thissavros during summer (from 12% for ammonium to 2774% for TSS). Platanovrisi demonstrated lower concentrations of almost all nutrients, as most of them sunk into Thissavros. Hence, Platanovrisi is less eutrophic, and its primary production is lower, as shown by the lower chlorophyll-a concentrations. Nutrient uptake from the epilimnion was also observed in Platanovrisi but to a lesser extent (e% = 9.9–503 for silicates and TSS, respectively). More systematic sampling performed by Sylaios et al. [67] in Platanovrisi reservoir led to similar conclusion.
e% = (x hypolimnion − x epilimnion) × 100/x epilimnion
The high ammonium concentrations measured in both reservoirs during fall spill conditions (Table 4) result from limited vertical mixing due to summer thermal stratification developed in Thissavros, and the bottom anoxic conditions prevailed in Platanovrisi. Despite the relatively high DO values measured in Thissavros during fall 2006, the reservoir experienced a long stratification period from June to September 2006, characterized by limited bottom DO concentrations. The so-called near-bottom hypoxia (or anoxia) layer appeared in almost all temperate reservoirs as result of restricted vertical mixing due to thermal stratification and the decomposition of organic matter supplied by the surface layer [8,29,64]. According to [29], denitrification processes prevailed at low oxygen environments, and nitrates are transformed to organic nitrogen and ammonium, thus explaining the elevated bottom concentrations of ammonium in conjunction to the low nitrate levels. As Ludwig et al. [14] note, this unstable nitrogen compound stabilizes at anoxic environments. The vertical mixing caused by the thermal stratification breakdown during fall, combined with the water level decrease in Thissavros was crucial to the ammonium redistribution over the entire water column. As for Platanovrisi, thermal stratification persisted at 55 m depth, preventing ammonium homogenization (Table 4, Figure 4b). This condition, combined with bottom anoxia led to the ammonium increase in Platanovrisi. During spring 2007 vertical mixing processes resulted in ammonium reduction at the bottom of this reservoir (Table 4, Figure 4c).
DIP seem to be more abundant in Platanovrisi during summer and fall (spill regime) and less during spring (fill phase), indicating the dependence of Platanovrisi phosphates concentration on the Thissavros water levels. Paraskevopoulos and Georgiadis [68] reported that the water level fluctuation in the reservoir system occurs primarily in Thissavros, while Platanovrisi’s role apart from power production is the discharge stabilization to the downstream part. During the water release phase from Thissavros, phosphates are handily transported to Platanovrisi and from there to the downstream part. This incident is related to the decreased water residence time in Thissavros (progressively from 222 days in early summer to 91 days during fall) and the increased phosphate fluxes towards Platanovrisi. The maximum concentration found at 65 m depth in Platanovrisi during fall 2006 (7.2 µM/L) was related to bottom anoxia. As Soltero et al. [69] and Andersen [70] reported, the anoxic conditions manifested inside reservoirs during the summer-fall period under intense stratification favour the re-mineralization of particulate phosphorus. In contrast, the spring water retention regime led to phosphate trapping in Thissavros and resulted in the low concentrations in Platanovrisi reservoir (Table 4). The dependence of the dissolved phosphorus values on the water level was also observed by Tang et al. [71] for the Three Gorges Reservoir.
As for silicates, significant stratification was observed only in Thissavros during summer (e% = 1426), while Platanovrisi presented almost uniform silicate levels in the water column in all the examined cases (Table 4). As Skoulikidis et al. [72] note, Nestos water belongs to the silicate hydrochemical type category because of the silicate rocks that form its basin. Geologically, the wider area is formed from metamorphic rocks, mainly of gneisses, schists with marble intercalations, where granite penetrations and volcanic ouflows are encountered [46]. The above are enrich water in silica and for this reason silicate concentrations were found elevated in both reservoirs, as well as in the main river bed.
4.3. The Impact of Dams on Nestos River Nutrient Fluxes
As seen from the results, DIP concentration depicted almost similar values at the dams’ system entrance and exit; however, phosphate fluxes increased downstream due to the higher freshwater fluxes (Table 5). Downstream DIP fluxes appeared decreased only in spring, a period in which Nestos River water stored into the reservoir system. DIP mobilization throughout the dam system monitored in this work appears in agreement with the results presented by many authors. Wu and Huh [73] examined the behaviour of five reservoirs (two in Red River, two in Yangtze and one in Yellow River) and concluded that the removing mechanisms of DIP from the water column, such as uptake by organisms and clinging to suspended particles, do not affect phosphorus fluxes downstream. The same conclusion announced by Morais et al. [32] for Guadiana River (Portugal), while Teodorou and Wehrli [35] found no significant difference for DIP fluxes to and from the Iron Gate I dam in Danube River. Powers et al. [58] found that 4 out of 14 examined reservoirs in the US acted as phosphorus source, due to the mobilization of the stored phosphorus probably after the exceedance of internal P capacity. As can be seen in Table 4, DIP displayed equal distribution in both reservoirs for almost all the examined cases. DSi presented similarities with DIP, and trapped in the reservoir system only during the spring fill phase.
Simultaneously, all reservoirs presented DIN net losses by 20% compared to DIN-inputs due to denitrification or sink, leading to reduced downstream N-loading. TSS loads appeared always trapped inside the reservoirs, regardless of the man-regulated flow regime. According to several authors, TSS diminution downstream of the dams results from water speed reduction and increased resident time [35,74]. For this study, the water’s speed entering Thissavros marked an average reduction of 82.6%, compared to the upstream part, while additional reduction was measured inside Thissavros (96.4%). The concentrations of suspended solids downstream of Platanovrisi reservoir is nearly zero, and this retention may contribute to the erosion phenomena observed along the western part of the coastline west at the Nestos River mouth [75].
4.4. The Impact of Dams on Nestos River Stoichiometry
The segmentation of Nestos River and the conditions prevailed inside the reservoir resulted to stoichiometric shifts in the downstream part. The most affected ratio was the N:P, while Si:N was usually above unity and Si:P above 24, thus silicates were always in excess with a single exception occurred during fall. It appears that Nestos release policy resulted in DIN limitation downstream. Stoichiometric alterations were also observed in other fragmented rivers [7,76,77] and regarded as a severe negative effect for riverine ecosystems since it usually results to trophic status and food web structure alterations [78,79]. However, in the case of Yarlung Tsangpo River no significant alterations in the community structure of bacterioplankton between upstream and downstream were observed, despite the retention of nutrients inside the reservoir [80]. The dominance of siliceous at the expense of non-siliceous algae depends on Si availability relative to N and P [81]. Fortunately, DSi was always found in excess throughout the main riverbed due to its silica-based hydrochemical nature [72].
5. Conclusions
We believe that this work is able to answer the questions that were placed initially regarding the examination of the response of the lower reaches to the construction of the dams in terms of hydrology, hydrochemistry and stoichiometry and the investigation of the water quality alterations inside both dams due to seasonality and climatic conditions. Thissavros and Platanovrisi hydroelectric dams’ operation resulted in Nestos River segmentation into three sections, the upstream lentic, the lotic environment of the reservoirs and the downstream lentic section. It appears that significant differences occur in the downstream part related to the upstream for DIN and TSS concentrations, as they are trapped into the reservoir system. DIP concentrations were not affected by the dams’ operation, while DSi was more abundant downstream because of the silicate hydrochemical nature of Nestos.
The fluxes examination, which includes the water release policy followed by the dam complex managing authority and the new hydrological regime based on energy production needs, is a more comprehensive approach to clarify the differences between the upstream and downstream parts. Ιt appears that DIN and TSS were retained in the reservoirs even under water release regime, while the downstream DIP and DSi fluxes reduction occurred only under the water retention regime during spring.
Inside the reservoirs, the thermal stratification detected in summer and fall induced anoxic conditions mainly at the bottom of Platanovrisi. Simultaneously, chemical stratification and bottom accumulation were observed in both reservoirs, but it was more pronounced in Thissavros, which is considered more eutrophic. Due to anoxic conditions, the conversion of nitrates to ammonia and DIP resuspension from the bottom sediment was observed. The abundance of DIP in Platanovrisi reservoir is affected by the water release policy and depended on Thissavros water level fluctuation.
Despite the information provided by this project, several gaps need to be filled in order to understand the extent of the problem adequately. For example, a large part of Thissavros reservoir has not been covered due to its large area. As we approach the dam itself, the situation may significantly change in the water column and at the bottom layer. Furthermore, more surveys are required throughout the year to assess the situation in the remaining months, and additional data is needed for the detailed description of the nutrient transportation through the dam complex in the future.
Author Contributions
Conceptualization, G.S. and N.K.; methodology, N.K. and G.S.; validation, N.K., A.S. and G.S.; formal analysis, N.K. and G.S.; investigation, G.S. and N.K.; resources, G.S., E.K., N.K. and A.S.; data curation, N.K., E.K. and G.S.; writing—original draft preparation, N.K. and G.S.; writing—review and editing, E.K., G.S., N.K. and A.S.; visualization, N.K. and A.S.; supervision, G.S. and E.K. All authors have read and agreed to the published version of the manuscript.
Funding
This research received no external funding.
Institutional Review Board Statement
Not applicable.
Informed Consent Statement
Not applicable.
Data Availability Statement
Not applicable.
Acknowledgments
The authors would like to appreciate the PPC personnel for their help during the samplings.
Conflicts of Interest
The authors declare no conflict of interest.
References
- Syvitski, J.P.M.; Peckham, S.D.; Hilberman, R.; Mulder, T. Predicting the terrestrial flux of sediment to the global ocean: A planetary perspective. Sediment. Geol. 2003, 162, 5–24. [Google Scholar] [CrossRef]
- Froelich, P.N.; Bender, M.L.; Luedtke, N.A.; Heath, G.R.; Devries, T. The marine phosphorus cycle. Am. J. Sci. 2003, 282, 474–511. [Google Scholar] [CrossRef]
- Howarth, R.W.; Jensen, H.S.; Marino, R.; Postma, H. Transport to and processing of P in nearshore and oceanic waters. In Phosphorus in the Global Environment; Tiessen, H., Ed.; John Wiley & Sons Ltd.: New York, NY, USA, 1995; pp. 323–346. [Google Scholar]
- National Research Council. Clean Coastal Waters: Understanding and Reducing the Effects of Nutrient Pollution; The National Academic Press: Washington, DC, USA, 2000.
- Grill, G.; Lehner, B.; Lumsdon, A.E.; MacDonald, G.K.; Zarfl, C.; Liermann, C.R. An index-based framework for assessing patterns and trends in river fragmentation and flow regulation by global dams at multiple scales. Environ. Res. Lett. 2015, 10. [Google Scholar] [CrossRef]
- Zarfl, C.; Lumsdon, A.E.; Berlekamp, J.; Tydecks, L.; Tockner, K. A global boom in hydropower dam construction. Aquat. Sci. 2015, 77, 161–170. [Google Scholar] [CrossRef]
- Van Cappellen, P.; Maavara, T. Rivers in the Anthropocene: Global scale modifications of riverine nutrient fluxes by damming. Ecohydrol. Hydrobiol. 2016, 16, 106–111. [Google Scholar] [CrossRef] [Green Version]
- Maavara, T.; Parsons, C.T.; Ridenour, C.; Stojanovic, S.; Dürr, H.H.; Powley, H.R.; Van Cappellen, P. Global phosphorus retention by river damming. Proc. Natl. Acad. Sci. USA 2015, 112, 15603–15608. [Google Scholar] [CrossRef] [PubMed] [Green Version]
- Vörösmarty, C.J.; Meybeck, M.; Fekete, B.; Sharma, K.; Green, P.; Syvitski, J.P. Anthropogenic sediment retention: Major global impact from registered river impoundments. Glob. Planet Change 2003, 39, 169–190. [Google Scholar] [CrossRef]
- Wollheim, W.M.; Vörösmarty, C.J.; Bouwman, A.F.; Green, P.; Harrison, J.; Linder, E.; Syvitski, J.P. Global N removal by freshwater aquatic systems using a spatially distributed, within-basin approach. Global Biogeochem. Cycles 2008, 22. [Google Scholar] [CrossRef] [Green Version]
- Margat, J. L’eau des Méditerranéens: Situation et Perspectives, French ed.; L’Harmattan: Paris, France, 2008. [Google Scholar]
- Ludwig, W.; Bouwman, A.F.; Dumont, E.; Lespinas, F. Water and nutrient fluxes from major Mediterranean and Black Sea rivers: Past and future trends and their implications for the basin-scale budgets. Global Biogeochem. Cycles 2010, 24. [Google Scholar] [CrossRef]
- Sadaoui, M.; Ludwig, W.; Bourrin, F.; Romero, E. The impact of reservoir construction on riverine sediment and carbon fluxes to the Mediterranean Sea. Prog. Oceanogr. 2018, 163, 94–111. [Google Scholar] [CrossRef]
- Ludwig, W.; Dumont, E.; Meybeck, M.; Heussner, S. River discharges of water and nutrients to the Mediterranean and Black Sea: Major drivers for ecosystem changes during past and future decades? Progr. Oceanogr. 2009, 80, 199–217. [Google Scholar] [CrossRef]
- Magilligan, F.J.; Nislow, K.H. Changes in hydrologic regime by dams. Geomorphology 2005, 71, 61–78. [Google Scholar] [CrossRef]
- Graf, W.L. Downstream hydrologic and geomorphic effects of large dams on American rivers. Geomorphology 2006, 79, 336–360. [Google Scholar] [CrossRef]
- Zeilhofer, P.; Moura, R.M. Hydrological changes in the northern Pantanal caused by the Manso dam: Impact analysis and suggestion for mitigation. Ecol. Eng. 2009, 35, 105–117. [Google Scholar] [CrossRef]
- García, A.; Jorde, K.; Habit, E.; Caamaño, D.; Parra, O. Downstream environmental effects of dam operations: Changes in habitat quality for native fish species. River Res. Appl. 2011, 27, 312–327. [Google Scholar] [CrossRef]
- Tena, A.; Batalla, R. The sediment budget of a large river regulated by dams (the lower river Ebro, NE Spain). J. Soils Sediments 2013, 13, 966–988. [Google Scholar] [CrossRef]
- Zuijdgeest, A.; Wehrli, B. Carbon and nutrient fluxes from floodplains and reservoirs in the Zambezi basin. Chem. Geol. 2017, 467, 1–11. [Google Scholar] [CrossRef] [Green Version]
- Ward, J.V.; Stanford, J.A. The serial discontinuity concept: Extending the model to floodplain rivers. Regul River Res. Manag. 1995, 10. [Google Scholar] [CrossRef]
- Tena, A.; Batalla, R.J.; Vericat, D.; López-Tarazón, J.A. Suspended sediment dynamics in a large regulated river over a 10-year period (the lower Ebro, NE Iberian Peninsula). Geomorphology 2011, 125, 73–84. [Google Scholar] [CrossRef]
- Hupp, C.R.; Schenk, E.R.; Richter, J.M.; Peet, R.K.; Townsend, P.A. Bank erosion along the dam-regulated lower Roanoke River, North Carolina. In Management and Restoration of Fluvial Systems with Broad Historical Changes and Human Impacts; James, L.A., Rathburn, S.L., Whittecar, G.R., Eds.; Geological Society of America Special Paper: Boulder, CO, USA, 2009; pp. 97–108. [Google Scholar]
- Li, M.; Xu, K.; Watanabe, M.; Chen, Z. Long-term variations in dissolved silicate, nitrogen and phosphorus flux from the Yangtze River into East China Sea and impacts on estuarine ecosystems. Estuar. Coast Shelf S. 2007, 71, 3–12. [Google Scholar] [CrossRef]
- Wang, Z.Y.; Li, Y.; He, Y. Sediment budget of the Yangtze River. Water Resour. Res. 2007, 44. [Google Scholar] [CrossRef] [Green Version]
- Daniels, R.A.; Limburg, K.E.; Schmidt, R.E.; Strayer, D.L.; Chambers, R.C. Changes in fish assemblages in the Tidal Hudson River, New York. In Historical Changes in Large River Fish Assemblages of the Americas; Rinne, J.N., Hughes, R.M., Calamusso, B., Eds.; American Fisheries Society: Bethesda, MA, USA, 2005; Volume 45, pp. 471–503. [Google Scholar]
- Haponski, A.E.; Marth, T.A.; Stepien, C.A. Genetic Divergence across a Low-head Dam: A Preliminary Analysis using Logperch and Greenside Darters. J. Great Lakes Res. 2007, 33, 117–126. [Google Scholar] [CrossRef]
- Koutrakis, E.T.; Sapounidis, A.; Apostolou, A.; Vassilev, M.; Pehlivanov, L.; Leontarakis, P.; Tsekov, A.; Sylaios, G.; Economidis, P.S. An Integrated ichthyofaunal survey in a heavily-modified, cross-border watershed. J. Biol. Res. 2013, 20, 326–338. [Google Scholar]
- Nakashima, S.; Yamada, Y.; Tada, K. Characterization of the water quality of dam lakes on Shikoku Island, Japan. Limnology 2007, 8, 1–22. [Google Scholar] [CrossRef]
- Koiv, T.; Noges, T.; Laas, A. Phosphorus retention as a function of external loading, hydraulic turnover time, area and relative depth in 54 lakes and reservoirs. Hydrobiologia 2011, 660, 105–115. [Google Scholar] [CrossRef]
- Yuan, H.-Z.; Shen, J.; Liu, E.-F.; Wang, J.-J.; Meng, X.-H. Assessment of nutrients and heavy metals enrichment in surface sediments from Taihu Lake, a eutrophic shallow lake in China. Environ. Geochem. Hlth. 2011, 33, 67–81. [Google Scholar] [CrossRef]
- Morais, P.; Chícharo, M.A.; Chícharo, L. Changes in a temperate estuary during the filling of the biggest European dam. Sci. Total Environ. 2009, 407, 2245–2259. [Google Scholar] [CrossRef] [PubMed]
- Fonseca, R.; Canário, T.; Morais, M.; Barriga, F.J.A.S. Phosphorus sequestration in Fe-rich sediments from two Brazilian tropical reservoirs. App. Geochem. 2011, 26, 1607–1622. [Google Scholar] [CrossRef]
- Ammar, R.; Kazpard, V.; Wanze, M.; El Samrani, A.G.; Amacha, N.; Saad, Z.; Chou, L. Reservoir sediments: A sink or source of chemicals at the surface water-groundwater interface. Environ. Monit. Assess. 2015, 187, 1–20. [Google Scholar] [CrossRef]
- Teodorou, C.; Wehrli, B. Retention of sediments and nutrients in the Iron Gate I Reservoir on the Danube River. Biochem. US 2005, 76, 539–565. [Google Scholar] [CrossRef]
- Seitzinger, S.P.; Styles, R.V.; Boyer, E.W.; Alexander, R.B.; Billen, G.; Howarth, R.W.; Mayer, B.; Van Breemen, N. Nitrogen retention in rivers: Model development and application to watersheds in the northeastern USA. Biochemistry 2002, 57, 199–237. [Google Scholar]
- Tomaszek, J.A.; Koszelnik, P. A simple model of nitrogen retention in reservoirs. Hydrobiologia 2003, 504, 51–58. [Google Scholar] [CrossRef]
- Powers, S.M.; Tank, J.L.; Robertson, D.M. Control of nitrogen and phosphorus transport by reservoirs in agricultural landscapes. Biochem. US 2015, 124, 417–439. [Google Scholar] [CrossRef]
- Cao, Z.; Zhang, X.; Ai, N. Effect of sediment on concentration of dissolved phosphorus in the Three Gorges Reservoir. Int. J. Sediment Res. 2011, 26, 87–95. [Google Scholar] [CrossRef]
- Zhang, M.; Xu, Y.; Shao, M.; Cai, Q. Sedimentary nutrients in the mainstream and its five tributary bays of a large subtropical reservoir (Three Gorges Reservoir, China). Quat. Int. 2012, 282, 171–177. [Google Scholar] [CrossRef]
- Camargo, J.A.; Alonso, Á.; De la Puente, M. Eutrophication downstream from small reservoirs in mountain rivers of Central Spain. Water Res. 2005, 39, 3376–3384. [Google Scholar] [CrossRef]
- Nukazawa, K.; Kihara, K.; Suzuki, Y. Negligible contribution of reservoir dams to organic and inorganic transport in the lower Mimi River, Japan. J. Hydrol. 2017, 555, 288–297. [Google Scholar] [CrossRef]
- Petalas, C.; Pliakas, F.; Diamantis, I.; Kallioras, A. Development of an integrated conceptual model for the rational management of the transboundary Nestos River, Greece. Environ. Geol. 2005, 48, 941–954. [Google Scholar] [CrossRef]
- Boskidis, I.; Gikas, G.D.; Sylaios, G.K.; Tsihrintzis, V.A. Hydrologic and water quality modeling of lower Nestos river basin. Water Res. Manag. 2012, 26, 3023–3051. [Google Scholar] [CrossRef]
- Darakas, E. The transboundary River Nestos and its water quality assessment: Cross-border cooperation between Greece and Bulgaria. Environmentalist 2002, 22, 367–375. [Google Scholar] [CrossRef]
- Sylaios, G.; Burnaski, E. The transboundaryNestos/Mesta River: An overview on hydrology and environment. In Atlas of River Nestos Fish Fauna; Economidis, P.S., Koutrakis, M., Apostolou, A., Vassilev, M., Pehlivanov, L., Eds.; Prefectural Authority of Drama-Kavala-Xanthi, NAGREF-Fisheries Research Institute and Bulgarian Academy of Sciences: Kavala, Greece, 2009; pp. 27–40. [Google Scholar]
- Psilovikos, A.; Margoni, S.; Psilovikos, A. Simulation and trend analysis of the water quality monitoring daily data in Nestos River delta. Contribution to the sustainable management and results for the years 2000–2002. Environ. Monit. Assess. 2006, 116, 543–562. [Google Scholar] [CrossRef] [PubMed]
- Ganoulis, J.; Skoulikaris, H.; Monget, J.M. Involving stakeholders in transboundary water resource management: The Mesta/Nestos ‘HELP’ basin. In Proceedings of Internationlal Symposiuim ‘HELP in Action: Local Solutions to Global Water Problems, Lessons from the South; Water Research Commision: Johannesbourg, South Africa, 2008. [Google Scholar]
- Koutroumanidis, T.; Sylaios, G.; Zafeiriou, E.; Tsihrintzis, V.A. Genetic modeling for the optimal forecasting of hydrologic time-series: Application in Nestos River. J. Hydrol. 2009, 368, 156–164. [Google Scholar] [CrossRef]
- Parsons, T.R.; Maita, Y.; Lalli, C.M. A Manual of Chemical and Biological Methods for Seawater Analysis; Pergamon Press: Oxford, UK, 1984. [Google Scholar]
- American Public Health Association (APHA). Standard Methods for the Examination of Water and Wastewater, 20th ed.; American Public Health Association, American Water Works Association and Water Environmental Federation: Washington, DC, USA, 1998. [Google Scholar]
- Skoulikaris, H.H. Mathematical Simulation for the Sustainable Management of Water Resources Projects in Watershed Scales. The Case of River Nestos. Ph.D. Thesis, Department of Civil Engineering, Hydraulics and Environmental Engineering Division, Aristotle University of Thessaloniki, Thessaloniki, Greece, 2008; p. 297. [Google Scholar]
- Baxter, R.M. Environmental effects of dams and impoundments. Annu. Rev. Ecol. Syst. 1977, 8, 255–283. [Google Scholar] [CrossRef]
- Richter, A.; Kolmes, S.A. Maximum temperature limits for Chinook, coho, and chum salmon, and steelhead trout in the Pacific Northwest. Rev. Fish. Sci. 2005, 13, 23–49. [Google Scholar] [CrossRef]
- McCullough, D.A.; Bartholow, J.M.; Jager, H.I.; Beschta, R.L.; Cheslak, E.F.; Deas, M.L.; Embersole, J.L.; Foott, J.S.; Johnson, S.L.; Marine, K.R.; et al. Research in thermal biology: Burning questions for coldwater stream fishes. Rev. Fish Sci. 2009, 17, 90–115. [Google Scholar] [CrossRef]
- Paul, L. Nutrient elimination in pre-dams: Results on long term studies. Hydrobiologia 2003, 504, 289–295. [Google Scholar] [CrossRef]
- Hu, W.-W.; Wang, G.-X.; Deng, W.; Li, S.-N. The influence of dams on ecological conditions in the Huaihe River basin, China. Ecol. Eng. 2008, 33, 233–241. [Google Scholar] [CrossRef]
- Wang, F.; Yu, Y.; Liu, C.; Wang, B.; Wang, Y.; Guan, J.; Mei, H. Dissolved silicate retention and transport in cascade reservoirs in Karst area, Southwest China. Sci. Total Environ. 2010, 408, 1667–1675. [Google Scholar] [CrossRef]
- Brown, J.B.; Sprague, L.A.; Dupree, J.A. Nutrient Sources and Transport in the Missouri River Basin, with Emphasis on the Effects of Irrigation and Reservoirs. J. Am. Water. Resour. Assoc. 2011, 47, 1034–1060. [Google Scholar] [CrossRef] [Green Version]
- Kunz, M.J.; Wüest, A.; Wehrli, B.; Landert, J.; Senn, D.B. Impact of a large tropical reservoir on riverine transport of sediment, carbon, and nutrients to downstream wetlands. Water Resour. Res. 2011, 47. [Google Scholar] [CrossRef] [Green Version]
- Fantin-Cruz, I.; Pedrollo, O.; Girard, P.; Zeilhofer, P.; Hamilton, S.K. Changes in river water quality caused by a diversion hydropower dam bordering the Pantanal floodplain. Hydrobiologia 2016, 768, 223–238. [Google Scholar] [CrossRef]
- Koszelnik, P.; Tomaszek, J. The influence of reservoir morphometry on nitrogen retention. Wit. Trans. Ecol. Envir. 2003, 60, 261–270. [Google Scholar]
- Sferratore, A.; Garnier, J.; Billen, G.; Conley, D.; Pinault, S. Silica diffuse and point sources in the Seine watershed. Environ. Sci. Technol. 2006, 40, 6630–6635. [Google Scholar] [CrossRef]
- Eiriksdottir, E.S.; Oelkers, E.H.; Hardardottir, J.; Gislason, S.R. The impact of damming on riverine fluxes to the ocean: A case study from Eastern Iceland. Water Res. 2017, 113, 124–138. [Google Scholar] [CrossRef] [PubMed]
- Zhu, J.; Li, S.; Wang, Y.; Yan, H.; Liao, L.; Zhong, J. Spatial characters of nutrients in Wujiangdu Reservoir in karst rivers, SW China. Acta Geochim. 2017, 36, 605–610. [Google Scholar] [CrossRef]
- Rangel, L.M.; Silva, L.H.; Rosa, P.; Roland, F.; Huszar, V.L.M. Phytoplankton biomass is mainly controlled by hydrology and phosphorus concentrations in tropical hydroelectric reservoirs. Hydrobiologia 2012, 693, 13–28. [Google Scholar] [CrossRef]
- Sylaios, G.; Tsolkas, S.; Kamidis, N.; Boskidis, I.; Tsihrintzis, V.A. Temporal variability of water quality of Platanovrysi Reservoir, Related to Stratification/Mixing Conditions. In Proceedings of the 2nd Environmental Management, Engineering, Planning and Economics (CEMEPE) & SECOTOX Conference, Mykonos, Greece, 21–29 June 2009; p. 95. [Google Scholar]
- Paraskevopoulos, G.; Georgiadis, A. A Pilot Study of Water System Declaration as Heavily Modified; The Case of Nestos River; Public Power Corporation, Directory for the Development of Hydraulic Works: Athens, Greek, 2001. (In Greek) [Google Scholar]
- Soltero, R.A.; Gasperino, A.F.; Graham, W.G. Chemical and physical characteristics of a eutrophic reservoir and its tributaries: Long Lake, Washington: II. Water Res. 1975, 9, 1059–1064. [Google Scholar] [CrossRef]
- Andersen, J.M. Effect of nitrate concentration in lake water on phosphate release from the sediment. Water Res. 1982, 16, 1119–1126. [Google Scholar] [CrossRef]
- Tang, J.; Wang, T.; Zhu, B.; Zhao, P.; Xiao, Y.; Wang, R. Tempo-spatial analysis of water quality in tributary bays of the Three Gorges Reservoir region (China). Environ. Sci. Pollut. Res. 2015, 22, 16709–16720. [Google Scholar] [CrossRef]
- Skoulikidis, N.T. The environmental state of rivers in the Balkans–A review within the DPSIR framework. Sci. Total Environ. 2009, 407, 2501–2516. [Google Scholar] [CrossRef]
- Wu, L.; Huh, Y. Dissolved reactive phosphorus in large rivers of East Asia. Biochem. US 2007, 85, 263–288. [Google Scholar] [CrossRef]
- Phillips, J.D.; Slattery, M.C.; Musselman, Z.A. Dam-to-delta sediment inputs and storage in the lower trinity river, Texas. Geomorphology 2004, 62, 17–34. [Google Scholar] [CrossRef]
- Samaras, A.G.; Koutitas, C.G. Modelling the impact of coastal morphology of the water management in transboundary river basins. The case of River Nestos. Manag. Environ. Qual. Int. J. 2008, 19, 455–466. [Google Scholar] [CrossRef]
- Duan, S.; Xu, F.; Wang, L.-J. Long-term changes in nutrient concentrations of the Changjiang River and principal tributaries. Biogeochemistry 2007, 85, 215–234. [Google Scholar] [CrossRef]
- Wang, F.; Wang, B.; Liu, C.Q.; Liu, X.; Gao, Y.; Zhang, J.; Li, S. Changes in nutrient ratios and phytoplankton community structure caused by hydropower development in the Maotiao River, China. Environ. Geochem. Health 2014, 36, 595–603. [Google Scholar] [CrossRef] [PubMed]
- Turner, R.E.; Rabalais, N.N.; Justic, D.; Dortch, Q. Global patterns of dissolved N, P and Si in Large Rivers. Biogeochemistry 2003, 64, 297–317. [Google Scholar] [CrossRef]
- Hein, M.; Riemann, B. Nutrient limitation of phytoplankton biomass or growth rate: An experimental approach using marine enclosures. J. Exp. Mar. Bio. Ecol. 1995, 188, 167–180. [Google Scholar] [CrossRef]
- Wang, P.; Wang, X.; Wang, C.; Miao, L.; Hu, J.; Yuan, Q. Shift in bacterioplankton diversity and structure: Influence of anthropogenic disturbances along the Yarlung Tsangpo River on the Tibetan Plateau, China. Sci. Rep. 2017, 7. [Google Scholar] [CrossRef]
- Garnier, J.; Beusen, A.; Thieu, V.; Billen, G.; Bouwman, L. N:P:Si nutrient export ratios and ecological consequences in coastal seas evaluated by the ICEP approach. Glob. Biogeochem. Cycles 2010, 24. [Google Scholar] [CrossRef]
Publisher’s Note: MDPI stays neutral with regard to jurisdictional claims in published maps and institutional affiliations. |
© 2021 by the authors. Licensee MDPI, Basel, Switzerland. This article is an open access article distributed under the terms and conditions of the Creative Commons Attribution (CC BY) license (https://creativecommons.org/licenses/by/4.0/).