Article

Effect of Climate Change on a Monolithic Desulphurized Tailings Cover

1
Department of Civil Engineering, York University, Toronto, ON M3J 1P3, Canada
2
Department of Civil Engineering, Royal Military College, Kingston, ON K7K 7B4, Canada
*
Author to whom correspondence should be addressed.
Water 2020, 12(9), 2645; https://doi.org/10.3390/w12092645
Submission received: 13 August 2020 / Revised: 9 September 2020 / Accepted: 13 September 2020 / Published: 22 September 2020
(This article belongs to the Section Hydrology)

Abstract

:
A soil cover system can be viewed as a thin interface placed between the atmosphere and the underlying waste. Climate is a primary design variable in soil cover design; therefore, climate change poses a number of challenges to design, operation and long-term performance of covers. In this research climate change effects on the hydraulic behavior of soil covers at a Northern Ontario, Canada site were assessed. Covers were analyzed using historical and future climate datasets. Historical climate data were compiled from an Environment Canada weather station near the site. The future climate datasets were sourced for different Global Circulation Models (GCM) for various representative concentration pathways (RCP). The covers at the site were constructed with a single layer of desulphurized tailings. Soil covers were meant to limit oxygen ingress to the underlying reactive tailings by maintaining high water saturation in the covers. Oxygen flux through soil covers for current and future climates were predicted using variably saturated water flow and oxygen transport modeling using the finite element method. The results of this research indicate that the effect of climate change on soil cover depends on the hydraulic properties of the soil cover materials and that of the underlying tailings. The results of this study suggest that the effect of climate change on the coarse tailing covers could be marginal resulting in a maximum increase of 5% in oxygen flux at the cover surface for the future climates in comparison to the base climate. However, in the case of fine tailings covers, increases of up to 65% can be expected.

1. Introduction

The generation of acid mine drainage (AMD) from sulphide enriched tailings has been a significant environmental challenge within mining industries related to hard rock [1]. The sulphide mineral of heavy metals (e.g., iron, copper, gold, etc.) in the rock has the potential to react with oxygen and water. This reaction not only results in the tailings exhibiting acidic behavior, but also increases the concentration of soluble metals. Leachate produced from acidic tailings can potentially contaminate the surrounding surface and/or groundwater. Therefore, intervention is needed to avoid adding such contaminants to the environment [2,3].
By limiting the supply of oxygen to the reactive tailings, one can control the production of AMD and thus reduce the risk. This risk can be further reduced if multiple strategies are used in an effective manner to limit the oxidation of the sulphide mineral. One way to limit the supply of oxygen is to place a layer of water (water cover) either by flooding it or depositing the reactive tailings material under water (subaqueous deposition). The rate of oxygen diffusion in water is four order magnitudes lower than that in air and solubility of oxygen in water is quite low (11 mg/L at 20 °C). Therefore, the water layer acts as a barrier and in the absence of convection; the rate of oxygen diffusion through water is too slow to be of any significance to sulphide mineral oxidation [4]. However, use of water covers results in increased percolation rates, and requires that operators follow stringent environmental regulations for their design and construction [5]. Another limitation of water covers is its lack of physical stability over a long period of time, and in many instances, the water cover discharge will require treatment to meet regulatory standards [4,6].
The alternative to a water cover is to create a disconnect between the tailings and atmospheric oxygen by placing a soil cover over the reactive tailings. The soil cover, also referred to as a dry cover, reduces the oxygen supply to the underlying tailings by providing a moisture barrier. Engineered soil covers with saturated fine gained material can be used effectively to limit the oxygen transport due to their potential to maintain high saturation. Other important purposes of dry covers can be to limit water percolation into the tailings and thereby reducing the amount of acid water formation and reclaiming the tailings management area for other uses by revegetating the cover surface.
The elevated water table control technique has also been used to reduce the generation of AMD over a long periods of time [1,7,8]. This technique involves raising the water level in the tailings management facility so that tailings remain in the saturated or nearly saturated state with little ingress of oxygen. The three approaches to raise the elevation of water table and associated capillary fringe in the tailings are: constructing water flow barriers within the tailings, increasing the water retention properties of the tailings, and modifying the water balance of the tailings [9]. The water balance of the tailings can be modified by increasing the water input to the tailings. Soil covers constructed of coarse grained materials with low retention and high conduction properties increase the infiltration of meteoric water and act as good evaporation barrier to maintain or elevate the water table [6,10].
The tailing facilities are generally spread over a large area ranging in tens of hectares to more than a few hundred hectares [2]. Construction of a soil cover with considerable thickness (one meter to a few meters) over such large areas requires a substantial volume of material. Acquisition and hauling this soil to site could cost significantly. The concept of using processed tailing materials as the cover layer material alleviates significant costs associated with soil cover construction. The tailings are normally processed through floatation. The key aspect for the processing of the sulphide tailings is to reduce the concentration of sulphide mineral to a certain level that they start behaving as inactive material [1,2].
Oxygen transport in the soil cover normally occurs through molecular diffusion [11,12]. When saturation in the soil cover is less than 85%, the movement of oxygen through the soil cover can occur freely in gaseous phase. Once the saturation is more than 85%, most of the air-filled voids are replaced with water, and air becomes occluded. Under such conditions, the movement of oxygen takes place through water filled pores and oxygen transport becomes extremely slow due to lower rate of diffusion in water. Therefore, in order to expect the cover to effectively limit the oxygen movement, the saturation level of the cover should be kept at higher levels (between 85 to 95%) [11].
Cover objectives are site specific but generally include dust and erosion control, control of oxygen ingress, control of contaminant release by infiltration reduction, minimization of radon emission from radioactive tailings, and providing a growth medium for vegetation [13]. As most of these objectives are related to the water balance at cover surface therefore, climate is a primary design variable in any soil cover system. In addition, soil covers must be designed for long-term or perpetual containment of the waste. Therefore, climate change poses a number of challenges to the design, operation and long-term performance of covers [14]. The loss of performance due to climate change might be in terms of increased ingress of water into the underlying waste or erosion of the cover to support vegetation due to increase in amount and intensity of the precipitation. Similarly, drought conditions compounded with increased temperatures could result in lower saturation in the cover resulting in increased oxygen ingress to reactive tailings or deterioration of hydro mechanical cover material properties affecting performance. The covers that are more prone to climate change effects are store-and-release covers or covers that rely on permafrost for their performance [15]. Although climate change is a real threat to the design, maintenance, and long-term performance of soil covers, there are few studies found in the peer-reviewed literature. The cold regions cover system design technical guidance document published in MEND (2012) [16] clearly states that cover designs should be based on evaluating the potential effect of climate changes and understanding the potential for change in cover material properties on a 100-year basis. However, the document does not provide any specifics and there is no evidence in peer-reviewed literature that any analysis or design of this type has ever been carried out.
In order to evaluate the long-term performance of soil covers and their sustainability, it is important to examine their response under future climate conditions. In the past, much emphasis has been given to evaluate the cover performance using historical climate records. Such studies do not take into account the probable climate change effects and may not be reflective of long term cover performance. Recently, Shurnik et al. (2012) evaluated the performance of soil covers for both historical and future climate for a site near Perth, Australia [17]. However, the scope of the study was limited and no other studies that quantify the effect of climate change on soil covers can be found in the peer reviewed literature.
The objective of this research was to assess the effects of changing climate on various configurations of tailing covers at Detour Lake mine, Ontario, Canada. Major emphasis is on evaluation of hydrological behavior and performance assessment in terms of oxygen transport using numerical modelling techniques. To achieve the set objective, records for past and future climates were compiled and classified. Future climate data from various climate change scenarios were compared to historical climate data to identify the scenarios for which most detrimental effects on cover performance can be expected. Soil atmosphere modelling was carried out using generalized soil profiles representing the site conditions. Modeling was carried out using VADOSE/W, a variably saturated flow and transport code capable of simulating the interaction between the soil cover and atmosphere. The tailing covers of various configurations of fine and coarse materials were modelled for past and future climates, and the cover performance is assessed based on its ability to control the oxygen ingress to reactive tailings.

2. Theoretical Background

Oxygen generally transports through the soil covers to the underlying tailings by the processes of advection and diffusion. Additionally, dissolved oxygen can also be transported to the tailings through water infiltration. However, the main transport process responsible for the movement of oxygen through soil covers is diffusion [2].
The oxygen transport through reactive tailings can be modeled using modified Fick’s second law which can be described as follows [18];
t ( n e q C ) = y ( D e C y ) K r C
where C shows the concentration of oxygen in the pore air (kg/m3), n e q is the equivalent diffusion porosity defined as θ a +   H θ , θ a is the air filled porosity or volumetric air content (m3/m3), θ is the water filled porosity or volumetric water content (m3/m3), H is a dimensionless form of Henry’s equilibrium constant, generally taken as 0.028 at 25 °C (°C), D e is the effective diffusion coefficient (m2/s), K r is the effective reaction rate (1/s), and y is the elevation (m).
Collin and Rasmuson (1988) proposed a method to estimate the effective diffusion coefficient both in the air and water phases [19]. Based on this method, the effective diffusion can be estimated as follows:
D e = D a ( 1 S ) 2 [ n ( 1 S ) ] 2 X + H D w S 2 ( n S ) 2 Y
where D a is the diffusion coefficient of oxygen in air (m2/s), S is a degree of saturation, n is the soil porosity, X and Y are empirical parameters, and D w is the oxygen diffusion coefficient in water.
Aubertin et al. (2000) proposed that the typical value for X and Y used in Equation (2) are in the range of 0.6–0.75 with X Y [20]. The values for these two empirical parameters can also be estimated by the solving the following two equations iteratively;
[ n ( 1 S ) ] 2 X + [ 1 n ( 1 S ) ] X = 1
( n S ) 2 Y + ( 1 n S ) Y = 1
The effect of degree of saturation on effective diffusion coefficient for oxygen is well-studied [8,10,11,20,21,22,23]. INAP (2009) describes a relationship between the degree of saturation and coefficient of oxygen diffusion and illustrated that the oxygen diffusion rapidly reduces by 3 to 4 orders of magnitude as the saturation in the soil cover increases above 85% [24]. Therefore, estimates of the degree of saturation are essential in order to calculate the oxygen flux passing through the porous media (soil cover). The change in saturation within the cover profile can be estimated based on the unsaturated flow equation proposed by Richards (1931), which can be described (in pressure head form) as follows [25];
z [ k ( Ψ ) ( Ψ z + 1 ) ] = C ( Ψ ) ( Ψ t )
where k ( Ψ ) is the hydraulic conductivity as a function of matric suction (m/s), C ( Ψ ) is the specific moisture capacity ( θ Ψ ), Ψ is the matric suction (kPa), and z is the elevation (m).
The solution of Equation (5) requires knowledge of the initial distribution of the pressure head within the flow domain and appropriate boundary conditions. The boundary conditions can be specified in terms of specified pressure head, flux or gradient. The surface of the soil cover is exposed to the atmosphere. Therefore, the availability of the water flux at the ground surface which can enter or leave the cover surface needed to be estimated to predict the changes in the saturation of cover profile. This can be achieved by estimating the water balance at the ground surface using the following equation;
N I = P A E R O
where N I is net infiltration (mm/day), P is precipitation (mm/day), A E is actual evaporation (mm/day), and R O is surface runoff (mm/day).
Precipitation is a primary input parameter in above equation (Equation (6)) and historical records are generally available for most weather stations. Actual evaporation ( A E ) quantifies the actual moisture movement from soil surface to the atmosphere. It is generally less than the potential evaporation ( P E ). Potential evaporation is the amount of water that can evaporate if unlimited amount of water is available at the ground surface. Runoff is the portion of precipitation which is unable to infiltrate into the soil and it stays at the surface and will flow down slope if does not encounter any barrier or depression.
The A E can be estimated based on the estimates of P E and transient soil moisture conditions. In the case of saturated soil conditions, A E is equal to P E . As the soil dries out, the rate of evaporation starts decreasing from the potential value. This is due to the fact that as soil loses moisture, the suction near the surface increases resulting in increased soil affinity to hold on to water. Several methods were proposed by Wilson during the 1990s to estimate A E [26].
One of these methods is the so-called “Limiting Function” as proposed by Wilson et al. (1997) as reported by Fredlund et al. (2012) is given as follows [27]:
A E = P E ( u v s o i l u v a i r v v o s o i l u v a i r )
where u v s o i l is the partial vapour pressure in the soil at the ground surface, v v o s o i l is the saturated vapour pressure in the soil at the ground surface, and u v a i r is the vapour pressure in the air above the soil surface. The potential evaporation in the above-mentioned equation can be a measured value or can be calculated using an appropriate method, such as those of Penman (1948) or Thornthwaite (1948) [28,29].

3. Site and Cover Conditions

Detour Lake Mine is a gold mine located approximately 290 km northeast of Timmins, Ontario, Canada. The mining operation at the site started in 1983 and stopped production in 1999. The mine tailings were deposited in a dam impoundment through end pipe discharge. The mine tailings at the site consisted of sulphide content ranging from 1 to 2.5% which had potential to act as reactive tailings [10]. At the end of production, a major portion of tailings facility was designed for a water cover while the remaining portion was covered with a soil cover. The soil cover was designed to be constructed using on-site material after its desulphurization. The desulphurization process was carried out at a pilot plant which was earlier used for floatation process at site. The initial design of the cover was to construct a capillary barrier which would keep the cover saturation at levels greater than 85% to resist the ingress of oxygen. The placement of desulphurized cover was carried out using end pipe discharge at the surface of reactive tailings during 1998–1999. It was designed to maintain the thickness of the cover at greater than 1 m near the dam and 0.5 m at the pond [10,30,31].

4. Historical and Future Climate

4.1. Historical Climate Data Compilation and Classification

Historical and future climate data are required to evaluate covers in a changing climate. Historical climate act as baseline against which future climatic changes can be quantified. The closest Environment Canada Weather Station to Detour Lake Mine site is 290 km away in Timmins, Ontario. Dobchuk et al. (2013) reported that measurements of detailed climate data at the mine site for the summer months of the years 2000 and 2001 were made [10]. They also reported that climate data measured at the site for this period correlated well with the 1971–2000 Climate Normals for Timmins Victor Power Airport weather station. In absence of multi-year daily resolution climate data for the mine site, Victor Power Airport weather station was selected for climate data compilation. A climate dataset comprising of daily records for precipitation, maximum and minimum temperature and relative humidity, wind speed and net radiation was compiled for the period 1981–2010 as part of this research.
Figure 1 shows the climate data for Timmins, ON for the period 1980–2010. Minimum, maximum and average yearly values for the data are also marked on this figure. The review of the data indicates that the average annual precipitation over the 30-years period is approximately 826 mm. The wettest year (annual precipitation approximately 1034 mm) conditions were observed in 1990, whereas the least annual precipitation (approximately 510 mm) was recorded during the year 2010. The average annual temperature during the 30 period is 1.9 °C. Similarly, the mean annual minimum and maximum temperatures for the period 1981–2010 are −15.2 °C and 18.8 °C. The 30-year average mean relative humidity is 71.8%. Based on the relative humidity data, it is clear that the mean relative humidity for the winter season is relatively higher than that of the summer. The 30-year average wind speed and net radiations are observed to be 9.4 km/h and 4.2 MJ/m2/day, respectively.
Climate classification can provide an estimate of water availability at the ground surface and is a useful tool in assessing the suitability of a particular type of cover considering the site’s climate [27]. The site climate classification can be performed using the Thornthwaite climate classification system [29,32]. Originally developed in 1931 by Charles Warren Thornthwaite, the system was later modified by him in 1948. The system estimates the availability of water at the ground surface by taking the precipitation and potential evaporation at the site into consideration by estimating annual moisture index. The definition of annual moisture index was later modified as follows [33,34]:
I m = 100   × ( P P E 1 )
where I m is the 1955 Thornthwaite moisture index, P is the total annual precipitation and P E is the total annual potential evaporation. Potential evaporation in the above equation can be estimated using any appropriate method such as the Penman (1948) [28] or Thornthwaite (1948) [29] method. Penman (1948) [28] is a radiation based method and requires measured values of temperature, relative humidity, wind speed and net radiation for the estimation of potential evaporation. The Thornthwaite (1948) method on the other hand is the most simplified method and requires only temperature measurements for the estimation of P E [35]. As explained later in the climate change section, reliable estimates of future climate variables, apart from precipitation and temperate, are difficult to obtain; therefore, the Thornthwaite (1948) method with a modification proposed by Pereira and Pruitt (2004) was used for the estimation of the P E in this research [36]. According to Thornthwaite (1948) [29], the daily P E can be estimated using mean monthly air temperature and length of daylight as follows:
P E d = 0.5333 × ( L 12 ) ( N 30 ) ( 10 T a I ) a t
where P E d is the daily P E (mm/day), T a is the mean monthly air temperature (°C), I is a function of the mean monthly temperature i.e., I = ( T a / 5 ) 1.514 , and a t is a function of I , i.e.,
a t = ( 6.75 × 10 7 ) × I 3 ( 7.71 × 10 5 ) × I 2 +   ( 1.79 × 10 2 ) × I + 0.492
Pereira and Pruitt (2004) reported that Camargo et al. (1999) have suggested that the performance of Thornthwaite (1948) approach in monthly time scale can be improved using effective temperature ( T e f ) instead of the average temperature in Equation (9) [36]. They expressed the effective temperature mathematically as follows:
T e f = 0.345 × ( 3 T m a x T m i n )
where T m a x and T m i n are the daily maximum and minimum air temperatures, respectively.
Considering that reliable historical measurements of all the climate variables required to estimate P E using the Penman (1948) method were available, a comparison between estimates from the Penman (1948) [28] and Thornthwaite (1948) [29] methods with the modification proposed by Pereira and Pruitt (2004) [36] was made. The results were found to be comparable and the details and comparison can be found in [37]. Climate classification for the site was carried by estimating the annual moisture index. Results indicate that on average the climate at the site under consideration can be classified as being moist humid/humid with an average moisture index of 22. For 9 of the 30 years, the climate classifies as “moist humid” and for 4 of the years, the climate classifies as “dry subhumid” (Note: The lowest moisture index was computed for the year 2010). For the rest of the years the climate classifies as humid. The standard deviation of the moisture index at this site was computed to be 20.6. The mean plus one standard deviation gives a moisture index of 42.6 (humid) while the mean minus one standard deviation gives 1.3 (moist humid). The variation in climate reinforces that multi-year climate data sets needs to be used for the design as yearly climatic conditions vary from humid to dry subhumid.

4.2. Future Climate Data

Future climate data are generally generated by General Circulation Models (GCM) using different Representative Construction Pathways (RCP). The GCMs are climate models which are used for weather forecasting, understanding the climate and climate change predictions. These are computer-based models which solve a set of complex equations related to the atmosphere and ocean using the applicable laws of physics to predict the earth’s climate. Four different RCPs (RCP 2.6, RCP 4.5, RCP 6.0 and RCP 8.5) are suggested by IPCC (2014) [38]. Every RCP number expresses a different cumulative radiative forcing by the year 2100. The increasing number in RCP indicates a greater accumulation of radiative force; the RCP 2.6 represents the best case scenario with the lowest concentration of radiative forces by the end of year 2100, whereas RCP 8.5 shows the worst-case scenario where the concentration of radiative forces will be the highest at the end of year 2100. The concentration of the greenhouse gases in the atmosphere is generally the basis for variation in the radiative forces.
The future climate data were sourced from the Ontario Climate Data Portal (OCDP) housed at the laboratory of mathematical parallel systems (LAMPS) in the Department of Mathematics and Statistics at York University in Toronto, ON, Canada. The data portal provides future climate projections for precipitation, and maximum, minimum and average temperatures on 10 × 10 km grid resolution for the province of ON. The data are available for 33 different GCMs, and for all four RCPs (i.e., 2.6, 4.5, 6.0, and 8.5). The data covers the period from 1981–2100 [39], and can be downloaded from the OCDP webpage (http://lamps.math.yorku.ca/OntarioClimate/index.htm). In addition to the data with 10 × 10 km grid resolution, OCDP also provides data for different municipalities across Ontario. A bias-correction for the predicted climate with respect to the measured local climate data has also been applied to these data [40]. Other sources of climate data for Ontario have been found to be of inferior performance in comparison to OCDP projections [41].
The predicted future climate data for a number of different GCMs were assessed against the measured historical climate to check their performance in simulating historical climate. The predicted climate data between 1980 and 2010 was compared with the Environment Canada climate normals for the same period. The comparisons indicated that the general circulation models CCSM4, GFDL-ESM2M and HADGEM2-E5 for all RCPs performed satisfactory by predicting historical climate normals quite well. It should be noted that the comparison was made for both temperature and precipitation data and details can be found in [37].
The future climate data were subdivided into thirty-year periods, and each period is designated as a climate ensemble. The 90 years (2011–2100) of future climate data from the three GCMs for four different RCPs formed 36 climate ensembles. Each ensemble refers to a particular GCM, RCP and a 30-year time period. Historical climate data (1980–2010) were designated as ensemble number one increasing the total number of ensembles to 37. A schematic of the climate ensembles with their corresponding GCM, RCP and time periods are shown in Figure 2. It should be noted that ensemble #1, comprising of historical climates, is considered as the base climate against which future climate datasets are evaluated.
The predicted data for 36 future climate ensembles were compared to the base climate. Figure 3 shows the 30-year annual mean air temperature and cumulative precipitation for the base and future climate ensembles in the form of box and whisker plots. The lower and upper ends of the box show 1st and 3rd quartiles, respectively, while the whiskers show the two extreme values (maximum and minimum). The line in the middle of the box represents the median of the data. The review of the temperature data in Figure 3a shows that for all future climate ensembles, the median temperature shows considerable increase over the median base value. The increasing trend in the temperature data is consistent for all GCMs and radiative forcing values. It can also be observed that, in general, the temperature is expected to increase with RCPs and the number of years. Consistent with the trend, the maximum temperature increase can also be observed for scenarios predicted with RCP 8.5, with the highest increase in temperature for the GCM Had GEM2-E5 (Climate ensemble #37).
Figure 3b shows 30 yearly cumulative precipitation values for all the climate ensembles. It can be observed that the median annual precipitation predicted for the majority of future climate ensembles is more than the base climate. A maximum increase of approximately 17% in median value of annual precipitation is predicted for climate ensemble #28 (Had GEM2-ES with RCP 6.0). It can also be observed that only three out of 36 climate ensembles showed a decrease in median values of precipitation, in comparison to the baseline value. The lowest median value of annual precipitation is predicted for climate ensemble #23 (GFDL-ESM2M with RCP 6.0). The extreme annual precipitation events increase for all climate ensembles irrespective of GCM, RCP or the time period. For all future climate data, the climate ensembles 35 and 32 showed extreme maximum and extreme minimum annual precipitation, respectively.

4.3. Selection of Future Climate Ensembles

For this study, the soil cover performance was assessed based on two representative future climate ensembles. The selection of these climates ensembles was based on the criteria of worst-case scenario. While selecting the representative climate ensembles, it was assumed that the driest weather conditions will represent the worst cover performance, as it will result in decreased saturation resulting in increased oxygen ingress to the reactive tailings. Climate ensemble # 23 was selected as the first representative future climate (FC-1). This ensemble represents the lowest 30-year cumulative precipitation in all future climate ensembles, as shown in Figure 3 above.
Lowest precipitation alone may not guarantee the driest conditions as the amount of meteoric water that enters the cover also depends on the available evaporative demand. As shown above (Figure 3a), a temperature increase is imminent for all future climate ensembles; it is therefore inevitable that there could be a proportional increase in the evaporative demand as well. In this instance, the estimation of annual moisture index ( I m ) and classification of climate for future climate ensembles is a useful exercise, as it takes into consideration both the precipitation and the potential evaporation. Potential evaporation was estimated for all future climate ensembles using the modified Thornthwaite method described earlier. Estimated P E , together with the predicted P values, was used to estimate the I m values for each individual year of every climate ensemble.
The selection of second representative future climate ensemble was based on the comparison of these I m values. Figure 4 shows the box and whisker plots of I m for all climate ensembles. Each climate ensemble consists of 30 yearly values. It can be observed that climate ensemble #37 shows that the majority (more than 95%) of the moisture indices of this ensemble are less than the median value of the base climate ensemble. This observation indicates that in most instances for this climate ensemble, the water availability at the ground surface will be lower than the median water availability for the base climate. Therefore, this climate ensemble was selected to be the second representative future worst case climate change scenario (FC-2).
The average annual precipitation for FC-1 and FC-2 is predicted to be 792 mm and 968 mm, respectively. The average annual P E is predicted to be 712 mm and 950 mm, respectively. It is also predicted that the mean annual temperature will increase by 0.6 °C and 7.3 °C, respectively, for FC-1 and FC-2. As a whole, the climate is expected to be ‘moist humid’ for these climate ensembles. (Figure 4).

5. Development of Soil Cover Models

5.1. Representative Soil Cover Profiles

Field investigations carried out immediately after the cover placement revealed that interbedded layers of fine and coarse material exist in the engineered portion of the cover and underlying tailings [30]. This was attributed to the end-pipe discharge method of tailings and cover deposition where coarser tailings tend to get deposited near the pipe discharge and finer materials travel further away [10]. Representative cover and tailing profiles used in the current study are shown in Figure 5. Dobchuk et al. (2013) [10] used the same profiles in their numerical modeling study to investigate the controlling factors for the cover performance. These profiles are simplifications to represent complex field conditions with the intent to investigate the controlling factors of cover performance as opposed to specifically model the as-built cover [10].
The review of the cover profiles in Figure 5 indicates that for the cover performance assessment, a single cover thickness of 1.8 m can be assumed. The cover can be comprised of either coarse or fine tailings, to represent the heterogeneity observed in the cover materials during the field investigation. Similarly, covers comprising of a coarse or fine material can overlie coarse or fine acid generating tailings to represent the heterogeneity in tailings. Of the four resulting cover profiles, the profile FC represents the original cover design where the fine desulphurized tailings were to be deposited on coarse tailings to create a capillary break [10,30]. According to Dobchuk et al., 2013 [10], the CF profile most accurately represents the as-built desulphurized cover.

5.2. Material Properties

Soil water characteristic curves (SWCC) relate the soil volumetric water content to matric suction. A frequently used form of relationship between matric suction and volumetric water content is given by van Genuchten (1980) [42]:
Θ = θ θ r θ s θ r = [ 1 1 + ( α Ψ ) n ] m
where Θ is the effective saturation, θ is the volumetric water content (m3/m3); θ s and θ r are the saturated and residual volumetric water contents, respectively; Ψ is the matric suction (kPa); and α ,   n and m are the curve fitting parameters. 1/ α is generally related to the air entry value (kPa); n is measure of pore-size distribution; and m can be related to n as m = 1 1 / n . The parameters based on Equation (12) for fine and coarse materials are presented in Table 1. These parameters were obtained by fitting the experimental measurements of SWCC presented in Dobchuk (2002) [30] and Dobchuk et al. (2013) [10] to Equation (12). A good fit between the experimental data and the van Genuchten (1980) [42] equation was obtained. It should be noted that the air entry values of 6 kPa and 50 kPa were considered for coarse and fine tailings materials, respectively, and that these are the same values which were used by Dobchuk et al. (2013) [10].
van Genuchten (1980) [42] used the following closed form equation to describe the hydraulic conductivity of soil as function of matric suction:
k = k s Θ l [ 1 ( 1 Θ 1 m ) m ] 2
where k is unsaturated hydraulic conductivity, k s is saturated hydraulic conductivity of soil (m/s), l is constant and generally taken as 0.5, and m is an empirical parameter as explained above. The saturated hydraulic conductivity for the coarse and fine tailing material were taken as 1 × 10⁻⁶ m/s and 1 × 10⁻⁷ m/s, respectively, based on the measurement made by Dobchuk (2002) [30]. The soil hydraulic conductivity function for the coarse and fine tailing materials was predicted using Equation (13), using the parameters presented in Table 1. It should be noted that Equations (12) and (13) do not take in to account any volume change in the material as a result of drying and wetting. It should also be noted that any volume change information for these materials is not available and, therefore, the simulations do not consider any such changes.

5.3. Development of the Numerical Models

The numerical modeling was carried out using Vadose/W software, which is part of the Geostudio 2016 software package [43]. Vadose/W was primarily developed for the design of soil cover systems. It is a two-dimensional, simultaneous coupled heat transport and fluid flow finite element model with atmospheric coupling. The atmospheric coupling is achieved by estimating actual evaporation using the procedure developed by Wilson et al. (1994, 1997) [44,45]. Vadose/W is also capable of simulating oxygen and radon transport through the soil covers. More details can be found in Geo-Slope International Ltd. 2014 [18].
The modeling was carried out in a one-dimensional domain. The model domains consisted of the cover and tailings profiles shown in Figure 5. The global element size in the profiles was kept as 0.1 m. The cover layers were modeled with finer mesh as compared to the tailing layers. Additional elements were added in the geometry at the cover–tailings interface and near the ground surface. The purpose of these additional elements was to predict the flux changes at the interface and the near the ground surface layers more precisely.
Appropriate boundary conditions were applied to the soil cover models. For hydraulic boundary conditions, a zero-pressure head boundary, corresponding to the depth of the existing groundwater table, was applied at the bottom of the cover models. The top hydraulic boundary comprised of historical and future climate datasets. Climate datasets consists of daily values of temperature, relative humidity, precipitation and P E . The daily values of temperature, relative humidity, wind speed and precipitation for the historical climate are generally gathered at weather stations and based on these parameters, excluding precipitation potential evaporation is estimated using Penman (1948) [28]. The future predictions of daily values of temperature and precipitation are generally available through the use of GCM. However, predictions of relative humidity using the temperature in the current study were estimated using Kimball et al. (1997) [46]. The predictions of relative humidity using this method were compared with the measured historical climate data for the site. A reasonable agreement between the measured and predicted values was obtained, and details can be found in [37].
The parameters in the climate dataset were assumed to show variation in a sinusoidal pattern over the 24-h period except the daily precipitation. The daily precipitation was distributed uniformly over the 24-h period. No surface vegetation was included in the model. The model was set in such a way that the surface run-off was generated without creating any additional hydraulic head on the column if the precipitation intensity exceeded the infiltration capacity of the soil. For oxygen transport, the oxygen concentration in the atmosphere was assumed to be 280 g/m3, and was applied at the top boundary. A zero-oxygen concentration boundary was assumed at the bottom of the domain.

6. Modeling Results

6.1. Verification Modeling

The ability of the VADOSE/W for predicting the water balance was investigated by Walter and Dubreuilh (2007) [47]. They compared the model outputs with the field measurements. The results revealed that, in some instances, VADOSE/W predicted the water balance very close to the field measurements. However, in other instances, the model results did not correlate well to the field conditions. The reasons for the numerical code not being able to predict the field conditions could be due to uncertainty in the hydraulic properties, vegetation water use parameters, heterogeneous soil conditions, inaccurate representation of rainfall events, and/or unexpected generation of high surface runoff. Considering the uncertainty in the modeling results, it is generally suggested to verify/calibrate the model prior to its use for future modelling considerations.
Field measurements to verify/calibrate the model for the mine site are not available. Therefore, an attempt was made to assess the suitability of the current modeling effort by reproducing the results of previous modeling studies carried out at Detour Lake Mine. Dobchuk (2002) [30] predicted the water balance of the tailings covers at the site using the SoilCover numerical code. The modelling results were never quantitatively compared to the site condition, but were reported to provide a qualitative assessment of the tailings covers. The objective of the current study is to assess the effects of climate change on tailings covers; therefore, verifying the model with Dobchuk (2002) [
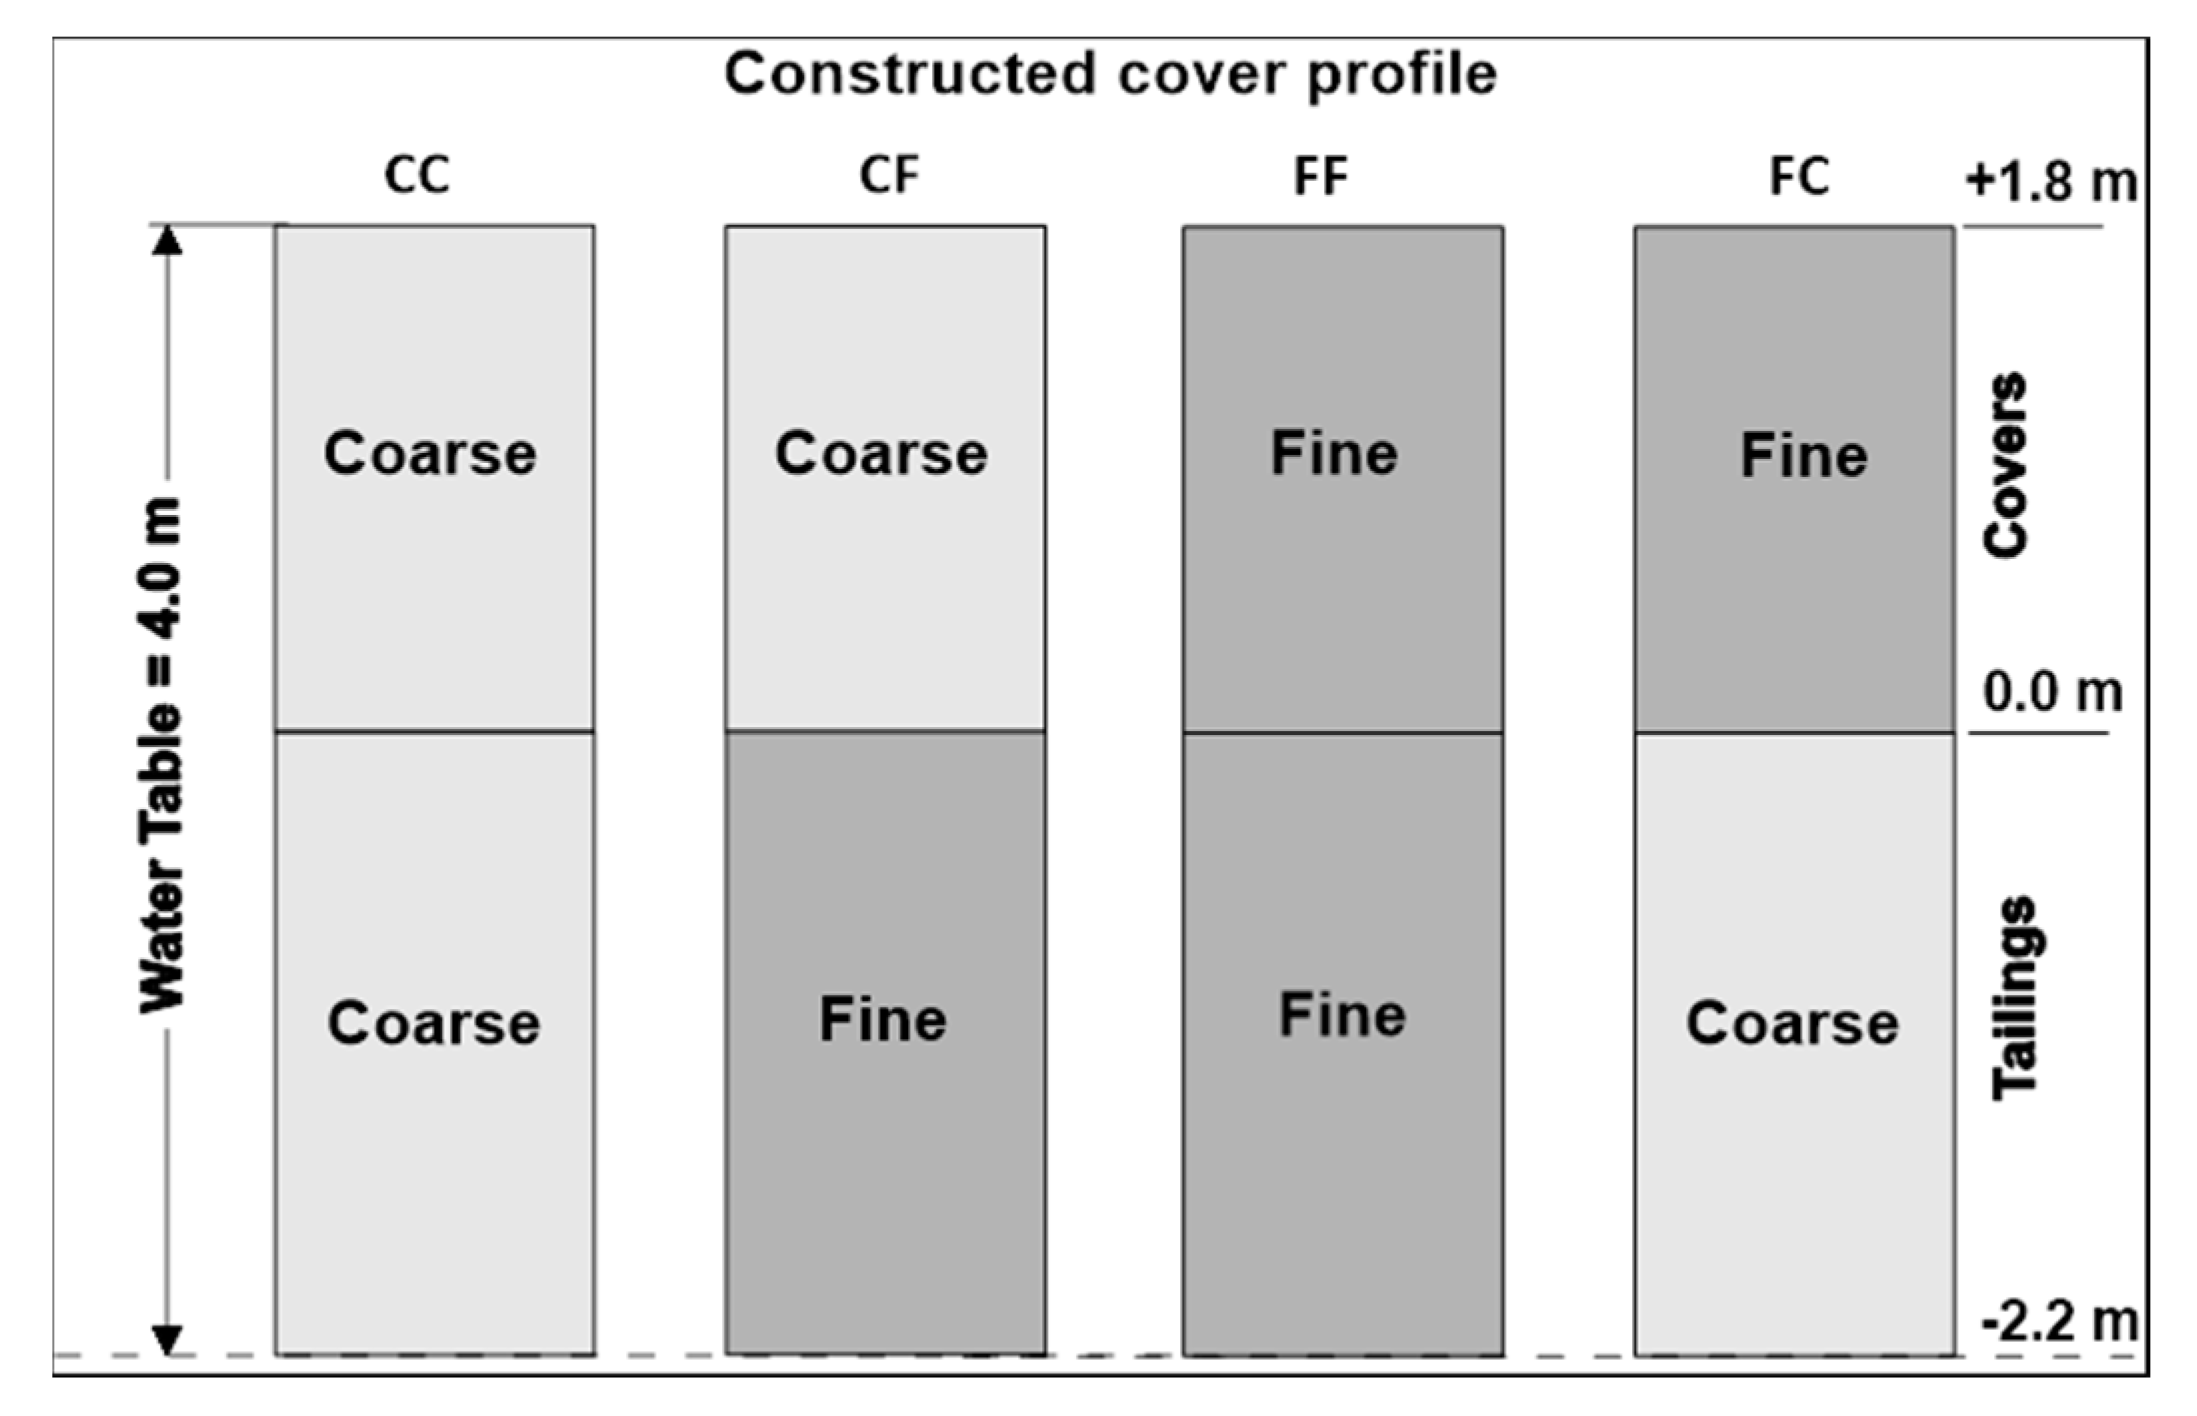
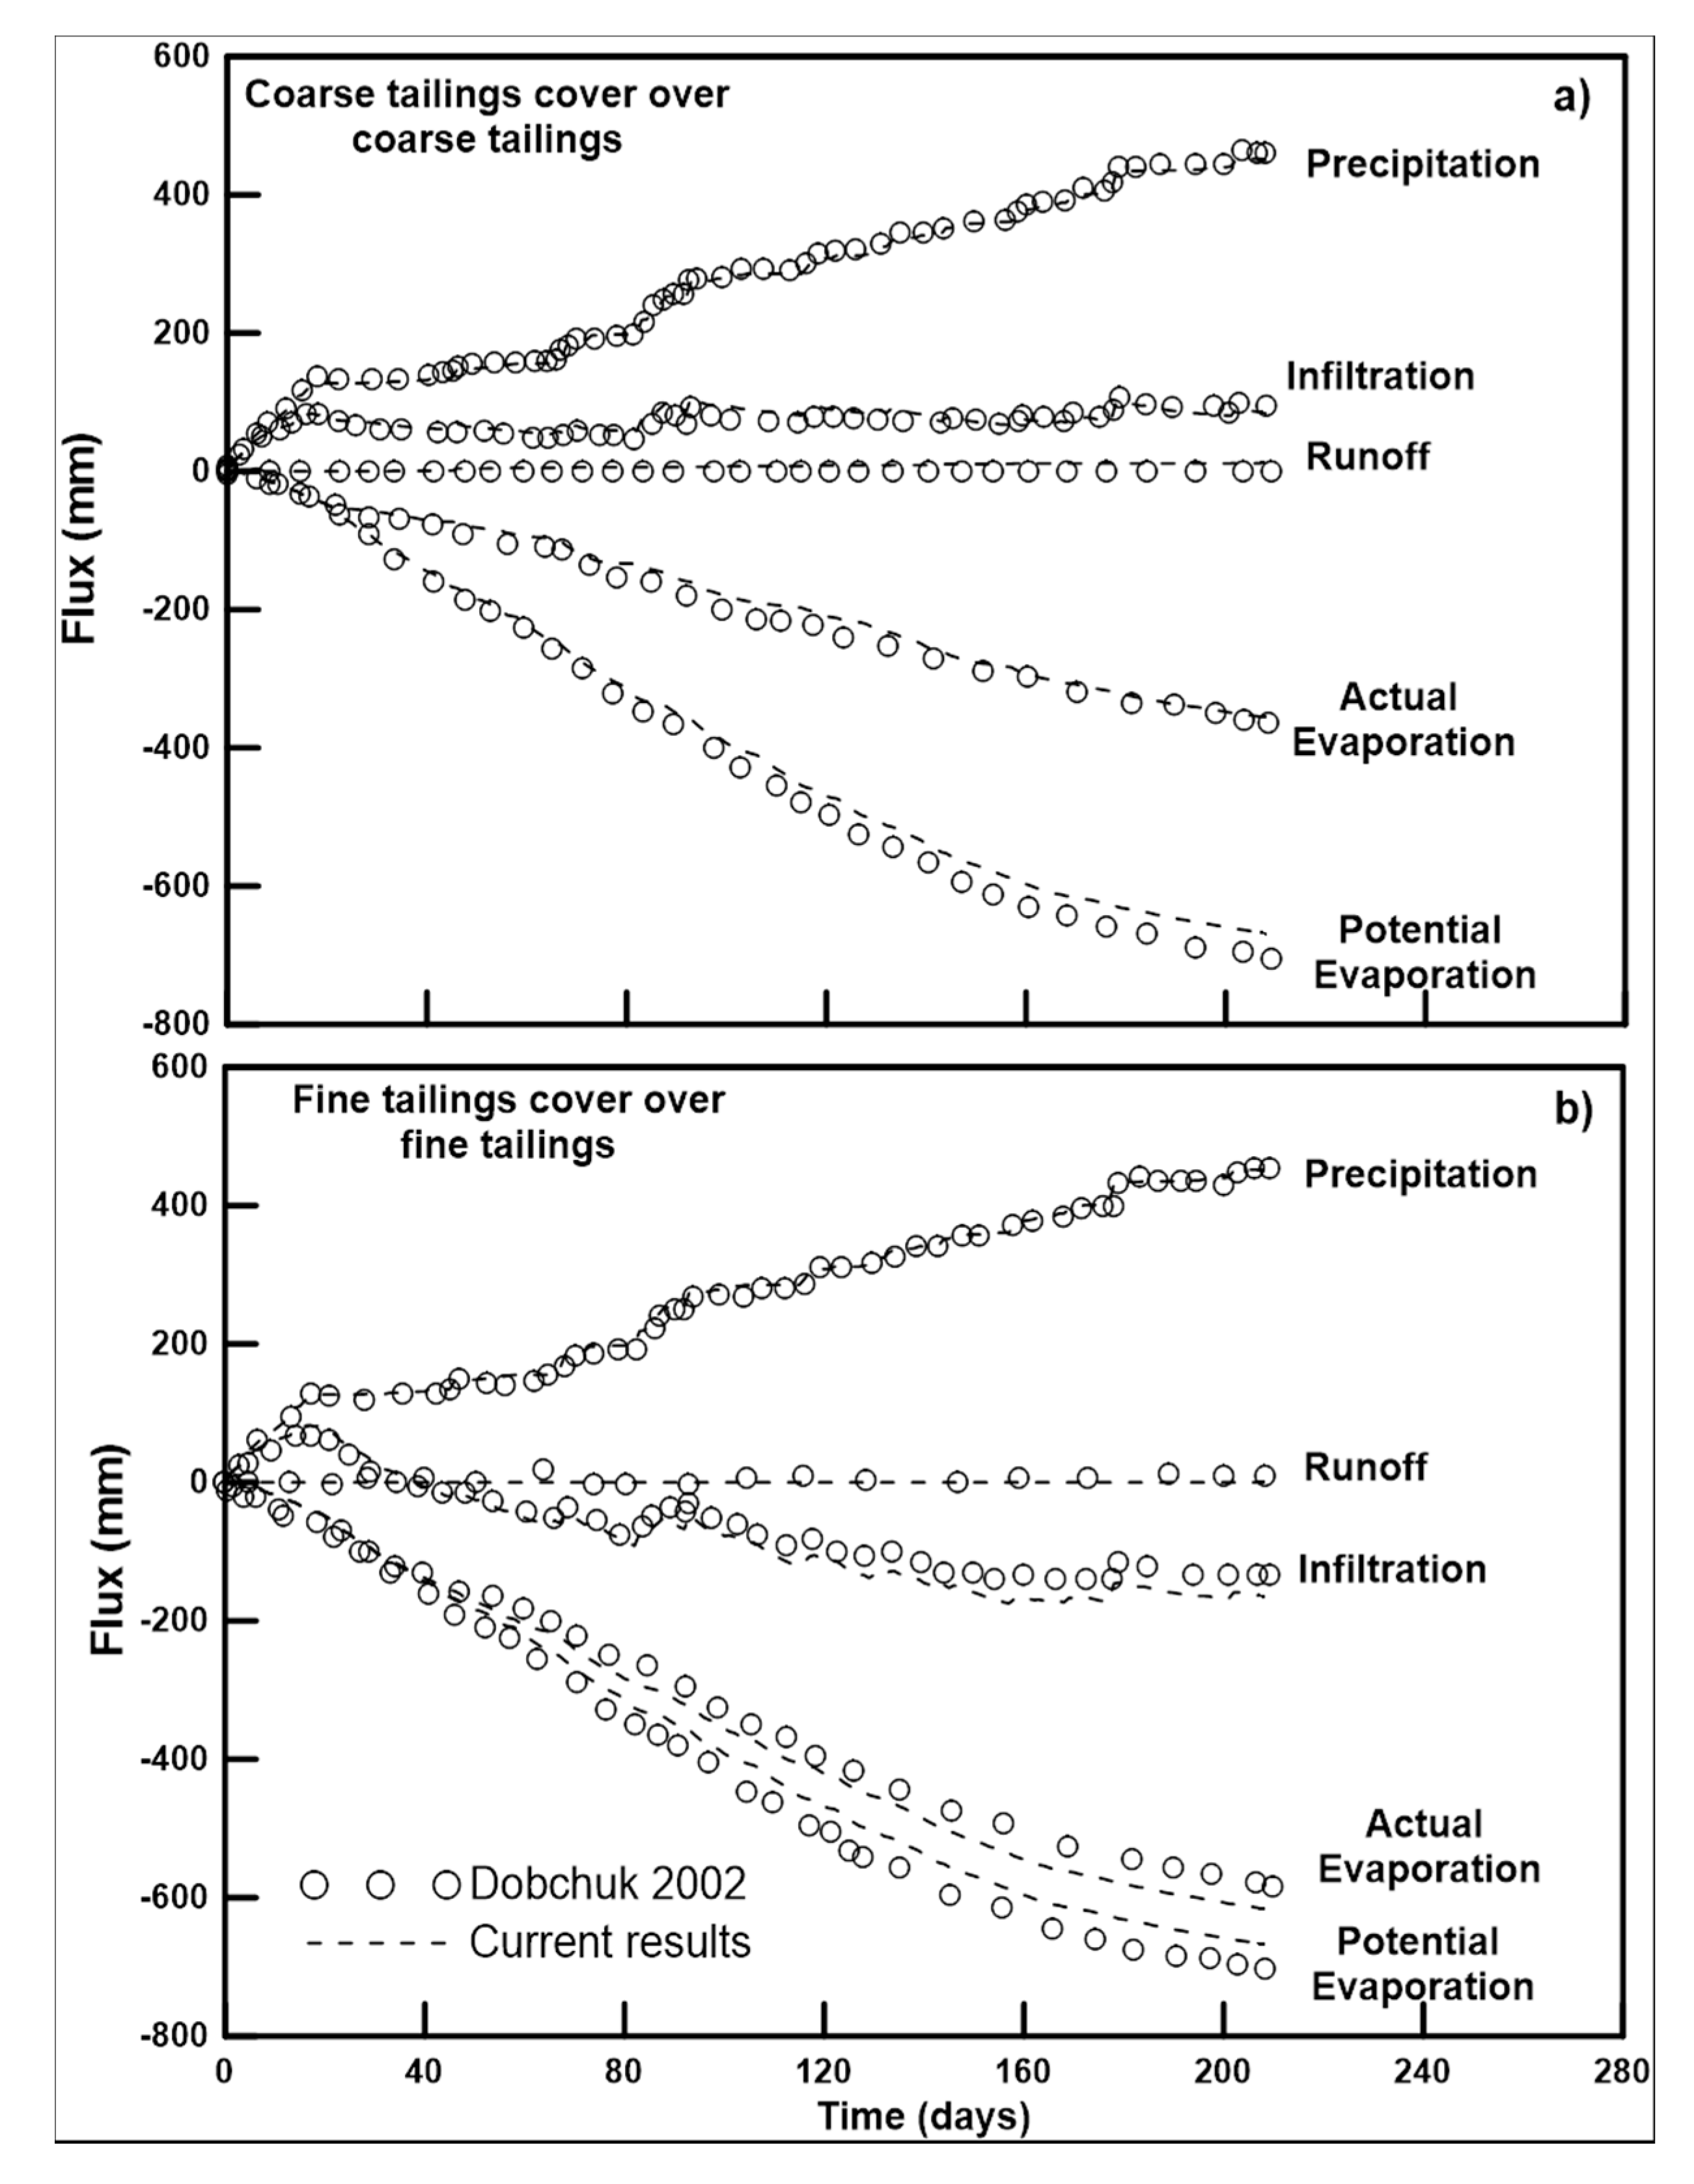
30] modeling results will provide a consistent approach to the previous research carried out at the site. To accomplish this, water balances for coarse and fine tailings covers are compared in Figure 6.
Figure 6a shows a comparison of the water balance for current and previous models for the homogenous coarse tailings cover (CC profile). The coarse tailings cover shows the annual net infiltration ( N I ) of about 2% less in the current model to that of Dobchuk (2002) [30]. The current model predicts the annual surface runoff ( R O ) of 11 mm (2.3%) whereas the previous results showed minimal surface runoff. The difference in annual actual evaporation ( A E ) between both models is insignificantly small (~0.01%). About 5% increase in P E is recorded in the current model as compared to the model by Dobchuk (2002) [30].
The water balance comparison for the fine tailings cover is shown in Figure 6b. For the fine cover, both models show that the predicted annual A E is significantly more than the annual precipitation; therefore, the annual N I is negative, indicating net water loss conditions at the ground surface. A difference of 6% in N I and 7% in A E was observed between the current modeling results and those reported by Dobchuk (2002) [30]. The comparisons made in Figure 6a,b reveal that the water balance for the current models (coarse and fine tailings covers) are generally comparable to that of Dobchuk (2002) [30] models. The minor variations in the results could be due to the use of different numerical codes.

6.2. Predictive Modeling

The performance of tailing covers to limit the production of AMD is generally assessed based on its ability to maintain a saturation of 85% or higher. The N I and deep percolation ( D P ) are the key parameters which generally control the saturation in the tailings cover. Net infiltration is the quantity of meteoric water (precipitation) that enters the cover while deep percolation is the quantity of water that moves across the tailings–cover interface. The oxygen flux, that results in the generation of AMD, depends on the cover saturation. The results for water balance, oxygen flux and its relationship to time histories for the saturation and the oxygen concentration are discussed in the following section.

6.3. Water Balance at the Ground Surface

The water balance at the ground surface quantifies the availability of water and evaporative demand together with quantities of water that enters or exits the ground surface. In this research, the components of water balance which enter the ground surface are considered as positive while the components which exit the ground surface are considered negative. The exception is runoff, which is also considered positive. The deep percolation, which is the flux across the cover–tailings interface, is considered positive if the flow is from the tailings into the cover. Similarly, D P is expressed as a negative quantity if it flows downwards from the cover to the tailings.
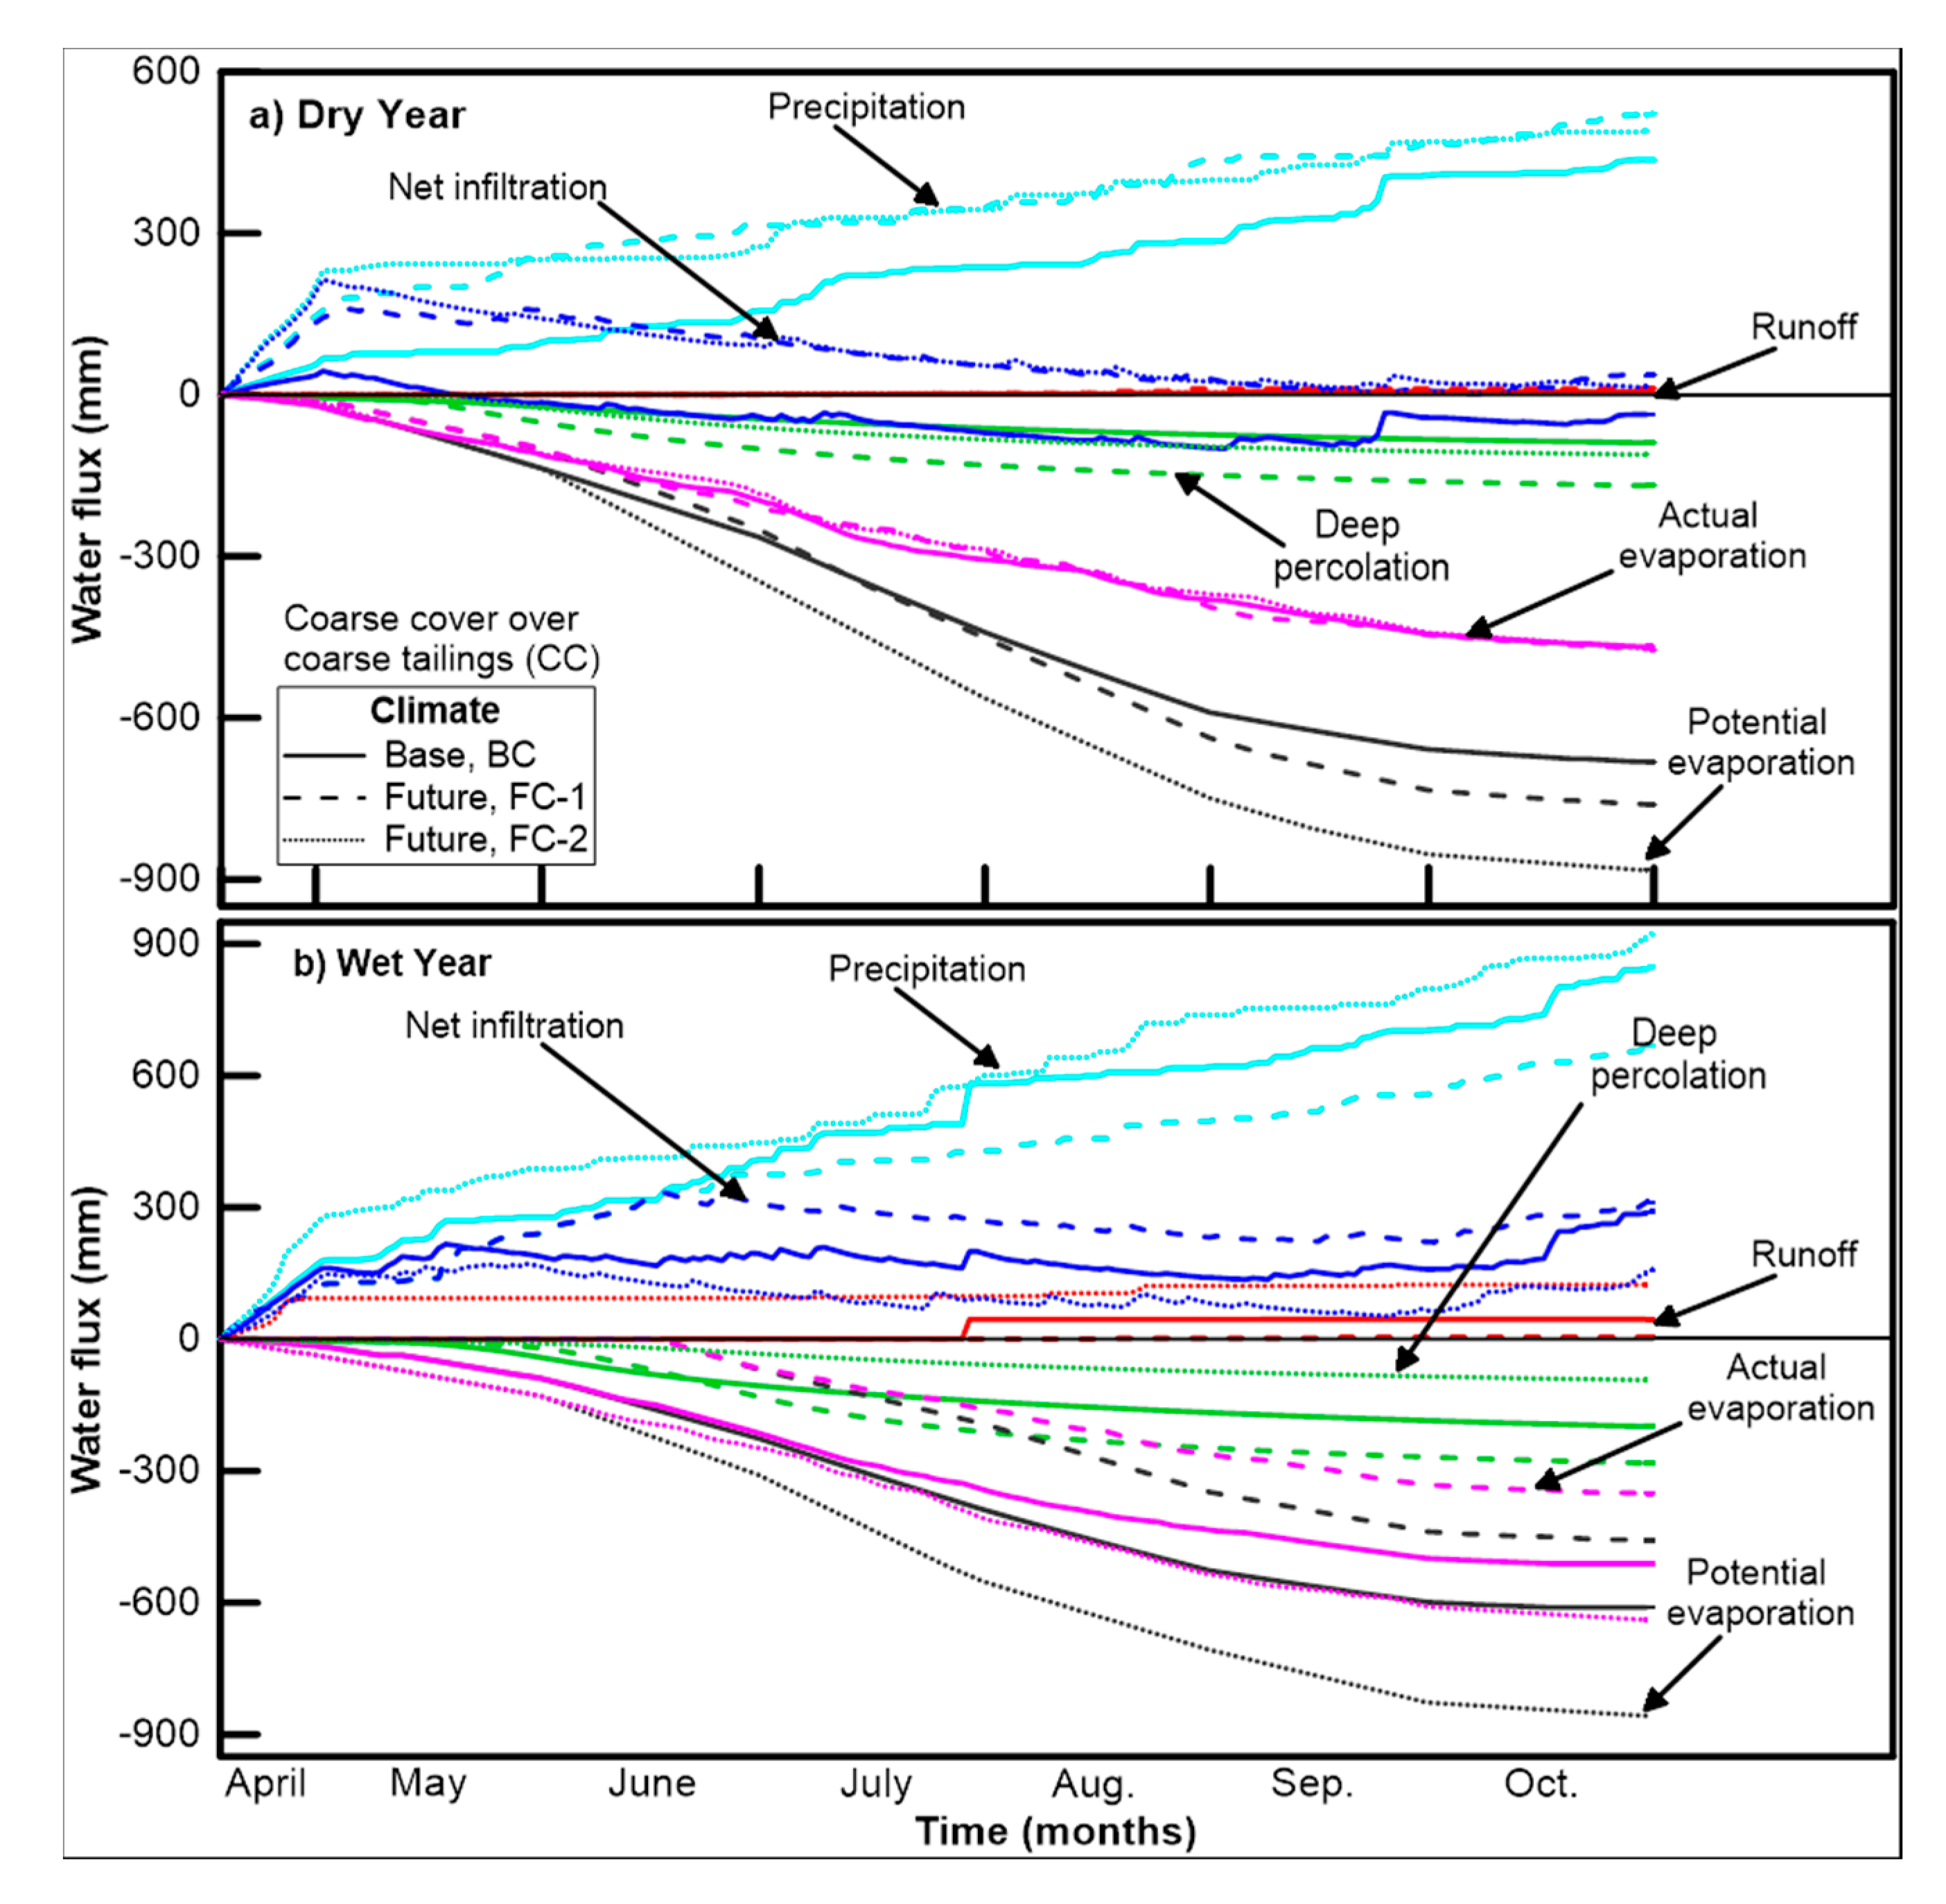
Figure 7 shows the water balance for the homogeneous coarse profile (CC) for dry and wet year climates for the base climate (BC) and future climates (FC-1 and FC-2). Dry and wet years were identified based on the lowest and highest I m for the respective 30-year climate datasets. The annual cumulative precipitation for dry years increases 19% and 13% for future climates FC-1 and FC-2 respectively in comparison to the base climate (Figure 7a). However, for the wet years, the annual cumulative precipitation for FC-1 is 21% lower than the baseline condition, while for FC-2 it is 9% greater than the baseline value (Figure 7b).
Potential evaporation is the total quantity of water that can be evaporated if the unlimited supply of water is available at the ground surface. The potential evaporation for dry years is lowest for BC followed by FC-1 and FC-2. The increase in the potential evaporation relative to the base climate is 12% and 30% for FC-1 and FC-2, respectively (Figure 7a). However, for wet years, the lowest P E can be observed for FC-1, followed by BC and FC-2.
Actual evaporation is related to P E but also depends on the availability of water (due to precipitation) and potential moisture difference between earth surface and atmosphere. Although cumulative precipitation and the P E of homogeneous coarse profile for dry years varies for base and future climates, the cumulative actual evaporation is almost similar (within 1% difference). This is due to the low retention and high conduction behavior of the coarse material. Conversely, the actual evaporation varies considerably (up to 31%) during wet year for base and future climates. The reason for larger variations in cumulative A E during wet years could be due to the variations in the amount of precipitation. For example, looking at the precipitation data in Figure 7b, the FC-2 has more extreme events especially at the start. This implies that there is more availability of water in a shorter period of time, although the evaporative demand for that period is not too different among the three. The lowest cumulative actual evaporation was observed during FC-1, followed by BC and FC-2 and this trend is in line with the precipitation trends of the wet year.
Net infiltration quantifies the amount of water entering or leaving the ground surface. It is calculated by subtracting the sum of A E and R O from the precipitation. The cumulative net infiltration during a dry year generally follows the precipitation trends for the homogeneous coarse profile (Figure 7a) with lowest during base climate, followed by FC-2 and then FC-1. The homogeneous coarse cover profile shows positive net infiltration during dry and wet years of representative future climates. The profile (CC) also shows water gain conditions in wet year of BC. However, water deficit conditions were observed during the dry year of BC. The lowest cumulative net infiltration of wet year was observed during climate FC-2, followed by BC and FC-1, which inversely follows the precipitation trends of the wet years of their respective climate ensembles. The reason for such trends (which inversely follow the precipitation) is due to actual evaporation values, which are highest during FC-2, followed by BC and FC-1.
The infiltrated water flow through gravity and entering the tailings is generally termed as deep percolation ( D P ). In addition to gravity, another competing process is the capillary action, in which water from the saturated portion of the tailings can rise and enter the cover. Since the homogenous coarse profile has low air entry value with little expected capillary rise; therefore, a major portion of infiltrating water during all climates flow through the cover and enters the tailings (Figure 7a,b).
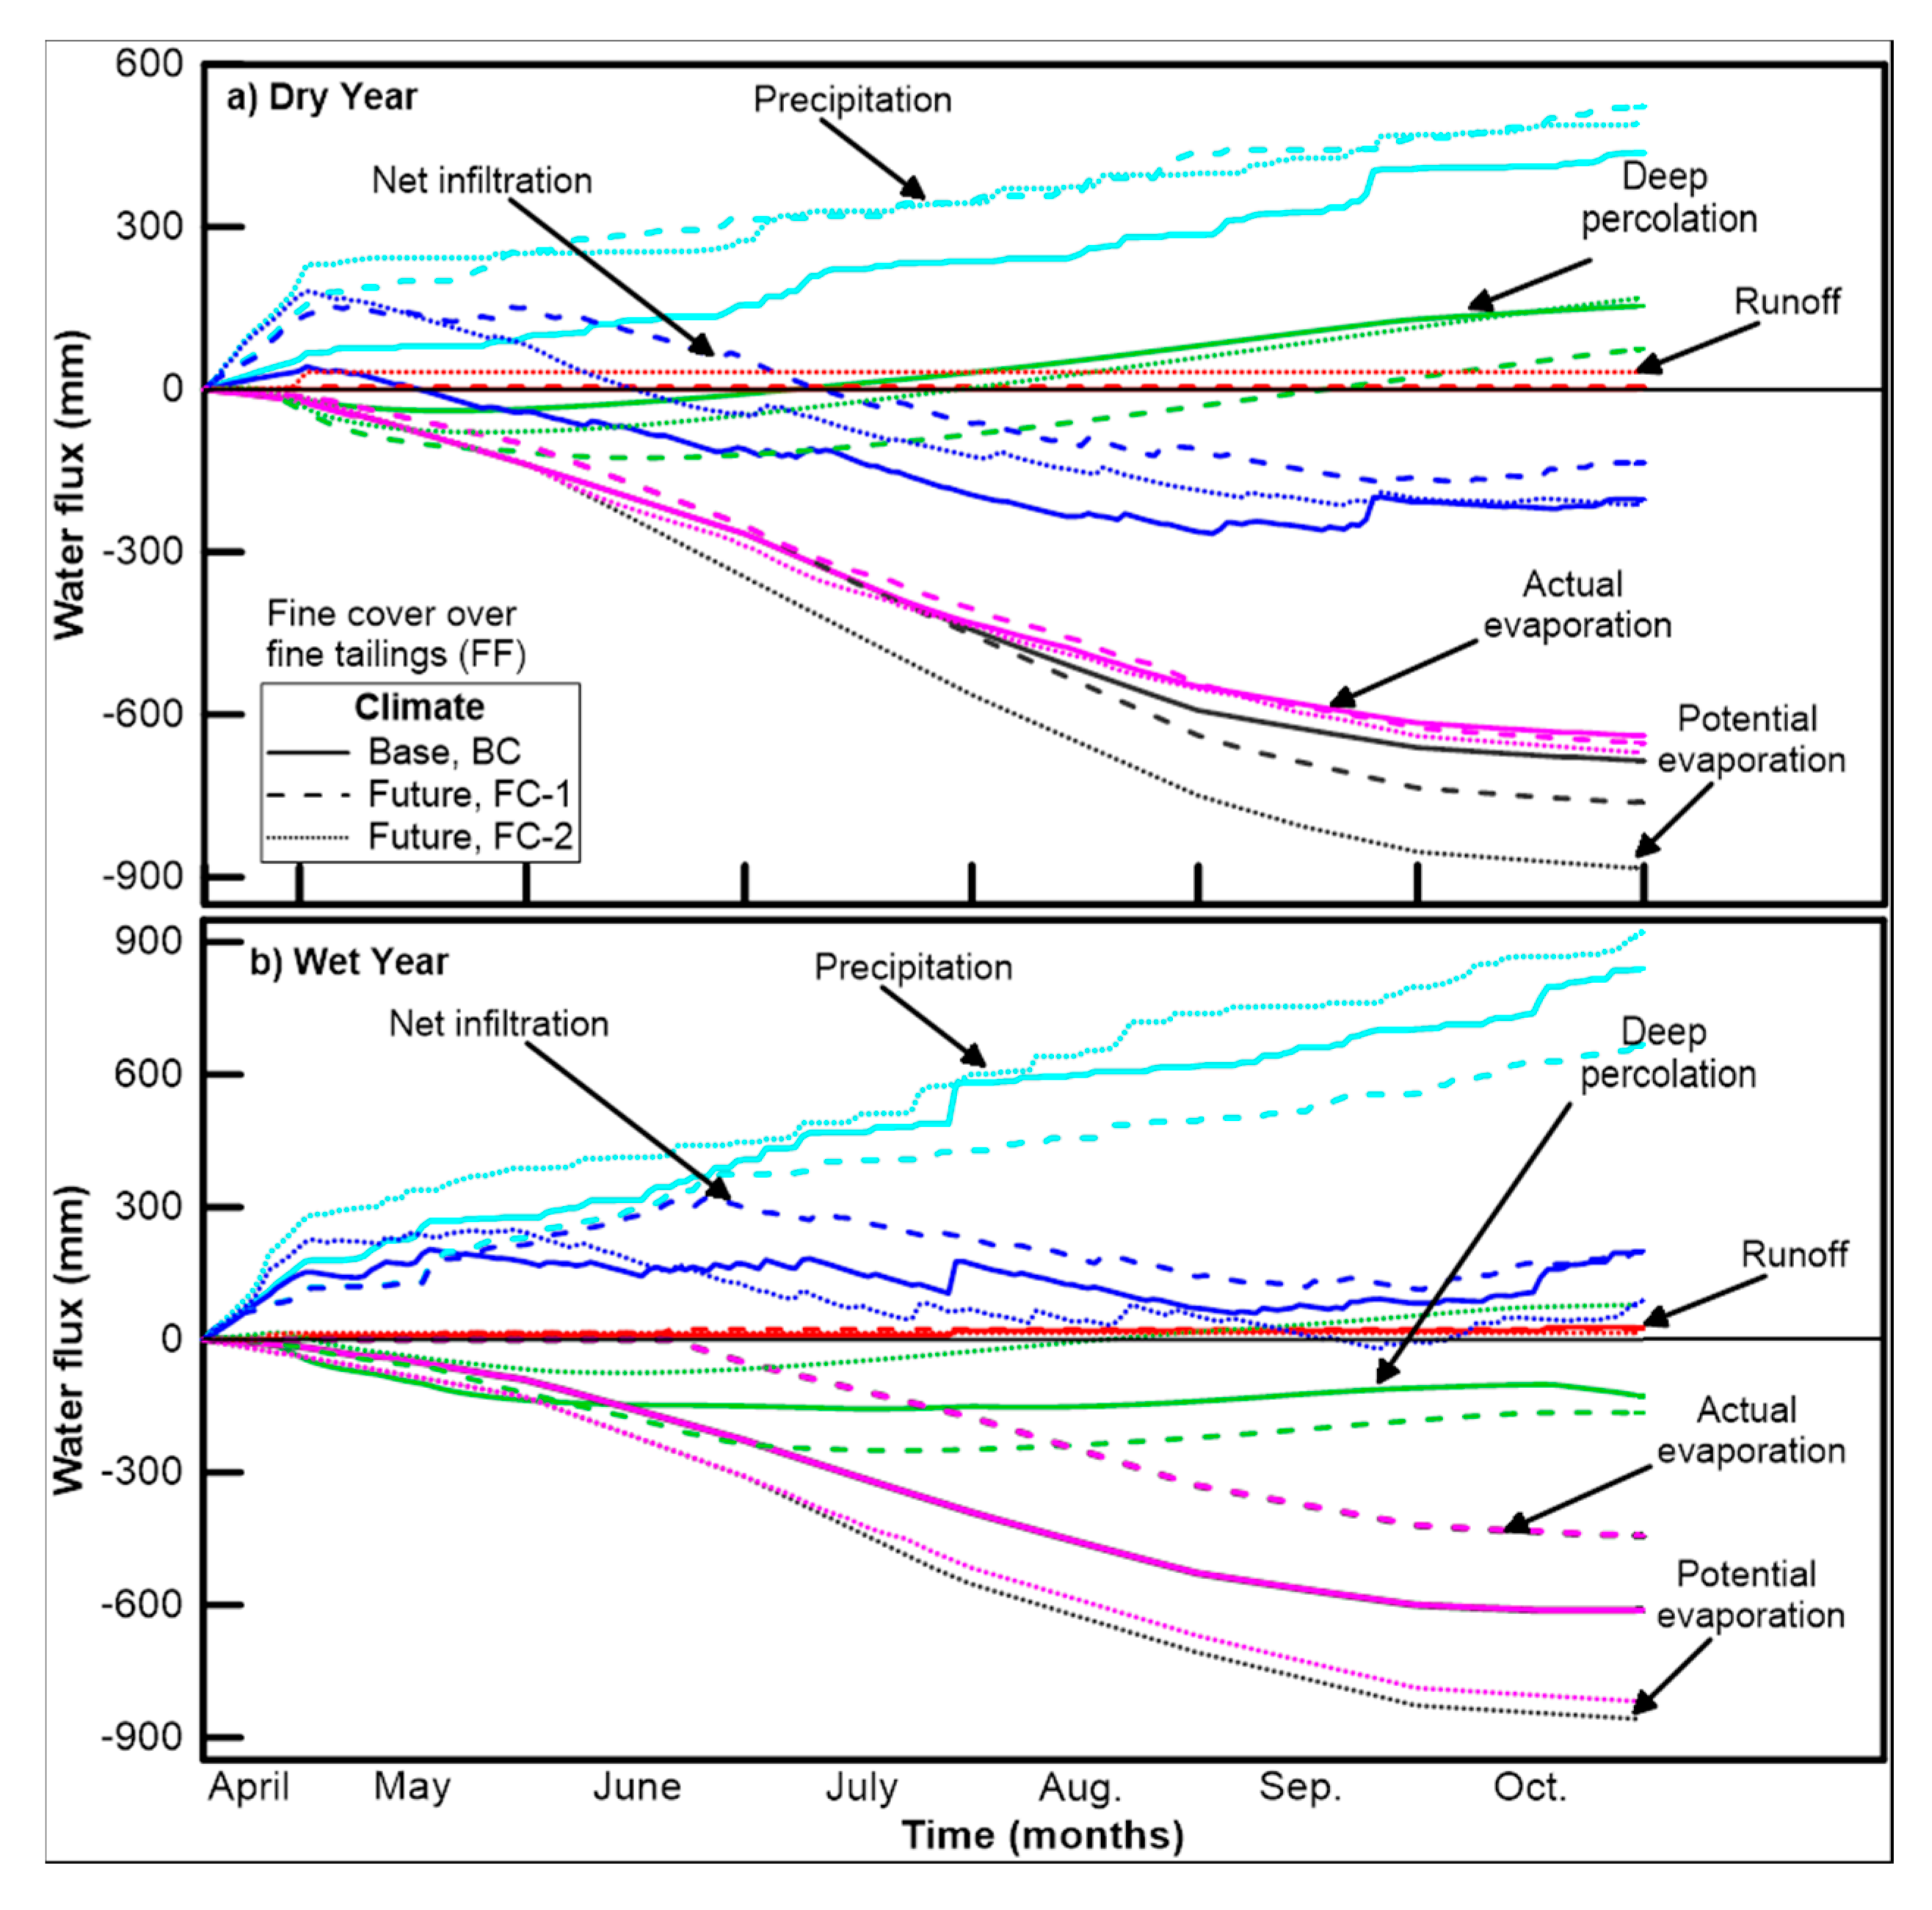
The water balance for the homogeneous fine material profile of dry and wet years during base and future climates is shown in Figure 8. The cumulative precipitation and potential evaporation of dry and wet years for the homogeneous fine profile during all the climates are identical to their respective climate ensembles of the coarse homogeneous profile, as these ( P and P E ) are independent of the cover type.
However, actual evaporations are significantly higher for the homogenous fine profile as compared to the coarse profile for dry and wet years for all the climate ensembles. The relative higher cumulative A E for the fine profile is due to its high retention and low drainage behavior. The variation in actual evaporation of dry year during for all climates is relatively small (within 5% of BC). However, the difference in cumulative A E for wet years are high, with the highest A E of 818 mm of FC-2 (33% more than BC), followed by BC (611 mm) and FC-1 (443 mm). Again, the reasons for the variations in the A E could be the variations in the amount of precipitation in wet years for base and future climates.
The net infiltration of the homogeneous fine profile for dry years showed water deficit conditions for all the representative design climate ensembles. The water deficit conditions are due to increasing high actual evaporation and lower cumulative precipitation. Additionally, the higher air entry value (50 kPa) of the fine profile keeps the saturation at a higher level above the groundwater table due to capillarity which results in generation of higher A E (Figure 8a). During wet years, the net annual precipitation is more than the annual actual evaporation; therefore, the wet years of base and future climates show water gain conditions (Figure 8b).
For the case of a homogeneous fine profile, a greater capillary rise due to the higher air entry value of the fine tailings is expected. At the beginning of the active year, the flow of water in the cover is predominantly controlled by gravity drainage. As time passes, water flows across the cover–tailings interface in the upward direction due to capillary rise. During dry years, due to higher A E and lower P , the water flows from the tailings to the cover due to capillary rise will result in net gain to the cover storage. Conversely, during wet years, the water flows across the interface from cover to the tailings for BC and FC-1. This is due to the higher amount of precipitation ( P   > ( A E = P E )) during wet years. However, for wet years during FC-2, the cover experiences net gain in its storage. This is due to the high A E (comparable to P ), which creates potential continuous water deficit conditions at the ground surface which in turn were compensated by water flow from the tailings to the cover due to capillary action.
The water balance results for coarse cover profile over fine tailings (CF) showed similar trends to that of profile CC, and the fine cover over coarse tailings profile shows water balance similar to that of profile FF; therefore, they are not discussed any further. In addition to the above mentioned water balance results for FC-1 and FC-2, two additional representative climate ensembles were also analyzed, and their water balance results were found to be similar to those reported here. Details can be found in [37].

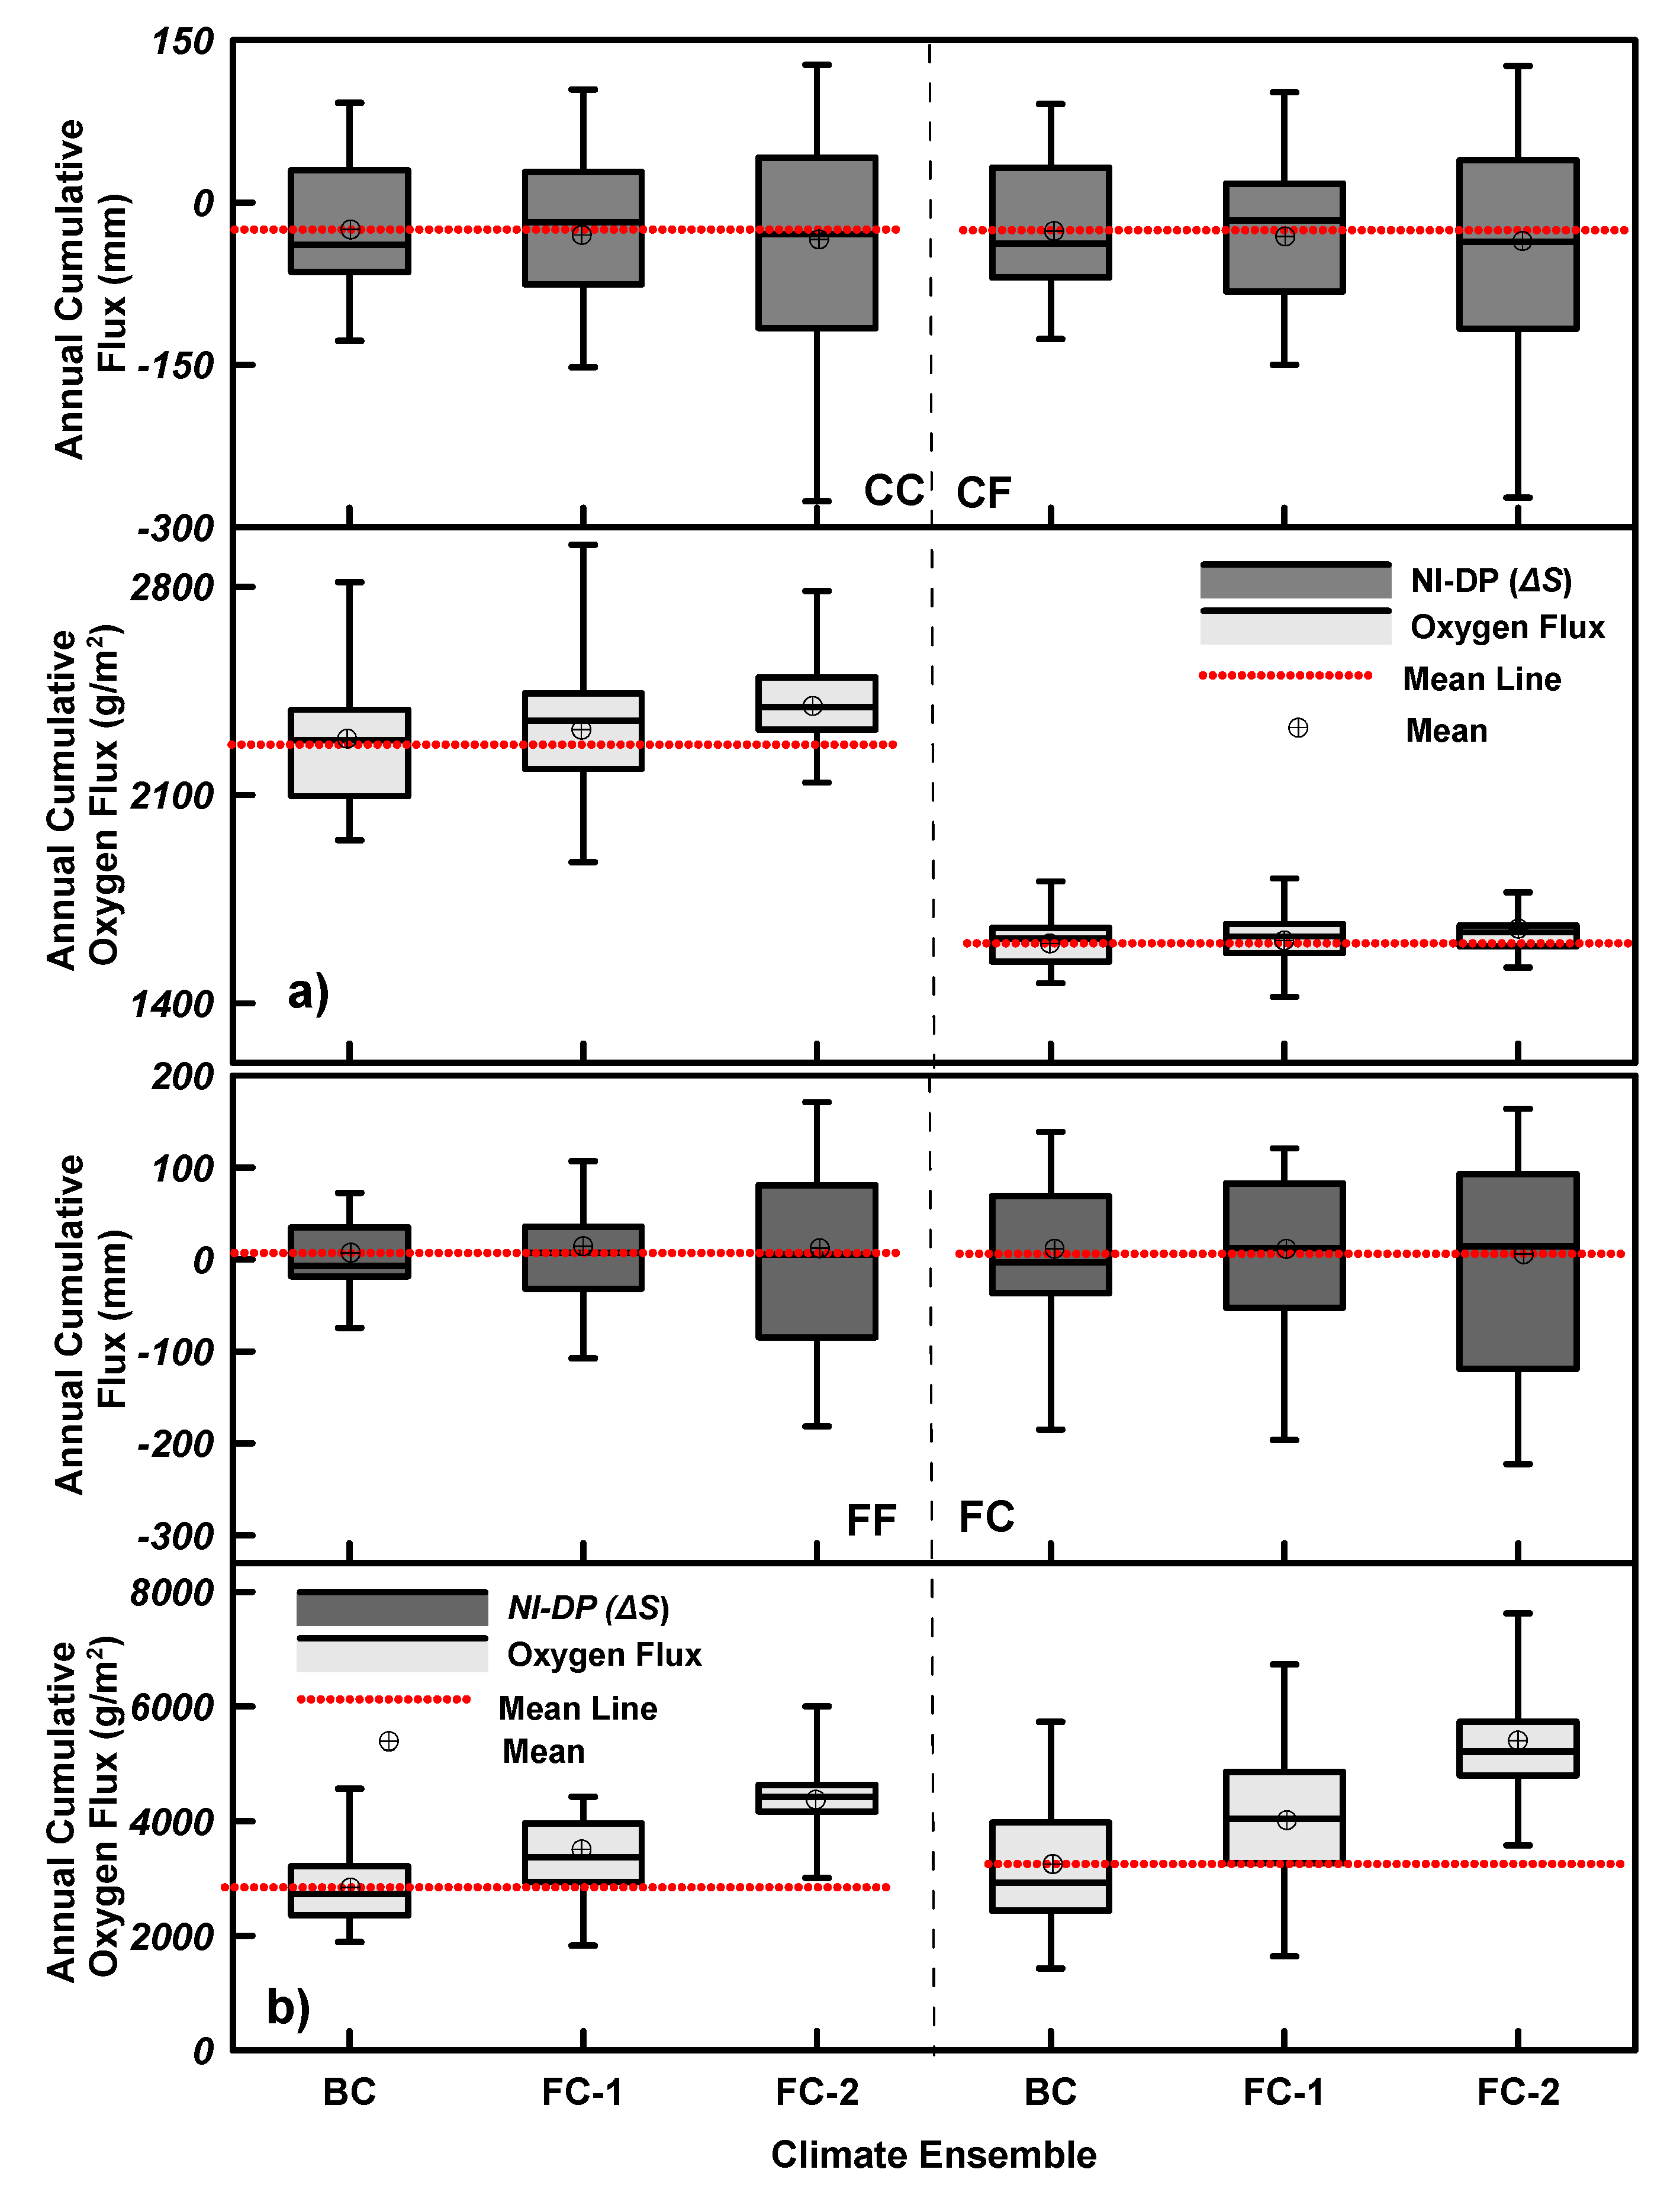
6.4. Annual Variations in Water Storage and Oxygen Flux

The box and whisker plots for change in annual storage, ΔS (difference in N I and D P ) and oxygen flux are presented in Figure 9 for the both fine and coarse tailing covers for all the climates. The change in storage of the cover layer is determined by estimating the quantity of water entering or leaving the top (ground surface) and bottom boundary (cover tailings interface) of the cover. As mentioned earlier, the meteoric water that enters or leaves the cover surface at the top boundary is called N I .
A portion of this water can make its way into the tailings and is known as D P . In some instances, for shallow groundwater table depth and tailings with high AEV, water from the tailings can also enter the cover via capillary action. The difference between the N I and D P predicts the changes in the cover storage (saturation). The positive value of ΔS represents the gain in storage, while the negative predicts the loss of in cover storage. The value of ΔS is related to the ingress of the oxygen in the sense that it affects the cover saturation which is the controlling parameter for oxygen transport. It should be noted that the cumulative value of ΔS indicates the net water loss or gain during the period in which cover is thawed and moisture transfer can take place across the soil atmosphere boundary.
Figure 9a shows the box and whisker plots of the annual ΔS and oxygen flux for all the cover profiles. The results indicate that for the CC profile, the mean annual ΔS (30 years) are −24, −22 and −42 mm for the base, FC-1 and FC-2 future climates, respectively. Therefore, it can be concluded that the difference in mean values for base and future climates is minimal. However, the year to year variation in ΔS for the future climates is much larger than the base climate. For example, the difference in maximum and minimum annual ΔS for the CC profile is 219, 256 and 403 mm for base, FC-1 and FC-2 climates, respectively. This increasing trend (in the range) is reflective of more year to year variation and the existence of extreme weather years in the future climate ensembles. More variation can be seen for future climate ensemble FC-2. Similar observations regarding the changes in ΔS can also be made for the CF profile and ΔS values for the CC and CF profiles are very similar.
Figure 9a also shows the box and whisker plots for the annual oxygen flux for the coarse tailing covers. For cover profile CC, it can be observed that changes in cover saturation result in variations in yearly flux values. Larger year to year variation can be observed for FC-1, while larger mean and median increases can be observed for future climate FC-2. For cover profile CF, it can be observed that oxygen flux values are much smaller than the values for CC profile. This result seems surprising, as ΔS values for both profiles are quite similar. 
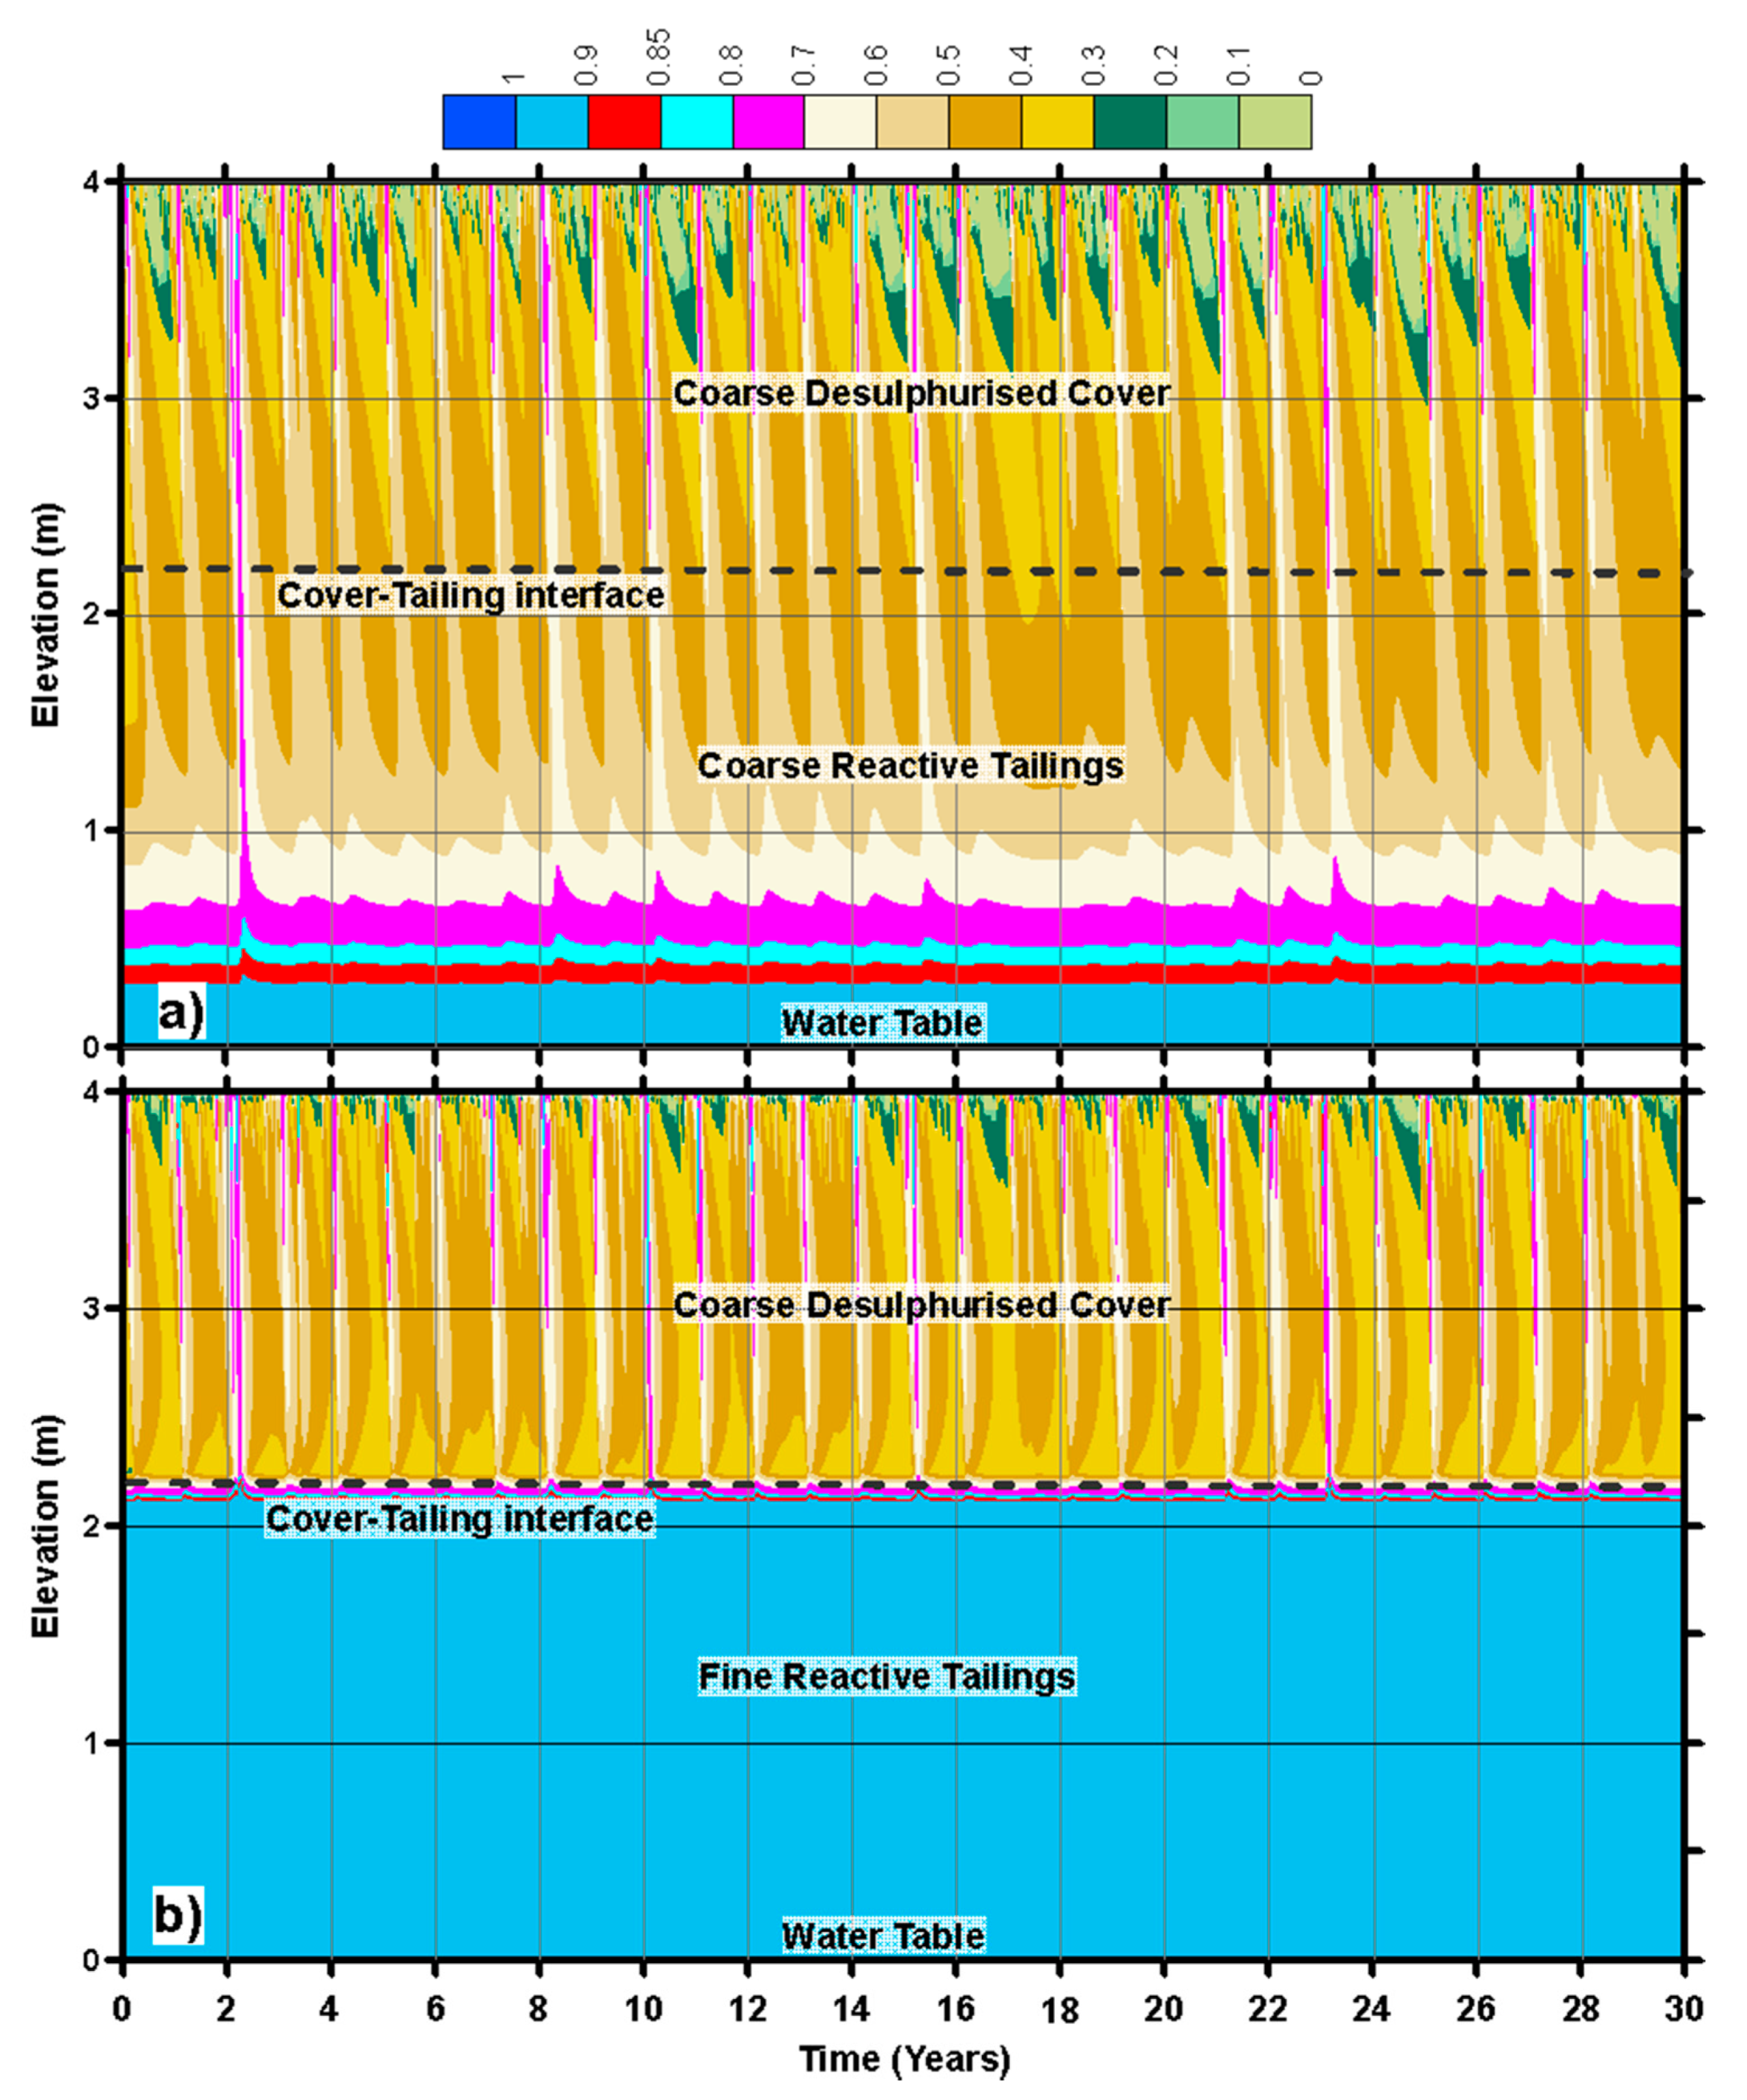
Figure 10 shows the time history of saturation for the CC and CF profiles for the base climate. This figure shows that the saturation profiles for CC and CF are quite different. For example, for the CF cover profile, the reactive tailings remain at saturations higher than 90%. This is in contrast to the CC profile where most of the reactive tailings remain at saturations levels between 40 and 50%. Additionally, it can also be observed that the cover of the CF profile has much higher saturations than for the CC profiles. The higher tailings and cover saturation in the CF profile is due to higher AEV of the fine reactive tailings and which is responsible for lower oxygen flux in the CF profile. Therefore, it can be concluded that the performance of coarse cover lying over fine reactive tailings is less dependent on the climate and will be less prone to future climate changes.
Figure 9b shows the changes in saturation and oxygen flux values for the FF and FC profiles. The change in saturation for these profiles are similar to those predicted for the coarse cover profiles. It can be observed that with the changing climate, larger variations in year to year in saturation can be observed. It can also be observed that this variation is more pronounced for fine cover lying over fine tailings. The oxygen flux values for the FF and FC profiles shown in Figure 9b indicate that oxygen flux increases considerably for the future climates FC-1 and FC-2 in comparison to the base climate. This increase is greater for FC-2 as compared to FC-1. It can also be observed that FC profiles show more sensitivity to future climates than the FF profile. This is consistent with our observation from coarse cover profiles, where cover overlying fine tailings showed less dependence on climate. Based on the observations made for all cover profiles, it can be concluded that larger quantities of oxygen will enter the fine covers with changing climates.

6.5. Cumulative Oxygen Fluxes

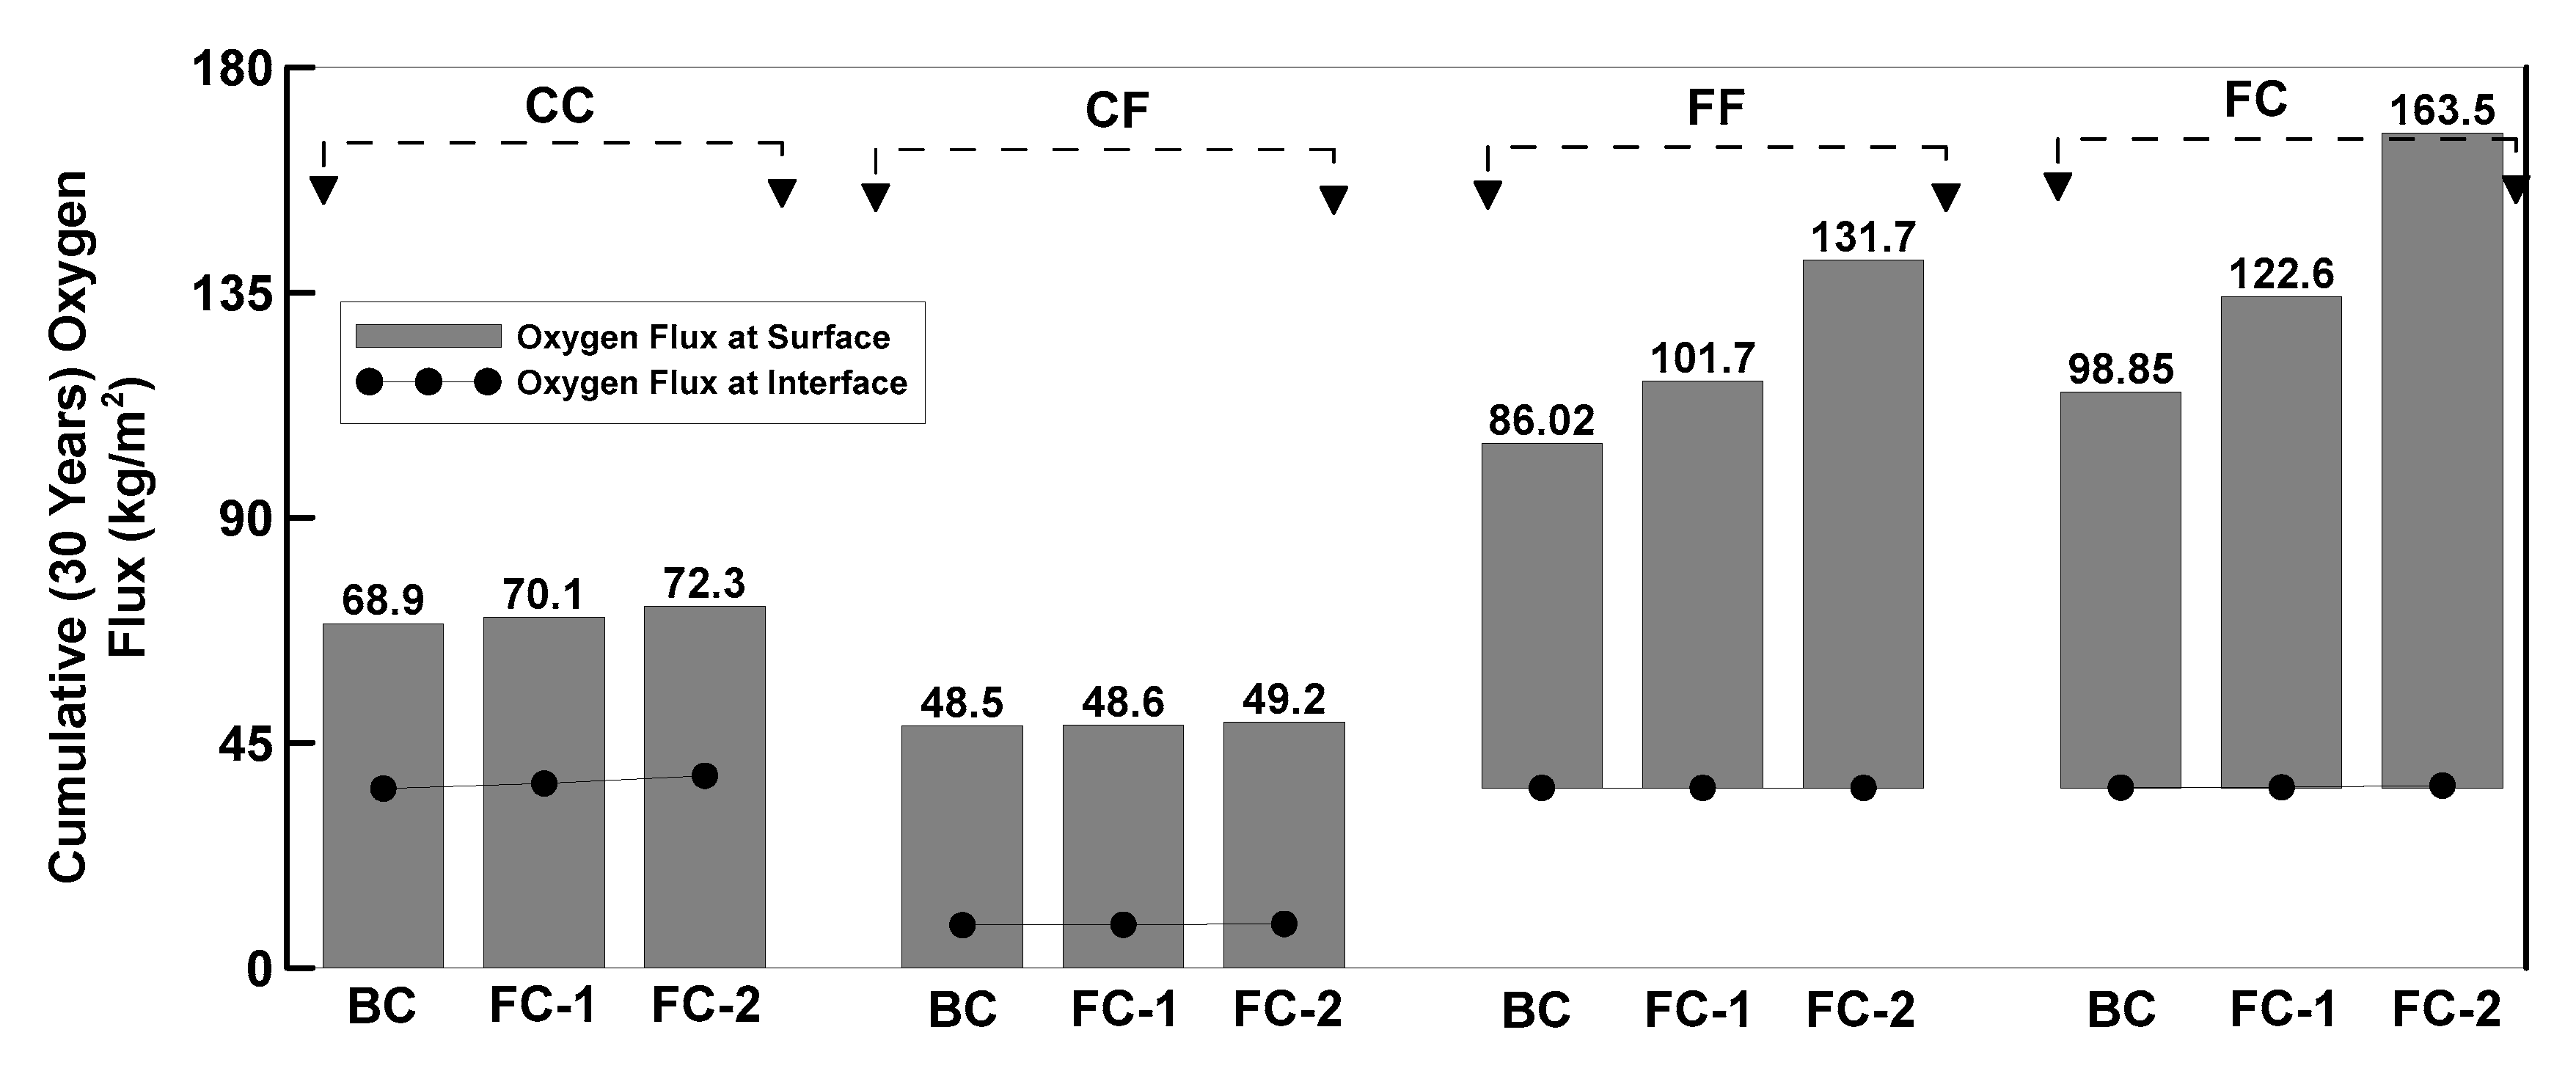
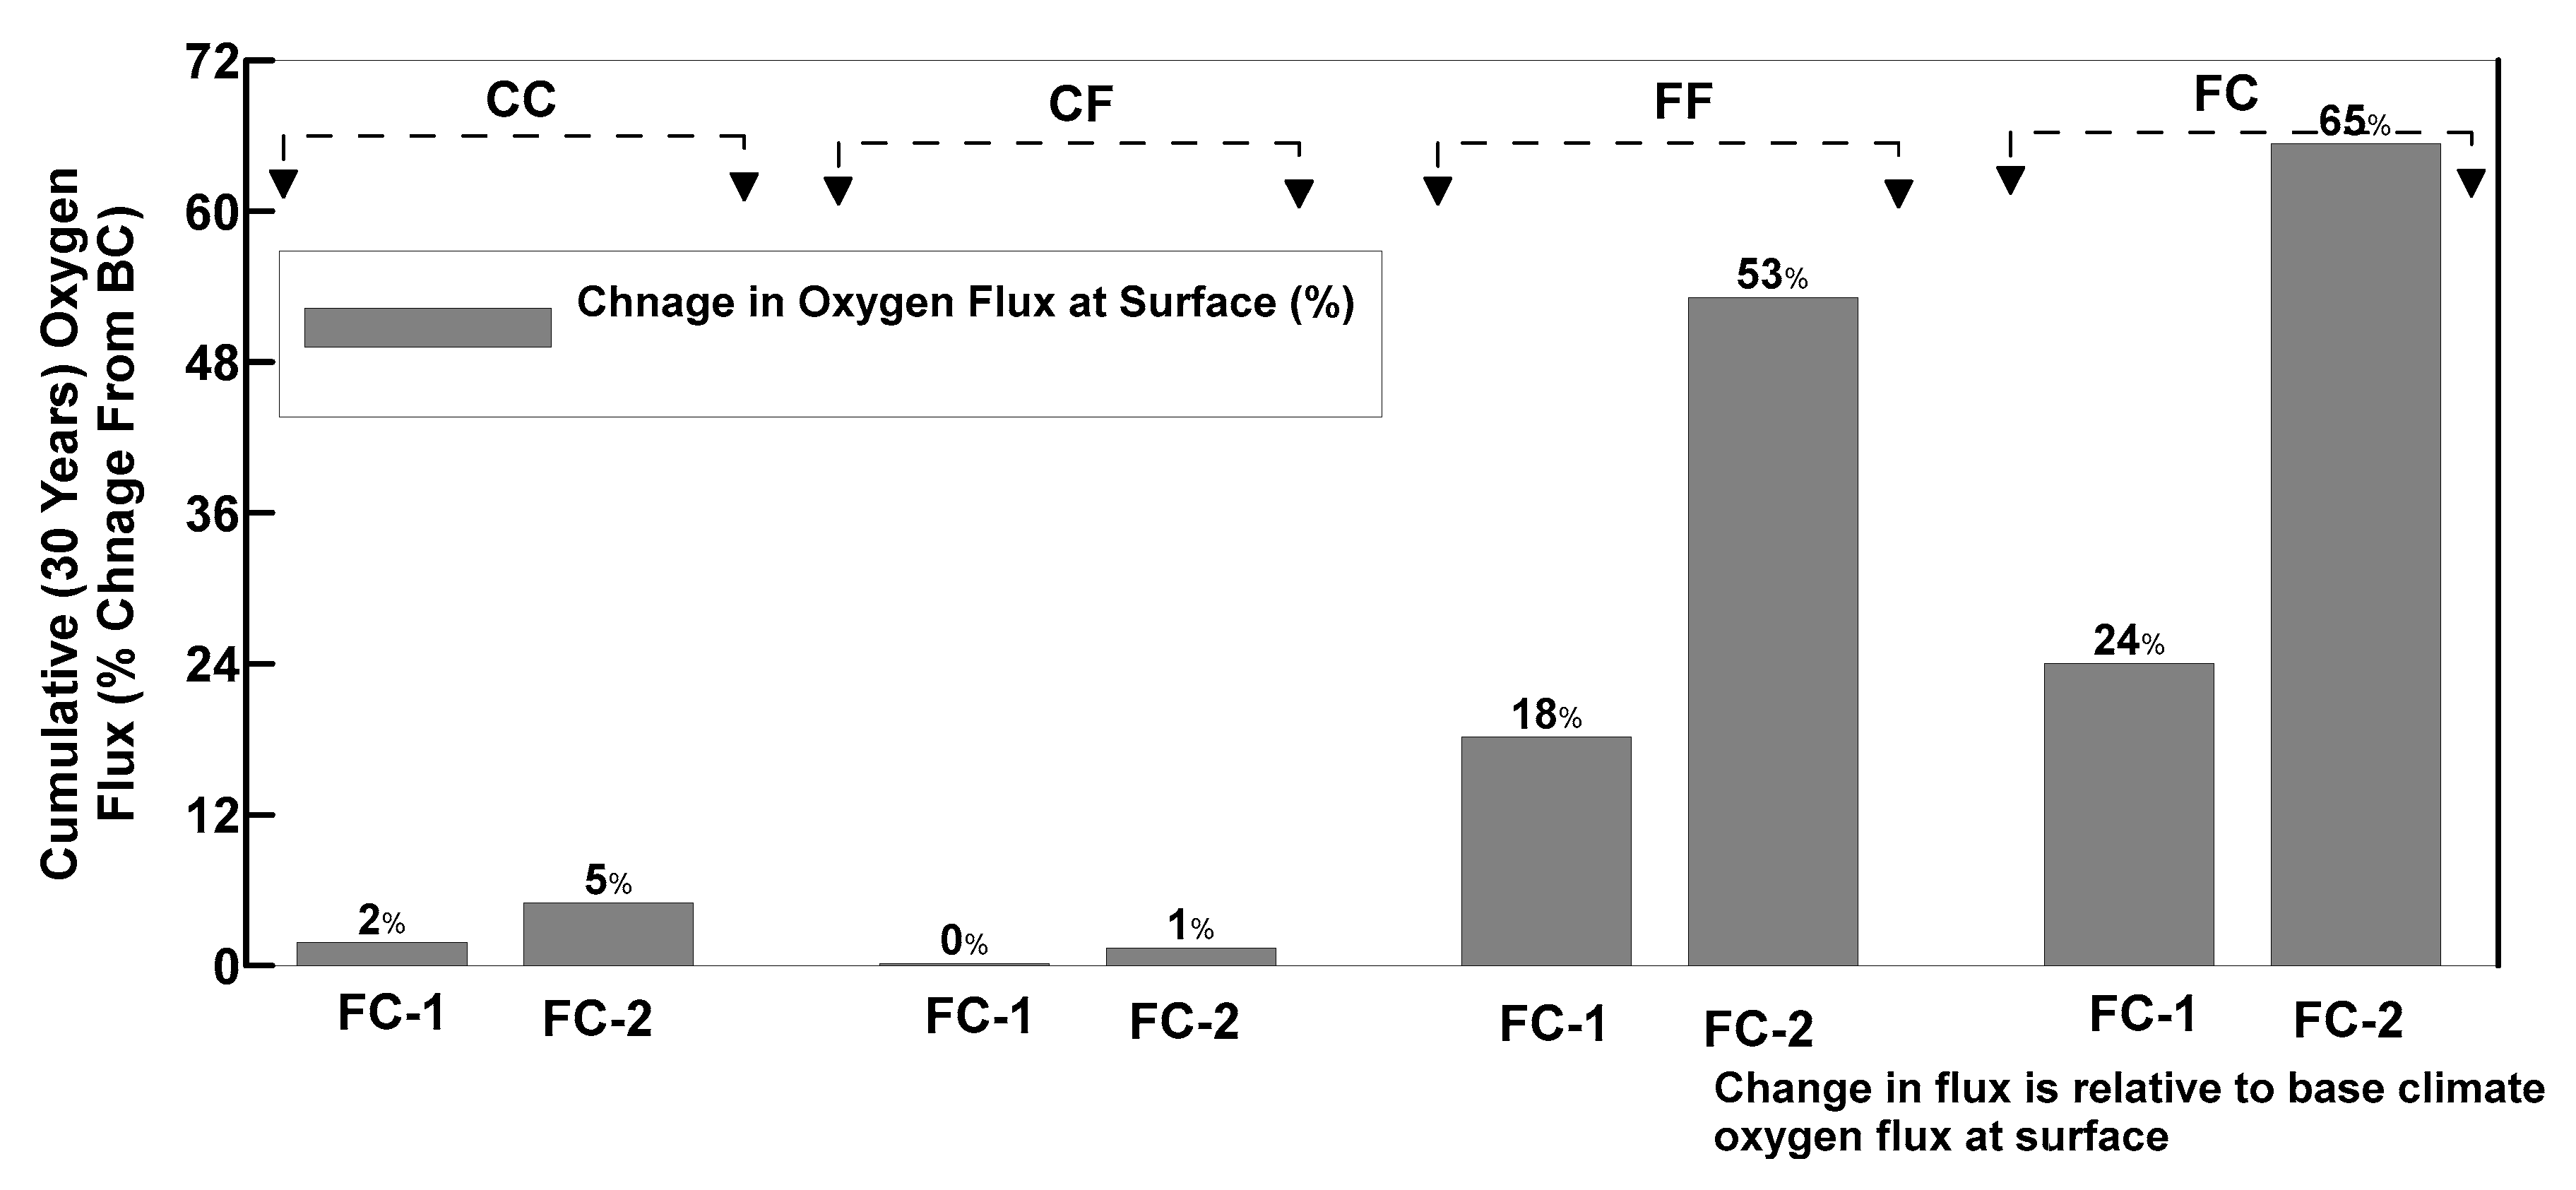
Figure 11 shows a comparison of the 30-year cumulative oxygen flux values for all profiles predicted at the cover surface and the cover–tailings interface. The coarse tailing covers (CC and CF profiles) reveal a smaller variation in cumulative oxygen flux for all climates. The variations in the surface oxygen flux for future climates are shown as a percentage change relative to the base climate in Figure 12. The results indicate that these changes are minimal. These further reinforce earlier observations that performance of coarse covers will not be impacted by the changing climate. It should be noted that based on the results presented in the previous section for CC cover profile some variation in yearly oxygen flux values is expected for changing climate. However, in the cumulative sense, these only account for 2% and 5% change in relation to the base climate.
The 30-year cumulative oxygen flux values for the fine cover profiles in Figure 11 indicate considerable differences compared to the coarse cover profiles. For fine cover profiles, the oxygen flux at the tailings–cover interface is negligible. This is not a surprising result, as the presence of fine material in tailings and/or cover is expected to maintain higher levels of saturation resulting in minimal oxygen ingress. 
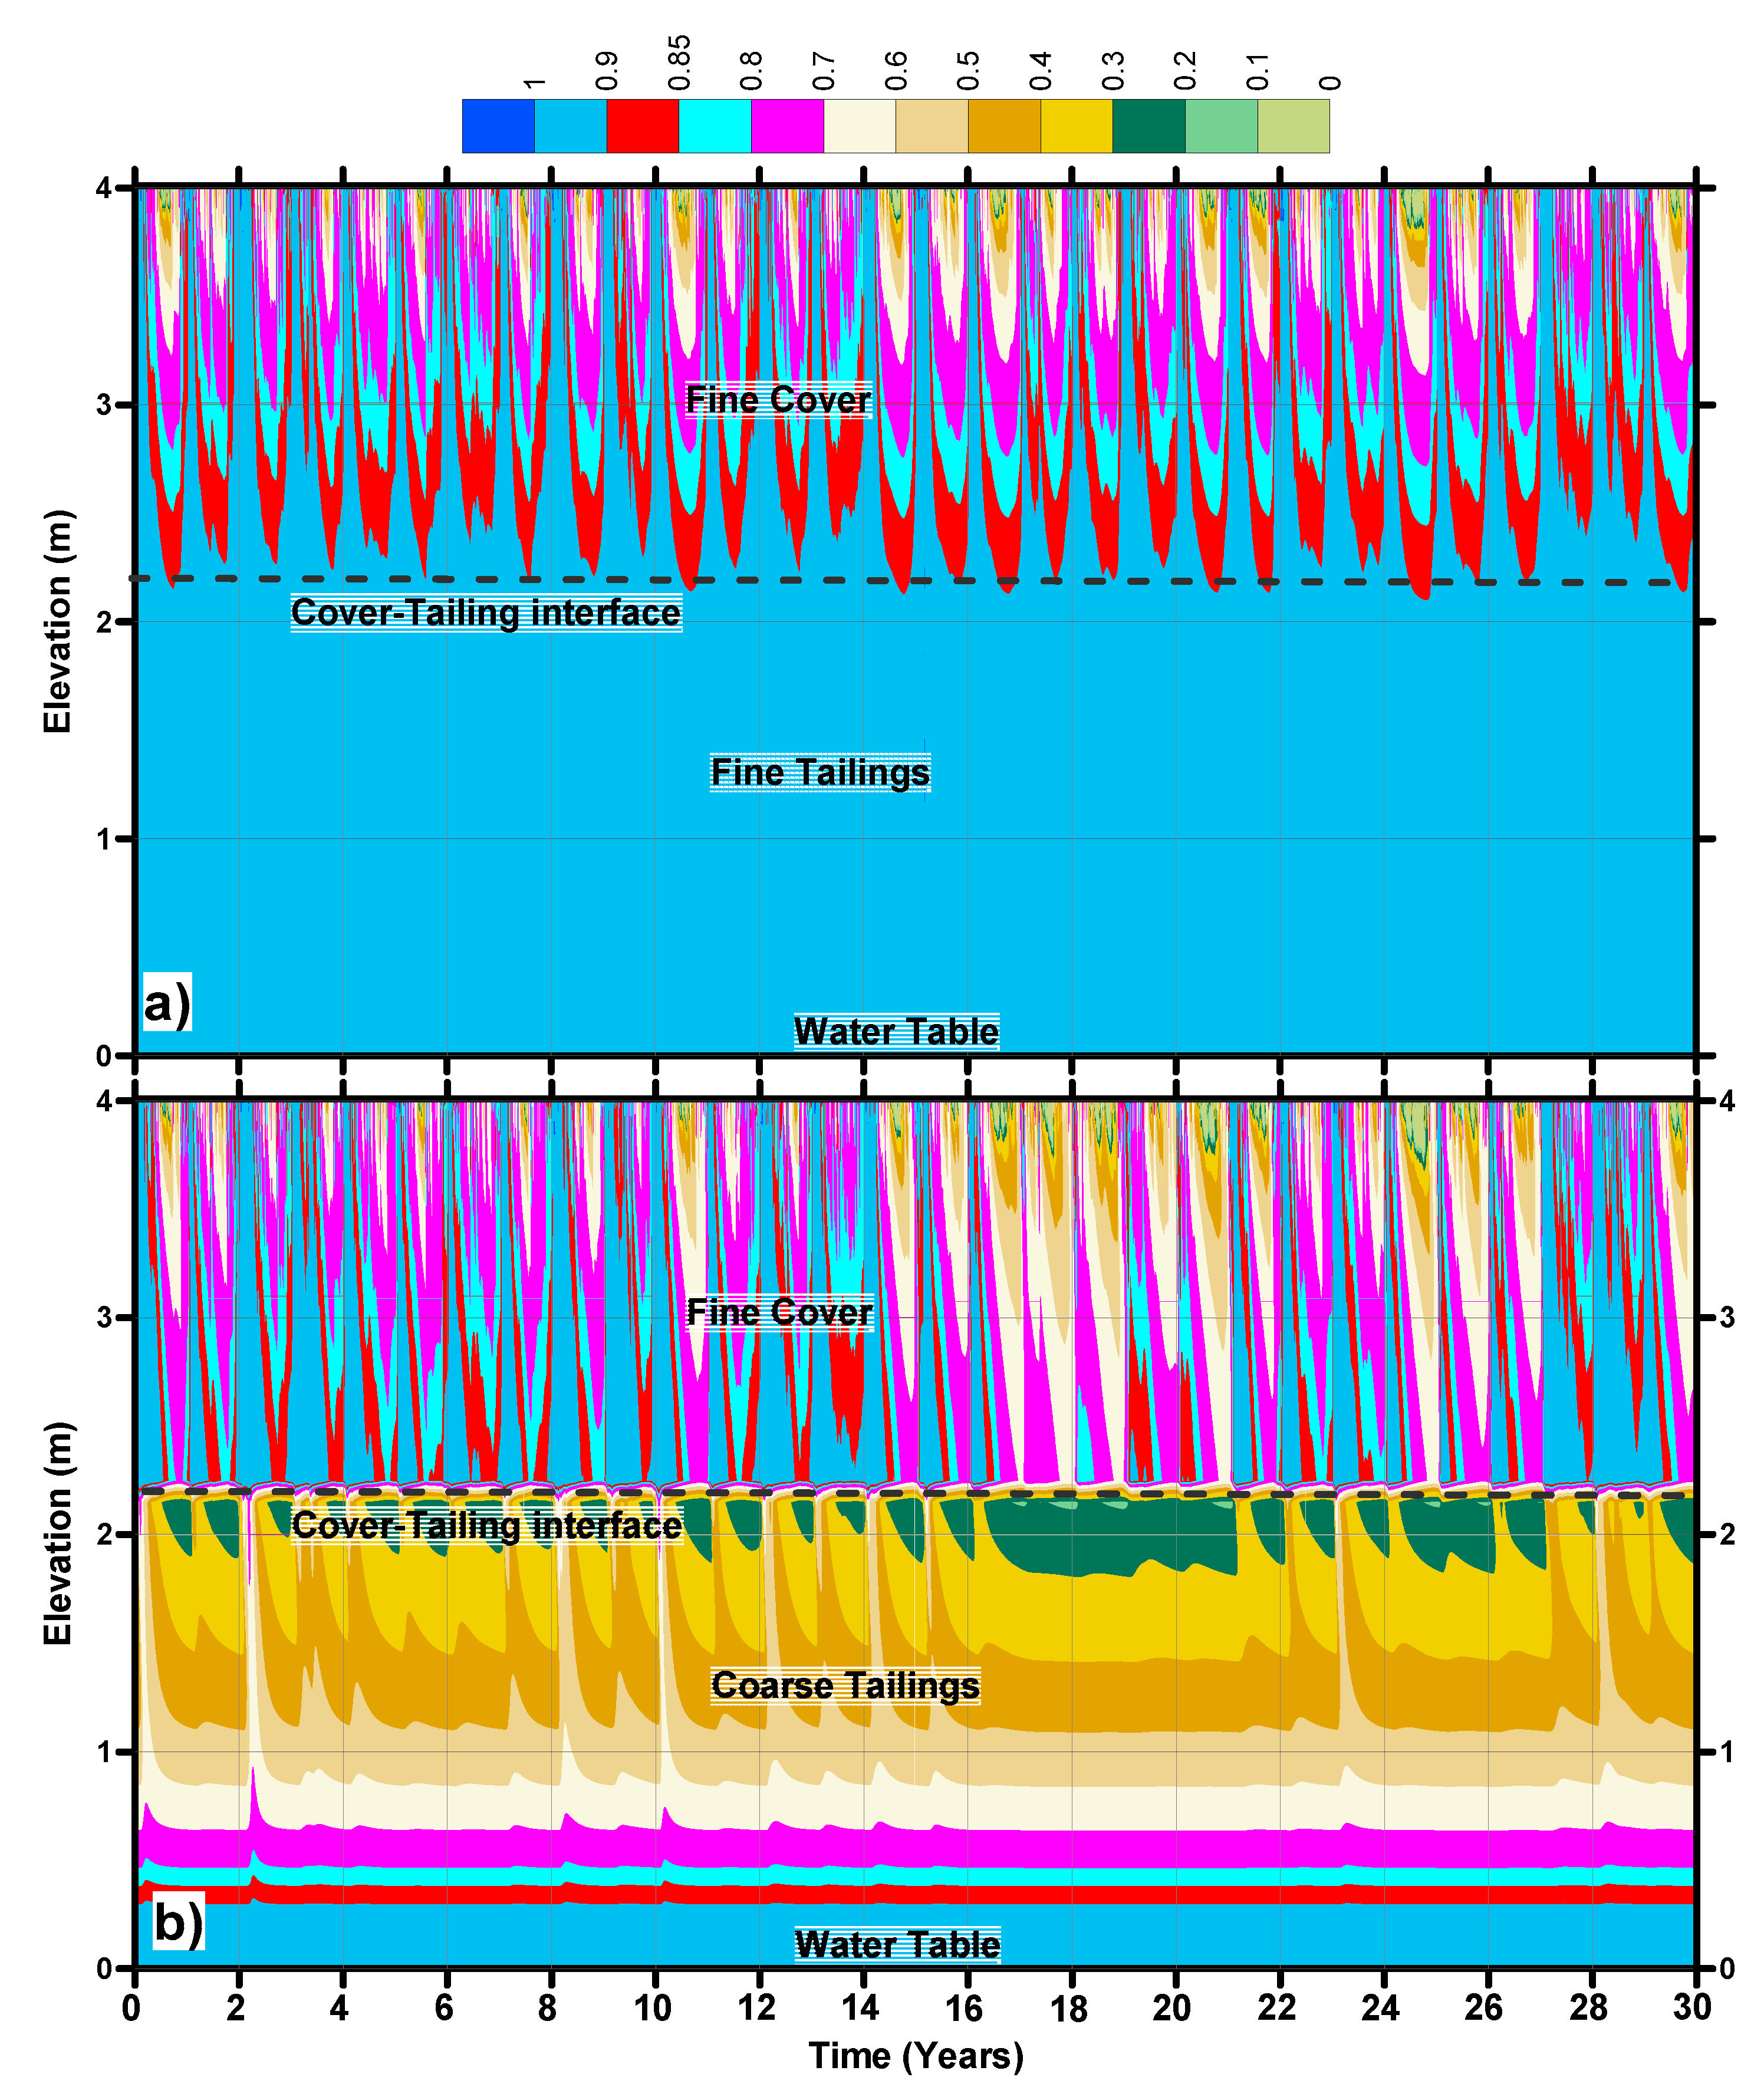
Figure 13 shows the saturation time history of the FF and CF profiles for 30 years of base climate. The saturation time history of the FF profile shows that saturation of the fine acid generating tailings never falls below 85%. This is due to the location of the groundwater table depth and high AEV of the tailings. It can also be observed that the cover comprising of the desulfurized fine tailings is also very effective in maintaining higher saturations and the bottom 30 cm of the cover always remains at saturation in excess of 85%. The time history of saturation for the FC profile is also shown in the same figure. It can be observed that for most of the coarse acid generating tailings, the saturation varies from 20% to 60%. However, the cover saturation near the cover tailings interface remains above 85%. There are only a few instances during the 30-year period when saturation at the interface is 70% or slightly lower.
Figure 11 and Figure 12 also show the oxygen flux values at the cover surface for fine covers. The flux values increase with changing climate. Larger changes in the 30-year cumulative flux values for FF and FC profiles can be observed for the FC-2 climate ensemble. In relation to the base climate, the flux values for the FF cover profile increase by 18 and 53% for the FC-1 and FC-2 climates, respectively. Similarly, for the FC cover profile the oxygen flux at the cover surface increases by 24% and 65% for the FC-1 and FC-2 climates, respectively. The increase in surface oxygen flux for fine cover profiles is related to the higher effective reactive coefficient ( K r ) of the fine tailings as compared to the coarse. The K r value of fine tailings is an order of the magnitude larger than for the coarse tailings material ( K r for fine 44 year−1 and K r for coarse is 3.44 year−1). The other reason could be due to the increased evaporative demand because of the changing climate. The fine cover will retain more water in the near surface layer, increasing actual evaporation, resulting in a decrease in cover saturations with increased oxygen ingress at the surface.
The results reveal that the FC profile has the largest variation in the cumulative water and the oxygen flux and is observed as more sensitive to the climate variations (Figure 9b and Figure 11). The profile CF represents the most accurately as-built configuration of tailings cover over reactive tailings at Detour Lake Mine [10]. Therefore, the CF and FC profiles are selected further to assess the temporal effects of climate changes on these profiles.
Time histories of saturation and oxygen concentration versus depth for the CF profile for all design climates are shown in Figure 14. Figure 14a–c show the saturation depth plots whereas the Figure 14d–f show concentration depth plots for the three climates. Figure 14a–c clearly show that the tailings are at nearly 100% saturation, except the region close to the interface, for all climates. The saturations at the interface are consistently between 60 and 70% for CF profile for all climates. There are also some instances when the saturation becomes more than 85% at the interface. The time history of saturation with depth in the cover is generally in the range between 30 and 50% during BC, FC-1 and FC-2, with some dry spells when the saturation in the covers drops in the range between 10% and 20%. These low saturations in the cover are more obvious near the cover surface. These low saturation conditions are more frequent in FC-1 and FC-2 (every year) and the depth of these low saturation contours can reach a depth of up to 1.75 m below the cover surface, especially during FC-2. It can be concluded that the cover saturation with depth is decreasing with change in climate and the saturation starts decreasing from the surface, and as the climate becomes drier, the low saturation contour progresses further down.
Oxygen concentration inversely follows the saturation plots (Figure 14d–f). As the tailings remain nearly saturated, the oxygen ingress in the reactive tailings is negligible for all climates. Almost one-fourth of the upper portion of the cover receives high oxygen concentration (~280 g/m2) during BC. The high oxygen concentration contours almost reach the upper half of the cover for FC-1 climate and go beyond this depth that for the climate FC-2. However, there are instances when the oxygen concentration drops in the range between 150 and 250 g/m2 near the cover surface. The oxygen concentration in the cover near the interface is generally in the range between 100 and 200 g/m2 for base climate and between 200 to 250 g/m2 for future climates, respectively. The reason for the high oxygen concentration in the cover near the interface during the future climate is due to lower saturation near the interface. It can be concluded that no sufficient oxygen will pass through the cover in to the tailings, but with climate change conditions, a greater presence of oxygen near the interface is expected.
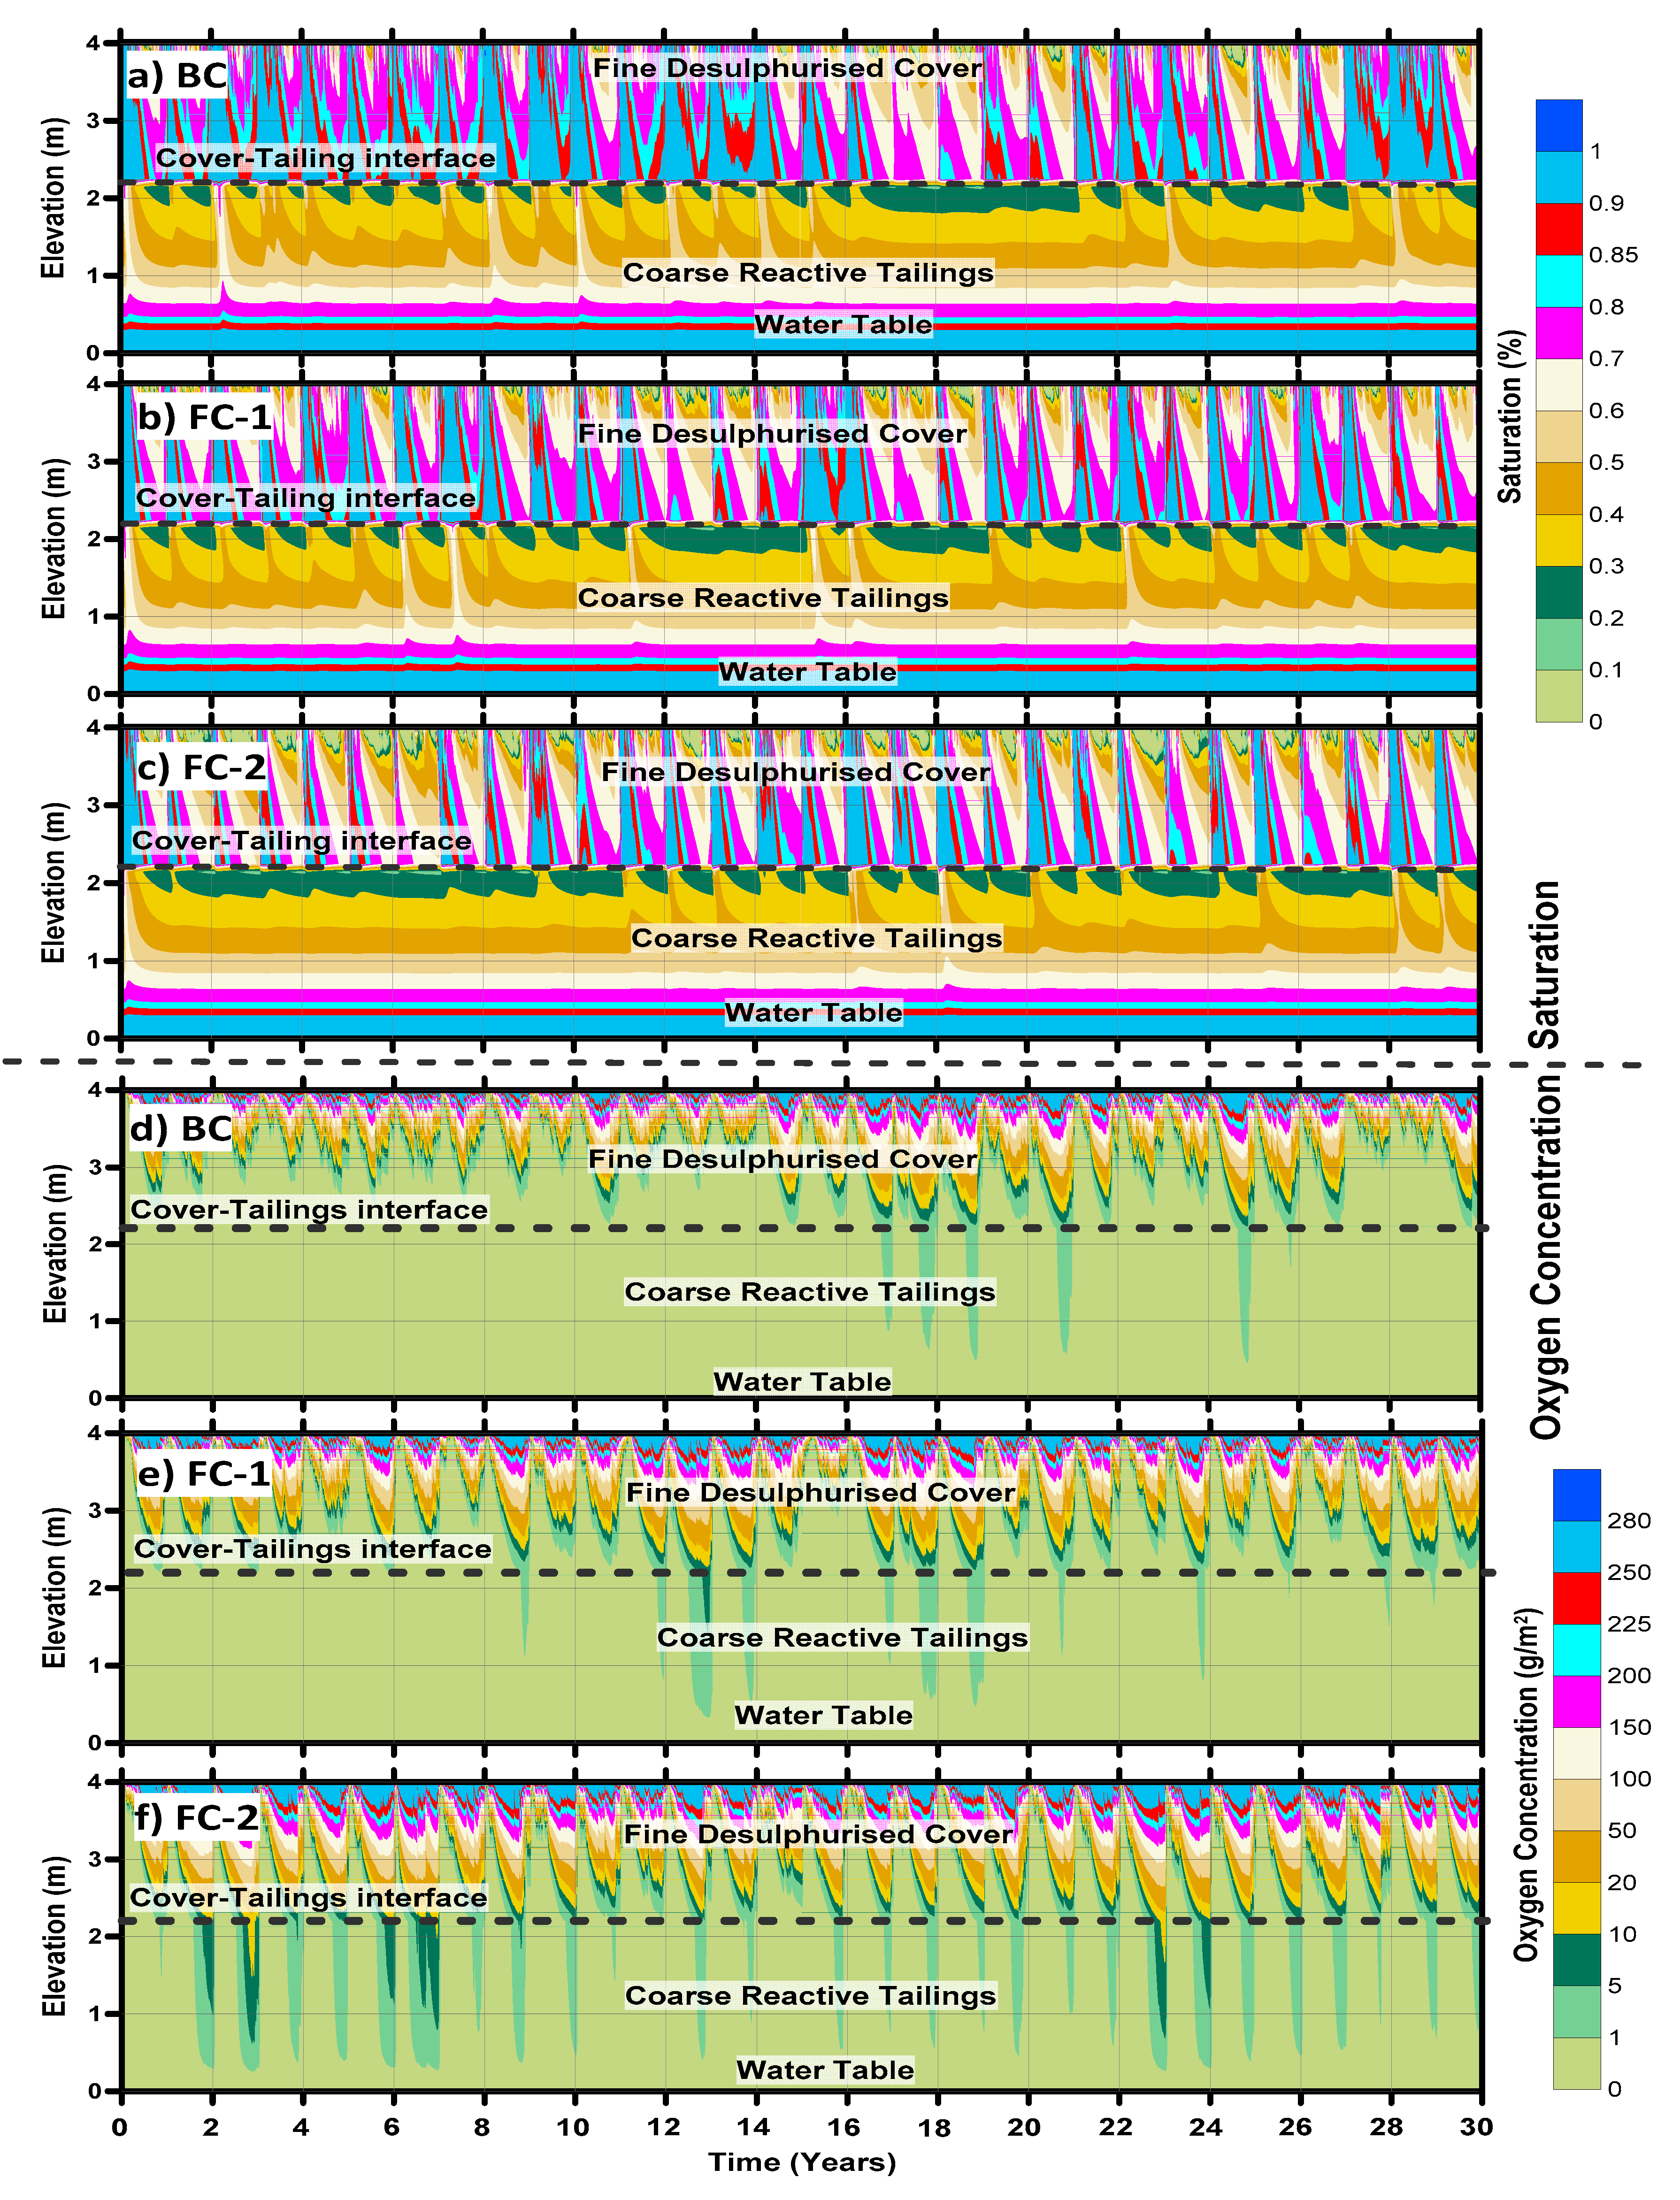
The 30-year time histories for saturation and oxygen concentration versus depth for the FC profile of all the design climates are shown in Figure 15. Figure 15a–c show the saturation depth plots, whereas Figure 15d–f show concentration depth plots for BC, FC-1 and FC-2, respectively. In this figure, it can be observed that the saturation in the tailings increases with depth, and that the tailings become saturated at a depth of 4.0 m (which is groundwater table). The time saturation plot also shows that the saturation in the tailings near the interface is between 20 and 30% for all climates (Figure 15a–c). However, there are instances when the saturation increases in the range between 30% to 50% and these cases are more obvious for BC. The fine cover of the profile FC is expected to have high saturation in the cover layer. The upper portion of the cover up to about 0.6 m experiences a wide range of saturation conditions (between 20% and 95%). Beyond this depth, the cover saturation is normally in the range between 60% and 95 %. The saturation in the cover near the interface is generally higher than 85%. However, there are instances when the saturation over the interface is below 85% and these instances are more common during FC-2.
As the saturation over the interface remains 85% in most of the instances, therefore, the oxygen concentration in the tailings is extremely low (Figure 15d–f). However, in the instances when the saturation at the interface is below 85%, oxygen concentrations between 0 and 1 g/m2 can be observed in the tailings for all climates. For FC-1 and FC-2, there are instances when the concentration in the tailings increases to a range between 5 and 10 g/m2. Moreover, there are few years during FC-2 (year 3, 7, and 23) when the concentration goes past this range up to 20 g/m2. This is due to the lower saturation near the interface during this time of the year. Similar to the saturation plots, the oxygen concentration in the upper portion (0 to 0.6 m approximately) is highly variable, falling in the range between 100 and 280 g/m2. Beyond this depth, the oxygen concentration is generally in the range between 5 and 100 g/m2. Overall, the fine cover maintains high saturation during 30-year time period near the interface, which results in the low ingress of oxygen into the tailings in all climates.

7. Discussion

That the coarse tailings cover a considerable amount of oxygen flux at the tailings–cover interface was predicted; however, the results indicate that their performance will not deteriorate with changing climate (Figure 11). Although the year to year variation in the oxygen ingress is expected in the future, the cumulative 30-year oxygen ingress is not much different in the coarse covers for all climates. The effectiveness of the coarse cover generally depends on the underlying tailings. The covers placed over the fine tailings have shown higher saturation along the cover-tailings interface due to high AEV value of the tailing materials.
Fine tailing covers (FF and FC profiles) have shown a greater sensitivity to climate change (Figure 11 and Figure 12). High water retention levels in the fine tailing covers (due to their high AEV) result in the higher actual evaporation rate due to the continuous availability of water at or near the surfaces (Figure 8). The increasing evaporative demands for future climates (Figure 8) result in increased loss of moisture. In the case of fine tailings cover over fine tailings (FF), the cover saturation can increase with capillary rise from groundwater tables. Therefore, the increasing loss of moisture in the cover due to climate change will be compensated through the capillary rise action. However, a capillary barrier exits in the FC case between the groundwater table and the fine tailings cover due to the existence of the groundwater table within the coarse tailings (AEV = 6 kPa or 0.6 m). Therefore, for the FC profile, the moisture loss due to increasing evaporative demand is likely to create a considerable reduction in the saturation, which potentially cannot be compensated from the groundwater table through capillary rise.
Although oxygen flux transmitting to the underlying tailings through fine tailing covers is minimal, they experience relatively high oxygen fluxes at the cover surface. In other words, the fine tailing covers have higher oxygen concentration than the coarse covers. This increases the possibility of oxygen reaction with residual sulphide contents in desulphurized tailings materials which can add up to the expected production of AMD [8]. It is, therefore, of prime importance to select the desulphurized tailings cover materials with low sulphide concentrations to avoid additional production of AMD.
Finally, the groundwater table is a key consideration for preliminary design of tailing covers. Fluctuations in the depth of groundwater are expected due to climate change [16], whereby the reduction in annual precipitation and increase in annual evaporation can result in the lowering of the water table. For the climate FC-2, the predicted cumulative PE is roughly 24% higher than precipitation, significant lowering of the groundwater table depth—compromising the performance of the covers—can be expected in the future.

8. Concluding Remarks

Climate is a primary design variable in soil cover design; therefore, climate change poses a number of challenges to the design, operation and long-term performance of covers. The performance of covers constructed with coarse and fine desulphurized tailings at a site in Northern Ontario were analyzed under historical and future climatic conditions. Predictions of future climate were made with general circulation models (GCM) using different representative concentration pathways (RCP).
The compilation of 30-year climate data indicated that there was a larger year to year variation in climatic conditions at the site. On average, the climate of the site can be classified as Moist Humid/Humid according to climate classification by Thornthwaite and Hare [34]. Such a climate is representative of the net moisture excess at the ground surface. The compilation and classification of future climate data from three different GCMs for all four different RCPs indicated that there is an increasing trend in the temperature for the site in the future. This trend is consistent for all GCMs and radiative forcing values. The temperatures are expected to increase with increased radiative forcing values, with larger changes expected at the end of the century.
The review of the future precipitation data indicated that increases in median annual precipitation values are expected for most of the climate change scenarios. For the thirty-six climate ensembles considered in this research, only three showed a decrease in median values of precipitation in comparison to the baseline value. However, the climate classification for the future climate data indicated an expected decrease in moisture availability for the future. This is related to the increase in evaporative demand with the expected increase in temperature. In conclusion, a drier climate can be expected for the site in the future.
The performance assessment of tailing covers was carried out using soil atmosphere numerical modeling. Numerical models were developed with measured soil hydraulic properties and measured historical and predicted future climate data. The model was validated against published results. The results of the numerical modeling indicate that the covers constructed with coarse materials are expected to have water gain conditions at the cover surface for the dry and wet years of future climates.
However, the fine tailings covers are expected to show different behavior during dry and wet years for future climates. It is expected that net water loss conditions will occur during the dry years and water gain conditions expected for wet years of future climatic conditions. Net water loss conditions can be helpful for covers where the primary objective is infiltration control; however, for covers which are expected to maintain a high saturation to impede oxygen flux can see performance deterioration. This leads one to conclude that the effect of climate change needs to be understood within the context of cover design objectives and hydraulic properties of the cover materials.
The results of the numerical modeling indicate that the fine tailings cover maintains high saturation as compared to the coarse cover which results in the low oxygen ingress for historical and future climates. Coarse tailing covers are more effective in controlling oxygen ingress when placed over fine tailings as opposed to the coarse tailings.
The results of this study suggest that the effect of climate change on coarse tailing covers will be marginal resulting in a maximum increase of 5% in oxygen flux values in comparison to the base climate. Again, the performance of fine tailing cover was observed to be more effective for the case when they are placed over fine tailings as opposed to the coarse tailings. Unlike the coarse covers, fine tailing covers showed a significant variation in their performance with changing climate. For the fine covers, the 30-year cumulative oxygen flux entering the reactive tailings was negligible; however, the oxygen flux entering the cover could potentially be significantly higher for changing climate. This can have ramifications in terms of acid generation from residual sulphide in the cover materials.
The results in this study are based on the modelling of a single layer tailings cover assuming that the flow is primarily vertical. This assumption can have implications to the water balances results, because the covers are generally placed at a certain angle to regulate the surface water. In this regard, 2D simulations could be helpful to understand lateral flow effects and its implications on cover saturation and oxygen ingress. It is also expected that the hydraulic properties of the cover materials will change with time. These changes should also be considered in future studies. The behavior of single layer coarse and fine tailings cover is assessed against climate change. The current study only focuses on carrying out the analysis for the selected single layer cover profiles. However, considering the heterogeneity at the site, more combinations of cover profiles need to be analyzed. Based on the outcome of this research, a fine cover layer overlain by a thin evaporative barrier layer (coarse) could be an excellent option to avoid the ingress of oxygen by maintaining high saturation in the cover layer. However, this cover combination needs to be further evaluated under future climate conditions.

Author Contributions

Conceptualization, R.B. (Rashid Bashir); methodology, R.B. (Rashid Bashir) and F.A.; software, F.A.; validation, F.A., R.B. (Rashid Bashir) and R.B. (Ryley Beddoe); formal analysis, F.A. and R.B. (Rashid Bashir); investigation, R.B. (Rashid Bashir) and F.A.; resources, R.B. (Rashid Bashir) and R.B. (Ryley Beddoe); data curation, R.B. (Rashid Bashir), R.B. (Ryley Beddoe) and F.A.; writing—original draft preparation, F.A. and R.B. (Rashid Bashir); writing—review and editing, F.A., R.B. (Rashid Bashir) and R.B. (Ryley Beddoe); visualization, R.B. (Rashid Bashir) and F.A.; supervision, R.B. (Rashid Bashir) and R.B. (Ryley Beddoe); project administration, R.B. (Rashid Bashir) and R.B. (Ryley Beddoe); funding acquisition, R.B. (Rashid Bashir) and R.B. (Ryley Beddoe). All authors have read and agreed to the published version of the manuscript.

Funding

This research was funded by individual Discovery Grants from Natural Sciences and Engineering Research Council Canada to Rashid Bashir and Ryely Beddoe.

Acknowledgments

Authors would like to acknowledge the support of GEOSLOPE for making their software available to students for teaching and research purposes.

Conflicts of Interest

The authors declare no conflict of interest.

References

  1. Pabst, T.; Aubertin, M.; Bussière, B.; Molson, J. Column tests to characterize the hydrogeochemical response of pre-oxidized acid-generating tailings with a monolayer cover. Water Air Soil Pollut. 2014, 225. [Google Scholar] [CrossRef]
  2. Nicholson, R.V.; Gillham, R.W.; Cherry, J.A.; Reardon, E.J. Reduction of acid generation in mine tailings through the use of moisture-retaining cover layers as oxygen barriers. Can. Geotech. J. 1989, 26, 8. [Google Scholar] [CrossRef]
  3. Lindsay, M.B.J.; Moncur, M.C.; Bain, J.G.; Jambor, J.L.; Ptacek, C.J.; Blowes, D.W. Geochemical and mineralogical aspects of sulfide mine tailings. Appl. Geochem. 2015, 57, 157–177. [Google Scholar] [CrossRef]
  4. MEND. Review of Water Covers Sites and Research Projects. MEND Project 2.18.1; MEND. 1997. Available online: http://mend-nedem.org/wp-content/uploads/2013/01/2.18.1.pdf (accessed on 21 September 2020).
  5. Yanful, E.K.; Mustafa, S.; Mian, H. Shallow water cover technology for reactive sulphide tailings management. Waste Geotech. 2004, 10, 42–51. [Google Scholar]
  6. Ethier, M.P.; Bussière, B.; Broda, S.; Aubertin, M. Three-dimensional hydrogeological modeling to assess the elevated-water-table technique for controlling acid generation from an abandoned tailings Site in Quebec, Canada. Hydrogeol. J. 2018, 26, 1201–1219. [Google Scholar] [CrossRef]
  7. Dagenais, A.M.; Aubertin, M.; Bussière, B. Parametric study on the water content profile and oxidation rates in nearly saturated tailings above the water table. J. Am. Soc. Min. Reclam. 2006, 405–420. [Google Scholar] [CrossRef]
  8. Demers, I.; Bussière, B.; Benzaazoua, M.; Mbonimpa, M.; Blier, A. Column test investigation on the performance of monolayer covers made of desulphurized tailings to prevent acid mine drainage. Miner. Eng. 2008, 21, 317–329. [Google Scholar] [CrossRef]
  9. MEND. Review of Use of an Elevated Water Table as a Method to Control and Reduce Acidic Drainage from Tailings. MEND Report 2.17.1. 1996; MEND. 1996. Available online: http://mend-nedem.org/wp-content/uploads/2013/01/2.17.1.pdf (accessed on 21 September 2020).
  10. Dobchuk, B.; Nichol, C.; Wilson, G.W.; Aubertin, M. Evaluation of a single-layer desulphurized tailings cover. Can. Geotech. J. 2013, 50, 777–792. [Google Scholar] [CrossRef]
  11. Yanful, E.K. Oxygen diffusion through soil covers on sulphidic mine tailings. J. Geotech. Eng. 1993, 22, 1207–1229. [Google Scholar] [CrossRef]
  12. Aachib, M.; Mbonimpa, M.; Aubertin, M. Measurement and prediction of the oxygen diffusion coefficient in unsaturated media, with applications to soil covers. Water Air Soil Pollut. 2004, 156, 163–193. [Google Scholar] [CrossRef]
  13. Mylona, E.; Xenidis, A.; Csövári, M.; Németh, G. Application of dry covers for the closure of tailings facilities. Land Contam. Reclam. 2007, 15, 163–182. [Google Scholar] [CrossRef]
  14. Bashir, R.; Sharma, J.; Stefaniak, H. Effect of hysteresis of soil-water characteristic curves on infiltration under different climatic conditions. Can. Geotech. J. 2016, 53, 273–284. [Google Scholar] [CrossRef] [Green Version]
  15. MEND. Climate Change and Acid Rock Drainage—Risks for the Canadian Mining Sector. MEND Report 1.61.7. 2011; MEND. 2011. Available online: http://mend-nedem.org/wp-content/uploads/2013/01/1.61.7.pdf (accessed on 21 September 2020).
  16. MEND. Cold Regions Cover System Design Technical Guidance Document. MEND Report 1.61.5c. 2012; MEND. 2012. Available online: http://mend-nedem.org/wp-content/uploads/2013/01/1.61.5c.pdf (accessed on 21 September 2020).
  17. Shurniak, R.; O’Kane, M.; Green, R. Simulation of seven years of field performance monitoring at Rio Tinto Iron Ore, Mount Tom Price Mine using soil-plant-atmosphere numerical modelling. In Proceedings of the Seventh International Conference on Mine Closure; Australian Centre for Geomechanics: Perth, Australia, 2012; Volume 14, pp. 393–405. [Google Scholar]
  18. Geo-Slope International Ltd. Vadose Zone Modeling with VADOSE/W. Available online: https://Www.Geo-Slope.Com/ (accessed on 14 April 2017).
  19. Collin, M.; Rasmuson, A. Gas Diffusivity models for unsaturated porous media. Soil Sci. Soc. Am. J. 1988, 52, 1559–1565. [Google Scholar] [CrossRef]
  20. Aubertin, M.; Aachib, M.; Authier, K. Evaluation of diffusive gas flux through covers with a GCL. Geotext. Geomembr. 2000, 19, 215–233. [Google Scholar] [CrossRef]
  21. Runkles, J.R. Diffusion, Sorption and Depth Distribution of Oxygen in Soils. Ph.D. Thesis, Iowa State University, Ames, IL, USA, 1956. [Google Scholar] [CrossRef] [Green Version]
  22. Romano, C.G.; Ulrich Mayer, K.; Jones, D.R.; Ellerbroek, D.A.; Blowes, D.W. Effectiveness of various cover scenarios on the rate of sulfide oxidation of mine tailings. J. Hydrol. 2003, 271, 171–187. [Google Scholar] [CrossRef]
  23. Mbonimpa, M.; Aubertin, M.; Aachib, M.; Bussière, B. Diffusion and consumption of oxygen in unsaturated cover materials. Can. Geotech. J. 2003, 40, 916–932. [Google Scholar] [CrossRef]
  24. Abreu, S.; Seipel, D. Proceedings of INAP 2009 18th International Conference on Applications of Declarative Programming and Knowledge Management; Springer: Évora, Portugal, 2009; p. 276. [Google Scholar]
  25. Richards, L.A. Capillary conduction of liquids through porous mediums. Physics 1931, 1, 318–333. [Google Scholar] [CrossRef]
  26. Tran, D.-T.-Q. Re-Visitation of Actual Evaporation Theories. Ph.D. Thesis, Department of Civil and Environmental Engineering, University of Alberta, Edmonton, AB, Canada, 2013. [Google Scholar]
  27. Fredlund, D.G.; Rahardjo, H.; Fredlund, M. Unsaturated Soil Mechanics in Engineering Practice; John Wiley & Sons, Inc.: Hoboken, NJ, USA, 2012. [Google Scholar]
  28. Penman, H.L. Natural evaporation from open water, bare soil and grass. Proc. R. Soc. Lond. Ser. A Math. Phys. Sci. 1948, 193, 120–145. [Google Scholar]
  29. Thornthwaite, C.W. An approach toward a rational classification of climate. Geogr. Rev. 1948, 38, 55. [Google Scholar] [CrossRef]
  30. Dobchuk, B. Evaluations of the Effectiveness of Desulphurized Tailings Cover at Detour Lake Mine. Master’s Thesis, University of Saskatchewan, Saskatoon, SK, Canada, 2002. [Google Scholar]
  31. Dobchuk, B.S.; Wilson, G.W.; Aubertin, M. Evaluation of a single-layer desulfurised tailings cover. In Proceedings of the Sixth International Conference Acid Rock Drainage: 6th ICARD; Australian Centre for Mining and Metallurgy: Carlton, Australia, 2003; pp. 373–381. [Google Scholar]
  32. Thornthwaite, C.W. The Climates of North America: According to a new classification. Geogr. Rev. 1931, 21, 633. [Google Scholar] [CrossRef]
  33. Thornthwaite, C.W.; Hare, F.K. Climatic Classification in Forestry. Unasylva 1955, 9, 50–59. [Google Scholar]
  34. Thornthwaite, C.W.; Mather, J.R. The Water Balance; Laboratory of Climatology: Centerton, NJ, USA, 1955; Volume 8, p. 1. [Google Scholar]
  35. Tegos, A.; Efstratiadis, A.; Malamos, N.; Mamassis, N.; Koutsoyiannis, D. Evaluation of a parametric approach for estimating potential evapotranspiration across different climates. Agric. Sci. Procedia 2015, 4, 2–9. [Google Scholar] [CrossRef] [Green Version]
  36. Pereira, A.R.; Pruitt, W.O. Adaptation of the Thornthwaite scheme for estimating daily reference evapotranspiration. Agric. Water Manag. 2004, 66, 251–257. [Google Scholar] [CrossRef]
  37. Ahmed, F. Effect of Climate Change on a Monolithic Desulphurized Tailings Cover. Master’s Thesis, York University, Toronto, ON, Canada, 2018; p. 189. [Google Scholar]
  38. IPCC. Climate Change 2014: Synthesis Report. Contribution of Working Groups I, II and III to the Fifth Assessment Report of the Intergovernmental Panel on Climate Change; Pachauri, R.K., Meyer, L.A., Eds.; IPCC: Geneva, Switzerland, 2014. [Google Scholar]
  39. OCDP. Ontario Climate Change Projections. Available online: http://Lamps.Math.Yorku.ca/OntarioClimate/Index.Htm (accessed on 1 August 2018).
  40. Deng, Z.; Liu, J.; Qiu, X.; Zhou, X.; Zhu, H. Downscaling RCP8.5 daily temperatures and precipitation in Ontario using Localized Ensemble Optimal Interpolation (EnOI) and Bias Correction. Clim. Dyn. 2018, 51, 411–431. [Google Scholar] [CrossRef]
  41. Pk, S. Effects of Climate Change on Soil Embankments. Master’s Thesis, York University, Toronto, ON, Canada, 2017; p. 189. [Google Scholar]
  42. van Genuchten, M.T. A closed-form equation for predicting the hydraulic conductivity of unsaturated soils. Soil Sci. Soc. Am. J. 1980, 44, 892–898. [Google Scholar] [CrossRef] [Green Version]
  43. Geo-Slope International Ltd. GEO-SLOPE Products GeoStudio. Available online: https://Www.Geo-Slope.Com/Products/Geostudio (accessed on 16 March 2017).
  44. Wilson, G.W.; Fredlund, D.G.; Barbour, S.L. Coupled soil-atmosphere modelling for soil evaporation. Can. Geotech. J. 1994, 31, 151–161. [Google Scholar] [CrossRef]
  45. Wilson, G.W.; Fredlund, D.G.; Barbour, S.L. The effect of soil suction on evaporative fluxes from soil surfaces. Can. Geotech. J. 1997, 34, 145–155. [Google Scholar] [CrossRef]
  46. Kimball, J.S.; Running, S.W.; Nemani, R. An improved method for estimating surface humidity from daily minimum temperature. Agric. For. Meteorol. 1997, 85, 87–98. [Google Scholar] [CrossRef]
  47. Walter, G.P.; Dubreuilh, P. Evaluation of approaches to simulate engineered cover performance and degradation. In NRC-02-07-006; Centre for Nuclear Waste Regulatory Analyses: San Antonio, TX, USA, 2007. Available online: https://www.nrc.gov/docs/ML0729/ML072950120.pdf (accessed on 21 September 2020).
Figure 1. Thirty-year historical climate data for Timmins, Ontario.
Water 12 02645 g001
Figure 2. Climate ensembles corresponding to different global circulation models (GCMs) and representative concentration pathways (RCPs).
Water 12 02645 g002
Figure 3. Comparison of (a) annual mean temperature and (b) annual precipitation for base and future climate ensembles.
Water 12 02645 g003
Figure 4. Comparison of annual moisture indices for base and future climate ensembles.
Water 12 02645 g004
Figure 5. Representative cover profiles used for numerical modeling (Modified from Dobchuk et al. 2013) [10].
Water 12 02645 g005
Figure 6. Water balance at the ground surface for verification of (a) coarse and (b) fine tailing covers.
Water 12 02645 g006
Figure 7. Water balance at the ground surface and at the tailings–cover interface for homogeneous coarse profile, CC for (a) dry year; (b) wet year.
Water 12 02645 g007
Figure 8. Water balance at the ground surface and at the tailings–cover interface for homogeneous fine profile, FF for (a) dry year; (b) wet year.
Water 12 02645 g008
Figure 9. Box and whisker plots for the annual change in storage and surface oxygen flux for (a) the CC and CF profiles and (b) the FF and FC profiles.
Water 12 02645 g009
Figure 10. Comparison of 30-year time histories of saturation with depth for (a) CC profile, (b) CF profile.
Water 12 02645 g010
Figure 11. Cumulative (30 years) oxygen flux at the coarse and fine tailings covers for the base and the future climates.
Water 12 02645 g011
Figure 12. Change in the cumulative (30 years) oxygen flux (%) at the coarse and fine tailings covers for the base and the future climates.
Water 12 02645 g012
Figure 13. Comparison of 30-year time histories of saturation with depth for (a) FF profile, (b) FC profile.
Water 12 02645 g013
Figure 14. Comparison of 30-year time histories of saturation and oxygen concentration for the CF profile. Saturation for climates (a) BC, (b) FC-1, and (c) FC-2; and oxygen concentration for climates (d) BC, (e) FC-1 and (f) FC-2.
Water 12 02645 g014
Figure 15. Comparison of 30-year time histories of saturation and oxygen concentration for the FC profile. Saturation for climates (a) BC, (b) FC-1, and (c) FC-2; and oxygen concentration for climates (d) BC, (e) FC-1 and (f) FC-2.
Water 12 02645 g015
Table 1. van Genuchten (1980) [42] parameters for fine and coarse materials.
ParameterFineCoarse
θs0.420.46
θr0.00090.0004
α0.02 kPa−10.17 kPa−1
n2.681.94

