Abstract
This study analyzed the long-term alterations in runoff regime, seasonality and variability in headwater montane basins in Central Europe in response to the manifestations of climate change. We tested the common hypotheses on climate change effects on surface runoff dynamics in the Central Europe region, assuming that (i) recent climate warming will result in shifts in the seasonality of runoff, (ii) the runoff balance will remain without significant changes and (iii) that higher variability in runoff can be expected. The analyses were done on eight montane catchments in four mid-latitude mountain ranges in Central Europe, based on the uninterrupted time series of daily discharge observations from 1952 to 2018. We used 33 indicators of hydrologic alteration (IHA), 34 indicators of environmental flow components, the baseflow index, the calculation of surplus and deficit volumes and the frequency of peak and low flows. Homogeneity testing using Buishand, Pettitt and SNHT tests was applied to test the response of the hydrological alteration indicators to climate warming. We have proved the significant shifts in runoff seasonality, coinciding with the timing of the air temperature rise, marked by earlier snowmelt, followed by a decline in spring flows and a prolonged period of low flows. There was detected a rise in the baseflow index across the mountain ranges. Unlike the common hypotheses, the expected rise of runoff variability and frequency of peak flows was not demonstrated. However, we have identified a significant change of the flood hydrographs, tending to steeper shape with shorter recessing limbs as a sign of rising inner dynamics of flood events in montane catchments.
1. Introduction
The growing severity of floods and droughts in Europe, which became a major source of damage and societal risk over the past two decades [1], significantly stimulated research in the fields of changes in long-term trends of hydrological regimes [2] and recent variability in hydrological extremes and their regional aspects. Particular attention is paid to the potential drivers of changes, with a special focus on climate change [3,4,5] and land use changes [6,7]. A better understanding of the trends of hydrological extremes, their spatial distribution and drivers are thus sought as a key for designing efficient potential adaptation measures [8].
The rising vulnerability of Europe to the risk of hydrological extremes in the past three decades can be detected at different scales [9]. The changes in seasonality, frequency or spatial distribution of the hydrological extremes are less distinct on a regional level. In contrast, the local factors, such as physiography, land use or river modifications, play a significant role in the interpretation of the observations [10]. Central Europe represents a transient region in terms of climate gradients, features highly variable physiography and a significant human impact. Recent studies assume that the hydrological effects of climate change in this region will chiefly affect the seasonal distribution of runoff, inter- and intra-annual variability in discharge and an increase in the risk of floods and droughts [11,12]. In particular, the projections of climate models indicate the alterations of hydrological regimes, including the seasonal distribution, magnitude and duration of precipitation; rise in evapotranspiration; and a reduction in the snow season [11,13]. Therefore, climate change, both observed and predicted by climate models, is considered a key driver of changes in runoff patterns [12,14]. The effects of rising air temperatures as the most significant indicator of change have been detected across the region of Central Europe since the 1980s [14,15], together with the rising variability in precipitation in headwater areas of Central Europe [16,17]. However, studies focused on the changing patterns of peak flows in Central European rivers did not indicate any significant trends of the runoff response from a long-term perspective [18,19]. Compared to changes in the regions of Western Europe, Scandinavia or the Mediterranean, the changes in streamflow are less pronounced here [20]. In particular, the studies of streamflow balance in montane headwater catchments in the region indicate a similar picture of only marginal changes [21,22].
Besides the changing climate, there are other factors, that potentially affect the alteration of hydrological processes. In particular, these are the structural measures such as dam construction or intense stream regulations [23] and the gradual or abrupt changes in land use [24]. In the montane basins with dominating forest cover, the forest management such as forest thinning or timber logging [13], as well as the forest health status can play significant role. Climate warming and forest disturbance in the Sumava Mountains resulted in the significant shifts in the seasonal distribution of runoff, intraannual runoff variability, a rise in the frequency of peak flows of low magnitude and increasing duration of the periods of drought over the past two decades [25]. The elevated inner dynamics and variability in the runoff in montane catchments in the Sumava region were further demonstrated at different spatial scales [26,27].
Based on these in our study, we selected a set of basins in four montane ranges in Central Europe to test the generally accepted hypotheses, assuming that (a) recent climate warming results in shifts in the seasonality of runoff distribution, while (b) the indicators of runoff balance will remain without significant changes and that (c) higher variability in the runoff, displayed by a higher frequency of floods and droughts, can be expected. Based on these hypotheses, the following research questions are arising. First, are the generally assumed changes in long-term time series of runoff seasonality, balance and variability, apparent coherently in the European mid-latitude montane basins? Second, is there a coincidence between the detected changes in the runoff regime and observed timing of climate warming as the principal driver of hydrological alterations. In addition, third, are there apparent any spatial patterns in trends, reflecting, i.e., effects of climate continentality?
The research was done on a set of catchments in four boundary mountain ranges in Central Europe. In particular, we examined eight basins in the boundary mountain ranges—the Šumava Mountains (Bohemian Forest), Krkonoše (Giant Mountains), Orlické hory (Eagle Mountains) and Beskydy Mountains The basins are of comparable size (40–90 sq. km), with stable land use structure and all are without hydrological regulation structures. The long-term daily discharge observations in hydrological years 1952–2018 were used for the analyses. We focused on indicators that reflect the aspects of the runoff regime that are likely to be affected by the assumed effects of the changing climate. In particular, the set of 33 indicators of hydrologic alteration (IHA), 34 indicators of environmental flow components (EFC) and the frequency and distribution of the peak and low flows were used. Statistical testing of the significance of changes was performed using the Mann–Kendall test and breakpoint analysis, analysis of deficit and surplus volumes, and homogeneity testing were performed using the Buishand, Petitt and SNHT tests.
2. Materials and Methods
2.1. Study Area
The research was conducted in a set of basins located in headwater montane regions of the Czech Republic as an environment that is sensitive to the effects of landscape disturbances and climate change [12,25]. The included basins were selected based on the following criteria: (i) headwater basins in boundary montane ranges in different regions of Czechia, (ii) basins with unregulated streams and without reservoirs or significant water regulation structures and (iii) basins with monitoring stations, providing long, uninterrupted time series of daily discharge observations. Based on those criteria, we selected eight basins in five montane ranges—Vydra and Blanice in the Šumava Mountains (Bohemian Forest), Mumlava and Úpa in the Krkonoše Mountains (Giant Mountains), Zdobnice in the Orlicke Mountains, Branná in the Jeseniky Mountains and Čeladenka and Vsetínská Bečva in the Beskydy Mountains (Figure 1). The selected basins are of size, ranging from 40–90 sq. km.
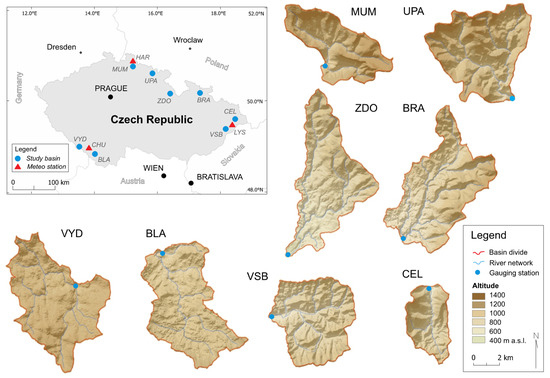
Figure 1.
Location of study basins and meteorological stations. Data: Czech hydrometeorological institute (CHMI).
For the physiographic properties, the potentially significant factor affecting streamflow generation is the geological structure. The mountain ranges in the western part of the Hercynian system are formed by crystalline complexes, while the eastern montane ranges are part of the Alps–Himalayan system with dominant Mesozoic and Tertiary sedimentary rocks [28,29]. These effects of geology are reflected by the typological categories of the water bodies of the Czech Republic, classified according to the prevailing geological bedrock [30]. GIS analysis of the share of the two key categories shows that only two basins in the Beskydy Mountains (CEL and VSB) are based on sedimentary rocks, while all others are dominated by crystalline bedrock (Table 1).

Table 1.
Study basins and their principal physiographic and hydrological properties. Data: CORINE Landcover 2018, Czech Geological Survey, WRI TGM.
All basins have a prevailing close-to-nature structure of land use with a dominant share of categories reflecting conditions close to the natural status. Forests, meadows and pastures, as the typical land use categories in a montane environment, have shares from 83% to 99.8% of the basin areas (Table 1). Except in the VYD basin—where a significant forest disturbance since 1990s was detected [31]—the study basins have in long-term perspective stable health status without significant extent of forest health deterioration or decay [32], potentially affecting runoff generation.
Arable land is developed in only part of the catchments and to a limited extent. The share of built-up areas is then marginal (Table 1). All basins are unregulated, without dams or regulation structures, significantly affecting the streamflow effects.
The above-stated approach enabled minimization of the cross-effects of the different drivers, whose mutual impact on the hydrological regime can be difficult to disentangle [33], leaving climate change as the only principal driver of changes in hydrological regime.
2.2. Data Sources
For hydrological analyses, a joint database of uninterrupted daily discharge observations at gauging stations in montane headwater catchments in the boundary mountains of the Czech Republic was used (Table 1). The time series applied in the study started in 1954 until 2018 as the longest time span available at all monitoring stations. Although some of the stations started monitoring earlier, at most of the stations, long breaks in monitoring were apparent during World War II, and some stations started operating in the early 1950s. Time series of precipitation and snow cover have been available since 1961. Hydrological and meteorological monitoring (Table 2) was performed by the Czech hydrometeorological Institute, which provided the data for the research [34].
Table 2.
Study basins and their principal hydrological characteristics. Data: CHMI.
2.3. Applied Methods
The methods used for analysis comprised a mix of hydrological analysis tools and statistical techniques used for calculation of hydrological alteration parameters and detection of their changes in long time series of daily discharge observations.
In the analysis, we have consecutively (i) performed the calculation of indicators, describing the various aspects of hydrological alteration, (ii) tested if a trend was detected in the time series of such indicators and tested the significance of such trends, (iii) analyzed the potential driving forces of hydrological change in basins—land use changes, structural measures and climate change, (iv) used the breakpoint analysis to detect the moment of shift in the time series of air temperature observations, considered as a potential driver of hydrological change, (v) split the time series of hydrological observations according to the detected breakpoint in climate change and (vi) analyzed the scope of indicators of hydrological alteration in the pre- and postimpact period, with a focus on the changes in balance, seasonal distribution and variability of the indicators.
These tests were applied to the time series of air temperature daily observations at Churáňov and Lysá hora stations, representing the western and eastern bounds of the analyzed region. The resulting breaks in the time series of hydrological observations were then considered as a point of change in air temperatures and were used as thresholds to analyze the impacts of climate change on the hydrological regimes in the assessed basins.
As a basis for the description of the potential hydrological change, we used the indicators of hydrological alteration (IHA, 33 indicators) and the environmental flow components (EFC, 34 indicators). The IHA and EFC parameters cover the key aspects of hydrological change, including:
- Magnitude and seasonal distribution of water conditions;
- Magnitude and duration of annual extreme water conditions;
- Timing of annual extreme water conditions;
- Frequency and duration of high- and low-flow events;
- Rate and frequency of water condition changes.
The IHA and EFC indicators reflect the hydrological effects of both continuous and abrupt changes in potential drivers. Their applicability to detect changes in the hydrological regime has been demonstrated in various environments [35,36,37].
The baseflow separation was performed using the recursive digital filter, applied to separate the direct flow and baseflow from the daily discharge time series [38]. The calculation was performed using the Web based Hydrograph Analysis Tool (WHAT) model [39], based on the BFLOW filter [40], demonstrated to be an efficient method for direct and baseflow separation from daily discharge observations [25,41]. From the results of separation, the baseflow index (BFI) was calculated as a ratio of baseflow to total streamflow. The aggregation of the daily values of direct flow and baseflow components was calculated as the median yearly values of the indices.
In addition to the sets of IHA and EFC indicators, calculated according to the standardized methods, we also calculated other parameters, reflecting changes in balance indicators, such as surplus/deficit volumes as well as the specific peak and low-flow indicators. Days with discharge lower than the 0.25 quantile and higher than the 0.75 quantile were selected as days with deficit and surplus discharge, respectively. The values of quantiles vary in time, and the calculation is performed in a 5-year moving window. The total outflow in m3 in those deficit and surplus days was summed and further analyzed. The increase in deficit volume means a decrease in total outflow on deficit days, as the value has a negative meaning. Increase in surplus volume means the increase in outflow realized at high-flow conditions. The analysis simply observes the runoff distribution across different hydrological conditions.
As a more sensitive approach, we used minimax threshold detection, developed for such purposes [25]. The threshold for low-magnitude peak flows (POT) is defined as a minimum value of yearly maximum daily discharge in the time series. The threshold for low flows (LOF) is then defined as a maximum value of yearly minimum daily discharge in the time series. Based on this classification, the long-term set of daily flow observations provides the sets of at least one POT and one LOF event per year. In headwater areas, the changes resulting from climate and environmental changes are rather gradual and often subtle. Hence, the analysis, based on low-magnitude pulses and a dense dataset is suitable to analyze the subtle changes in flow variations as a signal of environmental change.
To analyze the significance and direction of changes, we tested all of the calculated indicators by the Mann–Kendall trend test. The sets of the 33 indicators of hydrologic alteration, 34 indicators of environmental flow conditions and the abovementioned additional alteration indicators were tested for the presence of a monotonic linear trend. The testing was done separately for the whole time span of the hydrological years 1952–2018 and then separately for the pre- and postimpact periods 1952–1988 and 1989–2018, separated according to the breakpoint in air temperature values. The resulting set of 104 indicators, calculated for 3 periods, describe the key aspects of hydrological change—the trends in runoff balance, seasonal distribution and variability.
To identify the point of change in the time series, homogeneity tests were performed on the time series of daily and yearly temperatures to identify the potential breakpoints in air temperatures. To analyze the homogeneity of the time series of the calculated IHA and EFC parameters, Pettitt’s test, SNHT and Buishand tests [42], designed to work on any type of distribution with an unknown position of the point of change [43], were used. The selection of these tests was based on their demonstrated performance on hydrological time series in the environment of mid-latitude montane basins [22,25].
2.4. Applied Tools
The IHA 7.1 tool was used to calculate two sets of parameters—33 IHA and 34 EFC parameters [44]. The analysis was performed for 8 catchments for uninterrupted daily discharge observations in the time period of the hydrological years 1952–2018. For all analyses, the water year was set to start in November, corresponding to the hydrological conditions in the European mid-latitudes. The calculations were based on nonparametric (percentile) statistics using the default threshold values for the detection of the peak and low-flow events [45].
The flow duration curves (FDCs) were calculated to detect extreme events based on the thresholds of daily flow exceedance. In accordance with the typical IHA thresholds, the extreme low flows were defined as the initial low flows below 10% of daily flows for the calculated period. The high flows were considered all flows that exceeded 75% of daily flows for the calculated periods. The threshold for low flows is set to flows below 50% of daily flows. Small floods are defined as a peak flow over a 2-year return period and a large flood is defined as an event exceeding a 10-year return period [44].
For each station, two sets of analyses were performed. First, the analysis based on the daily observations for the whole time period aimed to describe the long-term trends of hydrological properties in the assessed basins. For the second set of analyses, the time series was split into two periods according to the calculated breakpoint in air temperatures. The aim was to analyze the differences in seasonality, variability and dynamics of the hydrological properties in the pre- and postimpact periods as an effect of climate change.
The classification of POT and LOF events using the minimax thresholding method was performed using the KNIME 4.1 (KNIME.com, Zurich, Switzerland) statistical package [46]. In the KNIME workflow, the threshold values were calculated as the flow variables controlling the calculations in the consequent nodes and the classification of the events. The Plot.ly library, called via KNIME nodes, was used for plotting the outputs.
For the calculations of deficit and surplus volumes, the Microsoft Excel 365 spreadsheet was used. The Mann–Kendall test together with Sen’s slope estimate was elaborated within Makesens 1.0, MS Excel template by the Finnish Meteorological Institute.
Testing of homogeneity on the time series of air temperatures aimed to detect the points of change was performed using the XLStat 2020 (Addinsoft, Paris, France) package. In the performed analyses using Pettitt’s, Buishand’s and SNHT tests, the null hypothesis (H0: data are homogeneous) and an alternative hypothesis (Ha: there is a date at which there is a change in the data) were tested. The p-value was computed using 10,000 Monte Carlo simulations, and the significance level alpha was set to 0.05 (α = 0.05 s, the risk of rejecting the hypothesis is equivalent to 5%).
3. Results
3.1. Variations of Meteorological Factors
Based on the stable structure of land use and lack of control structures on the hydrographic network in the assessed basins, climate change was considered a key factor affecting the hydrological regime in the study areas. We analyzed the air temperatures and precipitation at key climate stations in the Sumava, Krkonoše and Beskydy Mountains, covering the principal mountain ranges of the study area (Figure 2). The long-term observations indicate the same trends at all stations. Despite the natural fluctuations, there is no clear trend in the total annual precipitation at any of the stations. Although the absolute values of the precipitation totals vary due to the different altitudes, the overall neutral trend is repeated at all mountain ranges in the studied region (Figure 2a).
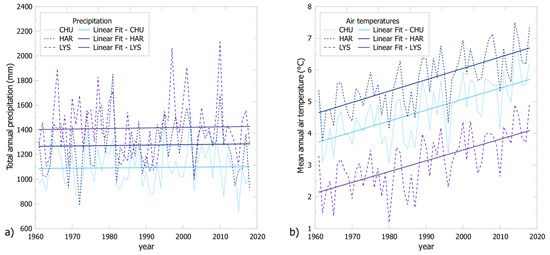
Figure 2.
(a) Total annual precipitation and (b) mean annual temperatures at meteorological stations of Churáňov (CHU, 1118 m ASL) Harrachov (HAR, 675 m ASL) and Lysá hora (LYS, 1322 m ASL) in the western and eastern margin of the study area. Data: CHMI.
In contrast, the mean annual air temperatures at both stations feature a continuous increase in values over the study period, again with a shift of the absolute air temperature values stemming from the different altitudes of the stations. However, at all stations, there is a rise in air temperatures from the long-term perspective since the beginning of monitoring in the 1960s. The air temperatures were thus considered as the potential factor driving the changes in the hydrological system in the study basins.
The tests of homogeneity of the daily time series of air temperatures were launched at three stations, Churáňov (Sumava Mountains), Harrachov (Krkonoše Mountains) and Lysá hora (Beskydy Mountains), covering the key mountain ranges in the study areas. In the time series of 1961–2018, a significant point of change was indicated. All of the performed tests (Buishands, Pettitt’s and SNHT tests), concluded that there was a significant break in the air temperatures occurred in 1988 at Churáňov (CHU) and Lysá hora (LYS) stations (Table S1), representing the upper montane environment. In Krkonoše Mountains there is no station with uninterrupted observations in the upper montane part. The Harrachov (HAR) station, located at lower altitude with warmer climate (Figure 2) thus detected the shift in air temperatures earlier—in 1987; however, with the same level of significance (Table S1).
The year 1988, concordantly reflecting the change in the upper montane stations in the most western and eastern spans in the area of interest, was considered as a changepoint in air temperatures. This shift in rising temperatures was assumed as a factor driving the potential alterations of hydrological response in the catchments. This year was then used as a threshold in the consequent analyses of the indicators of hydrologic alteration, splitting the time series into periods prior to and after the air temperature shift. The preimpact period of 1952–1988 spans from the joint start point of hydrological observations at all stations to the year of the detected shift in air temperatures. This period includes the cold and wet period in the 1970s and 1980s. In the study basins, it also represents a relatively long time period with no significant extreme events. In contrast, the postimpact period of 1989–2018 covers the period with elevated variability in hydroclimatic processes in the area of Central Europe, including the extreme regional floods in 1997, 2002 and 2013 and series of summer storm floods in 2009 as well as the long and intense dry period, lasting since 2015.
3.2. Trends of Changes in the Hydrological Regime
The significance of changes in trends, tested by the Mann–Kendall trend test, confirmed that the threshold in air temperatures detected in 1988 represents a significant breakpoint in trends for most of the hydrological alteration indicators. Between the periods of 1953–1988 and 1989–2018, there are apparent changes in indicators, expressing alterations in balance, seasonality and variability of runoff response. All the results are supported by Sen’s slope analysis highlighting the magnitude of change.
The basic patterns of changes in seasonality are repeated across the study areas, despite the variable physiography of the assessed basins, expressed in shifts in the timing of processes, e.g., snowmelt in basins of different altitudes. At the level of the whole time period of 1953–2018, there is a general rise in discharge values in the hydrologic winter half of the year and a respective decline in discharges in the summer half-year (Table 3). This general pattern differs when viewed in the two periods, separated by the air temperature break. In most of the catchments, the first period of 1953–88 is marked by the rising monthly discharges in most of the months except July over all the basins and in spring in the western basins. In contrast, the period since 1989 is marked by a declining trend in almost all basins and seasons.
Table 3.
Direction and significance of trends of the calculated seasonality indicators using the Mann–Kendall trend test. Blue represents flow increase; red represents flow decrease. Statistically significant trends (p < 0.05) are highlighted by dark colors bold font. Dash represents no trend (<10%).
The spatial and temporal patterns of changes in balance indicators are not uniform. By the basis balance indicator mean annual discharge, there is a clear effect of the air temperature breakpoint in 1988, as there is a trend of neutral or rising discharges in the period of 1953–1988 and an overall decline in discharge in the period of 1989–2018.
The baseflow index (BFI) is a parameter reflecting the conditions for runoff generation and groundwater storage. In the long-term perspective, the share between the baseflow and total flow should be stable. However, the changes in the driving forces of hydrological processes, reflected, for example, by the effects of climate change, can affect the balance between direct and base flow. In the period 1953–1988, the BFI values increased in almost all basins, while since 1989, there was a decline in the western part of the mountain ranges (Table 4).
Table 4.
Direction and significance of trends of the calculated runoff balance indicators using Mann–Kendall trend test. Blue represents flow increase; red represents flow decrease. Statistically significant trends (p < 0.05) are highlighted by dark colors bold font. Dash represents no trend (<10%). hydrological seasons are spring (II–IV), summer (V–VII), autumn (VIII–X) and winter (XI–I).
In the whole time span, there is an obvious trend of increasing surplus volume and decreasing deficit volume, highlighting the tendency of the basins toward wetter conditions in the winter half of the year. In contrast, the summer half of the year is represented by a drop in surplus volume and increase in deficit that leads to overall drier conditions in the summer half of the year. The deficit and surplus volumes do not show any consistent trends in the separated periods.
The breakpoint in air temperatures is well represented in the time series of runoff variability. The most significant changes are visible in the parameter of hydrological reversals as a sign of intraannual runoff variability. From a long-term perspective, the number of reversals is rising. However, there is a clear difference between a significantly decreasing number of reversals in the preimpact period of 1953–1988 and a rising trend as a signal of increasing variability in runoff since 1989.
The indicators of rise and fall rates, defined as a mean increase or decrease in daily flows, show an overall trend with significant divergence in the two assessed periods (Table 5). The fall rate indicator has a consistent decreasing trend in both time and space. In contrast, the rise rates have significantly diverging patterns when comparing the periods of 1953–1988 and 1989–2018. In the first period, there is an increase in the rise rate in all, but one basin, while since 1989, there was an overall decline.
Table 5.
Direction and significance of trends of the runoff variability indicators using Mann–Kendall trend test. Blue color represents flow increase, red color represents flow decrease. Statistically significant trends (p < 0.05) are highlighted by dark colors bold font. Dash represents no trend (<10%).
The parameters of minimum and maximum flows suggest a decrease in both peak and low flow values since 1988 in most of the basins. In contrast, in the preimpact period, the magnitude of low flows increases. There is an overall tendency of longer low-flow periods over the whole time span.
We have further focused on the selected indicators, displaying the most significant changes in terms of the trend or spatial extent. In the three groups of indicators (balance, seasonality, variability), parameters were selected with (i) statistically significant changes in most of the catchments and with the coherent direction of change, displaying the alteration of hydrological regime across the regions, as well as (ii) parameters that are statistically significant, but with varying spatial patterns of trends, indicating regional effects in changing trends.
For the analysis of changes in runoff balance, the indicators of annual discharge, baseflow and surplus/deficit volume were selected. For the analysis of runoff seasonality, the indicators of March and May flows, date of maximum flow and seasonal runoff distributions were used. For the analysis of runoff variability, the indicators of rise and fall rates, reversals and peak and low-flow frequency were selected according to the minimax thresholds. These indicators were used for the detailed analysis of changes in the hydrological regime.
3.3. Changes in Runoff Seasonality
The long-term changes in seasonal runoff distribution display distinct patterns of change, apparent across the regions, both in the whole time series and, in particular, when comparing the periods, split by the break in air temperatures in 1988. From the long-term perspective, there is a rise in discharge in a cold period, particularly in winter and early spring. The rise in discharge in March, February or January is apparent in all basins. In contrast, the spring and summer flows correspondingly decrease. The most pronounced change is visible in May, but the whole spring and summer season until August features a noticeable decrease in flows across the basins (Figure 3).
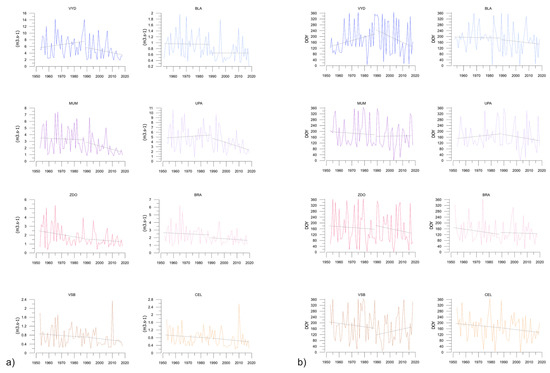
Figure 3.
Shifts in the indicators of runoff seasonality. (a) May flows; (b) date of maximum flow. Data: CHMI.
The spring flow increase is accompanied by a flow decrease of −34% ± 7% in the summer season observed in each basin (significant in each basin except CEL). The rise in discharge in March and a corresponding decline in discharge values in May (Figure 3a) in montane catchments correspond to the timing of the snowmelt period. This trend is also reflected by the changes in the date of the maximum flow (Figure 3b). There is an obvious general trend of earlier dates of occurrence of the yearly peak flows across the basins. The different trend direction of VSB is governed by the oscillation of the date of maximum flow from late December to early January.
In most of the basins, there are plausible accelerations of this trend since the break in air temperatures in 1988 as a response to rising air temperatures, forcing earlier snowmelt. Since 1989, an earlier start of snowmelt has occurred in most basins. This tendency is most plausible in the basins of Vydra, Mumlava, Úpa, Zdobnice and Čeladná.
The timing of the snowmelt period in particular basins depends on the physiographic properties, mostly the mean elevation, so the shift is reflected in March in most of the basins (+49% ± 32%), but in April in the basins with mean elevations above 1000 m ASL. (VYD and UPA basins, +47% ± 2%). Increasing discharges are found in February and January, as well as the highest rate in January (significant in MUM, ZDO and CEL, +87% ± 23%). The significant decline in discharge starts in April in the BLA (significant, −45%) and eastern basins (not significant, −10% ± 5%). In May, there is a uniform and significant decreasing trend in all basins in the range of −45% ± 5%.
The second phenomenon, even more significant, is the change in timing and intensity of the consecutive dry periods. The decreasing trend is manifested in all basins and all months of summer and autumn (Figure 4), although the range and the statistical significance drop in later months (−31% ± 10% in the June–August period). In all catchments, a steeper transition occurs from spring snowmelt toward the period of low flows, lasting from May until October (until August in the Beskydy Mountains, VSB and CEL) and featuring a significant decline in the minimum flows in the period since 1989.
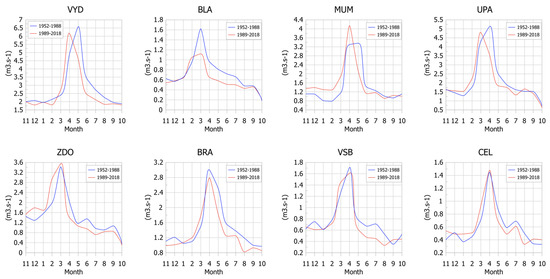
Figure 4.
Shifts in seasonal runoff distribution in study basins in pre- and post-impact periods. Data: CHMI.
The differences in the seasonal distribution in the pre- and postimpact periods, defined according to the break in the air temperatures in 1988, confirm this trend. The hydrograph of monthly discharges calculated for these two periods proves the shifts of peak flows from early spring to late winter (Figure 4).
3.4. Changes in Runoff Balance
For the indicators of intraannual hydrological balance (baseflow, rise rate), there is a typical almost neutral average change across the catchments and spatial heterogeneity between the western and eastern parts of the assessed area.
The changes in the total accumulated annual discharge from the catchments (Figure 5a), calculated from the time series of daily discharges, indicate that the fluctuations in the runoff balance over the 70-year time period of observations are subtle. However, in most of the catchments, there is a trend of decreasing annual discharge since the breakpoint in 1988 (−36% ± 23%). This trend is most evident in the period in the last decade of observations, which was marked by intense droughts in Central Europe.
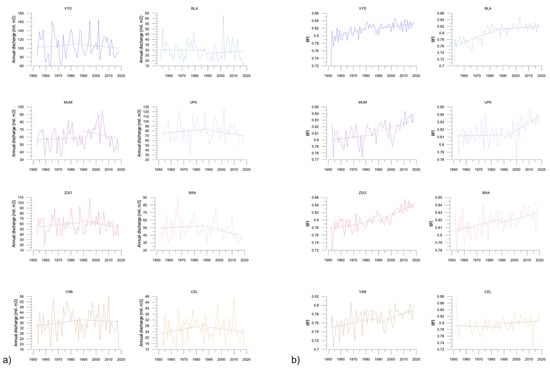
Figure 5.
Changes in runoff balance indicators. (a) Annual total discharge from the catchments; (b) baseflow index. Data: CHMI.
The analysis of the baseflow (Figure 5b) indicates a continuous rise in the baseflow index across the basins with a shift in time series, corresponding to the breakpoint of air temperatures in 1988. This tendency is in line with the rise in temperatures and the shorter snow cover periods, limiting the groundwater recharge. Despite this general trend, the scope of change since 1988 is not univocal. In particular, in the southwestern mountain range of the Sumava Mountains (VYD and BLA basins), the rise in the baseflow index is decelerating. However, these basins are already reaching very high BFI values compared to those of the other regions.
Surplus and deficit volume analysis indicate flow regime variations. The goal was to detect any differences in the share of runoff in dry or wet conditions on total runoff. The breakpoint of air temperature in 1988 is not very noticeable in the analysis of duration curves, but there are apparent changes in the whole period of 1952–2018 (Figure 6). The yearly values of deficit and surplus volume do not show any significant trends. When focused on the intraannular variability, the winter half-year is a period with an increase in surplus volume and a decrease in deficit volume (BRA and CEL basins do not show the increase in surplus volume); thus, the winter flow regime tends to be wetter overall. In contrast, in the summer half-year, there is a significant decreasing trend in surplus volume accompanied by an increase in deficit volume indicating an overall drying out of the basins in the summer half-year.
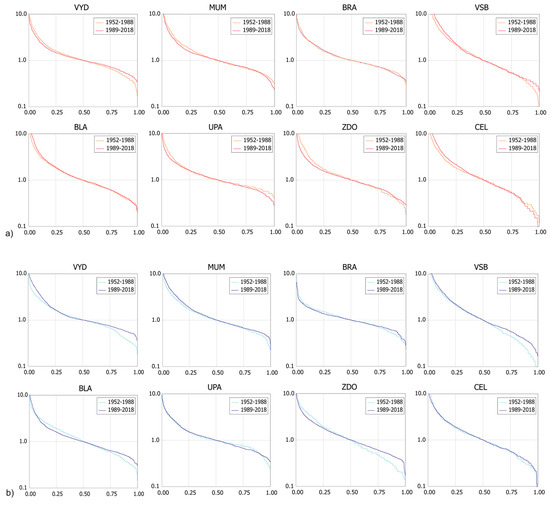
Figure 6.
Changes in normalized flow duration curves for (a) summer and (b) winter half-year. Data: CHMI.
When we look further at the seasonal changes, March has an overall decrease in deficit volume (−48% ± 30%). In April and May, there is very scarce evidence of flow below the 0.25 quantile, thus the months were not evaluated. Regarding the winter half-year surplus volume, January has an overall large increase in surplus volume with a W-E gradient (+460% and +920%) in the Šumava Mountains (BLA and VYD both highly significant), approximately 250% in the Krkonoše Mountains, 540% in the BRA—the western-oriented basin in the Jeseníky Mountains and approximately 100% in the eastern basins. In the VYD basin and Krkonoše Mountains (UPA, MUM), the January increase continues throughout the hydrologic spring season. In contrast, spring surplus volume in BLA, BRA, ZDO and CEL remains unchanged or slightly decreases in the spring season.
The summer overall decrease in surplus volume starts mostly in May. The tendency is reduced toward late summer and early autumn and turns into an increasing tendency in October in most of the basins except the BLA. A decrease in the surplus volume is accompanied by a June decreasing tendency of deficit volume (−50% ± 32%) in all basins except the Jeseníky Mountains and a more significant increase in the deficit volume in the autumn season was mostly realized in August and September, with the highest range and significance in August in the MUM and CEL (353%), but obvious in all periods and all basins. The increase is followed by a decrease in the variable toward winter wetter conditions as described above.
3.5. Changes in Intraannual Runoff Variability
Indicators of rise and fall rates reflect the change in water condition volatility by calculating the mean of all positive differences between the consecutive positive (Rise rate) or negative (Fall rate) daily discharge values. Changes in rise rate values, calculated from daily discharges in a yearly step, thus express the mean water surplus. In contrast, the indicator of the fall rate reflects the change in water deficit conditions.
The threshold in air temperatures is evidently reflected by the changes in the rise and fall rate indicators in all assessed basins. The rise rate has generally declined in the period of climate warming since 1989, while most of the catchments record lower positive differences in daily discharges (Figure 7a). The only exceptions are VYD and MUM, where the trend was neutral, however, diverging from the rising trend in the period of 1952–1988. As a counterpart, the fall rate indicator is on a general rise. The lower mean negative differences of daily discharge values appear as a concordant trend in all assessed regions.
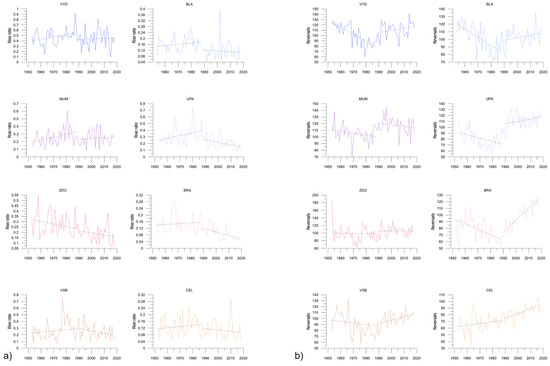
Figure 7.
Change of indicators of hydrologic alteration (IHA), indicators of intraannual runoff variability. (a) Rise rate and (b) reversals. Data: CHMI.
Hydrological reversals, defined as the number of transitions between the consecutive surplus and deficit volumes in a year, reflect the interannual runoff variability. In most of the catchments, there is a distinctly diverging pattern of a general decline in variability in the period of 1952–1988, followed by a steep rise since 1989 (Figure 7b). This trend is evident in all mountain ranges. In two catchments (MUM and ZDO), the trend in the postimpact period is neutral; however, the average number of reversals in the period 1989–2018 is higher than that in the preimpact period.
3.6. Changing Frequency of Peak and Low Flows
As a sign of changing runoff variability related to climate change, the rising frequency of low-flow and peak-flow events is expected. The frequency of peak and low flows was tested on events selected by minimax thresholding. The detection of significant flow-pulses, based on standard recurrence interval thresholds, results in a minimal set of events, even when applied on the long time series. In the analyzed catchments, the most frequent occurrence of peak flows was detected in VYD basin with 35 events and least frequent in MUM and UPA basins in Krkonoše Mountains with only 12 events exceeding the threshold of one-year flood in 70-year-long time series. In the case of a 5-year flood, there were five events reached in VYD basin and only one event recorded in the MUM and UPA basins in the given period. The values are distributed highly unevenly, and such a sparse dataset has limited usability for the detection of potential changes in the seasonal aspects of peak flow occurrence. Hence, the use of the relatively soft thresholds, selecting at least one event per year, enabled the obtainment of a more robust dataset for the trend analysis.
The results proved the expectation that the rise in air temperatures, recorded in all catchments, translated to a rising frequency of low flows. The number of days with flow under the LOF threshold has generally risen since the breakpoint of air temperatures in 1988 after a decline in the preimpact period, although the intensity of the rising trend varies.
Another aspect of runoff variability assumed to rise as a result of climate change in the mid-latitudes is the frequency of peak flows. However, unlike the low flows, there is no uniform response or trend in peak-flow frequency in the study basins in the period of rising air temperatures since 1989 (Figure 8). In most of the catchments, the trend is neutral or declining. Even in the catchments where the trendline slope for the period of 1989–2018 is slightly rising (BLA and VSE), there is a marked decline in peak flow in the decades since 2010, marked by the period of intense droughts. In this indicator, the results did not confirm the general assumption of the rising frequency of peak flows, expected as an effect of climate change.
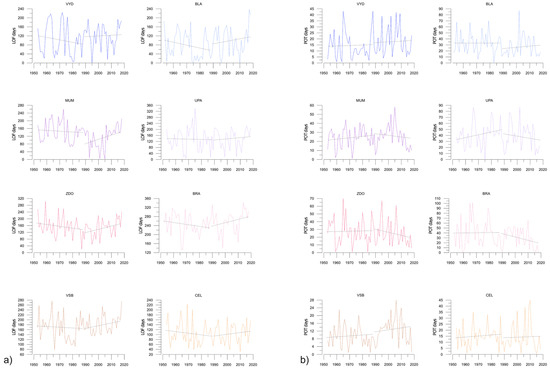
Figure 8.
Change of peak and low flow frequency, selected according to the minimax thresholds. (a) Low flows; (b) peak flows. Data: CHMI.
However, the detailed analysis indicated the shifts of the patterns of high-flow hydrographs, reflecting the changing dynamics of the high-flow events (Figure 9). For the analysis, runoff events in the summer half-year were selected to exclude the effects of snowmelt, and trends in rise and fall rates together with the shape of those hydrographs were explored. Both parameters decreased in the period of 1953–1988 (all basins except MUM and BRA, where the rise rate increased); in contrast, in the period of 1989–2018, there was an increase in both parameters (all basins except BRA, where both parameters decreased).
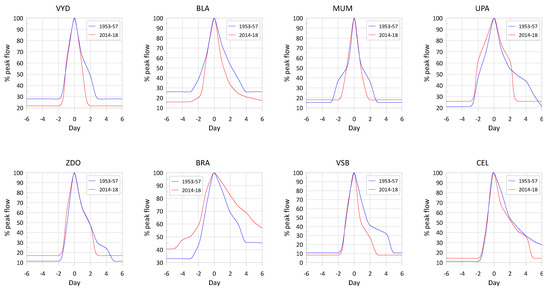
Figure 9.
Change in mean hydrograph shape of the rainfall–runoff events in the summer half-year, calculated for the first and last five years of the time series. Data: CHMI.
The shapes of the mean hydrographs indicate that the rising and falling limbs of the hydrographs tend to be steeper (Figure 9). The steeper hydrographs of the peak flows, apparent in the postimpact period in almost all basins, indicate a significant shift in the dynamics of the runoff-generation processes. The tendency for faster runoff during the high-flow events, indicated by the steeper hydrographs, has two-fold negative effects. First, the shorter time of the high flows means a higher intensity of the flood events and thus a potential increase in the flood risk despite the lower frequency of the events. Second, the steeper shape of the recession limbs of the hydrographs reflects the shortening of the time when the water is available in the basin for recharge of the groundwater storage and for the ecosystems. With the unchanged water balance, such limitation in water availability can deepen the water deficiency in dry periods.
4. Discussion
Analysis of alterations of the hydrological regime in four mid-latitude montane catchments in Central Europe based on the long-term daily discharge observations proved that only some of the common assumptions on the expected effects of climate change can be confirmed.
Changes in seasonality were confirmed as a strong signal of change, corresponding with the detected rise in air temperatures since 1989. The shifts in seasonal runoff distribution are apparent in all studied regions and have concordant trends. The most significant change was detected in the spring season, which in the mid-mountain environment of the European mid-latitudes is related to snowmelt. The spring snowmelt also drives the yearly peak flows with a maximum in May and slight variations according to the basin altitude and topography. The analysis proved a marked decline in May flows, resulting from the shift of snowmelt toward an earlier period. The earlier snowmelt, stemming from the rise in air temperatures, is translated into a shift of the day of maximum flow and is also evident in the synthetic hydrographs of monthly discharges calculated for the pre- and postimpact periods.
This result is in line with earlier studies from individual catchments as well as with modeling studies [25]. The rising air temperatures have a role as a principal driver of changes in the hydrological regime in Central European mountains [14,15], while the precipitation characteristics seem to have no significant trends [21,22]. However, this process can differ in various regions, i.e., in Alpine regions [47], suggesting contrasting trends with insignificant changes in air temperatures and marked shifts in precipitation.
The changes in hydrological balance display only minimum changes in the long-term perspective. When regarded either as the change in mean yearly flows or baseflow index, the changes are only subtle and the trendline slopes, expressing the change in the indicators, are smaller by one or two orders of magnitude compared to those of the other indicators of hydrologic. However, the continuous, though subtle, rise in the baseflow index, reflecting the increasing share of the baseflow in the total flow, implies a more intense draining of the groundwater storage, which can result from the shorter period with snow cover and consequent longer warm and dry periods.
From the results of runoff variability, a change in the intraannual variability measures has emerged since the late 1980s. The most notable shift is in the parameter of hydrological reversals. Trendline slopes calculated for the pre- and postimpact periods are distinctly opposite, with a steep rise in the number of reversals since 1989 in all regions. The frequency of the peak and low flows of low intensity indicate a significant rise in the number of days with low-flow conditions since the break in 1988. This trend is in line with the rising air temperatures, with a particularly strong hot and dry period recorded in Central Europe since 2015.
In contrast, the supposed tendency toward a higher frequency of peak flows in relation to climate change in Central Europe was not confirmed by the long-term daily observations. The peak flows of low intensity, selected with a soft threshold to capture the maximum number of events, display neutral and declining trends of peak flow occurrence since 1989 (Figure 8). Moreover, in all catchments, there is a substantial drop in peak flows from 2005 until the end of observations in 2018.
Another aim of the study was to disclose the spatiotemporal aspects of the changes to prove the general trends or to disclose their potential regional variability.
The selection of representative stations, enabling intercomparison and analysis of the spatial distribution of the given phenomena, is a key part of the design of such a comparative study. Study basins selected for cross-analysis should meet different types of criteria. First are the hydrologic and physiographic properties of the basins, securing a selection of areas providing comparable physiographic properties and meaningful for the comparison of hydrological processes. Among the properties, basin size, altitude, drainage density, soil cover, topography, geology and land use have key roles. Such criteria are important in selecting basins with comparable physiographic conditions, controlling runoff generation and a comparable level of homogeneity of the properties. The second key criterion is the representativeness of the time series. The selected time series should be of adequate length to provide equal time spans and sampling frequency, obtained from stations where the human impact is negligible [48]. In addition to the data collection framework, of key importance is that the data have no interruptions in time series and that monitoring, as well as the dataset, undergo data quality control [49].
In this study, the application of the above-stated criteria on the set of more than 300 hydrological stations in the Czech Republic [34] led to a vital reduction of the available stations and finally resulted in the selection of the eight presented basins, covering the major montane boundary ranges. Assurance of data quality was secured by using the quality-controlled and uninterrupted time series from the monitoring network of the Czech hydrometeorological Institute, securing the monitoring and providing the data at the national level. However, the study underlined the need for control and adjustment of the design values. The detection of peak flows events based on the official design values at given gauging stations revealed that such thresholds would result in very sparse datasets. The minimum is the MUM and UPA catchments in Krkonoše Mountains with only 12 one-year flood events in the 70-year-long time series detected. Such sparse datasets do not allow the analysis and interpretation of the underlying processes, so the softer criteria for the event selection need to be applied. meanwhile, this implies that more attention should be paid to the update of the design flood values, assuring their fit to the basins’ changing hydrological conditions.
For the above-discussed indicators, the spatiotemporal aspect of trends was tested. Based on the assumptions in the literature, we were seeking different patterns of changes in hydrological properties, stemming from the different nature of the process, driving the changes. The concordant trends in all or most the assessed areas thus could be considered a sign of a large-scale driving force, in particular climate change. In contrast, significant regional differentiation of even diverging trends with no clear regional distribution could also be expected as a result of diverging physiographic conditions or human impacts.
In the case of most of the indicators, there is no specific regional differentiation—and when the signal of change is strong enough—the changes mostly occur in all assessed mountain ranges. However, there are differences, and in some parameters, the spatial pattern or change is differentiated.
A spatially coherent distribution of trends is apparent in the indicators of hydrological balance.
The decrease in annual discharge is, with the exception of one catchment, concordant across the regions. The same pattern is evident in baseflow, where the subtle, but continuous rise in BFI is recorded in all catchments. Otherwise, the water balance remains without substantial alterations across the regions. The only significant aspects of change are apparent on the side of the inner variability and dynamics of the runoff, which can be related to the changing retention properties of basins.
The spatial patterns of trends in parameters of changing runoff seasonality are more coherent in the postimpact period since 1989. Both in the parameter of May flows and the day of maximum flow, there is a uniform tendency of the shift of the snowmelt to the earlier season, reflected both in the shift of the peak flows and in a dryer spring period.
The parameters of changes in runoff variability display variable spatial patterns. Spatially coherent trends at all stations display the fall rate with slightly increasing values in both periods and, in particular, low flows. This indicator has the strongest signal of change between the pre- and postimpact periods, with a uniform decrease in the first period and a uniform increase in the second period. Prevailing spatially uniform patterns and a substantial switch between the two periods are indicated by hydrological reversals. The frequency of peak flows is then the only parameter with a sign of spatial differentiation, indicating a decreasing frequency in peak flows in catchments in the northern ranges (MUM, UPA, ZDO, BRA) and a rise in the Sumava Mountains (BLA, VYD) and Beskydy Mountains (VSB, CEL) (Figure 10).
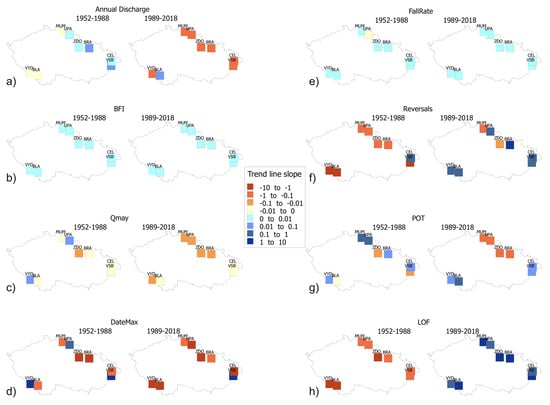
Figure 10.
Spatial variability of trends in parameters of (a) annual discharge; (b) baseflow index; (c) May flows; (d) date of the maximum flow; (e) fall rate; (f) hydrological reversals; (g) frequency of peak flows; (h) frequency of low flows. Data: CHMI.
The spatial similarities were tested by intercorrelation of the trend magnitude of all evaluated parameters calculated from Sen’s slope across individual basins and mountain ranges. A strong correlation was found by the Šumava Mountains basins BLA and VYD (r = 0.73) and Beskydy Mountains basins VSB and CEL (r = 0.67). Another strong correlation was found between the BLA and ZDO basins (r = 0.82) and between the VYD and ZDO basins (r = 0.72). The same, but not so strongly correlating pattern of relationships can be found in the preimpact period limited by 1988 with the exception of the Šumava Mountains basins. However, when we consider only the 1989–2018 period of the rise in air temperatures, the correlations of mountain pair basins disappear. This implies that the impact of climate warming on runoff generation in montane regions is a complex and nonlinear process that can amplify the role of local physiographic and environmental conditions. As all of the basins are dominated by the forest land use, so the forest structure, health status and management will have decisive role on the hydrological balance and regime. As in most of the Central European mountain ranges, there are emerging large-scale bark beetle disturbances, the sensible balance between montane nature conservation and forest management will have significant role on the hydrological resilience of the montane basins to the effects of climate change.
Hence, it is vital to further study the mutual cross effects of climate change and the local physiographic properties or environmental disturbances to better understand the changing dynamics of hydrological processes in headwater montane areas.
5. Conclusions
The study analyzed long-term changes in the runoff variability in four montane ranges in Central Europe as a response to the effects of climate change and modifications to the environment. We compared the patterns of various sets of indicators of hydrologic alteration derived from the long-term time series of daily discharge observations in montane basins with the recent premises of climate change effects on surface runoff dynamics in the Central Europe region. In particular, the following hypotheses were tested: (i) recent climate warming will result in shifts in runoff seasonality, (ii) the indicators of runoff balance will remain without significant changes and (iii) a higher variability in runoff can be expected, exhibited by a higher frequency of floods and droughts. These hypotheses were tested in eight unregulated headwater basins in four mid-latitude mountain ranges of Central Europe. The uninterrupted time series of daily discharge observations from 1952 to 2018 was used for the analyses at the gauging stations.
The study has identified that only some of the hypotheses on the effects of climate change on runoff can be demonstrated, while some of the aspects of hydrological alteration have no clear temporal or spatial trends. The homogeneity analysis of long-term air temperatures highlighted that 1988 was a significant breakpoint in air temperatures, marking a significant period of climate warming across the studied regions.
We have proved the pronounced changes in runoff seasonality, coinciding with the timing of the air temperature rise. The changes in seasonal runoff distribution are marked by the shift of spring snowmelt toward an earlier season and a decline in spring flows. The second aspect of the changing seasonality is an earlier and prolonged period of summer low flows. There are no notable changes in runoff balance in response to climate warming. However, there is a long-term continuous rise in the baseflow index, indicating shifts in the share of the key runoff components. Runoff variability is generally on the rise since the break in air temperatures, in particular, the number of reversals as well as the number of days with low-flow conditions. The number of peak-flow events is not rising. However, a significant change in the inner dynamics of the events resulting from precipitation was detected. The high-flow events have shorter hydrographs with steeper recessing limbs. Hence, despite the lower frequency, the emerging change in the shape of flood hydrographs indicated a potential rise in the inner dynamics of flood events in mid-latitude montane basins.
Supplementary Materials
The following are available online at https://www.mdpi.com/2073-4441/12/8/2279/s1, Table S1: Results of homogeneity tests of air temperature daily observations at Churáňov, Harrachov and Lysá hora stations. Data: CHMI.
Author Contributions
Conceptualization, J.L.; methodology, J.L. and J.B.; software, J.L. and J.B.; validation, J.L. and J.B.; formal analysis, J.L. and J.B.; writing—original draft preparation, J.L. and J.B.; writing—review and editing, J.L. and J.B.; visualization, J.L. and J.B.; supervision, J.L.; project administration, J.L.; funding acquisition, J.L. Both authors have read and agreed to the published version of the manuscript.
Funding
The research was funded by the Czech Science Foundation project 19-05011S “Spatial and temporal dynamics of hydrometeorological extremes in montane areas”.
Conflicts of Interest
The authors declare no conflict of interest.
References
- Barredo, J.I. Normalised flood losses in Europe: 1970–2006. Nat. Hazards Earth Syst. Sci. 2009, 9, 97–104. [Google Scholar] [CrossRef]
- Stahl, K.; Hisdal, H.; Hannaford, J.; Tallaksen, L.M.; van Lanen, H.A.J.; Sauquet, E.; Demuth, S.; Fendekova, M.; Jódar, J. Streamflow trends in Europe: Evidence from a dataset of near-natural catchments. Hydrol. Earth Syst. Sci. 2010, 14, 2367–2382. [Google Scholar] [CrossRef]
- Alfieri, L.; Feyen, L.; Dottori, F.; Bianchi, A. Ensemble flood risk assessment in Europe under high end climate scenarios. Glob. Environ. Chang. 2015, 35, 199–212. [Google Scholar] [CrossRef]
- Arnell, N.W.; Gosling, S.N. The impacts of climate change on river flood risk at the global scale. Clim. Chang. 2016, 134, 387–401. [Google Scholar] [CrossRef]
- Vormoor, K.; Lawrence, D.; Heistermann, M.; Bronstert, A. Climate change impacts on the seasonality and generation processes of floods—Projections and uncertainties for catchments with mixed snowmelt/rainfall regimes. Hydrol. Earth Syst. Sci. 2015, 19, 913–931. [Google Scholar] [CrossRef]
- Bronstert, A.; Bárdossy, A.; Bismuth, C.; Buiteveld, H.; Disse, M.; Engel, H.; Fritsch, U.; Hundecha, Y.; Lammersen, R.; Niehoff, D.; et al. Multi-scale modelling of land-use change and river training effects on floods in the Rhine basin. River Res. Appl. 2007, 23, 1102–1125. [Google Scholar] [CrossRef]
- De Roo, A.; Odijk, M.; Schmuck, G.; Koster, E.; Lucieer, A. Assessing the effects of land use changes on floods in the meuse and oder catchment. Phys. Chem. Earth Part B 2001, 26, 593–599. [Google Scholar] [CrossRef]
- Muis, S.; Güneralp, B.; Jongman, B.; Aerts, J.C.J.H.; Ward, P.J. Flood risk and adaptation strategies under climate change and urban expansion: A probabilistic analysis using global data. Sci. Total Environ. 2015, 538, 445–457. [Google Scholar] [CrossRef]
- Kundzewicz, Z.W.; Buda, S.; Wang, Y.; Wang, G.; Tong, J. Flood risk in a range of spatial perspectives—From global to local scales. Hydrol. Earth Syst. Sci. 2019, 19, 1319–1328. [Google Scholar] [CrossRef]
- Hall, J.; Arheimer, B.; Borga, M.; Brázdil, R.; Claps, P.; Kiss, A.; Kjeldsen, T.R.; Kriaučiūnienė, J.; Kundzewicz, Z.W.; Lang, M.; et al. Understanding flood regime changes in Europe: A state-of-the-art assessment. Hydrol. Earth Syst. Sci. 2014, 18, 2735–2772. [Google Scholar] [CrossRef]
- Stagl, J.; Mayr, E.; Koch, H.; Hattermann, F.F.; Huang, S. Effects of Climate Change on the Hydrological Cycle in Central and Eastern Europe. In Managing Protected Areas in Central and Eastern Europe under Climate Change; Rannow, S., Neubert, M., Eds.; Springer: Dordrecht, The Netherlands, 2014; pp. 31–43. ISBN 9789400779600. [Google Scholar]
- Hanel, M.; Vizina, A.; Máca, P.; Pavlásek, J. A multi-model assessment of climate change impact on hydrological regime in the Czech Republic. J. Hydrol. Hydromech. 2012, 603, 152–161. [Google Scholar] [CrossRef]
- Kundzewicz, Z.W.; Kanae, S.; Seneviratne, S.I.; Handmer, J.; Nicholls, N.; Peduzzi, P.; Mechler, R.; Bouwer, L.M.; Arnell, N.; Mach, K.; et al. Flood risk and climate change: Global and regional perspectives. Hydrol. Sci. J. 2014, 59, 1–28. [Google Scholar] [CrossRef]
- Cahynová, M.; Huth, R. Changes of atmospheric circulation in central Europe and their influence on climatic trends in the Czech Republic. Theor. Appl. Climatol. 2009, 96, 57–68. [Google Scholar] [CrossRef]
- Brázdil, R.; Chromá, K.; Dobrovolný, P.; Tolasz, R. Climate fluctuations in the Czech Republic during the period 1961–2005. Int. J. Climatol. 2009, 29, 223–242. [Google Scholar] [CrossRef]
- Kundzewicz, Z.W.; Hirabayashi, Y.; Kanae, S. River Floods in the Changing Climate—Observations and Projections. Water Resour. Manag. 2010, 24, 2633–2646. [Google Scholar] [CrossRef]
- Brázdil, R.; Trnka, M.; Mikšovský, J.; Řezníčková, L.; Dobrovolný, P. Spring-summer droughts in the Czech Land in 1805–2012 and their forcings. Int. J. Climatol. 2015, 35, 1405–1421. [Google Scholar] [CrossRef]
- Mudelsee, M.; Boerngen, M.; Tetzlaff, G.; Gruenewald, U. No upward trends in the occurrence of extreme floods in central Europe. Nature 2003, 425, 166–169. [Google Scholar] [CrossRef] [PubMed]
- Villarini, G.; Smith, J.A.; Serinaldi, F.; Ntelekos, A.A. Analyses of seasonal and annual maximum daily discharge records for central Europe. J. Hydrol. 2011, 399, 299–312. [Google Scholar] [CrossRef]
- Teuling, A.J.; de Badts, E.; Jansen, F.A.; Fuchs, R.; Buitink, J.; van Hoek Dijke, A.J.; Sterling, S. Climate Change, re-/Afforestation, and Urbanisation Impacts on Evapotranspiration and Streamflow in Europe. Hydrol. Earth Syst. Sci. 2019, 23, 3631–3652. [Google Scholar] [CrossRef]
- Kliment, Z.; Matoušková, M.; Ledvinka, O.; Královec, V. Trend analysis of rainfall-runoff regimes in selected headwater areas of the Czech Republic. J. Hydrol. Hydromech. 2011, 59, 36–50. [Google Scholar] [CrossRef]
- Blahusiaková, A.; Matoušková, M. Evaluation of the hydroclimatic extremes in the upper Hron River basin, Slovakia. AUC Geogr. 2016, 51, 187–202. [Google Scholar] [CrossRef][Green Version]
- Magilligan, F.J.; Nislow, K.H. Changes in hydrologic regime by dams. Geomorphology 2005, 71, 61–78. [Google Scholar] [CrossRef]
- Bičik, I.; Langhammer, J.; Stych, P.; Kupková, L. Long-term land-use changes in Czechia as a flood risk influencing factor. AUC Geogr. 2008, 43, 29–52. [Google Scholar]
- Langhammer, J.; Su, Y.; Bernsteinová, J. Runoff Response to Climate Warming and Forest Disturbance in a Mid-Mountain Basin. Water 2015, 7, 3320–3342. [Google Scholar] [CrossRef]
- Su, Y.; Langhammer, J.; Jarsjö, J. Geochemical responses of forested catchments to bark beetle infestation: Evidence from high frequency in-stream electrical conductivity monitoring. J. Hydrol. 2017, 550, 635–649. [Google Scholar] [CrossRef]
- Bernsteinova, J.; Bassler, C.; Zimmermann, L.; Langhammer, J.; Beudert, B. Changes in runoff in two neighbouring catchments in the Bohemian Forest related to climate and land cover changes. J. Hydrol. Hydromech. 2015, 63, 342–352. [Google Scholar] [CrossRef]
- Nehyba, S.; Sikula, J. Depositional architecture, sequence stratigraphy and geodynamic development of the Carpathian Foredeep (Czech Republic). Geol. Carpathica Bratisl. 2007, 58, 53. [Google Scholar]
- Balatka, B.; Kalvoda, J.; Gibbard, P. Morphostratigraphical correlation of river terraces in the central part of the Bohemian Massif with the European stratigraphical classification of the Quaternary. Acta Univ. Carol. Geogr. 2015, 50, 63–73. [Google Scholar] [CrossRef]
- Langhammer, J.; Hartvich, F.; Mattas, D.; Rödlová, S.; Zbořil, A. The variability of surface water quality indicators in relation to watercourse typology, Czech Republic. Environ. Monit. Assess. 2012, 184, 3983–3999. [Google Scholar] [CrossRef]
- Hais, M.; Langhammer, J.; Jirsová, P.; Dvořák, L. Dynamics of Forest Disturbance in Central Part of the Šumava Mountains between 1985 and 2007 Based on Landsat TM/ETM+ Satellite Data. Phys. Geogr. 2008, 53–62. [Google Scholar]
- UHUL Forest Management Institute. Map Server; UHUL Forest Management Institute: Prague, Czech Republic, 2008; Available online: http://www.uhul.cz/ (accessed on 15 June 2020).
- Blöschl, G.; Hall, J.; Parajka, J.; Perdigão, R.A.P.; Merz, B.; Arheimer, B.; Aronica, G.T.; Bilibashi, A.; Bonacci, O.; Borga, M.; et al. Changing climate shifts timing of European floods. Science 2017, 357, 588–590. [Google Scholar] [CrossRef] [PubMed]
- Czech Hydrometeorological Institute. Surface Water Monitoring Network; Czech Hydrometeorological Institute: Prague, Czechia, 2019; Available online: http://portal.chmi.cz/ (accessed on 1 June 2020).
- Shuster, W.D.; Zhang, Y.; Roy, A.H.; Daniel, F.B.; Troyer, M. Characterizing Storm Hydrograph Rise and Fall Dynamics with Stream Stage Data 1. JAWRA J. Am. Water Resour. Assoc. 2008, 44, 1431–1440. [Google Scholar] [CrossRef]
- Kannan, N.; Anandhi, A.; Jeong, J. Estimation of Stream Health Using Flow-Based Indices. Hydrology 2018, 5, 20. [Google Scholar] [CrossRef]
- Yang, T.; Cui, T.; Xu, C.-Y.; Ciais, P.; Shi, P. Development of a new IHA method for impact assessment of climate change on flow regime. Glob. Planet. Chang. 2017, 156, 68–79. [Google Scholar] [CrossRef]
- Eckhardt, K. How to construct recursive digital filters for baseflow separation. Hydrol. Process. 2005, 19, 507–515. [Google Scholar] [CrossRef]
- Lim, K.J.; Engel, B.A.; Tang, Z.; Choi, J.; Kim, K.-S.; Muthukrishnan, S.; Tripathy, D. Automated Web Gis Based Hydrograph Analysis Tool, WHAT. JAWRA J. Am. Water Resour. Assoc. 2005, 41, 1407–1416. [Google Scholar] [CrossRef]
- Arnold, J.G.; Allen, P.M. Automated methods for estimating baseflow and ground water recharge from streamflow records 1. JAWRA J. Am. Water Resour. Assoc. 1999, 35, 411–424. [Google Scholar] [CrossRef]
- Eckhardt, K. A comparison of baseflow indices, which were calculated with seven different baseflow separation methods. J. Hydrol. 2008, 352, 168–173. [Google Scholar] [CrossRef]
- Machiwal, D.; Jha, M.K. Hydrologic Time Series Analysis: Theory and Practice; Springer: Dordrecht, The Netherlands; New Delhi, India, 2012; p. 290. ISBN 9789400718616. [Google Scholar]
- Taxak, A.K.; Murumkar, A.R.; Arya, D.S. Long term spatial and temporal rainfall trends and homogeneity analysis in Wainganga basin, Central India. Weather Clim. Extrem. 2014, 4, 50–61. [Google Scholar] [CrossRef]
- The Nature Conservancy. Indicators of Hydrologic Alteration. Version 7.1. User’s Manual; The Nature Conservancy: Arlington, VA, USA, 2009. [Google Scholar]
- Harper, D.M.; Zalewski, M.; Pacini, N. Ecohydrology: Processes, Models and Case Studies: An Approach to the Sustainable Management of Water Resources; CABI: Wallingford, UK, 2008; ISBN 9781845930028. [Google Scholar]
- Berthold, M.R.; Cebron, N.; Dill, F.; Gabriel, T.R.; Kötter, T.; Meinl, T.; Ohl, P.; Thiel, K.; Wiswedel, B. KNIME—The Konstanz Information Miner: Version 2.0 and Beyond. SIGKDD Explor. Newsl. 2009, 11, 26–31. [Google Scholar] [CrossRef]
- Braun, L.N.; Weber, M.; Schulz, M. Consequences of climate change for runoff from Alpine regions. Ann. Glaciol. 2000, 31, 19–25. [Google Scholar] [CrossRef]
- Svensson, C.; Hannaford, J.; Kundzewicz, Z.W.; Marsh, T.J. Trends in river floods: Why is there no clear signal in observations? IAHS Publ. Ser. Proc. Rep. 2006, 305, 1–18. [Google Scholar]
- Machiwal, D.; Jha, M.K. Time series analysis of hydrologic data for water resources planning and management: A review. J. Hydrol. Hydromech. 2009, 54, 237–257. [Google Scholar]
© 2020 by the authors. Licensee MDPI, Basel, Switzerland. This article is an open access article distributed under the terms and conditions of the Creative Commons Attribution (CC BY) license (http://creativecommons.org/licenses/by/4.0/).