Article

Seasonal and Interannual Trends of Oceanographic Parameters over 40 Years in the Northern Adriatic Sea in Relation to Nutrient Loadings Using the EMODnet Chemistry Data Portal

by
Federica Grilli
1,*,
Stefano Accoroni
2,3,
Francesco Acri
4,
Fabrizio Bernardi Aubry
4,
Caterina Bergami
5,
Marina Cabrini
6,
Alessandra Campanelli
1,
Michele Giani
6,
Stefano Guicciardi
1,
Mauro Marini
1,3,
Francesca Neri
2,
Antonella Penna
3,7,
Pierluigi Penna
1,
Alessandra Pugnetti
4,
Mariangela Ravaioli
5,
Francesco Riminucci
5,8,
Fabio Ricci
3,7,
Cecilia Totti
2,
Pierluigi Viaroli
9 and
Stefano Cozzi
10
1
National Research Council—Institute for Biological Resources and Marine Biotechnologies (CNR-IRBIM), Largo Fiera della Pesca 2, 60125 Ancona, Italy
2
Dipartimento di Scienze della Vita e dell’Ambiente, Università Politecnica delle Marche, Via Brecce Bianche, 60131 Ancona, Italy
3
Fano Marine Center, The Inter-Institute Center for Research on Marine Biodiversity, Resources and Biotechnologies (FMC), Viale Adriatico 1/N, 61032 Fano, Italy
4
National Research Council—Institute of Marine Science (CNR-ISMAR), Arsenale-Tesa 104, Castello 2737/F, 30122 Venezia, Italy
5
National Research Council—Institute of Marine Science (CNR-ISMAR), Via Gobetti 101, 40129 Bologna, Italy
6
Istituto Nazionale di Oceanografia e di Geofisica Sperimentale (OGS), Via Auguste Piccard 54, 34151 Trieste, Italy
7
Department of Biomolecular Sciences, University of Urbino, Via Saffi 2, 61029 Urbino, Italy
8
Consorzio Proambiente, Tecnopolo Bologna, Via Piero Gobetti, 101, 40129 Bologna, Italy
9
Department of Chemistry, Life Sciences and Environmental Sustainability, University of Parma, Parco Area delle Scienze 11/A, 43124 Parma, Italy
10
National Research Council—Institute of Marine Science (CNR-ISMAR), Area di Ricerca di Basovizza, Edificio Q2. Strada Statale 14, km 163,5, 34149 Trieste, Italy
*
Author to whom correspondence should be addressed.
Water 2020, 12(8), 2280; https://doi.org/10.3390/w12082280
Submission received: 7 July 2020 / Revised: 8 August 2020 / Accepted: 11 August 2020 / Published: 13 August 2020

Abstract

:
Long-term data series (1971–2015) of physical and biogeochemical parameters were analyzed in order to assess trends and variability of oceanographic conditions in the northern Adriatic Sea (NAS), a mid-latitude shallow continental shelf strongly impacted by river discharges, human activities and climate changes. Interpolation maps and statistical models were applied to investigate seasonal and spatial variability, as well as decadal trends of temperature, salinity, chlorophyll-a and nutrients. This analysis shows that sea surface temperature increased by +0.36% year−1 over four decades. Annual mean flow of the Po River markedly changed due to the occurrence of periods of persistent drought, whereas the frequency of flow rates higher than 3000 m3 s−1 decreased between 2006 and 2015. Moreover, we observed a long-term decrease in surface phosphate concentrations in Po River water (−1.34% year−1) and in seawater (in summer −2.56% year−1) coupled, however, to a significant increase in nitrate concentration in seawater (+3.80% year−1) in almost all seasons. These changes indicate that the nutrient concentrations in the NAS have been largely modulated, in the last forty years, by the evolution of environmental management practices and of the runoff. This implies that further alteration of the marine environment must be expected as a consequence of the climate changes.

1. Introduction

Continental shelf areas are strongly threatened by climate change and by their interaction with a large variety of disturbances of anthropogenic origin. Changes in river discharge, modifications of oceanographic characteristics and of circulation patterns, sea level rise and coastal erosion interact with anthropogenic discharges of the nutrients and of organic matter, often leading to eutrophication problems and to changes in the structure of marine ecosystems, including the spreading of alien species [1,2,3,4,5]. This issue is critical considering that an important portion of the human population (625 million year 2000; global population of 6.1 billion) lives in coastal zones and use their ecosystem services [6].
The northern Adriatic Sea (NAS), which constitutes the northernmost continental shelf of the Mediterranean Sea, is an important example of a marine system dynamically influenced by anthropogenic pressures. They originate mainly by the presence of the rivers, among which the Po River contributes to about 50% of the external nutrient inputs [7,8,9,10,11]. The large variety of human activities (i.e., maritime traffic, fisheries, mariculture, offshore gas extraction, tourism) and the presence of vulnerable benthic habitats, poses serious risks to the delicate ecological equilibria of NAS ecosystem [12]. Significant changes in plankton community composition, macrobenthos distribution, spreading of non-indigenous species, total biomass of target demersal fishes and small pelagic fish catches have been reported here by different authors [10,13,14,15].
The modifications induced by human activities are, to some extent, also interacting with climate changes, primarily the warming of shelf waters [16,17,18,19], the changes in the frequency of extreme events [20,21,22] and of precipitation patterns [23,24,25]. Therefore, a prerequisite for a correct assessment of their effects is the acquisition of long-term data series useful for analyzing environmental trends and shifts from seasonal to multidecadal scales. Large climatic patterns and local meteorological conditions interact in the NAS, modifying the structure of the water column and modulating the inputs and utilization of the nutrients in the marine environment [26,27]. The plankton responses to these changes seem to depend by the combination of the trophic state of the ecosystems and of the strength of local disturbance [28].
Within this context, the maintenance of long-term research and monitoring of the oceanographic properties of the NAS waters has become a major task for the coastal management and spatial planning in the Mediterranean Sea. Climatological values, variability ranges and the detection of trends are the main factors for the evaluation and quantification of climate change and other ecological, and anthropogenic effects [29,30,31,32,33].
The aim of the present study is to assess the variability at seasonal and interannual scales of the main oceanographic parameters in the NAS, highlighting trends and oscillations that have occurred in the last four decades. The spatial variability of biogeochemical conditions is also assessed, in particular along the coasts of this basin. These changes in the marine waters of NAS are compared to the dynamics of the Po River, which can be considered a proxy of the overall runoff on in this continental shelf area [34].
The dataset analyzed in the present study was collected from EMODnet Chemistry data portal, a European Network aimed at the reorganization and reutilization of marine data. It covers a larger region and a longer period than the ones analyzed in previous studies in the NAS [10,35,36,37]. The analysis of this dataset also targets to assess the relationships between the runoff and the characteristics of the NAS that might be induced by future climate changes.

2. Materials and Methods
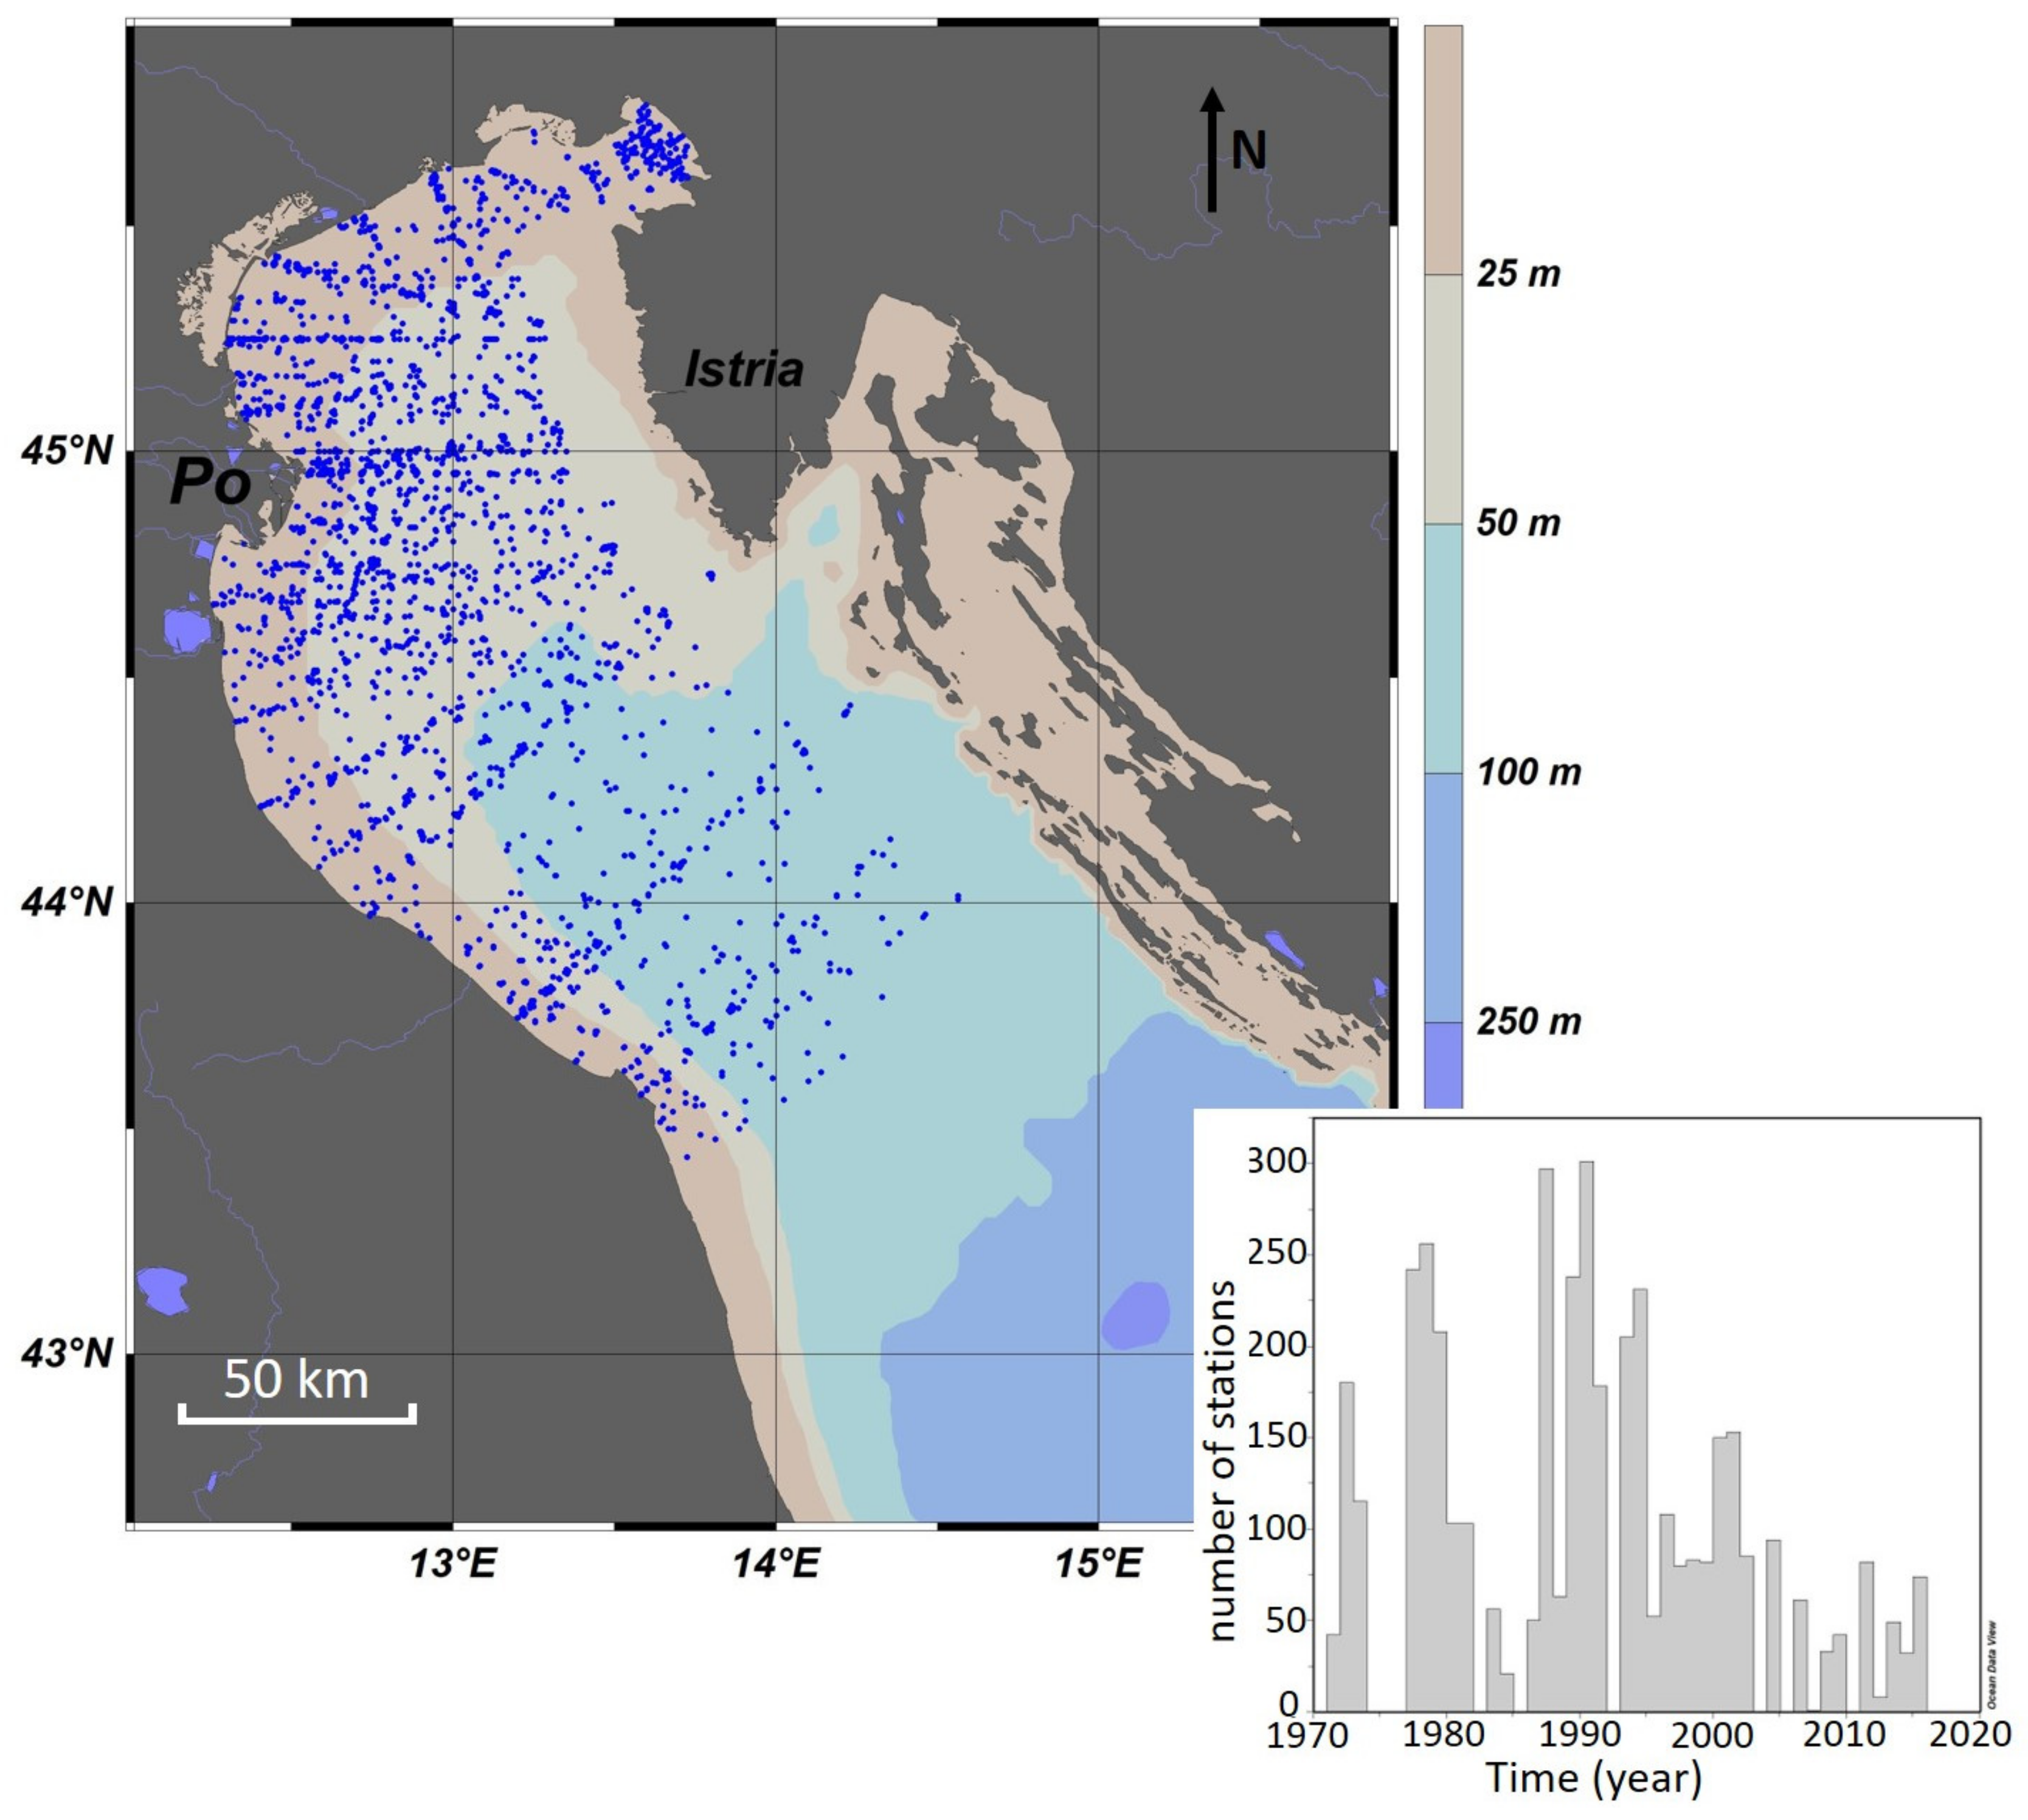
2.1. Study Site

The NAS, defined as the area delimited by the 100 m isobaths (Figure 1), is a shallow and semi enclosed continental shelf, characterized by a high freshwater input and by a prevalent cyclonic circulation of the water masses [38]. The hydrodynamic behavior of the NAS is rather complex and a number of important physical and biogeochemical processes occur there. River discharges, in particular by the Po River (mean daily flow rate of 1500 m3 s−1; [34,39]), drive the stratification of the water column and the thermohaline circulation at basin scale. They cause the outflowing of fresher waters along the western coast and a return flow of salty waters along the eastern coastline, which brings the modified Levantine Intermediate Water (MLIW; temperature 13.7–14.3 °C and salinity 38.60–38.90) on the shelf of the NAS mainly between spring and autumn [38,40,41]. The shelf is also an area of formation and sinking of the densest Mediterranean water mass (North Adriatic Deep Water; NAdDW; temperature 9.8–11.4 °C and salinity 38.02–38.58), which is favoured by a complete mixing of the water column and by the cooling effect of the winds during winter [38]. Wind regime exerts an important effect in all the seasons, with a prevalence of strong dry northeasterly wind in winter, called Bora [42], and moderate southeasterly winds in spring and autumn. A variable and complex circulation in the NAS is also affected by the Adriatic-Ionian Bimodal Oscillating System, BiOS [43,44], which acts as a link between the Ionian circulation and the shelf region [11,27,45,46,47].

2.2. Data Inventory and Processing

The NAS is one of the 25 research parent sites belonging to the Italian Long Term Ecological Research Network (LTER-Italy; URL: https://deims.org/92fd6fad-99cd-4972-93bd-c491f0be1301), which is a formal member of the International and European LTER networks. Long-term series of oceanographic observations provides here unique and precious tools for depicting reliable patterns of average annual cycles and for detecting significant changes and trends in response to global or local pressures and impacts [48,49,50].
The dataset produced through the activity of LTER-Italy was extracted from the Ocean Browser EMODnet (European Marine Observation and Data Network, URL: https://www.emodnet-chemistry.eu/; accessed in June 2018) Chemistry data portal. This portal gives free and open access to observations of several chemical variables. The network of data centers engaged in EMODnet Chemistry gathers marine chemistry data sets, both from marine environmental monitoring and scientific research. The data collection is done in direct communication with data originators to ensure the best sets of data and related metadata, and to prevent duplicates. Data originators are responsible for the first quality control of data and flagging with quality information. As a further step, a Quality Control (QC) loop is implemented to harmonize, standardize and validate data and metadata on European and regional scales [51]. Data are extracted from the network of data centers into global data collections.
The production of true data requires that all partners adopt good field and laboratory procedures in order to assure Quality Assurance/Quality Control (QA/QC) of the input data EMODnet Chemical portal according to the International standard ISO/IEC 17025:2005. The usage license is defined by data originators at dataset level and is affected by the sensitivity of measurements: metadata are freely accessible on CDI (Common Data Index) data portal (http://seadatanet.maris2.nl/v_cdi_v3/search.asp), while data are downloadable according to the originator data policy [52].
The marine data used in this study (station no. about 4158) refer to seawater temperature (T; °C), salinity (S), chlorophyll-a (Chl-a; µg L−1) and nutrient concentration (nitrate, NO3ˉ; phosphate, PO43ˉ; silicate, SiO2; µM) collected in 1971–2015. These parameters were acquired by CTD (Conductivity-Temperature-Depth) probes, bottle sampling and autonomous monitoring systems, in oceanographic cruises and in fixed-point monitoring stations (see [53] for details). We considered only the near-surface water layer (0 to 3 m of depth), for which the data are most abundant and better spatially distributed.
The homogeneity and the temporal coverage of each parameter available in EMODnet Chemistry data portal were analyzed and discussed together with the results. The data relevant to the transitional waters (i.e., deltas, coastal lagoons) were excluded from the analysis, as they are mainly affected by local conditions that are beyond the aim of this study. In the dataset, we used data 1 nautical mile from the coast. The distribution of the sampling stations provides an optimal coverage of the Italian waters of the NAS (Figure 1).
Daily mean flow rates (m3 s−1), phosphate and nitrate concentrations measured at the closure of the drainage basin of the Po River (Pontelagoscuro station; 44.88° N, 11.60° E; 8 m a.s.l.) were provided by Agenzia Regionale per la Protezione dell’Ambiente of the Emilia Romagna Region (ARPAE-ER).
We analyzed the whole dataset on the seasonal scale, with the following month clustering: January–March (winter), April–June (spring), July–September (summer) and October–December (autumn). In order to assess the average seasonal patterns, we obtained distribution maps by the spatial interpolation of data subdivided on the seasonal basis. Data were averaged on a grid of 2 km × 2 km, regardless of the year, and subsequently interpolated using the Kriging method (Surfer 11.6 Package; Golden Software, Golden, CO, United States). The statistical analyses were carried out using R [54]; ver. 3.6.2 for Windows, Vienna, Austria). The overall temporal trends were assessed by Generalized Linear Model (GLM) regression, using Gamma as a statistical distribution and setting “log” as a link function [55], allowing us to properly weigh outliers. Besides, to better assess the influence of the runoff on the coastal waters, we considered a coastal belt up to 4.5 miles offshore. These data were divided in two sub periods (1971–2005 and 2006–2015) according to Totti et al. [56], which used a similar distinction to evaluate the variations on a decadal scale of the physico-chemical properties of the seawater and of phytoplankton biomass. The comparison between these two periods was carried out by a classical t-test analysis, with a statistical significance of p value = 0.05.

3. Results and Discussion

Oceanographic properties (T and S), Chl-a and nutrient concentrations were analyzed on both spatial and temporal scales (interannual variability and seasonal cycles), in order to assess the seasonal variability of spatial patterns, as well as the long-term trends in the NAS.

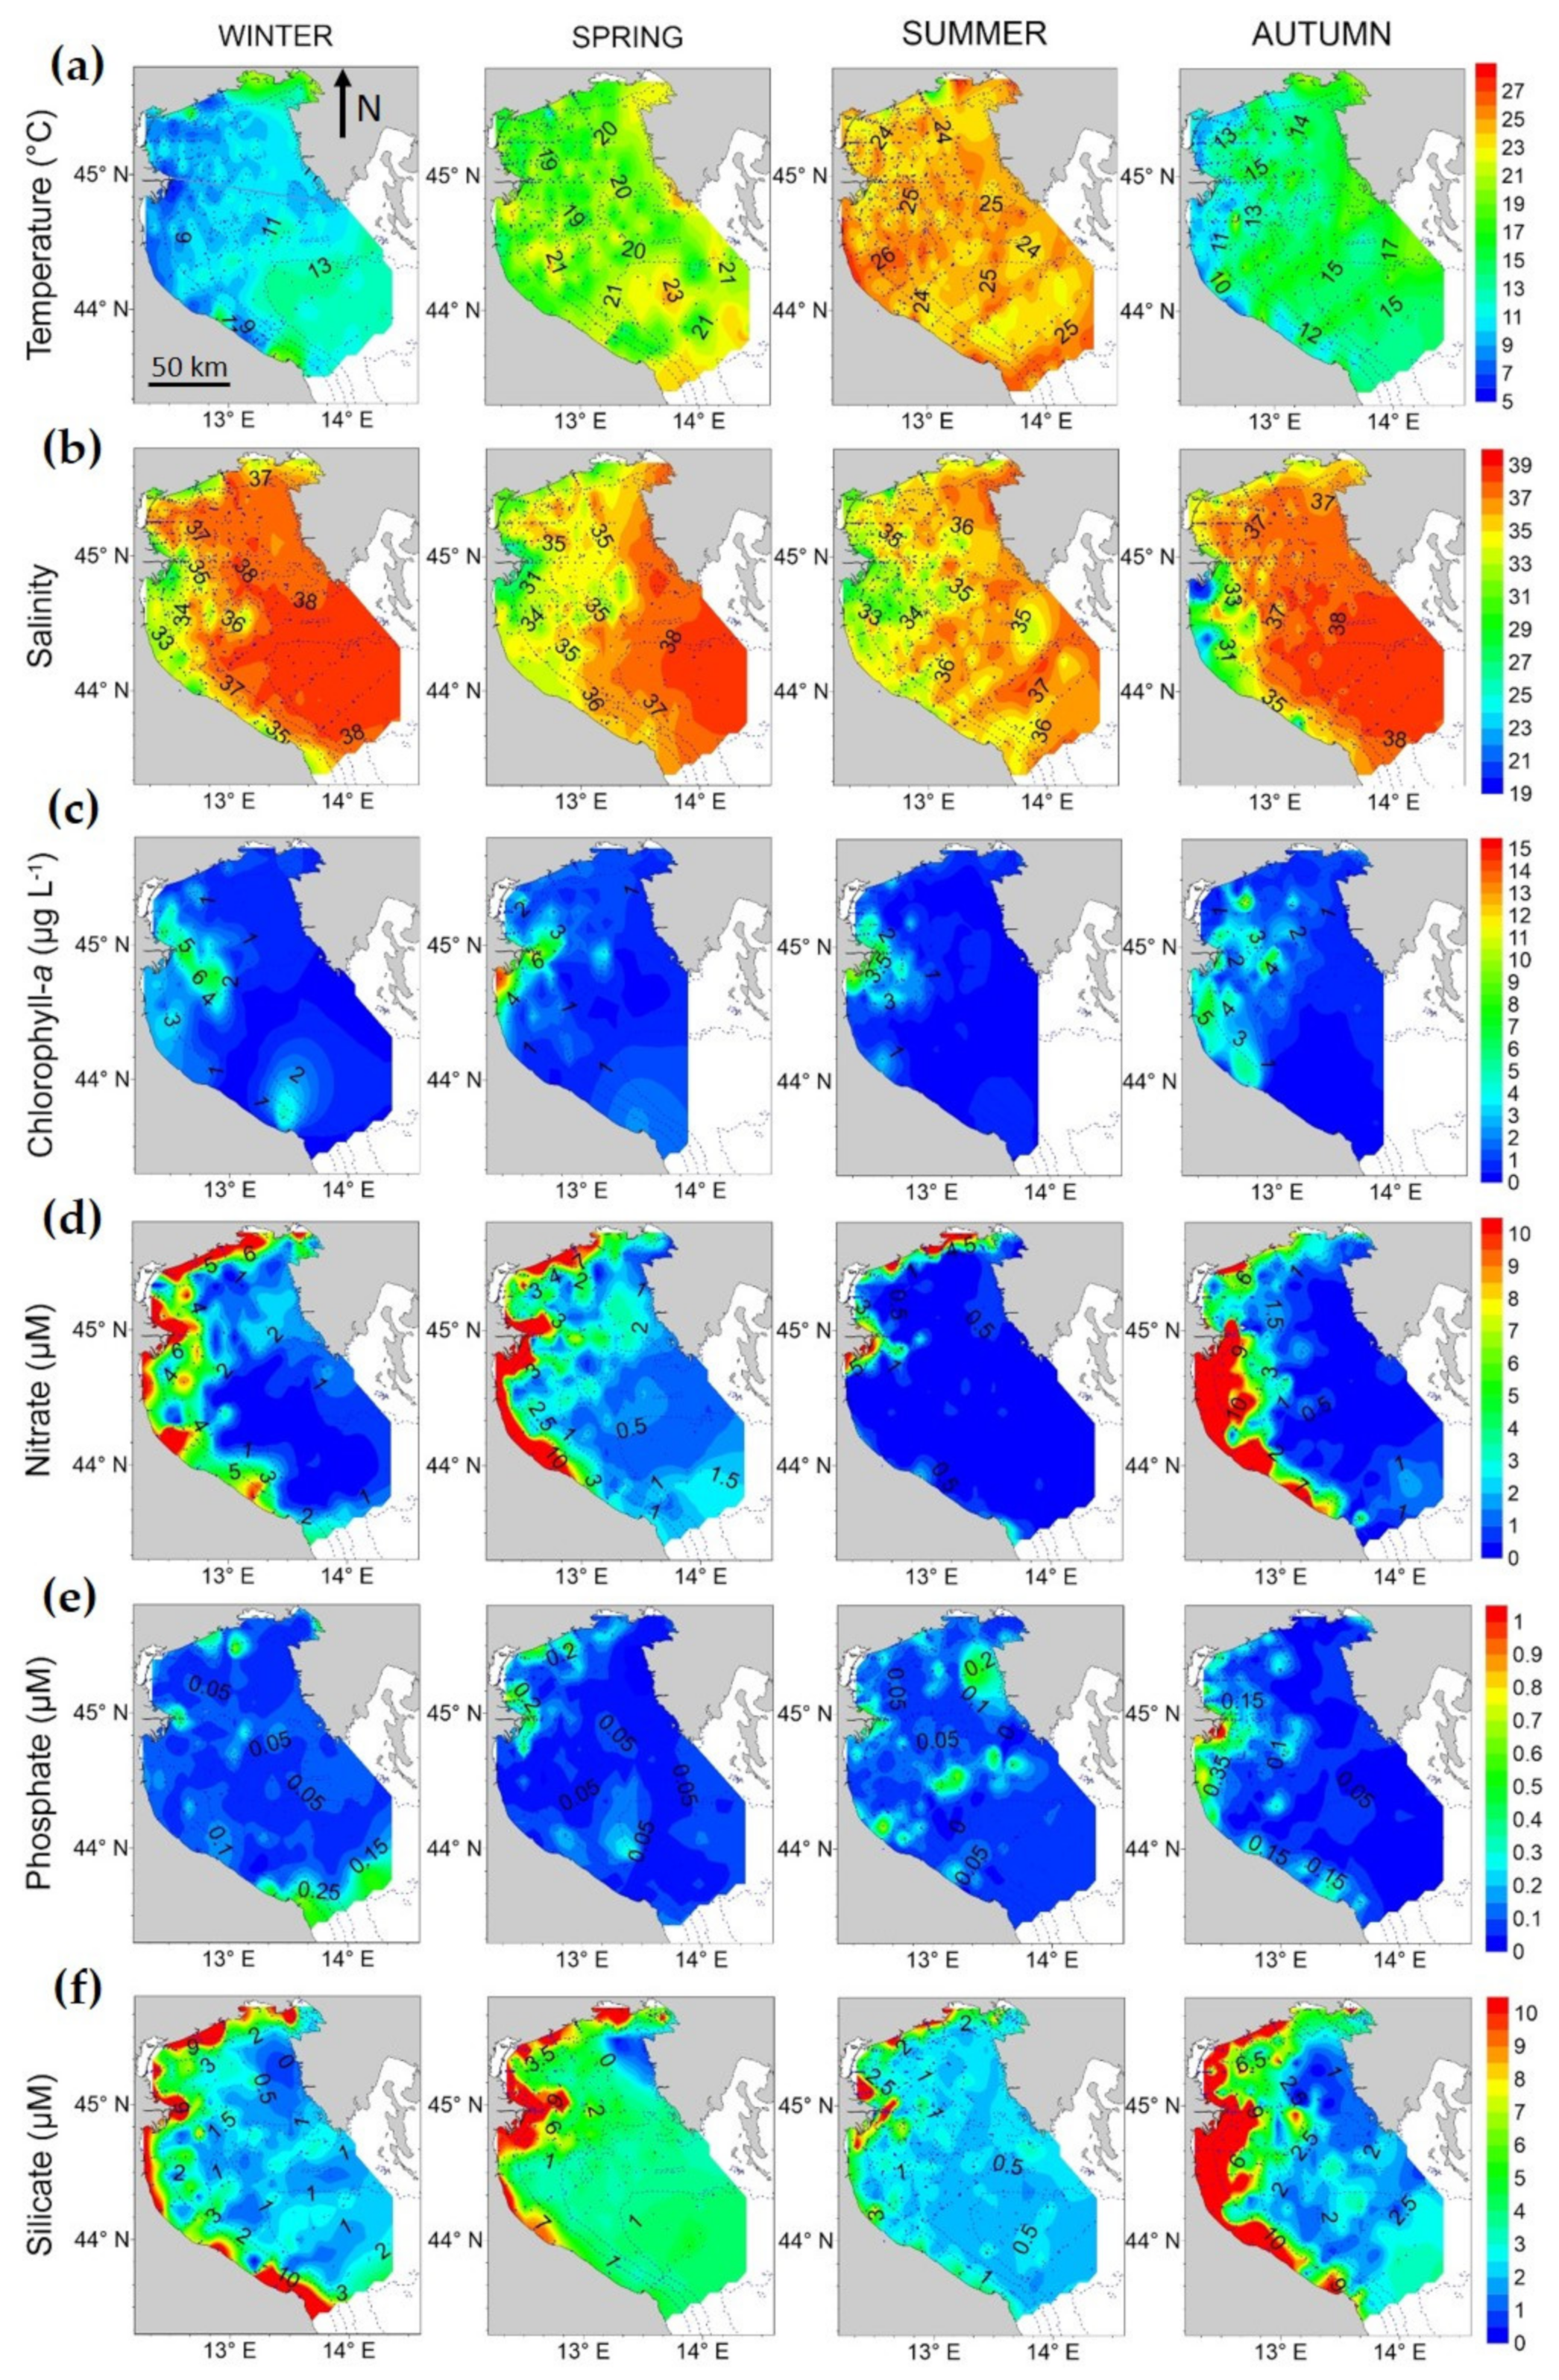
3.1. Seasonal Characteristics of Basin Scale Patterns

Seasonal distribution maps (Figure 2) show, first of all, that the Po River influence extends south-westward, in particular during autumn, as clearly shown by low salinity values and by high values of nutrient concentrations and Chl-a. This condition makes this sub region of NAS highly productive and potentially exposed to eutrophic and distrophic phenomena [7,26,57,58,59].
In detail, the spatial distribution of the surface T (Figure 2a) shows a marked seasonal signal, with an excursion between summer and winter temperatures as large as 20 °C in the western region. During winter, when the mean T in the NAS is 10.50 ± 0.12 °C (Table 1), a pronounced gradient along the longitudinal axis and one, less pronounced, along the latitudinal axis are well recognizable, with lower values (T < 8 °C) in the region of NAS close to the north-western Italian coast. Warmer waters (T > 13 °C) occupy mainly the south-eastern part of the NAS. This pattern is consistent to the cyclonic circulation affecting the whole Adriatic Sea, which advects warmer waters from the southern sub-basin. The northernmost waters are instead subjected to a large heat loss due to north-easterly cold winds and transported south-eastwards along the western coast [42]. In spring, temperature pattern is more characterized by a mesoscale variability and by weaker gradients, with temperatures comprised in the range 10–28 °C (mean value: 18.80 ± 0.13 °C). The warmer waters (T > 21 °C) are located mainly along the eastern coast, while relative cold surface waters occupy the rest of the basin. During summer, the thermal variability is slightly higher than in the previous season (19–29 °C), with a mean value of 24.24 ± 0.05 °C and the waters with T > 25 °C located along the western coast south of the Po River. These values indicate that the NAS can be affected by instable meteorological conditions also in the warmest period of the year. Autumn is characterized by cooling over the whole basin (mean value: 13.67 ± 0.13 °C) and by a clear signal of the cold southwards-flowing Western Adriatic Current (WAC; T < 12 °C) confined along the western coast. Globally, the emerging picture confirms the seasonal patterns of seawater temperature identified in previous studies [10,36], although it provides a more detailed description at the mesoscale and a larger spatial coverage over the whole NAS.
The surface maps of S (Figure 2b) show that, in winter and autumn, the largest part of the Po plume flows southward, while, in spring and summer, a significant amount of freshwater reaches the center of the basin. This could be associated with the generation of small-scale features, described in the literature as NAS autumn gyre [38,60,61,62,63]. During winter, the mean S is 36.05 ± 0.11 and most of the northern area between the Po River delta and Istria peninsula has a rather high salinity. During spring, the mean S values decreases to 34.47 ± 0.11, with minima below 31 in the Po delta region (Table 1). A significant offshore propagation of fresher waters is evident in this season, because of the high discharge of the Po River and of the seasonal onset of the thermal stratification. During summer, a further slight decrease in the surface S values is observed, together with a further offshore propagation of the coastal fronts. This is easily due to the maximum stratification and to a weak circulation typical of this season, which confine the relatively low amount of freshwater in a thin and extended upper layer. In autumn, the S distribution is similar to winter, with lower S waters (S < 32) confined in a narrow strip along the Italian coast. The inflow of the eastern current, carrying the saline Levantine waters, is traced by a spatial distribution of very-high-salinity waters, more clearly recognizable in winter [60].
Chl-a concentration (Figure 2c) shows the highest values in front of the Po delta in all seasons and particularly in spring, reaching 14 µg L−1. In autumn (mean value: 1.91 ± 0.11 µg L−1), the area with high values is wider than during the other seasons and extends both eastwards and southwards of the Po delta. This pattern indicates an almost constant accumulation of phytoplankton biomass on a sub-regional scale supported by the discharge of river nutrients [64,65].
The spatial distribution of NO3ˉ concentration (Figure 2d) shows a marked spatial gradient from the Po delta north-eastwards mainly in winter and spring, while, in autumn, the gradient is in the south-eastward direction, in correspondence with the highest values (NO3ˉ ≈ 9–10 µM). The season with lowest NO3ˉ concentration is summer (mean value 1.55 ± 0.12 µM), which is also the season with the lowest river discharge.
The concentration of PO43ˉ at the surface is typically very low everywhere, with an average basin value around 0.10 ± 0.01 µM in all the seasons (Figure 2e). PO43ˉ reaches the highest levels in autumn, when they attained 1 µM in front of the Po delta. The lowest concentrations are observed in summer, when the whole NAS shows values lower than 0.1 µM, except for the coastal area north of the Po delta (0.4 µM).
The concentration of SiO2 (Figure 2f) are far larger than those of other nutrients, attaining the highest values at the surface in the western area of the NAS, most affected by river discharges. SiO2 concentrations are correlated to low salinity values, particularly in autumn along the western coast, where the values are higher (10 µM). The higher mean SiO2 concentration is (7.71 µM) recorded in autumn and the lowest (2.6 µM) in summer. These findings well correlate with the Po River plume pattern that, in autumn, is closer to the Italian coasts and stretches southward alongshore [66].

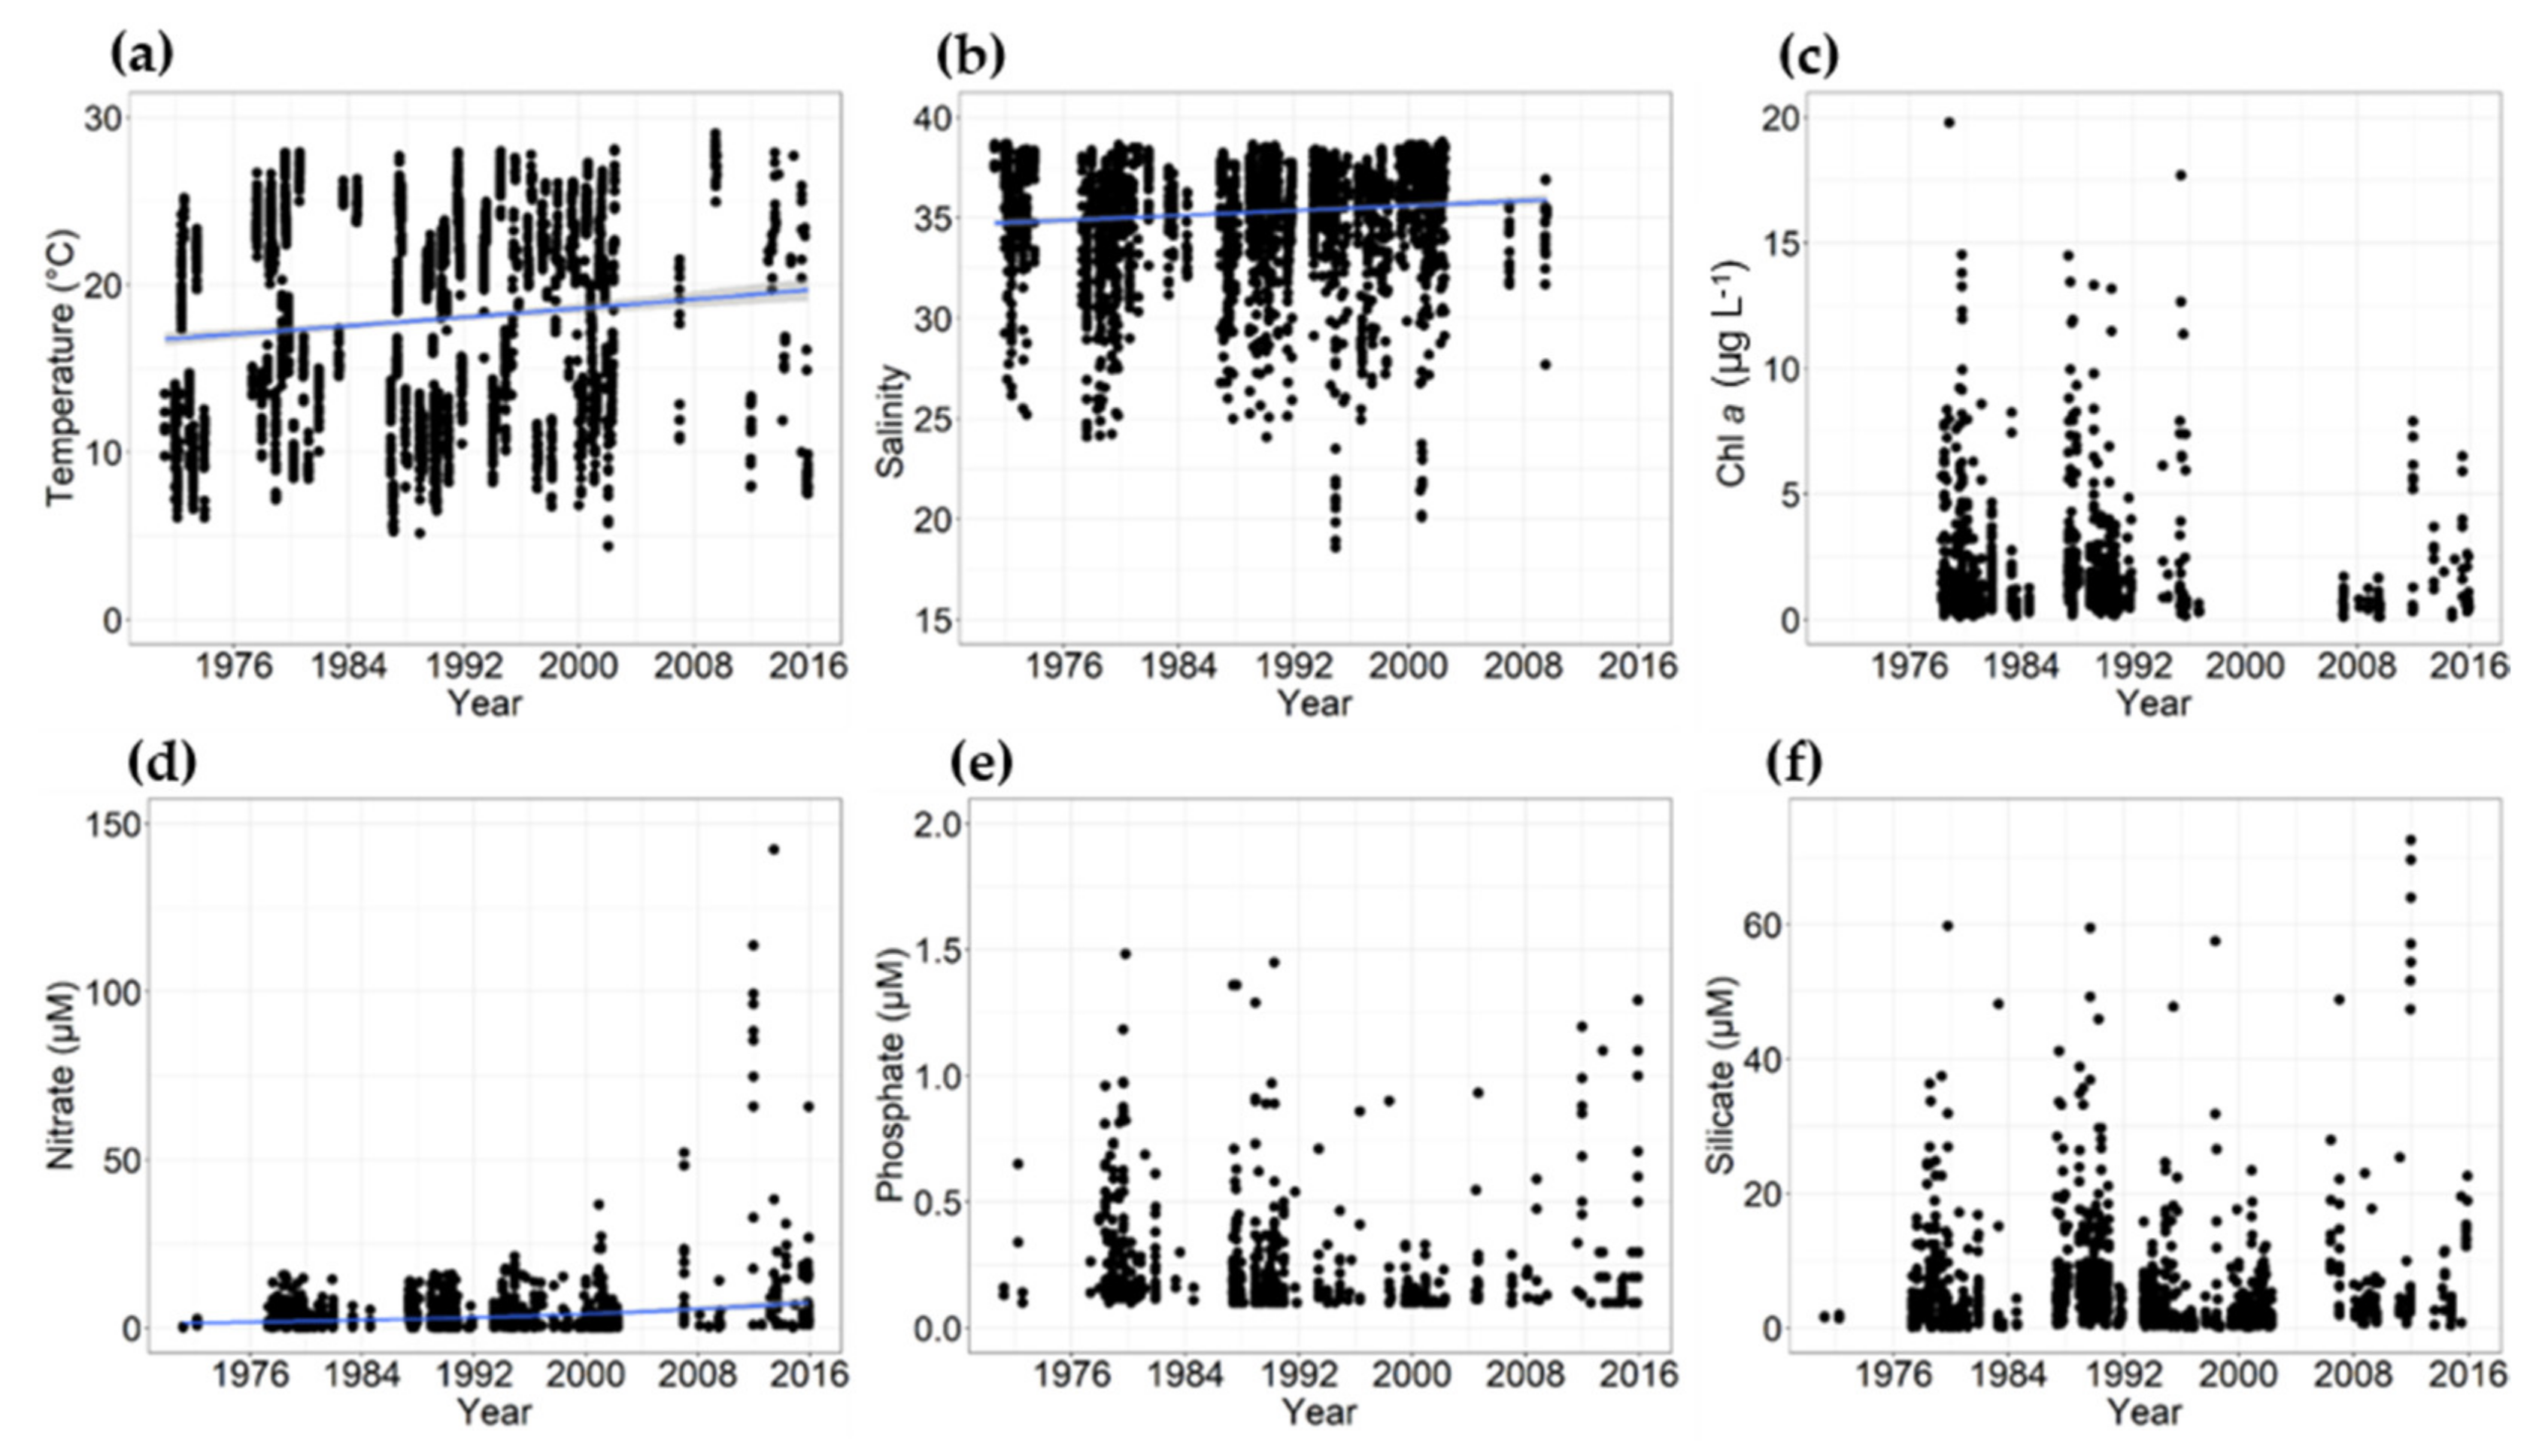
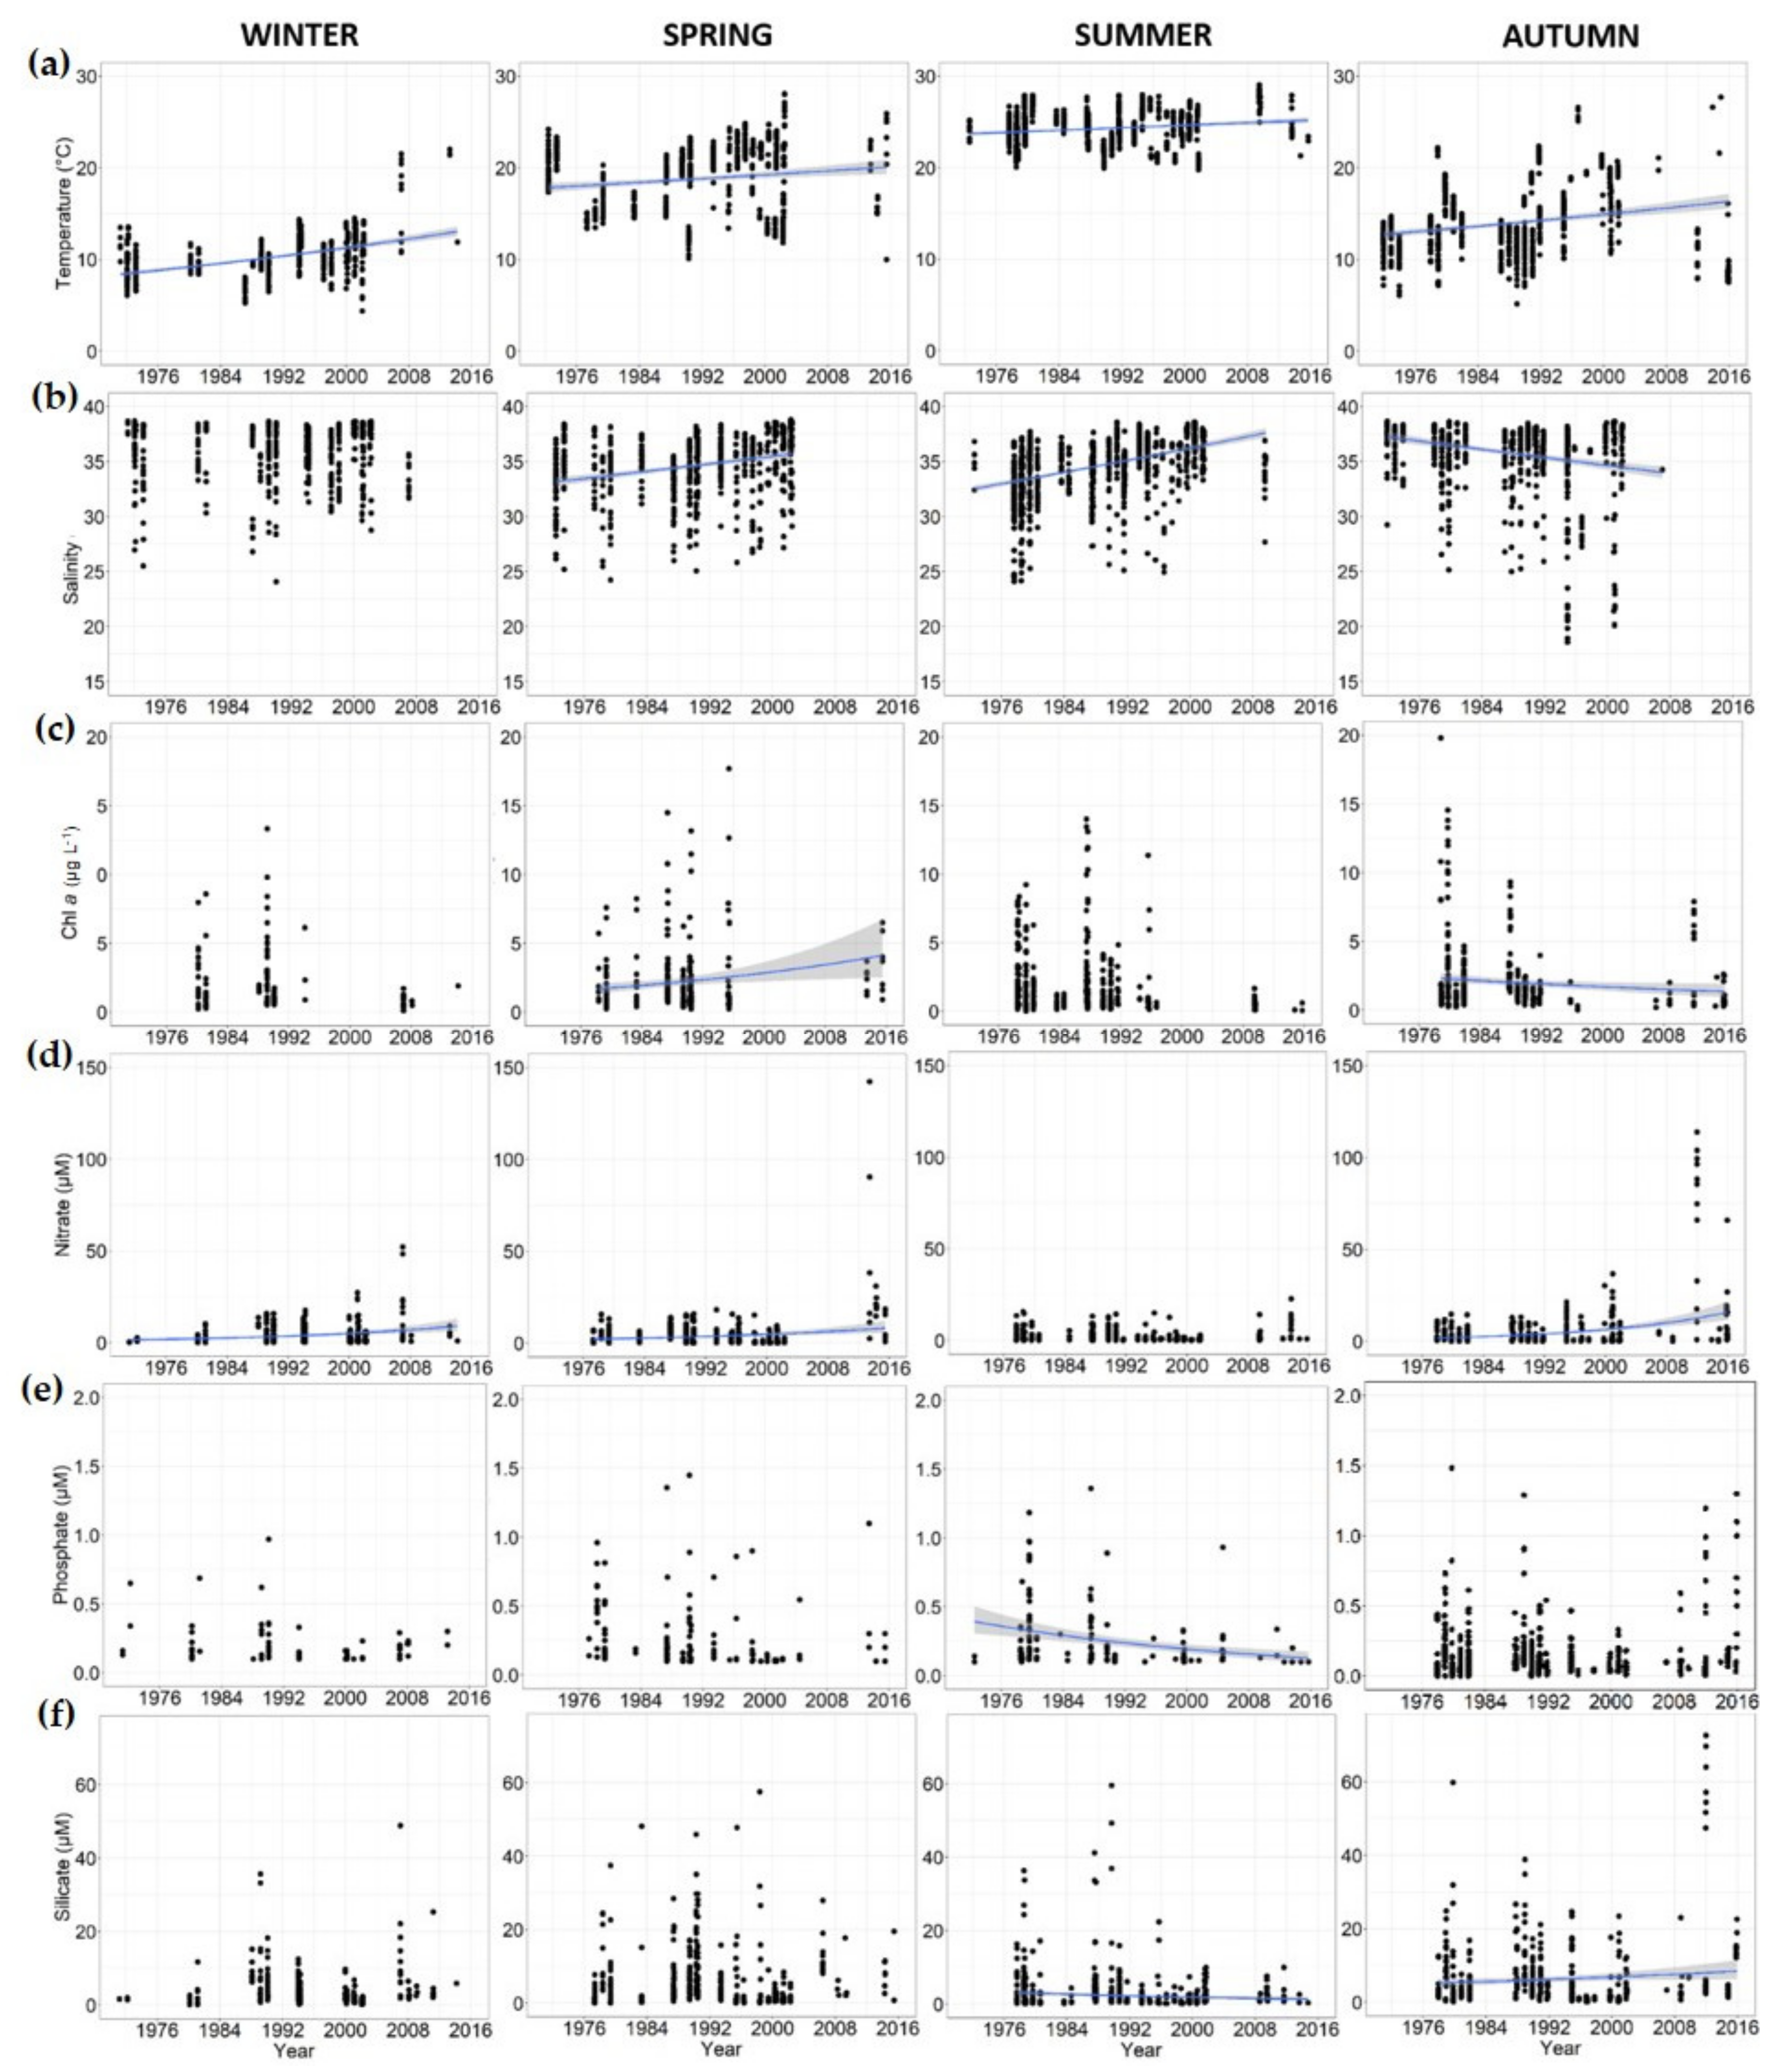
3.2. Annual and Seasonal Trends of Oceanographic Properties

The analysis of temporal trends shows a significant increase in the surface T at the basin level (+0.36% year−1; Table 2), both in aggregated data (Figure 3a) and at seasonal level (Figure 4a), particularly during winter and autumn. These trends agree with previous changes detected in areas of NAS [10,37,56], in the Gulf of Trieste [50,67] and from satellite-based data analysis [68]. However, they confirm that seawater warming is a process significant on the basin scale, which shows the consequences in the marine environment of the increases in air temperature and annual heat fluxes documented in the same region [69,70].
The trend of S is positive for the aggregated data (+0.086% year−1; Table 2; Figure 3b) and in spring (+0.24% year−1) and summer (+0.39% year−1), while it is negative during autumn (−0.26% year−1) and absent in winter (Figure 4b). The overall increase in S is consistent with the decrease in the Po River discharge (see Section 3.3), which has been linked to a decline in the annual precipitation over Italy by 5% per century in the entire period 1865–2003 [70,71]. By contrast, the negative S trend observed in autumn seems to be related to a larger spreading offshore of the Po River plume observed in this season in the most recent period [37]. In winter, the trend of S at basin scale is not related to the Po River discharges, most likely due to the confinement of fresher waters in a narrow belt along the Italian coast.
In our analysis, Chl-a concentration does not show an overall trend on aggregated data in 1978–2015. (Figure 3c). At a seasonal scale, Chl-a concentration shows a significant decrease in autumn (−1.34% year−1) and an increase in spring (+2.41% year−1), mostly due to the data collected in the most recent years (Figure 4c).
The reduction in Chl-a concentration in aggregated data until 2008 agrees with Giani et al. [10], which observed a significant decrease in the Chl-a concentration offshore the Po River until 2010. A negative Chl-a trend was also detected in the NAS using satellite data, in the period 1998–2009, likely due to a decrease in the Po River flow since 2003 [72]. An annual cycle of Chl-a with a reduced amplitude in 2004 and a shift toward lower Chl-a values in 2003–2008 was reported by Mélin et al [73]. In the western coastal zone of NAS, a reduction in the trophic level occurred in concomitance to the decreases in ammonium, P and Chl-a concentrations [74]. A decreasing trend of Chl-a was also observed by analyzing pluridecadal series in the Gulf of Trieste [50]. However, the most recent increase in Chl-a observed since the 2010s in this dataset (Figure 3c), as well as the distinct trends found in some seasonal scales (spring and autumn, Figure 4c), suggest that this well-known tendency of oligotrophication of the NAS should be reconsidered on the basis of the most recent oceanographic data.
A significant positive trend is observed in NO3ˉ concentrations both in aggregated data (+3.80% year−1 Table 2; Figure 3d) and during all the seasons (Figure 4d) except for summer, when the Po River is minimum [65]. A similar result, referred to DIN, was observed by Totti et al. [56]. The positive trend for NO3ˉ is likely due to a combination of several factors. From a trophic point of view, the marine system of the NAS may be limited by PO43ˉ, thus determining a surplus of NO3ˉ in seawater that is not used for phytoplankton growth [10]. Moreover, it could be also due to increasing inputs of anthropogenic nitrogen in the drainage basin of the Po River, which cause high nitrogen loads during the years of high river waters discharge [64,65]. Finally, a larger nitrogen deposition from the atmosphere to the sea, which led to a detectable increase in the nitrate concentration of the upper seawater, was observed worldwide [75].
The trend of PO43ˉ is not significant over the investigated time period for the aggregated data, but it shows the occurrence of temporary low levels of concentration during the 2000s and a recovery of higher values since 2010 (Figure 3e). This result is consistent with previous analysis of Giani et al. [10] for the period 1971–2010, which terminated with a prolonged period of low discharge from the rivers, as well as with the recovery of phosphorus availability since 2007 reported by Totti et al. [56] in the coastal station of Senigallia transect. An overall negative trend of PO43ˉ concentration (−2.56% year−1) is observed only in summer (Figure 4e), suggesting a more pronounced depletion of this nutrient by phytoplankton in the condition of low runoff and the pronounced stratification of the water column [76]. The general reduction in PO43ˉ inputs, linked to the removal of polyphosphates in detergents by legislative acts during second half 1980s [77] and the lower use of phosphate-based fertilizers in agriculture [64,78], seems to have had consequences in the marine system of the NAS until the 2000s, but not in the last decade. However, it should be also noticed that the NAS is an almost permanent P-deficient status, where the availability of PO43− in the waters not directly affected by the runoff depends mainly on the remineralization of organic phosphorus. During autumn and winter seasons, under cold Bora wind events causing the complete vertical mixing in the stratified water column and the resuspension of bottom sediments, the concentration of inorganic dissolved nutrients in the bottom water increased consistently with the release of nutrients from the sediments to upper layer with the mineralization processes [42].
The temporal trend of SiO2 is not significant in the aggregated data (Figure 3f), but it shows positive values in autumn (+1.26% year−1) and negative ones in summer (−2.25% year−1; Figure 4f). The increasing trend in autumn seems to be linked to the higher river inputs, while the decreasing trend in summer is likely due to lower river inputs and to uptake by phytoplankton dominated by diatoms [7,79].
Cozzi and Giani [34] highlighted that the annual loads of N and P in the NAS are primarily depending by the quantity of river water discharged in this marine region. However, the increase in NO3ˉ concentration in the last decade might also be due to an increase in their atmospheric deposition, particularly during heavy rainfall events [20]. It was shown that the contribution of extreme rainfall events in NE Italy increased in 1920−1998, notwithstanding a negative trend in the number of wet days. Raymond et al. [80] characterized Mediterranean spatio-temporal rainfall patterns over the period 1950−2013. The authors found a strong decrease in the number of rainy days all over Italy, with an increase in intense precipitation events. This is also a common result for many areas of the world, such as South America [81], the United States [82,83] and Europe [84], and it represents one of the expected consequence of global warming [85].
The change in precipitation regime has consequences on surface runoff, river flows and nutrient loadings into the sea. The extreme flood events from the Po River, caused by particularly heavy rainfall, lead to a higher concentration of major nutrients and of organic matter [22]. The increase in NO3ˉ concentration (Figure 3d) is therefore not unexpected, since alternating floods and drought strongly affect the pathways and fate of N and P and their ratio [86,87], with drought inducing a time-lag between the delivery of the nutrients from catchments and their accumulation [64]. Mozetič et al. [88] and Giani et al. [10] analyzed a long data series offshore the Po River, showing how, after peaking in the mid-1980s, eutrophication has apparently started a decreasing trend since 2000, when PO43ˉ concentrations decreased, along with low Chl-a concentrations and phytoplankton biomass, reaching very low values in the driest years in 2003–2007. Afterwards, in very wet years (e.g., 2008–2010 and 2014), riverine discharge and loadings increased again [89].

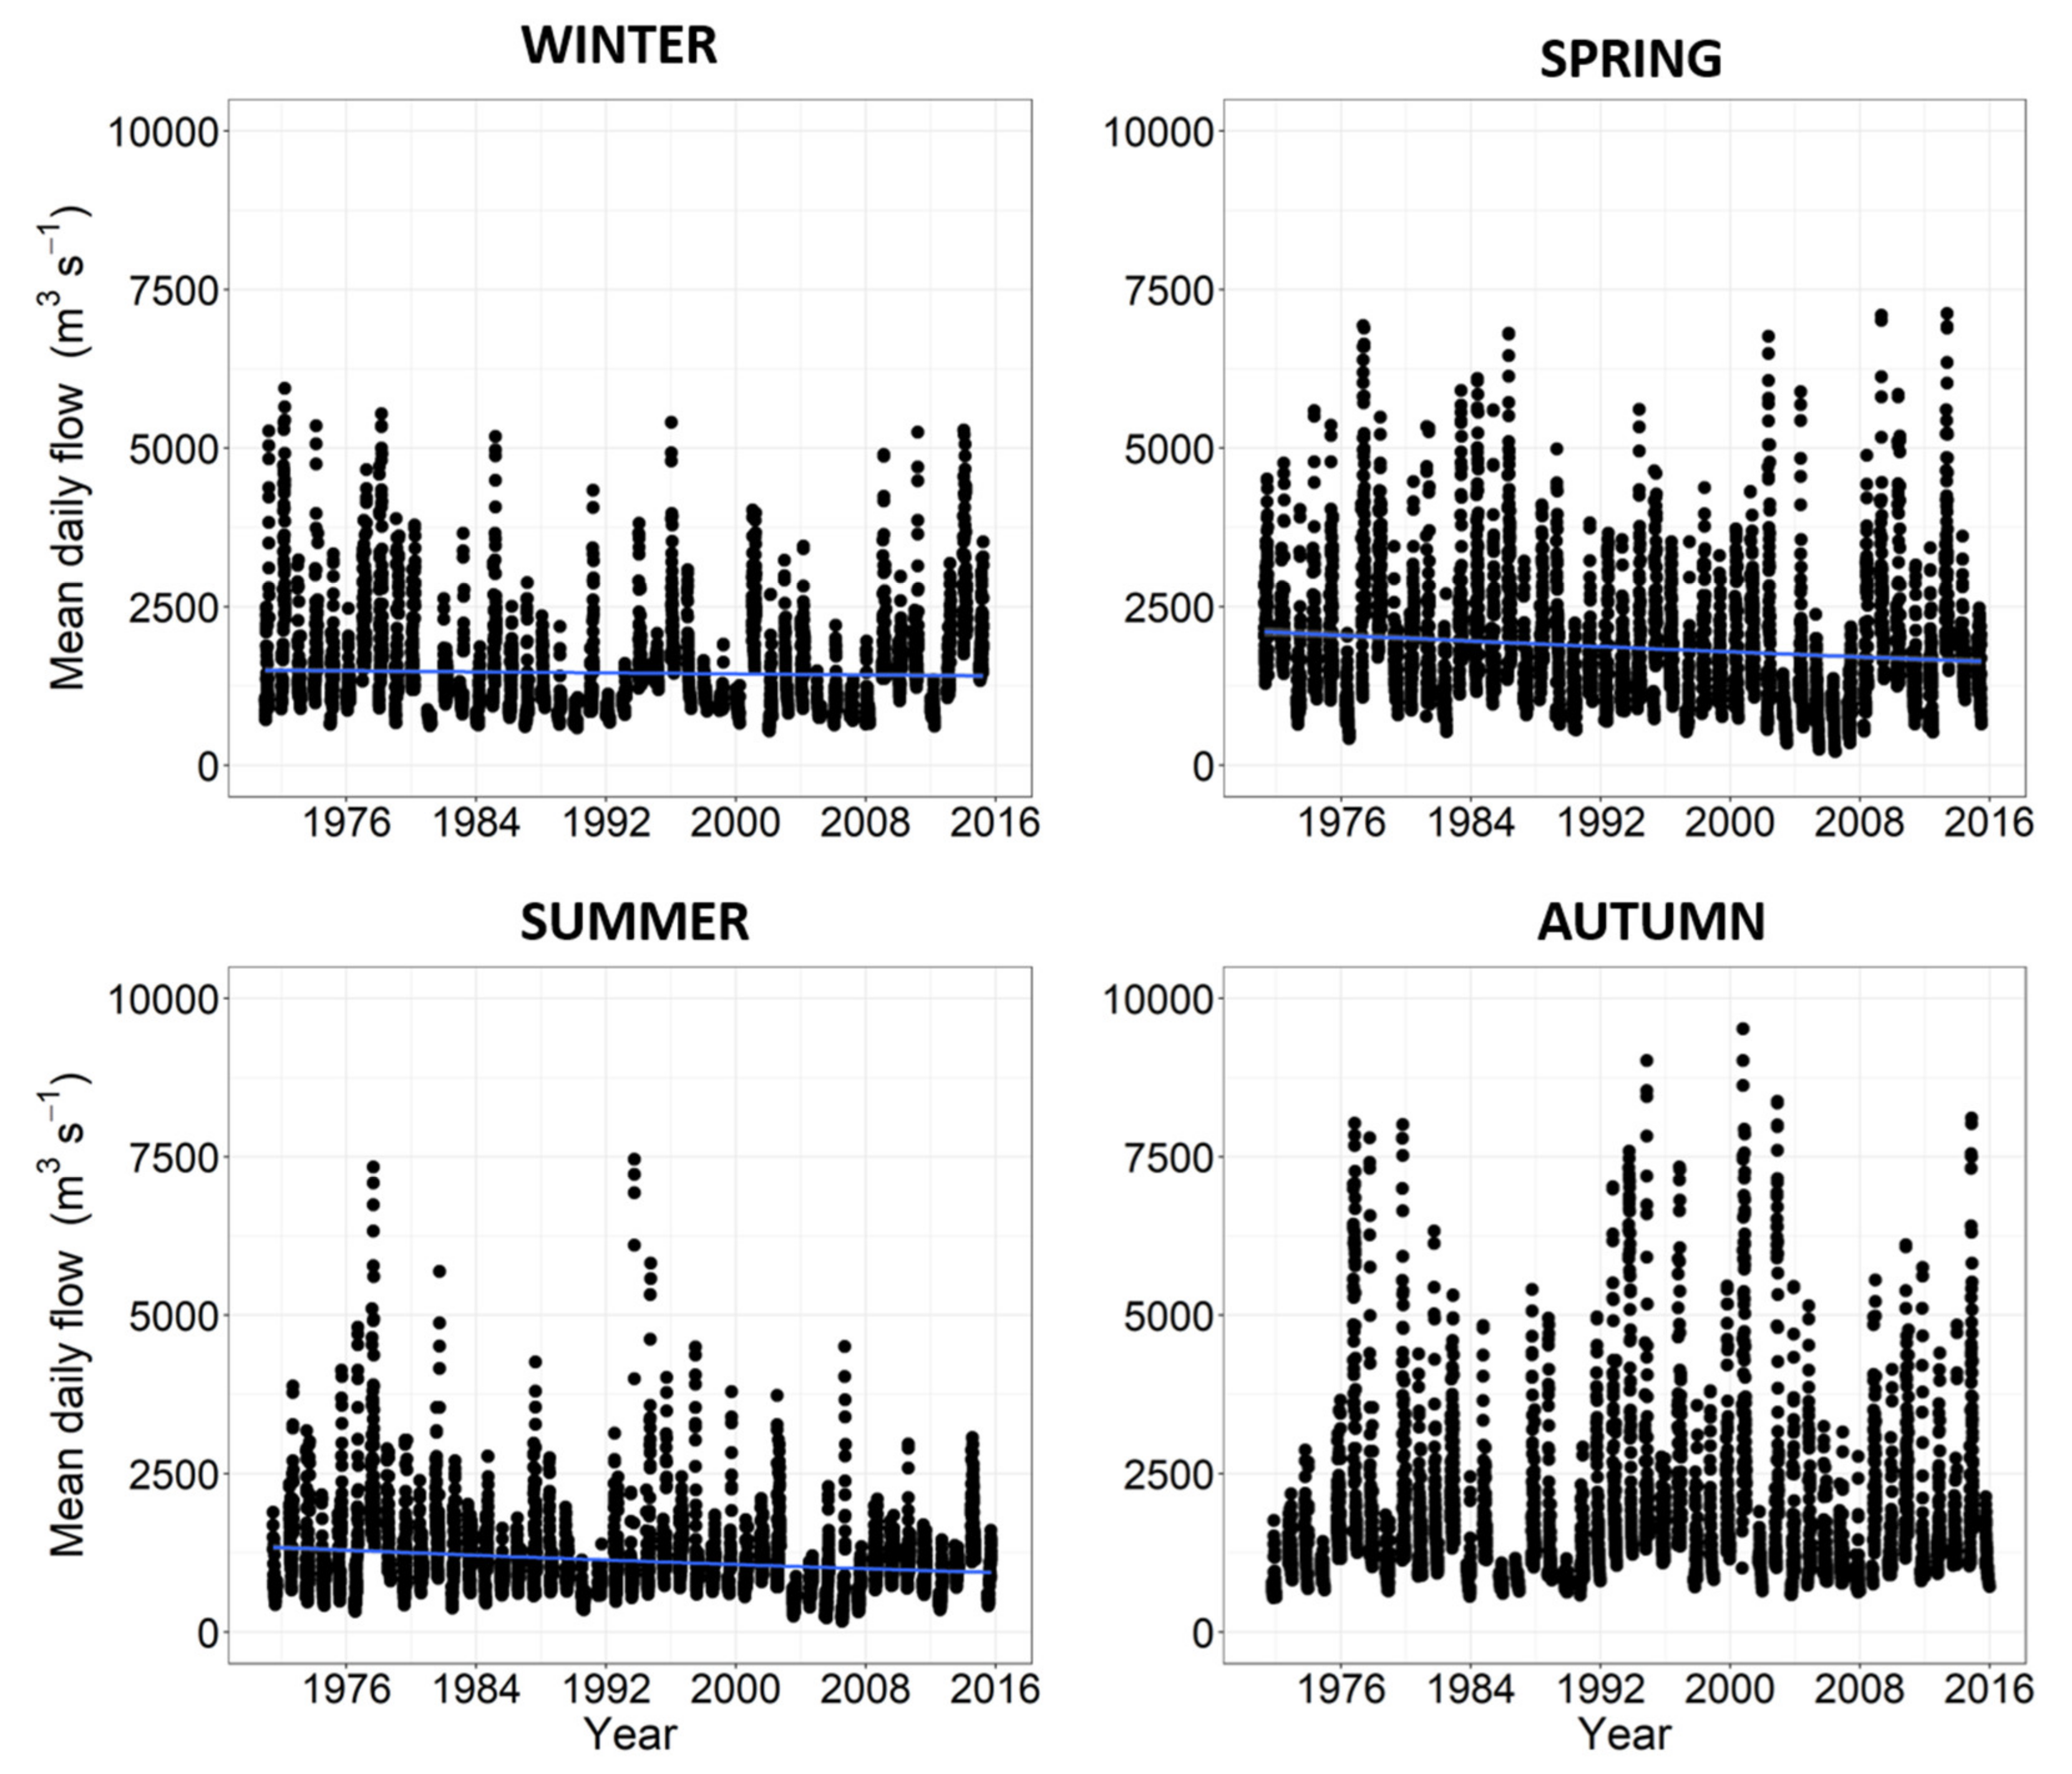
3.3. Freshwater and Nutrient Discharges by the Po River

The Po River discharge has a high seasonal and interannual variability with peaks in May, mainly due to snow melting, and in October-November, because of high precipitations [1,58,79]. In 1993–2015, mean seasonal flows oscillated from 1126 ± 12 m3 s−1 in summer to 1850 ± 24 m3 s−1 in winter (Table A1). Long-term trends of flows showed overall decreases in winter (−0.25%) spring (−0.70%) and summer (−0.89%) and the absence of significant trends in autumn (Figure 5). However, long-term series of the flow further indicated that the Po River has been subjected to a temporary phase of low regime in 2003–2007 followed by a phase of high and variable regime in 2010–2015.
The evolution of droughts and freshest of the Po River can be better highlighted calculating the frequency of “extremely” high (i.e., days with values higher than 90th percentile) and low (i.e., days with values lower than 10th percentile) flows in each season (Figure 6). Spring and autumn are seasons characterized by frequent high flows, contrary to summer that is the driest seasons. Over the considered time span, extreme flows also confirmed an important interannual variability: the period most affected by extreme droughts was 2003–2007, due to a complete collapse of spring peaks of river discharge and the occurrence of winter and autumn flows similar to summer discharges, in 2005.
This multiscale variability of river water loads interacts with the oceanographic conditions in the NAS. Generally, a temporal succession of two different hydrodynamic patterns is recognized on a seasonal base in this continental shelf. From November to March, the westernmost waters are strongly diluted by the Po River outflow, but they remain separated from the highly saline offshore waters. Therefore, a small plume is confined in the coastal areas, typically due to the effects of low discharges and/or E-NE wind events [66]. Nutrients, dissolved organic matter and particulate matter, coming from the land, remain more or less confined near the coast [79]. Instead, from April to October, warmer seawaters are diluted by the freshwater, generating in the upper layer a plume that covers a large portion of the NAS [90], depending on river discharges and on wind intensity [66].
The concentrations of inorganic nutrients in the Po River waters are characterized by a large excess of nitrogen compared to phosphorus, as well as by a large preponderance of NO3 in the dissolved inorganic nitrogen pool [64,65]. In the period of interest, NO3 concentration varied from 114 ± 4 µM to 209 ± 4 µM, whereas PO43− concentration varied from 1.76 ± 0.09 µM to 2.47 ± 0.09 µM (Table A1). During the driest years, considering the scarce contribution of the freshets to the total annual water load, the annual nitrogen load was low (72,000–156,000 t N year−1) and more dependent on the annual integrated water volume discharged by the Po River, with a contribution of the freshets to the annual nitrogen load between 11 and 27% [86]. In the most recent years, high flows were more frequent with, however, the occurrence of dry summers in 2012 and 2015. This high variability of the runoff has certainly increased the variability of nutrient discharges in the NAS.
Seasonal changes in land use and long-term improvements of environmental management practices have modulated nutrient availability and ratio in the drainage basin of the Po River. Viaroli et al. [64] thoroughly analyzed the relationships among human activities, anthropogenic pressures and nutrients loading in this river basin, highlighting how the timing and intensity of phosphorus (P) and dissolved inorganic nitrogen (DIN) loads from the Po River were strongly affected by the metabolic changes, which occurred within the whole hydrographic system. Nutrient transport by the Po River is due to rain-driven diffuse sources (20% for total nitrogen; TN, 20% for total phosphorus; TP), point sources (40% for TN, 80% for TP) and groundwater, springs and tributaries (40% for TN) [64,65,91]. The loadings of DIN and P exported by Po and smaller rivers that contribute to the overall flow, have impacted the NAS, triggering eutrophication processes whose extent depends also on circulation structure, as well as on short-term climatic fluctuations [7,10,26,41,76,92,93].
In 1993–2015, the trends of NO3 concentration in the Po River waters were negative in winter (−0.81% year−1), spring (−1.40% year−1) and autumn (−1.58% year−1), whereas those of PO43ˉ concentration were negative in summer (−2.02% year−1) and autumn (−1.65% year−1) (Figure 7, Table 3). The concentration measured in the 2010s were often lower than those measured in the 2000s, which was a particularly dry period, indicating that nutrient levels in the river environment can increase in conditions of low regime. The negative trend of NO3ˉ concentration in the Po River waters is not in disagreement with its increase in the surface coastal waters (Figure 4d), as the total river transport of NO3 increases more than PO43− transport in the periods of high runoff, causing overloads of nitrogen that are not utilized by marine phytoplankton. This feature is shown by the increase in NO3ˉ/PO43ˉ ratio in freshwater (14%; t-test p value = 0.048) compared to the previous period, a trend that is similar to that observed at sea.

3.4. Comparison of River and Coastal Data in 1971–2005 and 2006–2015

The daily flow of the Po River showed a decreasing trend in 1971–2005 and a recovery in 2006–2015 but, overall, the mean flow was 12% lower in the last period compared to the early period. This feature indicated that the events of high discharge observed in particular during autumn in the 1970s and in the 1990s were less frequent in the last decade (Figure 5). In more detail, the frequency of the days with extremely high or low flow rates showed significant differences at a seasonal scale, in these two periods (Table A2). In 1971–2005, high flows were more frequent in winter, late summer and autumn (1.3–10.5 days year−1), whereas they were more frequent from April to July (2.6–12.4 days year−1) in 2006–2015. Extremely low flows were more frequent in the early period than in the most recent one, with the exceptions of February, April, November and December. Kharin and Zwiers et al. [94] showed that increases in heavy short-time precipitations and the persistence of dry periods are basic features of the climate changes. In the drainage basin of the Po River, it was confirmed in the last decade that the decline in the frequency of large freshets in all the seasons except spring with, however, a lower occurrence of extreme droughts for most of the year. These seasonal changes of the runoff are combined to the interannual variability of river water discharge and they can have important consequence on the biogeochemical conditions and on the productivity of the NAS [65,95].
The analysis of marine data in the coastal waters (up to 4.5 miles) was also performed in these two periods, in order to better characterize the current availability of the nutrients in the areas most impacted by the runoff. The concentrations of NO3ˉ and SiO2 showed significant differences, contrary to PO43ˉ that showed similar levels. In particular, increases in NO3ˉ (70%) and SiO2 (26%) concentration were observed in the second period. This result confirms, on a large spatial scale, the analysis performed at the Senigallia transect (NAS) by Totti et al. [56]. As a result of these changes, the NO3ˉ/PO43ˉ ratio in the surface waters in the coastal sites of NW Adriatic Sea increased by ≈ 81% with respect to the early period (Figure 8), indicating that N/P imbalance is a characteristics of the coastal marine environment of NAS that persists also in the phases of high river water discharge.

4. Conclusions

Current climate change has increased the scientific interest in long-term data analyses and their importance is nowadays widely recognized on a political level. The spatial and temporal cover of the oceanographic data presented in this study clearly show how much they are critical for the analysis of trends in marine systems. From this point of view, EMODnet Chemistry data portal has been a relevant data source. However, this study also shows that EMODnet Chemistry datasets should be better integrated with corresponding physical parameters, in order to obtain a more comprehensive environmental information, as their upload in this database is not mandatory.
Based on a long-term data series (1971–2015), which covers a wider region of NAS compared to previous analyses, this study has outlined:
  • A positive trend of seawater temperature both in aggregated and seasonal data, which indicates A significant basin-scale warming of sea surface in this region;
  • The decline in annual water discharge of the Po River in 1971–2005 and its recovery in 2006–2015, a trend that had important effects on the current biogeochemical conditions in the NAS on a basin scale.
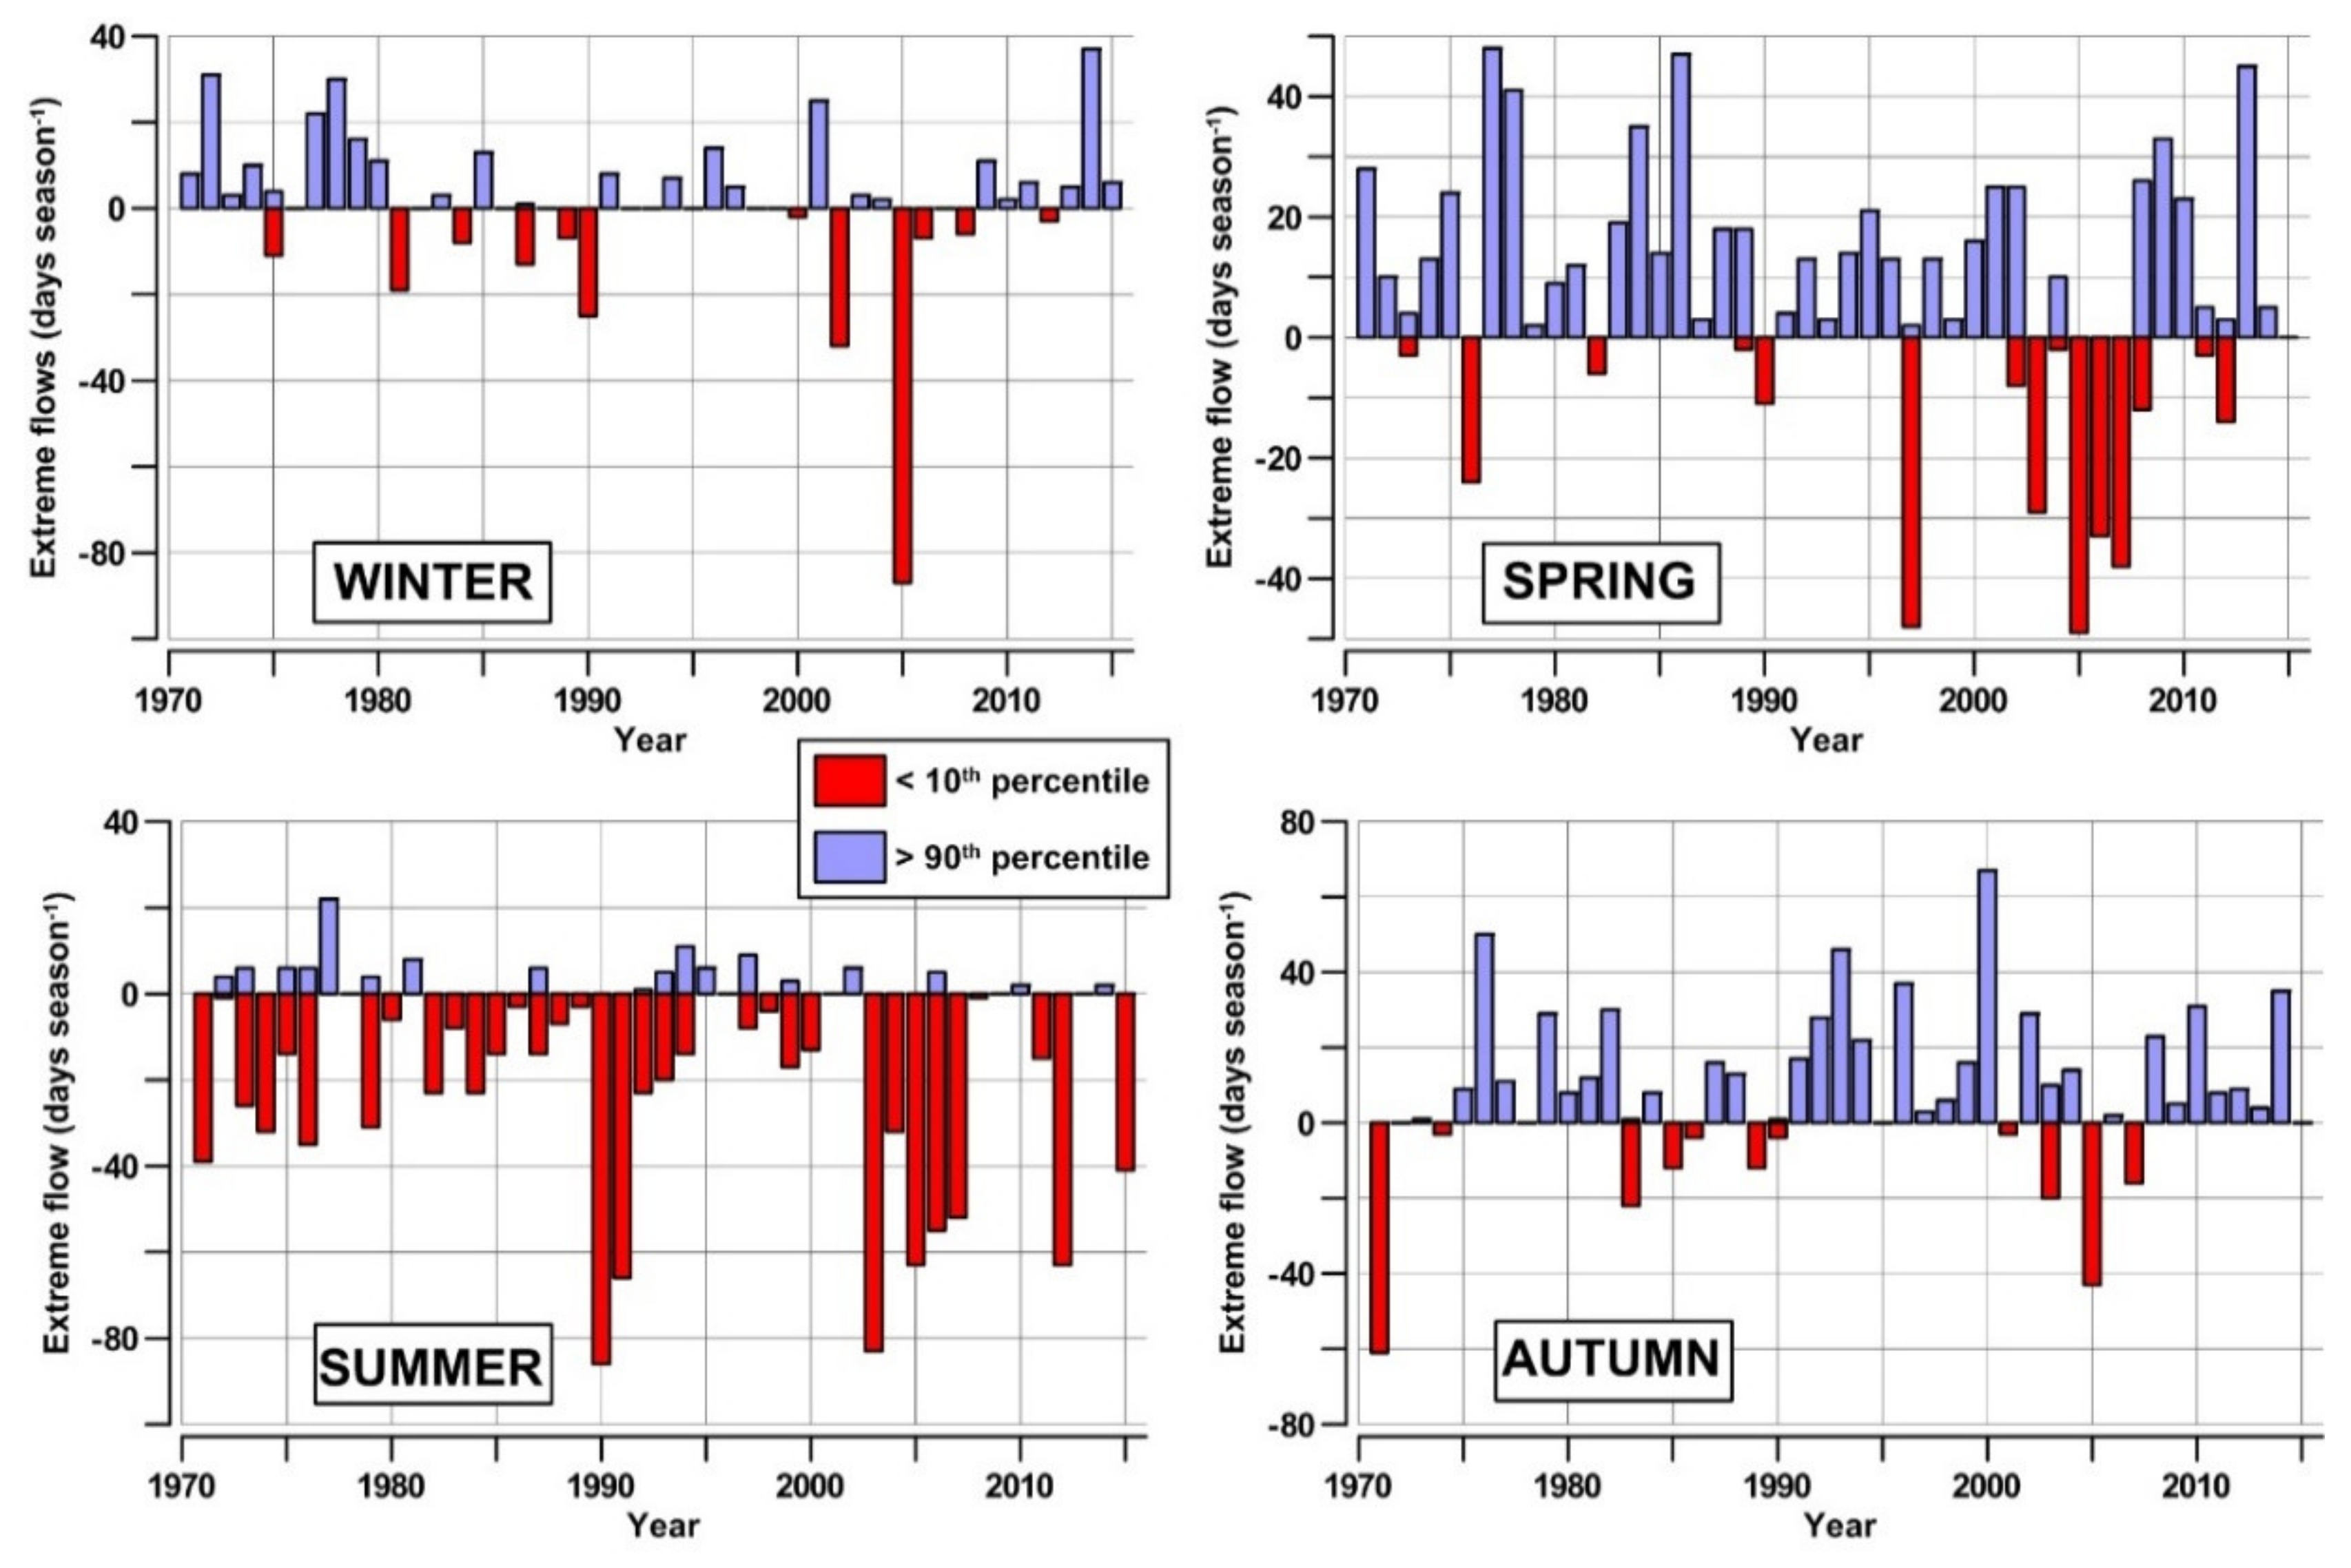
  • A significant positive trend of the salinity in aggregated data until 2007, with increases in spring and summer and a decrease in autumn, which agrees to the phase of low annual water discharges observed in 2003–2007 and to the seasonal changes of the frequency of the extreme high flows of the Po River in the same period;
  • An increase in the frequency of extremely high Po River discharges in spring and early summer during the last decade, which could change the annual availability of nutrients in the NAS;
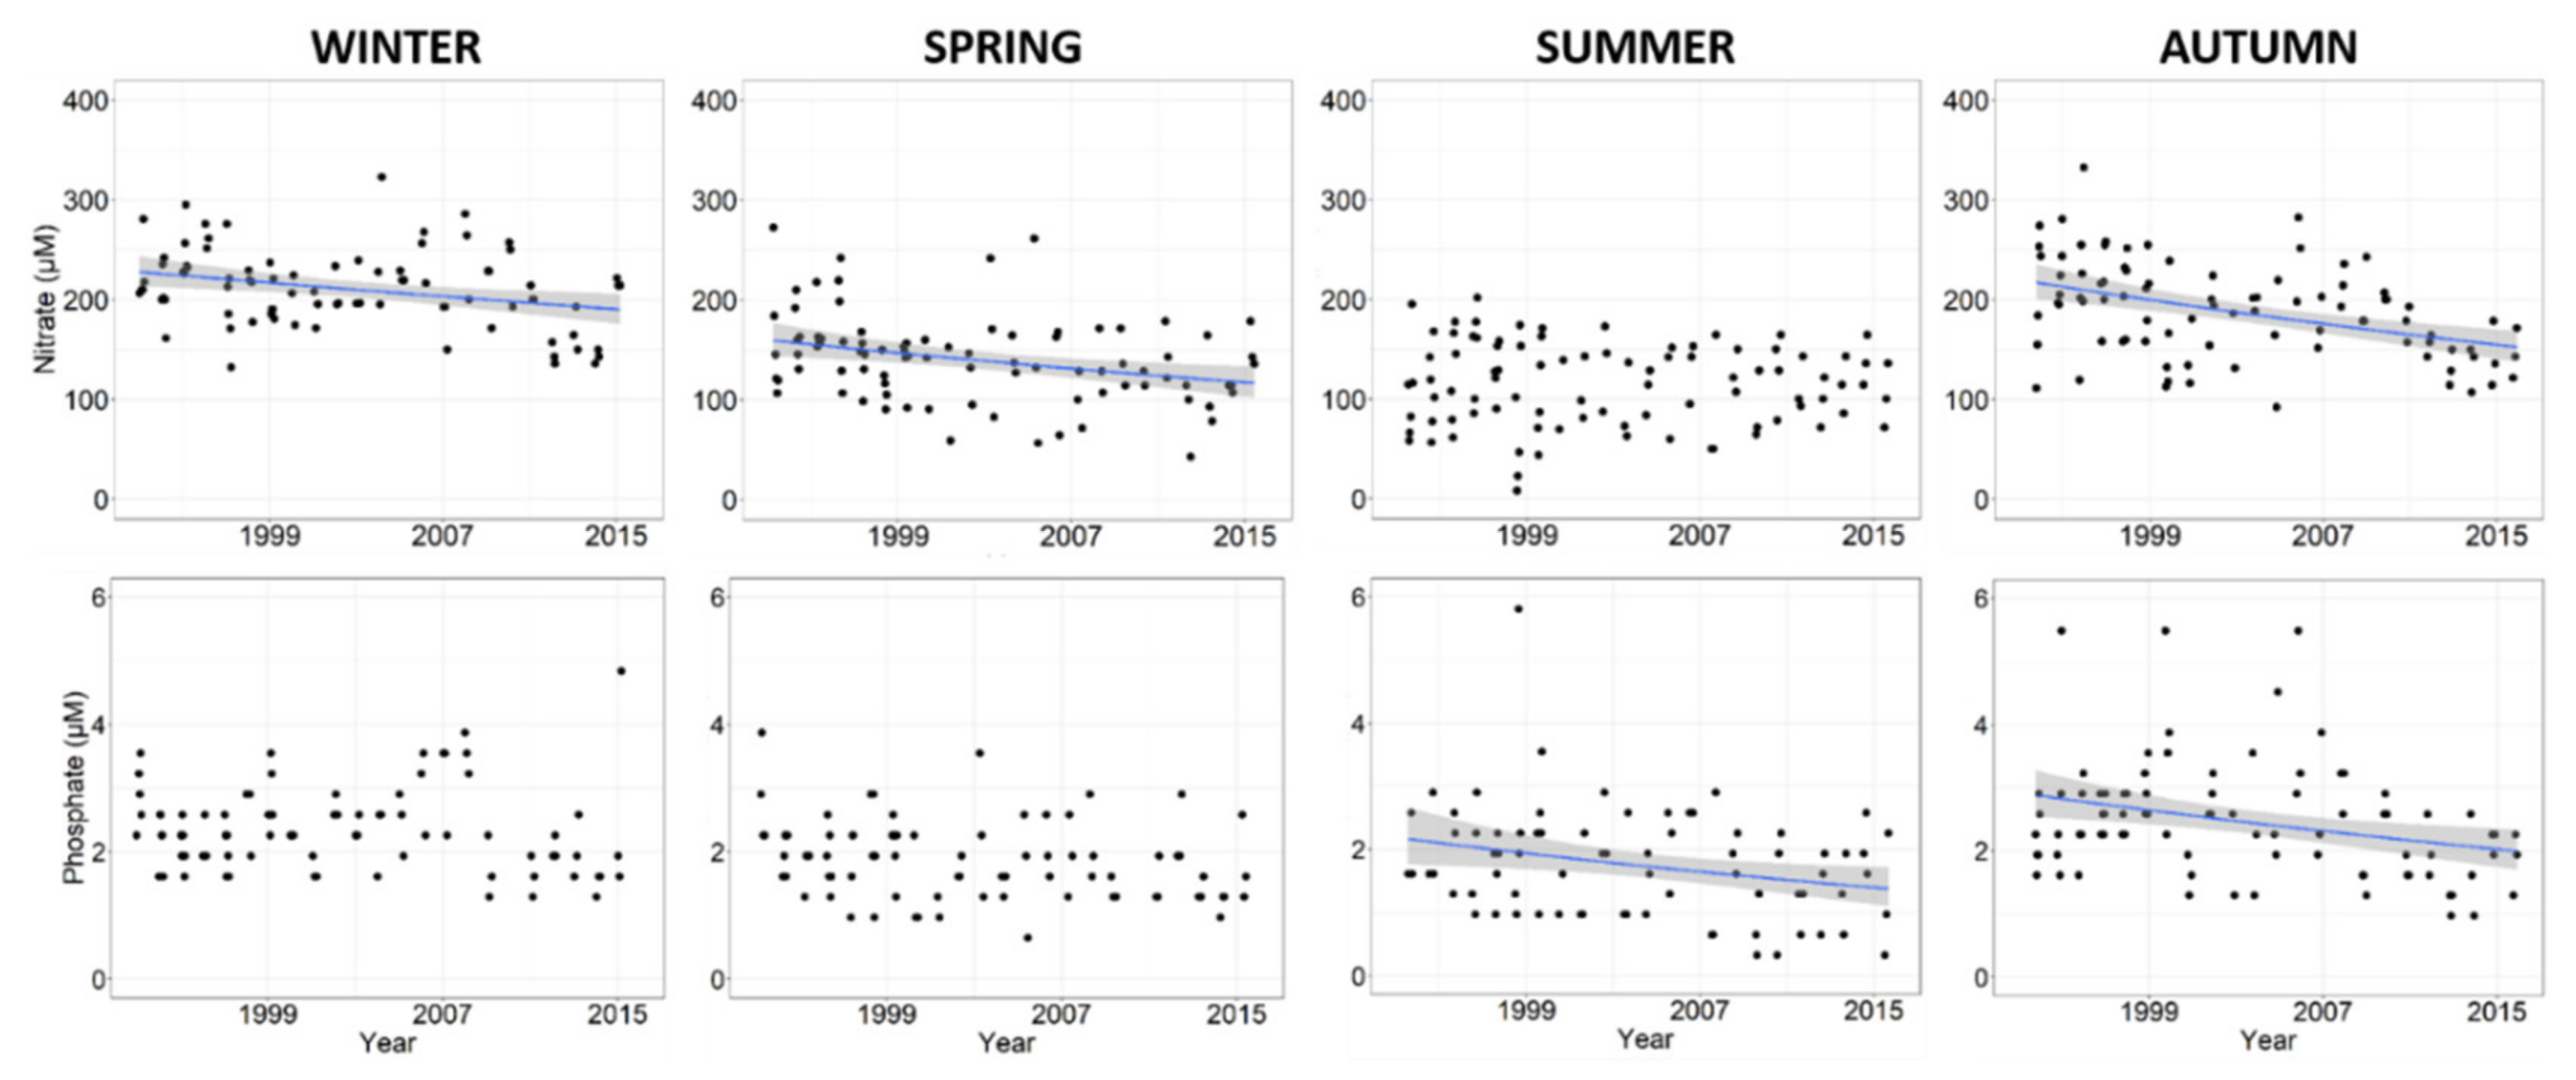
  • Low and constant PO43ˉ concentration in seawater in the aggregated data and a further reduction in summer, which indicates a persistent PO43ˉ deficiency in the NAS consequent to the improvement of the environmental management practices in river drainage basins;
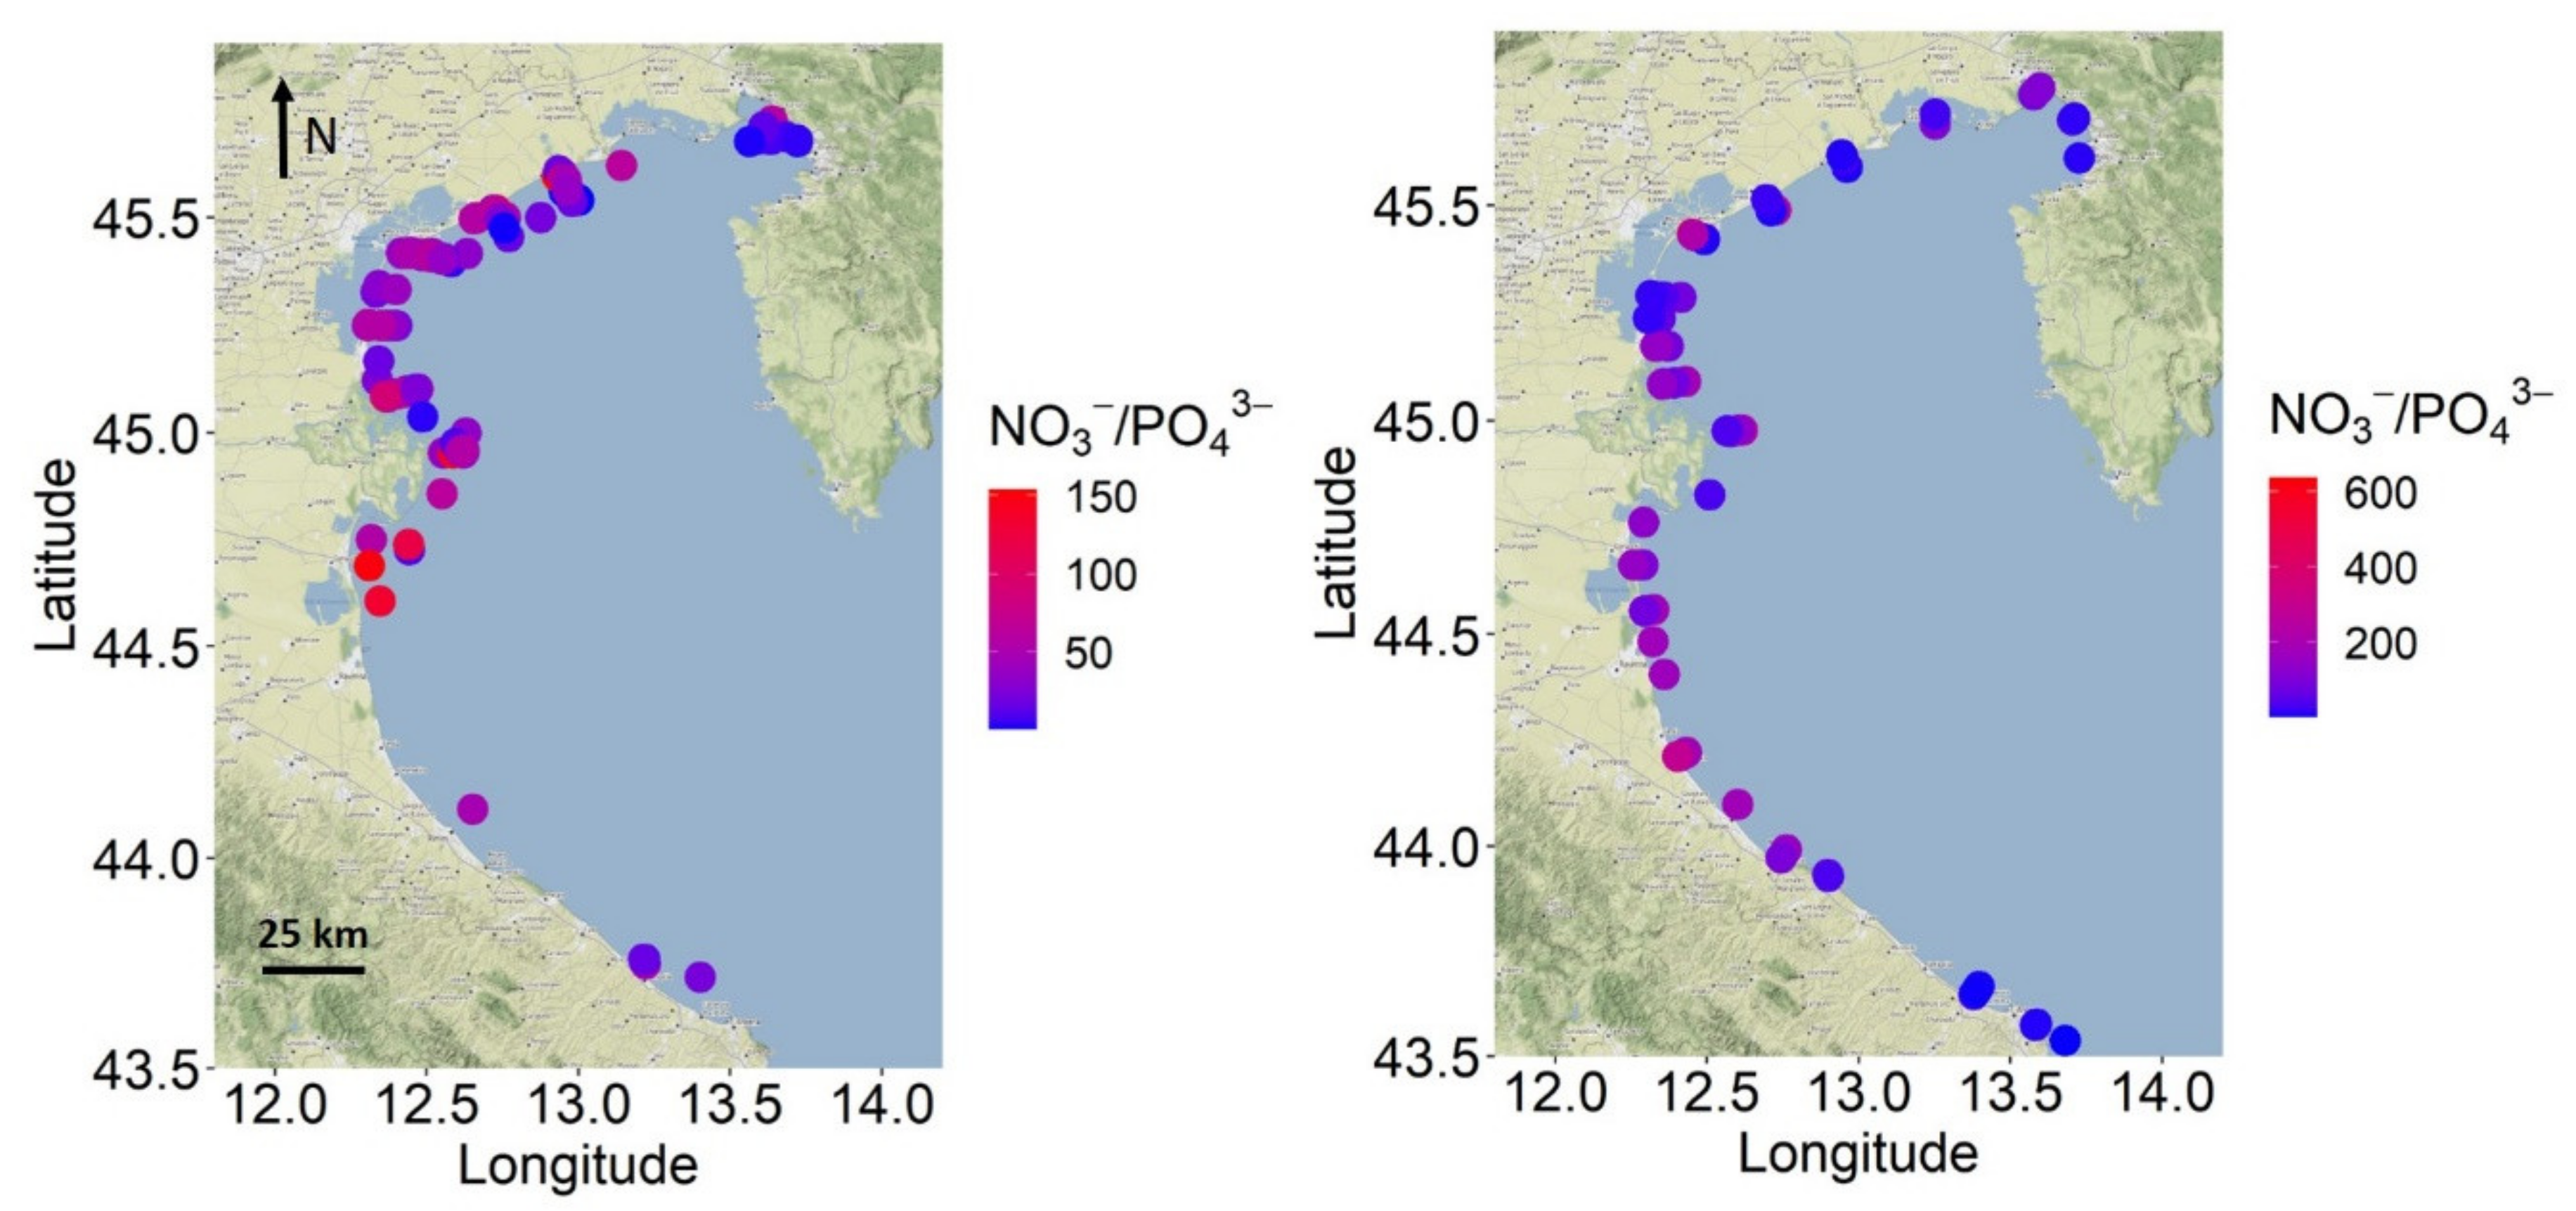
  • A significant positive trend of NO3ˉ concentrations in seawater in almost all seasons during the last decade, notwithstanding a decreasing trend of its concentration in the Po river water, which can be explained by the rise of NO3/PO43− ratio in river water and by an excess of NO3 in the marine environment that cannot be used by phytoplankton due to PO43− limitation;
  • A phase of instable environmental conditions in 2008–2015, characterized by highly variable river water discharges, high Chl-a, NO3 and SiO2 concentrations and high NO3ˉ/PO43ˉ ratios in surface waters, which suggests that the effects of the most recent climate changes should be better analyzed in this marine region;
  • The changes in nutrients dynamics, which indicates that the productivity of the NAS has been largely modulated in the last 40 years by the combination of river water discharges and human activities and that further changes have to be expected in the future, particularly in the case of a further reduction in anthropogenic phosphorus loads.

Author Contributions

Conceptualization, F.G. and M.M.; methodology, F.G., M.M. and S.G.; validation, F.G. and S.G.; investigation, F.G., S.A., F.A., F.B.A., C.B., M.C., A.C., M.G., S.G., M.M., F.N., A.P. (Antonella Penna), P.P., A.P. (Alessandra Pugnetti), M.R., F.R. (Francesco Riminucci), F.R. (Fabio Ricci), C.T., P.V. and S.C.; data curation, F.G., A.C., M.M., S.G. and S.C.; writing—original draft preparation, F.G., M.M. and S.G.; writing—review and editing, F.G., S.A., F.A., F.B.A., C.B., M.C., A.C., M.G., S.G., M.M., F.N., A.P. (Antonella Penna), P.P., A.P. (Alessandra Pugnetti), M.R., F.R. (Francesco Riminucci), F.R. (Fabio Ricci), C.T., P.V. and S.C..; supervision, F.G., M.M. and S.C. All authors have read and agreed to the published version of the manuscript.

Funding

This research received no external funding.

Acknowledgments

Data and metadata are provided by EMODnet Chemistry under the support of DG MARE Call for Tenders MARE/2008/03-lot3, MARE/2012/10-lot4 and EASME/EMFF/2016/006-lot4. The authors acknowledge the ARPAE-ER Regione Emilia Romagna (CTR Sistemi Idrici Direzione Tecnica) for suppling chemical data in Po river waters. The parent site Northern Adriatic Sea belongs to the Long Term Ecological Research national and international networks (LTER-Italy, LTER-Europe and ILTER).

Conflicts of Interest

The authors declare no conflict of interest. The funders had no role in the design of the study; in the collection, analyses, or interpretation of data; in the writing of the manuscript, or in the decision to publish the results.

Appendix A

Table A1. Statistics of seasonal values of flow rate (m3 s−1) and nitrate and phosphate concentrations (µM) in the Po River, in 1993–2015.
SeasonsWinterSpringSummerAutumn
Discharge (m3 s−1)
No. data2075209321162116
Mean1420183511261850
Standard Error13181224
Minimum542216168561
Maximum5540712074579517
Nitrate (µM)
No. data84879088
Mean209140114188
Standard Error4.24.44.34.9
Minimum12143892
Maximum323273202332
Phosphate (µM)
No. data81817587
Mean2.351.891.762.47
Standard Error0.070.060.090.09
Minimum1.290.640.320.97
Maximum4.843.875.815.48
Table A2. Number of days with extremely low (<10th percentile; 669 m3 s−1) and high (>90th percentile; 2830 m3 s−1) flows of the Po River in each month, in 1971–2005 and 2006–2015. The data are normalized for the length of the two periods.
MonthPeriodHigh
Day Year−1
Low
Day Year−1
PeriodHigh
Day Year−1
Low
Day Year−1
January1971–20052.81.92006–20151.21.3
February1971–20051.61.02006–20150.03.0
March1971–20051.53.32006–20150.42.4
April1971–20051.21.92006–20153.62.8
May1971–20051.48.22006–20152.68.0
June1971–20052.64.42006–20153.83.2
July1971–20057.30.62006–201512.40.0
August1971–200510.50.52006–20159.60.4
September1971–20052.41.82006–20150.70.5
October1971–20051.36.82006–20150.00.0
November1971–20051.24.72006–20151.26.8
December1971–20052.72.32006–20150.44.9

References

  1. Marini, M.; Jones, B.H.; Campanelli, A.; Grilli, F.; Lee, C.M. Seasonal variability and Po River plume influence on biochemical properties along western Adriatic coast. J. Geophys. Res. 2008, 113, 1–18. [Google Scholar] [CrossRef]
  2. Harley, C.D.G.; Hughes, A.R.; Hultgren, K.M.; Miner, B.G.; Sorte, C.J.B.; Thornber, C.S.; Rodriguez, L.F.; Tomanek, L.; Williams, S.L. The impacts of climate change in coastal marine systems. Ecol. Lett. 2006, 9, 228–241. [Google Scholar] [CrossRef] [Green Version]
  3. Kraus, R.; Grilli, F.; Supić, N.; Janeković, I.; Brailo, M.; Cara, M.; Cetinić, A.B.; Campanelli, A.; Cozzi, S.; D’Adamo, R.; et al. Oceanographic characteristics of the Adriatic Sea–Support to secondary HAOP spread through natural dispersal. Mar. Pollut. Bull. 2019, 147, 59–85. [Google Scholar] [CrossRef] [PubMed]
  4. Coll, M.; Piroddi, C.; Albouy, C.; Ben Rais Lasram, F.; Cheung, W.W.L.; Christensen, V.; Karpouzi, V.S.; Guilhaumon, F.; Mouillot, D.; Paleczny, M.; et al. The Mediterranean Sea under siege: Spatial overlap between marine biodiversity, cumulative threats and marine reserves. Glob. Ecol. Biogeogr. 2012, 21, 465–480. [Google Scholar] [CrossRef]
  5. Ramírez, F.; Coll, M.; Navarro, J.; Bustamante, J.; Green, A.J. Spatial congruence between multiple stressors in the Mediterranean Sea may reduce its resilience to climate impacts. Sci. Rep. 2018, 8, 14878. [Google Scholar] [CrossRef] [PubMed] [Green Version]
  6. Neumann, B.; Vafeidis, A.T.; Zimmermann, J.; Nicholls, R.J. Future coastal population growth and exposure to sea-level rise and coastal flooding—A global assessment. PLoS ONE 2015, 10, e0118571. [Google Scholar] [CrossRef]
  7. Penna, N.; Capellacci, S.; Ricci, F. The influence of the Po River discharge on phytoplankton bloom dynamics along the coastline of Pesaro (Italy) in the Adriatic Sea. Mar. Pollut. Bull. 2004, 48, 321–326. [Google Scholar] [CrossRef]
  8. Schiano, M.E.; Sparnocchia, S.; Cappa, C.; Bozzano, R. An analysis of the climate variability over the Mediterranean sea by means of the surface water vapour density. Int. J. Climatol. 2005, 25, 1731–1748. [Google Scholar] [CrossRef]
  9. Grbec, B.; Morović, M.; Beg Paklar, G.; Kušpilić, G.; Matijević, S.; Matić, F.; Gladan, Ž.N. The relationship between the atmospheric variability and productivity in the adriatic Sea area. J. Mar. Biol. Assoc. UK 2009, 89, 1549–1558. [Google Scholar] [CrossRef]
  10. Giani, M.; Djakovac, T.; Degobbis, D.; Cozzi, S.; Solidoro, C.; Umani, S.F. Recent changes in the marine ecosystems of the northern Adriatic Sea. Estuar. Coast. Shelf Sci. 2012, 115, 1–13. [Google Scholar] [CrossRef]
  11. Djakovac, T.; Supić, N.; Bernardi Aubry, F.; Degobbis, D.; Giani, M. Mechanisms of hypoxia frequency changes in the northern Adriatic Sea during the period 1972–2012. J. Mar. Syst. 2015, 141, 179–189. [Google Scholar] [CrossRef] [Green Version]
  12. Furlan, E.; Torresan, S.; Critto, A.; Lovato, T.; Solidoro, C.; Lazzari, P.; Marcomini, A. Cumulative Impact Index for the Adriatic Sea: Accounting for interactions among climate and anthropogenic pressures. Sci. Total Environ. 2019, 670, 379–397. [Google Scholar] [CrossRef] [PubMed]
  13. Grbec, B.; Dulčić, J.; Morović, M. Long-term changes in landings of small pelagic fish in the eastern Adriatic—Possible influence of climate oscillations over the Northern Hemisphere. Clim. Res. 2002, 20, 241–252. [Google Scholar] [CrossRef]
  14. Coll, M.; Santojanni, A.; Palomera, I.; Arneri, E. Ecosystem assessment of the North-Central Adriatic Sea: Towards a multivariate reference framework. Mar. Ecol. Prog. Ser. 2010, 417, 193–210. [Google Scholar] [CrossRef]
  15. Cabrini, M.; Cerino, F.; de Olazabal, A.; Di Poi, E.; Fabbro, C.; Fornasaro, D.; Goruppi, A.; Flander-Putrle, V.; Francé, J.; Gollasch, S.; et al. Potential transfer of aquatic organisms via ballast water with a particular focus on harmful and non-indigenous species: A survey from Adriatic ports. Mar. Pollut. Bull. 2019, 147, 16–35. [Google Scholar] [CrossRef] [PubMed]
  16. Marini, M.; Russo, A.; Paschini, E.; Grilli, F.; Campanelli, A. Short-term physical and chemical variations in the bottom water of middle Adriatic depressions. Clim. Res. 2006, 31, 227–237. [Google Scholar] [CrossRef]
  17. Lipizer, M.; Partescano, E.; Rabitti, A.; Giorgetti, A.; Crise, A. Qualified temperature, salinity and dissolved oxygen climatologies in a changing Adriatic Sea. Ocean Sci. 2014, 10, 771–797. [Google Scholar] [CrossRef] [Green Version]
  18. Scarascia, P.L.L. The relation between climate change in the Mediterranean region and global warming. Reg. Environ. Chang. 2018, 18, 1481–1493. [Google Scholar]
  19. García-Martínez, M.d.C.; Vargas-Yáñez, M.; Moya, F.; Santiago, R.; Muñoz, M.; Reul, A.; Ramírez, T.; Balbín, R. Average nutrient and chlorophyll distributions in the western Mediterranean: RADMED project. Oceanologia 2019, 61, 143–169. [Google Scholar] [CrossRef]
  20. Brunetti, M.; Maugeri, M.; Nanni, T. Changes in total precipitation, rainy days and extreme events in Northeastern Italy. Int. J. Climatol. 2001, 21, 861–871. [Google Scholar] [CrossRef]
  21. Alfieri, L.; Bisselink, B.; Dottori, F.; Naumann, G.; de Roo, A.; Salamon, P.; Wyser, K.; Feyen, L. Global projections of river flood risk in a warmer world. Earth’s Future 2017, 5, 171–182. [Google Scholar] [CrossRef]
  22. Zoppini, A.; Ademollo, N.; Bensi, M.; Berto, D.; Bongiorni, L.; Campanelli, A.; Casentini, B.; Patrolecco, L.; Amalfitano, S. Impact of a river flood on marine water quality and planktonic microbial communities. Estuar. Coast. Shelf Sci. 2019, 224, 62–72. [Google Scholar] [CrossRef]
  23. Brugnara, Y.; Brunetti, M.; Maugeri, M.; Nanni, T.; Simolo, C. High-resolution analysis of daily precipitation trends in the central Alps over the last century. Int. J. Climatol. 2012, 32, 1406–1422. [Google Scholar] [CrossRef]
  24. Lionello, P.; Abrantes, F.; Congedi, L.; Dulac, F.; Gacic, M.; Gomis, D.; Goodess, C.; Hoff, H.; Kutiel, H.; Luterbacher, J.; et al. Introduction: Mediterranean climate-background information. In The Climate of the Mediterranean Region: From the Past to the Future; Elsevier Inc.: Waltham, MA, USA, 2012. [Google Scholar]
  25. Ulbrich, U.; Xoplaki, E.; Dobricic, S.; García-Herrera, R.; Lionello, P.; Adani, M.; Baldi, M.; Barriopedro, D.; Coccimiglio, P.; Dalu, G.; et al. Past and Current Climate Changes in the Mediterranean Region. In Regional Assessment of Climate Change in the Mediterranean; Navarra, A., Tubiana, L., Eds.; Springer: Dordrecht, The Netherlands, 2013; pp. 9–52. ISBN 978-94-007-5780-6. [Google Scholar]
  26. Grilli, F.; Marini, M.; Degobbis, D.; Ferrari, C.R.; Fornasiero, P.; Russo, A.; Gismondi, M.; Djakovac, T.; Precali, R.; Simonetti, R. Circulation and horizontal fluxes in the northern Adriatic Sea in the period June 1999–July 2002. Part II: Nutrients transport. Sci. Total Environ. 2005, 353, 115–125. [Google Scholar] [CrossRef]
  27. Djakovac, T.; Degobbis, D.; Supić, N.; Precali, R. Marked reduction of eutrophication pressure in the northeastern Adriatic in the period 2000–2009. Estuar. Coast. Shelf Sci. 2012, 115, 25–32. [Google Scholar] [CrossRef]
  28. Morabito, G.; Mazzocchi, M.G.; Salmaso, N.; Zingone, A.; Bergami, C.; Flaim, G.; Accoroni, S.; Basset, A.; Bastianini, M.; Belmonte, G.; et al. Plankton dynamics across the freshwater, transitional and marine research sites of the LTER-Italy Network. Patterns, fluctuations, drivers. Sci. Total Environ. 2018, 627, 373–387. [Google Scholar] [CrossRef]
  29. Pirrone, N.; Trombino, G.; Cinnirella, S.; Algieri, A.; Bendoricchio, G.; Palmeri, L. The Driver-Pressure-State-Impact-Response (DPSIR) approach for integrated catchment-coastal zone management: Preliminary application to the Po catchment-Adriatic Sea coastal zone system. Reg. Environ. Chang. 2005, 5, 111–137. [Google Scholar] [CrossRef]
  30. Santojanni, A.; Arneri, E.; Bernardini, V.; Cingolani, N.; Di Marco, M.; Russo, A. Effects of environmental variables on recruitment of anchovy in the Adriatic Sea. Clim. Res. 2006, 31, 181–193. [Google Scholar] [CrossRef]
  31. Cheung, W.W.L.; Lam, V.W.Y.; Sarmiento, J.L.; Kearney, K.; Watson, R.; Pauly, D. Projecting global marine biodiversity impacts under climate change scenarios. Fish Fish. 2009, 10, 235–251. [Google Scholar] [CrossRef]
  32. Azzurro, E.; Moschella, P.; Maynou, F. Tracking signals of change in mediterranean fish diversity based on local ecological knowledge. PLoS ONE 2011, 6, e24885. [Google Scholar] [CrossRef] [Green Version]
  33. Albouy, C.; Guilhaumon, F.; Leprieur, F.; Lasram, F.B.R.; Somot, S.; Aznar, R.; Velez, L.; Le Loc’h, F.; Mouillot, D. Projected climate change and the changing biogeography of coastal Mediterranean fishes. J. Biogeogr. 2013, 40, 534–547. [Google Scholar] [CrossRef]
  34. Cozzi, S.; Giani, M. River water and nutrient discharges in the Northern Adriatic Sea: Current importance and long term changes. Cont. Shelf Res. 2011, 31, 1881–1893. [Google Scholar] [CrossRef]
  35. Tedesco, L.; Socal, G.; Bianchi, F.; Acri, F.; Veneri, D.; Vichi, M. NW Adriatic Sea biogeochemical variability in the last 20 years (1986–2005). Biogeosciences 2007, 4, 673–687. [Google Scholar] [CrossRef] [Green Version]
  36. Solidoro, C.; Bastianini, M.; Bandelj, V.; Codermatz, R.; Cossarini, G.; Canu, D.M.; Ravagnan, E.; Salon, S.; Trevisani, S. Current state, scales of variability, and trends of biogeochemical properties in the northern Adriatic Sea. J. Geophys. Res. Ocean. 2009, 114, 1–21. [Google Scholar] [CrossRef]
  37. Vilibić, I.; Zemunik, P.; Šepić, J.; Dunić, N.; Marzouk, O.; Mihanović, H.; Denamiel, C.; Precali, R.; Djakovac, T. Present climate trends and variability in thermohaline properties of the northern Adriatic shelf. Ocean Sci. 2019, 15, 1351–1362. [Google Scholar] [CrossRef] [Green Version]
  38. Artegiani, A.; Bregant, D.; Paschini, E.; Pinardi, N.; Raicich, F.; Russo, A. The Adriatic Sea General Circulation. Part I: Air–Sea Interactions and Water Mass Structure. J. Phys. Oceanogr. 1997, 27, 1492–1514. [Google Scholar] [CrossRef]
  39. Poulain, P.M.; Cushman-Roisin, B. Circulation. In Physical Oceanography of the Adriatic Sea; Cushman-Roisin, B., Gacic, M., Poulain, P.-M., Artegiani, A., Eds.; Kluwer Academic: Dordrecht, The Netherlands, 2001; pp. 67–109. ISBN 1-4020-0225-4. [Google Scholar]
  40. Orlic, M.; Gacic, M.; La Violette, P.E. The currents and circulation of the Adriatic Sea. Oceanol. Acta 1992, 15, 109–124. [Google Scholar]
  41. Grilli, F.; Marini, M.; Book, J.W.; Campanelli, A.; Paschini, E.; Russo, A. Flux of nutrients between the middle and southern Adriatic Sea (Gargano-Split Section). Mar. Chem. 2013, 153, 1–14. [Google Scholar] [CrossRef]
  42. Boldrin, A.; Carniel, S.; Giani, M.; Marini, M.; Bernardi Aubry, F.; Campanelli, A.; Grilli, F.; Russo, A. Effects of bora wind on physical and biogeochemical properties of stratified waters in the northern Adriatic. J. Geophys. Res. 2009, 114, C08S92. [Google Scholar] [CrossRef]
  43. Gačić, M.; Eusebi Borzelli, G.L.; Civitarese, G.; Cardin, V.; Yari, S. Can internal processes sustain reversals of the ocean upper circulation? The Ionian Sea example. Geophys. Res. Lett. 2010, 37, 1–5. [Google Scholar] [CrossRef]
  44. Gačić, M.; Civitarese, G.; Kovačcević, V.; Ursella, L.; Bensi, M.; Menna, M.; Cardin, V.; Poulain, P.M.; Cosoli, S.; Notarstefano, G.; et al. Extreme winter 2012 in the adriatic: An example of climatic effect on the biOS rhythm. Ocean Sci. 2014, 10, 513–522. [Google Scholar] [CrossRef] [Green Version]
  45. Zavatarelli, M.; Raicich, F.; Bregant, D.; Russo, A.; Artegiani, A. Climatological biogeochemical characteristics of the Adriatic Sea. J. Mar. Syst. 1998, 18, 227–263. [Google Scholar] [CrossRef]
  46. Kraus, R.; Supić, N. Impact of circulation on high phytoplankton blooms and fish catch in the northern Adriatic (1990–2004). Estuar. Coast. Shelf Sci. 2011, 91, 198–210. [Google Scholar] [CrossRef]
  47. Kraus, R.; Supic, N.; Precali, R. Factors favouring phytoplankton blooms in the northern Adriatic: Towards the northern Adriatic empirical ecological model. Ocean Sci. 2016, 12, 19–37. [Google Scholar] [CrossRef] [Green Version]
  48. Muelbert, J.H.; Nidzieko, N.J.; Acosta, A.T.R.; Beaulieu, S.E.; Bernardino, A.F.; Boikova, E.; Bornman, T.G.; Cataletto, B.; Deneudt, K.; Eliason, E.; et al. Ilter—The international long-term ecological research network as a platform for global coastal and ocean observation. Front. Mar. Sci. 2019, 6, 527. [Google Scholar] [CrossRef]
  49. Acri, F.; Bastianini, M.; Bernardi Aubry, F.; Camatti, E.; Boldrin, A.; Bergami, C.; Cassin, D.; De Lazzari, A.; Finotto, S.; Minelli, A.; et al. A long-term (1965–2015) ecological marine database from the LTER-Italy Northern Adriatic Sea site: Plankton and oceanographic observations. Earth Syst. Sci. Data 2020, 12, 215–230. [Google Scholar] [CrossRef] [Green Version]
  50. Kralj, M.; Lipizer, M.; Čermelj, B.; Celio, M.; Fabbro, C.; Brunetti, F.; Francé, J.; Mozetič, P.; Giani, M. Hypoxia and dissolved oxygen trends in the northeastern Adriatic Sea (Gulf of Trieste). Deep. Res. Part. II Top. Stud. Oceanogr. 2019, 164, 74–88. [Google Scholar] [CrossRef]
  51. Míguez, B.M.; Novellino, A.; Vinci, M.; Claus, S.; Calewaert, J.B.; Vallius, H.; Schmitt, T.; Pititto, A.; Giorgetti, A.; Askew, N.; et al. The European Marine Observation and Data Network (EMODnet): Visions and roles of the gateway to marine data in Europe. Front. Mar. Sci. 2019, 6, 313. [Google Scholar] [CrossRef] [Green Version]
  52. Giorgetti, A.; Partescano, E.; Barth, A.; Buga, L.; Gatti, J.; Giorgi, G.; Iona, A.; Lipizer, M.; Holdsworth, N.; Larsen, M.M.; et al. EMODnet Chemistry Spatial Data Infrastructure for marine observations and related information. Ocean Coast. Manag. 2018, 166, 9–17. [Google Scholar] [CrossRef]
  53. Ravaioli, M.; Bergami, C.; Riminucci, F.; Aracri, S.; Aliani, S.; Bastianini, M.; Bergamasco, A.; Bommarito, C.; Borghini, M.; Bozzano, R.; et al. The RITMARE Italian Fixed-Point Observatory Network (IFON) for marine environmental monitoring: A case study. J. Oper. Oceanogr. 2016, 9, s202–s214. [Google Scholar] [CrossRef] [Green Version]
  54. R Core Team. R: A Language and Environment for Statistical Computing; R Foundation for Statistical Computing: Vienna, Austria, 2019. [Google Scholar]
  55. Ofungwu, J. Statistical Applications for Environmental Analysis and Risk Assessment. Int. Stat. Rev. 2014, 82, 487–488. [Google Scholar]
  56. Totti, C.; Romagnoli, T.; Accoroni, S.; Coluccelli, A.; Pellegrini, M.; Campanelli, A.; Grilli, F.; Marini, M. Phytoplankton communities in the northwestern Adriatic Sea: Interdecadal variability over a 30-years period (1988–2016) and relationships with meteoclimatic drivers. J. Mar. Syst. 2019, 193, 137–153. [Google Scholar] [CrossRef]
  57. Campanelli, A.; Fornasiero, P.; Marini, M. Physical and chemical characterization of the water column in the Piceno coastal area (Adriatic sea). Fresenius Environ. Bull. 2004, 13, 430–435. [Google Scholar]
  58. Marini, M.; Campanelli, A.; Sanxhaku, M.; Zoran, K.; Mattia, B.; Grilli, F. Late spring characterization of different coastal areas of the Adriatic Sea. Acta Adriat. 2015, 56, 27–46. [Google Scholar]
  59. Specchiulli, A.; Bignami, F.; Marini, M.; Fabbrocini, A.; Scirocco, T.; Campanelli, A.; Penna, P.; Santucci, A.; Adamo, R.D. Estuarine, Coastal and Shelf Science The role of forcing agents on biogeochemical variability along the southwestern Adriatic coast: The Gulf of Manfredonia case study. Estuar. Coast. Shelf Sci. 2016, 183, 136–149. [Google Scholar] [CrossRef]
  60. Artegiani, A.; Bregant, D.; Paschini, E.; Pinardi, N.; Raicich, F.; Russo, A. The Adriatic Sea general circulation. Part II: Baroclinic circulation structure. J. Phys. Oceanogr. 1997, 27, 1515–1532. [Google Scholar] [CrossRef]
  61. Bergamasco, A.; Miro, G. Baroclinic Response of the Adriatic Sea to an Episode of Bora Wind. J. Phys. Oceanogr. 1996, 26, 1354–1369. [Google Scholar] [CrossRef] [Green Version]
  62. Kourafalou, V.H. River plume development in semi-enclosed Mediterranean regions: North Adriatic Sea and Northwestern Aegean Sea. J. Mar. Syst. 2001, 30, 181–205. [Google Scholar] [CrossRef]
  63. Bignami, F.; Sciarra, R.; Carniel, S.; Santoleri, R. Variability of Adriatic Sea coastal turbid waters from SeaWiFS imagery. J. Geophys. Res. Ocean. 2007, 112, 1–20. [Google Scholar] [CrossRef]
  64. Viaroli, P.; Soana, E.; Pecora, S.; Laini, A.; Naldi, M.; Fano, E.A.; Nizzoli, D. Space and time variations of watershed N and P budgets and their relationships with reactive N and P loadings in a heavily impacted river basin (Po River, Northern Italy). Sci. Total Environ. 2018, 639, 1574–1587. [Google Scholar] [CrossRef]
  65. Cozzi, S.; Ibáñez, C.; Lazar, L.; Raimbault, P.; Giani, M. Flow regime and nutrient-loading trends from the largest South European watersheds: Implications for the productivity of mediterranean and Black Sea’s Coastal Areas. Water (Switz.) 2019, 11, 1. [Google Scholar] [CrossRef] [Green Version]
  66. Falcieri, F.M.; Benetazzo, A.; Sclavo, M.; Russo, A.; Carniel, S. Po River plume pattern variability investigated from model data. Cont. Shelf Res. 2014, 87, 84–95. [Google Scholar] [CrossRef]
  67. Raicich, F.; Colucci, R.R. A near-surface sea temperature time series from Trieste, northern Adriatic Sea (1899–2015). Earth Syst. Sci. Data 2019, 11, 761–768. [Google Scholar] [CrossRef] [Green Version]
  68. Pisano, A.; Marullo, S.; Artale, V.; Falcini, F.; Yang, C.; Leonelli, F.E.; Santoleri, R.; Nardelli, B.B. New evidence of Mediterranean climate change and variability from Sea Surface Temperature observations. Remote Sens. 2020, 12, 132. [Google Scholar] [CrossRef] [Green Version]
  69. Russo, A.; Rabitti, S.; Bastianini, M. Decadal Climatic Anomalies in the Northern Adriatic Sea Inferred from a New Oceanographic Data Set. Mar. Ecol. 2002, 23, 340–351. [Google Scholar] [CrossRef]
  70. Brunetti, M.; Maugeri, M.; Monti, F.; Nanni, T. Temperature and precipitation variability in Italy in the last two centuries from homogenised instrumental time series. Int. J. Climatol. 2006, 26, 345–381. [Google Scholar] [CrossRef]
  71. Crespi, A.; Brunetti, M.; Lentini, G.; Maugeri, M. 1961–1990 high-resolution monthly precipitation climatologies for Italy. Int. J. Climatol. 2018, 38, 878–895. [Google Scholar] [CrossRef]
  72. Colella, S.; Falcini, F.; Rinaldi, E.; Sammartino, M.; Santoleri, R. Mediterranean ocean colour chlorophyll trends. PLoS ONE 2016, 11, e0155756. [Google Scholar] [CrossRef] [Green Version]
  73. Mélin, F.; Vantrepotte, V.; Clerici, M.; D’Alimonte, D.; Zibordi, G.; Berthon, J.F.; Canuti, E. Multi-sensor satellite time series of optical properties and chlorophyll-a concentration in the Adriatic Sea. Prog. Oceanogr. 2011, 91, 229–244. [Google Scholar] [CrossRef]
  74. Alvisi, F.; Cozzi, S. Seasonal dynamics and long-term trend of hypoxia in the coastal zone of Emilia Romagna (NW Adriatic Sea, Italy). Sci. Total Environ. 2016, 541, 1448–1462. [Google Scholar] [CrossRef]
  75. Kim, I.N.; Lee, K.; Gruber, N.; Karl, D.M.; Bullister, J.L.; Yang, S.; Kim, T.W. Increasing anthropogenic nitrogen in the North Pacific Ocean. Science 2014, 346, 1102–1106. [Google Scholar] [CrossRef] [PubMed]
  76. Degobbis, D.; Precali, R.; Ferrari, C.R.; Djakovac, T.; Rinaldi, A.; Ivančić, I.; Gismondi, M.; Smodlaka, N. Changes in nutrient concentrations and ratios during mucilage events in the period 1999–2002. Sci. Total Environ. 2005, 353, 103–114. [Google Scholar] [CrossRef] [PubMed]
  77. Palmeri, L.; Bendoricchio, G.; Artioli, Y. Modelling nutrient emissions from river systems and loads to the coastal zone: Po River case study, Italy. Ecol. Modell. 2005, 184, 37–53. [Google Scholar] [CrossRef]
  78. Giani, M.; Cozzi, S.; Tartari, G. Tendenze dei carichi di nutrienti riversati dal fiume Po nel Mare Adriatico. Biol. Mar. Mediterr. 2018, 25, 23–26. [Google Scholar]
  79. Campanelli, A.; Grilli, F.; Paschini, E.; Marini, M. The influence of an exceptional Po River flood on the physical and chemical oceanographic properties of the Adriatic Sea. Dyn. Atmos. Ocean. 2011, 52, 284–297. [Google Scholar] [CrossRef]
  80. Raymond, F.; Ullmann, A.; Camberlin, P. Précipitations intenses sur le Bassin Méditerranéen: Quelles tendances entre 1950 et 2013 ? Intense rainfalls in the Mediterranean Basin: Which trends between 1950 and 2013? Cybergeo 2016, 1–17. [Google Scholar] [CrossRef]
  81. Haylock, M.R.; Peterson, T.C.; Alves, L.M.; Ambrizzi, T.; Anunciação, Y.M.T.; Baez, J.; Barros, V.R.; Berlato, M.A.; Bidegain, M.; Coronel, G.; et al. Trends in total and extreme South American rainfall in 1960–2000 and links with sea surface temperature. J. Clim. 2006, 19, 1490–1512. [Google Scholar] [CrossRef]
  82. Groisman, P.Y.; Knight, R.W.; Karl, T.R.; Easterling, D.R.; Sun, B.; Lawrimore, J.H. Contemporary changes of the hydrological cycle over the contiguous United States: Trends derived from in situ observations. J. Hydrometeorol. 2004, 5, 64–85. [Google Scholar] [CrossRef] [Green Version]
  83. Higgins, R.W.; Silva, V.B.S.; Shi, W.; Larson, J. Relationships between climate variability and fluctuations in daily precipitation over the United States. J. Clim. 2007, 20, 3561–3579. [Google Scholar] [CrossRef]
  84. Klein Tank, A.M.G.; Können, G.P. Trends in indices of daily temperature and precipitations extremes in Morocco. J. Clim. 2003, 16, 3665–3680. [Google Scholar] [CrossRef]
  85. IPCC. Climate Change 2007: The Physical Science Basis. Contribution of Working Group I to the Fourth Assessment Report of the Intergovernmental Panel on Climate Change; Solomon, S., Qin, D., Manning, M., Chen, Z., Marquis, M., Averyt, K.B., Tignor, M., Miller, H.L., Eds.; Cambridge University Press: Cambridge, UK; New York, NY, USA, 2007. [Google Scholar]
  86. Naldi, M.; Pierobon, E.; Tornatore, F.; Viaroli, P. Il ruolo degli eventi di piena nella formazione e distribuzione temporale dei carichi di fosforo e azoto nel fiume Po. Biol. Ambient. 2010, 24, 59–69. [Google Scholar]
  87. Zoboli, O.; Viglione, A.; Rechberger, H.; Zessner, M. Impact of reduced anthropogenic emissions and century flood on the phosphorus stock, concentrations and stocks in the Upper Danube. Sci. Total Environ. 2015, 518, 117–129. [Google Scholar] [CrossRef] [PubMed] [Green Version]
  88. Mozetič, P.; Solidoro, C.; Cossarini, G.; Socal, G.; Precali, R.; Francé, J.; Bianchi, F.; De Vittor, C.; Smodlaka, N.; Fonda Umani, S. Recent trends towards oligotrophication of the northern adriatic: Evidence from chlorophyll a time series. Estuaries Coasts 2010, 33, 362–375. [Google Scholar] [CrossRef] [Green Version]
  89. Braga, F.; Zaggia, L.; Bellafiore, D.; Bresciani, M.; Giardino, C.; Lorenzetti, G.; Maicu, F.; Manzo, C.; Riminucci, F.; Ravaioli, M.; et al. Mapping turbidity patterns in the Po river prodelta using multi-temporal Landsat 8 imagery. Estuar. Coast. Shelf Sci. 2017, 198, 555–567. [Google Scholar] [CrossRef]
  90. Grilli, F.; Paschini, E.; Precali, R.; Russo, A.; Supić, N. Circulation and horizontal fluxes in the northern Adriatic Sea in the period June 1999–July 2002. Part I: Geostrophic circulation and current measurement. Sci. Total Environ. 2005, 353, 57–67. [Google Scholar] [CrossRef]
  91. Copetti, D.; Carniato, L.; Crise, A.; Guyennon, N.; Palmeri, L.; Pisacane, G.; Struglia, M.V.; Gianni, T. Impacts of Climate Change on Water Quality. In Regional Assessment of Climate Change in the Mediterranean. Advances in Global Change Research; Navarra, A., Tubiana, L., Eds.; Springer: Dordrecht, The Netherlands, 2013; Volume 50, pp. 307–332. ISBN 978-94-007-5780-6. [Google Scholar]
  92. Bernardi Aubry, F.; Berton, A.; Bastianini, M.; Socal, G.; Acri, F. Phytoplankton succession in a coastal area of the NW Adriatic, over a 10-year sampling period (1990–1999). Cont. Shelf Res. 2004, 24, 97–115. [Google Scholar] [CrossRef]
  93. Fonda Umani, S.; Milani, L.; Borme, D.; De Olazabal, A.; Parlato, S.; Precali, R.; Kraus, R.; Lučić, D.; Njire, J.; Totti, C.; et al. Inter-annual variations of planktonic food webs in the northern Adriatic Sea. Sci. Total Environ. 2005, 353, 218–231. [Google Scholar] [CrossRef]
  94. Kharin, V.V.; Zwiers, F.W. Changes in the extremes in an ensemble of transient climate simulations with a coupled atmosphere-ocean GCM. J. Clim. 2000, 13, 3760–3788. [Google Scholar] [CrossRef]
  95. Zanchettin, D.; Rubino, A.; Traverso, P.; Tomasino, M. Impact of variations in solar activity on hydrological decadal patterns in northern Italy. J. Geophys. Res. Atmos. 2008, 113, 1–12. [Google Scholar] [CrossRef] [Green Version]
Figure 1. Geographical distribution of sampling stations and number of stations per year (inset) collected from 1971 to 2015.
Water 12 02280 g001
Figure 2. Surface seasonal patterns of (a) seawater temperature (°C), (b) salinity, (c) chlorophyll-a (µg L−1), (d) nitrate (µM), (e) phosphate (µM) and (f) silicate concentrations (µM).
Water 12 02280 g002
Figure 3. Trends of the aggregated data of (a) temperature (°C), (b) salinity, (c) chlorophyll-a (µg L−1), (d) nitrate (µM), (e) phosphate (µM) and (f) silicate (µM) at the surface, in 1971–2015. The blue line represents the long-term trend with the 95% confidence limits (gray range). When the slope was not significant (p-value > 0.05), the long-trend regression was not reported.
Water 12 02280 g003
Figure 4. Seasonal surface trends of (a) temperature (°C), (b) salinity, (c) chlorophyll-a (µg L−1), (d) nitrate (µM), (e) phosphate (µM) and (f) silicate (µM) from 1971 to 2015. The blue line represents the long-term trend with the 95% confidence limits (gray range). When the slope was not significant (p-value > 0.05), the long-trend line was not reported.
Water 12 02280 g004
Figure 5. Seasonal trends of the daily Po River discharge (m3 s−1). The blue line represents the log-term regression. When the slope was not significant (p-value > 0.05), the long-trend line was not reported. Data from the Pontelagoscuro station provided by the Servizio Idro-Meteo-Clima of Agenzia Regionale per la Protezione dell’Ambiente of the Emilia Romagna Region (ARPAE-ER).
Water 12 02280 g005
Figure 6. Number of days per season (days season−1) with extremely low (<10th percentile) and high (>90th percentile) flow of the Po River in 1971–2015.
Water 12 02280 g006
Figure 7. Seasonal surface trends of nitrate and phosphate concentrations in the Po River from 1993 to 2015. The blue line represents the long-term trend with the 95% confidence limits (gray range). When the slope was not significant (p-value > 0.05), the long-trend line was not reported. Data from the Pontelagoscuro station provided by the ARPAE-ER.
Water 12 02280 g007
Figure 8. Distribution of nitrate/phosphate ratio within 4.5 miles for the period 1971–2005 (left) and 2006–2015 (right).
Water 12 02280 g008
Table 1. Statistics of the seasonal dataset in seawater of temperature (°C), salinity, chlorophyll-a (µg L−1), nitrate (µM), phosphate (µM) and silicate (µM).
SeasonsWinterSpringSummerAutumn
Temperature (°C)
No. data6157891183907
Mean10.518.824.2413.67
Standard Error0.120.130.050.13
Minimum4.381019.775.15
Maximum2328.0829.0327.7
Salinity
No. data6027051131844
Mean36.0534.4734.5135.73
Standard Error0.110.110.080.11
Minimum24.0724.2324.118.58
Maximum38.6838.838.638.66
Chlorophyll-a (µg L−1)
No. data173309479460
Mean1.842.391.781.91
Standard Error0.160.150.110.11
Minimum0.10.050.050.05
Maximum13.3317.6914.3919.79
Nitrate (µM)
No. data364490987584
Mean5.834.891.556.44
Standard Error0.660.50.120.64
Minimum0.020.020.020.02
Maximum132.5142.345.4181.25
Phosphate (µM)
No. data428608969674
Mean0.090.120.090.16
Standard Error0.010.010.010.01
Minimum0.030.030.030.03
Maximum2.161.451.361.6
Silicate (µM)
No. data4245861044668
Mean4.865.842.637.71
Standard Error0.350.370.180.39
Minimum0.020.020.020.02
Maximum73.7767.359.585.81
Table 2. Variation (% year−1) of temperature (°C), salinity, chlorophyll-a (µg L−1), nitrate (µM), phosphate (µM) and silicate (µM) as estimated by Generalized Linear Model (GLM) regression. ns: variation not significant.
ParameterVariation (% Year−1)
Aggregated DataWinterSpringSummerAutumn
Temperature (°C)+0.36+2.98+0.27+0.14+0.57
Salinity+0.086ns+0.24+0.39−0.26
Chlorophyll-a (µg L−1)nsns+2.41ns−1.34
Nitrate (µM)+3.80+0.011+2.71ns+5.91
Phosphate (µM)nsnsns−2.56ns
Silicate (µM)nsnsns−2.25+1.26
Table 3. Variation (% year−1) of nitrate (µM) and phosphate (µM) in Po River flow as estimated by GLM regression. ns: variation not significant.
ParameterVariation (% Year−1)
Aggregated DataWinterSpringSummerAutumn
Nitrate (µM)−1.02−0.81−1.40ns−1.58
Phosphate (µM)−1.34nsns−2.02−1.65

