Abstract
The importance of habitat factors in designing marine reserves and evaluating their performance over time has been regularly documented. Over three biennial sampling periods, we examined the effects of vegetated coverage and habitat diversity (i.e., patchiness) on fish density, community composition, and species-specific patterns along a gradient of protection from harvest in the shallow Spanish southern Mediterranean, including portions of the Tabarca marine reserve. With the exception of two herbivores (Sarpa salpa and Symphodus tinca), vegetated cover did not significantly affect fish densities, while habitat diversity was an influential factor across all three sampling periods. Overall, fish density was more positively associated with more continuous vegetated or unvegetated habitats, and was greatest in areas of highest protection (Tabarca II – Isla Nao site). These patterns were usually observed for four abundant fish species (Boops boops, Chromis chromis, Oblada melanura, and S. salpa). Fish community composition was distinct in the most protected portion of the Tabarca reserve, where it was also most stable. Our findings align with previous investigations of the Tabarca reserve and its surrounding areas, and demonstrate its continued effectiveness in conserving fish biomass and habitat. Together with effective management, marine reserves can facilitate greater species abundance, more stable biological communities, and resilient ecosystems.
1. Introduction
Marine reserves can be effective for conserving marine species, enhancing fishery populations, and protecting essential habitats [1,2,3,4,5,6,7,8,9]. Recovery of multiple targeted and protected species has been observed through regulated spatial management practices, with additional benefits extending to marine communities within protected areas [8,9,10,11,12,13,14,15]. Recent investigations have examined the effects of habitat complexity, continuity, and distribution on marine community composition, including their effects on the recovery of overfished species [16,17,18,19,20,21,22]. Additionally, the quality and connectivity of marine habitats are critical factors in determining ecosystem functioning, maintaining biodiversity, and can affect fishery stock status [22,23,24,25,26,27]. These factors are especially important, as human and climate-related stressors continue to influence the extent, health, and composition of protected marine ecosystems and their habitats [3,20,21,22,25,28,29,30,31,32].
Limitations of reserve design in the recovery of impacted marine ecosystems [2,33,34,35,36,37,38,39,40], including habitat-related effects on reserve spillover potential [41,42,43,44,45], and delayed responses of populations to protection, have been identified. Some investigations have found no significant difference in response variables within and outside marine protected areas (MPAs) [46,47,48,49,50,51,52], only partial predatory biomass buildup as a result of longer generation times, larger associated territories, and species-specific traits [2,7,8,11,53,54,55], as well as varying cascading effects to multiple trophic levels in marine reserves [55,56,57,58,59,60,61]. These studies illustrate the importance of scale as it affects reserve performance [2,46,50]. Of particular relevance has been the degree of protection afforded to the habitat of a given species, its structural complexity, and differential vulnerability of species to harvest and anthropogenic effects among habitats in reserve design [2,3,19,20,21,22,23,24,25,26,27,41,42,43,44,53,55]. Therefore, continued investigation of the effects of habitat as related to the effectiveness of MPAs remains a priority, particularly in coastal and nearshore areas subject to high human pressures [62,63,64,65].
In the Mediterranean, multiple investigations have demonstrated the effectiveness of marine reserves and habitat factors for increasing depleted fishery biomass and conserving biodiversity, including their influences on spillover potential and their differential effects on ecologically important species [20,41,42,43,44,65,66,67,68,69,70,71]. Demersal fishes, in particular, are greatly affected by the quantity and quality of habitat encompassed in Mediterranean protected areas, given their strong site fidelities [41,42,43,44,66,67,68,69,70,71,72]. Recommendations to assess reserve-protective effects with those from habitat through multiscale spatial-integrated approaches have also emerged [73,74,75,76,77], especially for evaluating responses of reef and seagrass-associated fish assemblages—the abundances of which have been affected by overfishing and habitat degradation [17,20,21,22,23,25,27,75,76,77]. These spatial factors have been partially considered in previous evaluations of the Tabarca marine reserve in southeast Spain, where some positive responses by fish populations and marine communities have been observed, and spillover gradients developed in relation to the degree of protection and habitat distributions [41,42,43,44,67,68,69,72]. Many of these investigations have taken place within deeper or limited portions of the reserve, with only partial consideration of habitat patchiness and vegetated coverage in shallower locations more frequently affected by human use [41,42,43,44,67,68,69,72]. They have also been mostly conducted within and immediately surrounding the reserve during single-snapshot surveys, or with trends examined over short timeframes. Thus, continued studies in shallower, more regularly accessible portions of the Tabarca reserve and its nearby surrounding areas are warranted for additional evaluation of its effectiveness. Additionally, while previous studies have highlighted depletions of commercially important species in southeast Spain, and examined the effects of human pressures on its coastal habitats, their differential effects on protected and unprotected shallow, coastal fish communities have remained less frequently documented [41,42,43,44,67,68,69,72].
Recurring samplings of marine reserves and their surrounding areas are useful to account for changes in protected and nearby unprotected populations, in addition to habitat dynamics [54,57,66,70,78,79]. Long-term monitoring in the Scandola marine reserve (Corsica, northwest Mediterranean) suggests differential stabilization of fish assemblages in more continuous seagrass versus patchy rocky reef habitats [66,78]. These factors also influence community composition throughout protected and unprotected areas, which likewise contribute to reserve stability and long-term trends in population performance [12,13,14,58,59,60,66,70,78]. Therefore, the variable influences of such spatiotemporal factors on reserve functioning warrant continued investigation.
We examined the effects of habitat coverage and diversity on fish community composition and species-specific patterns within shallow areas along a gradient of marine protection. We chose to focus on shallow, coastal fish communities in accessible areas that would potentially be subject to more frequent human use and probable disturbance. Our specific hypotheses were that greater degrees of protection would result in significantly higher densities of fish species, and altered community composition among sites. In addition, we proposed that greater seagrass coverage and lower habitat diversity in a given sampling area (i.e., more continuous habitats) would most likely occur in protected areas, which would favor higher fish densities, as observed in long-term studies of other Mediterranean reserves [66,78].
2. Materials and Methods
2.1. Study Sites
The southeastern Mediterranean coast of Spain, including coastal regions of Alicante, Santa Pola, and the Tabarca marine reserve (Figure 1), has been previously described [41,42,43,44,80,81,82,83,84,85]. Nearshore habitats within these sites include shallow rocky substrates, macroalgae dominated sediments (with Caulerpa spp. most abundant), and extensive seagrass beds (dominated by Posidonia oceanica and Cymodocea nodosa), which house numerous species of demersal fishes and macroinvertebrates [41,42,43,44,80,81,82,83,84,85]. Outside of the Tabarca reserve, the study area, extending from the northern limits of Cabo de las Huertas (CH) to the southern point of Santa Pola (SP) just offshore the Centro de Investigación Marina de Santa Pola (CIMAR), is open to fishing and has been historically overexploited [41,42,43,44,80,81,82,83,84,85,86]. Additional anthropogenic pressures, including the effects of land reclamation, eutrophication, desalination, tourism, and marine litter, have been documented in this region [85,87,88,89,90,91,92].
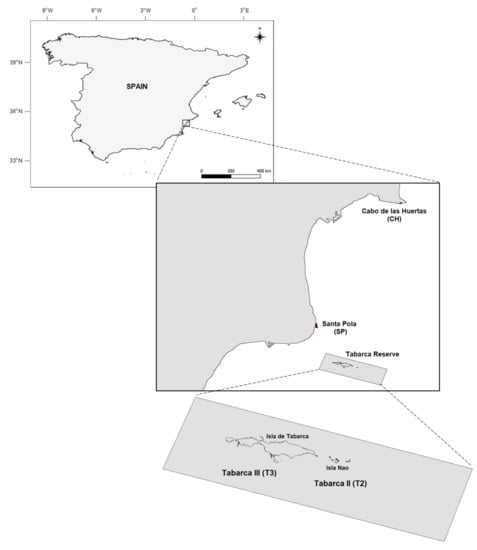
Figure 1.
Map of the Alicante region of the Spanish coast, including sampling sites (dots) at Cabo de las Huertas (CH), Santa Pola (SP), and the Tabarca marine reserve (Isla Nao—T2 and Isla de Tabarca—T3.
Approximately 4 km offshore from SP, the Tabarca marine reserve (~1400 ha., established 1986) surrounds Nueva Tabarca Island—of which, the marine community composition and the effects of its protected status have previously been investigated [41,42,43,44,67,68,72,84,85,93,94]. The reserve is divided into three zones with a gradient of protection levels and allowable uses [41,42,43,44,84,85]. These include a deeper, easternmost 100 ha. integral reserve area (Tabarca I; not sampled in this study), where all activities except scientific study are prohibited; a 630 ha. buffer zone containing Isla Nao (Tabarca II, T2; sampled in this study), where selective artisanal fishing gear for pelagic species is allowed; and the peripheral/transitional zone containing Nueva Tabarca Island (Tabarca III, T3; sampled in this study), where selective fishing gear and recreational activities (swimming, diving, boating) are permitted. Further details regarding zoning, management, administration, participation, monitoring, and scientific oversight have been previously published [72,81,84,85,90]. The entire reserve serves as a no-take zone for species targeted by trammel nets, which are banned throughout this protected area [41].
2.2. Methods
Fish density and community composition within the Tabarca protected area (T2, T3) and surrounding locations outside the reserve (CH, SP) were investigated using daytime visual surveys (0800–1600) during three separate sampling periods. Initial surveys occurred from 3–10 September 2009 and were followed by subsequent returns to the study sites during 30 August to 8 September 2011 and 2–11 September 2013. These periods were consistently selected for optimal sampling potential of fish communities during end of summer and early fall seasons. Each year, visual surveys were conducted within two coastal unprotected sites (CH and SP; Figure 1) and two areas within the Tabarca protected area: T2 and the southern coast of the island of Tabarca (T3). Equivalent sampling efforts were conducted during 2009 and 2011 (n = 42 transects; Table 1), while the number of survey transects was increased in 2013 (n = 61) to allow for a more comprehensive evaluation of fish community composition. Within each site, initial 2009 survey locations were haphazardly chosen (i.e., by tossing the transect tape measure in a random direction, allowing it to sink, and swimming to it) in depths no greater than 5 m within areas containing a variable mixture of sandy, rocky, or seagrass (Posidonia oceanica dominant) bottoms. Surveys were executed as 50 m-long × 2 m-wide transects, which were swum by pairs of snorkelers along a tape laid out on the bottom in a randomized direction and following a two-minute acclimation period. Transect start and endpoints were additionally recorded by Global Positioning System (GPS) to allow for subsequent return to these same survey locations. Using a dive slate, a given snorkeler recorded the number of demersal and pelagic fish per species observed along the bottom and in the water column within the 100 m2 transect. Additionally, information regarding the percent composition of bottom substrate (i.e., sand, rock, and species of seagrass or macroalgae) was recorded along transects at every five meters. To ensure consistency across sampling periods, all teams were trained thoroughly and consistently by the same instructors before carrying out visual surveys. Additionally, during trainings, some transects by paired divers were repeated as back-to-back surveys to test performance and accuracy.

Table 1.
Number of visual surveys conducted per year (2009–2013) at a given site within and surrounding the Tabarca marine protected area.
Total and species-specific fish densities (number of fish m−2) were calculated per transect and substrate classification for all three survey years. The fraction of total vegetated (seagrass and macroalgae) cover and a Shannon–Wiener index of bottom habitat diversity accounting for substrate classifications listed in Table S1 were calculated for each transect. To examine the rigor with which we replicated exact transect paths across the three sampling periods, we calculated the coefficients of variation for the fraction of vegetated bottom cover across the three sampling periods for each transect (mean and SD for each transect). Coefficients of variation varied in magnitude, but many were large, indicating significant technological error (GPS inherent offset) when attempting to locate the same transect over the three sampling periods. Given these observations, data were assumed to meet the assumptions for functional independence. Thus, we opted to analyze fish density data for all fishes and the five-most abundant species separately for each of the three sampling periods.
Two-way effects of site (location) with bottom percent vegetated cover and habitat diversity on fish densities were examined through univariate analyses of covariance (ANCOVAs) and post-hoc Newman–Keuls multiple pairwise testing [95,96]. Given the continuous values for vegetated cover and habitat diversity, ANCOVAs allowed for testing their degree of influence on fish densities among locations. Previous studies have shown the utility of using ANCOVAs to examine habitat effects on fish densities and other biological metrics [97,98]. For each ANCOVA model, the homogeneity of regression slopes assumption was examined through the incorporation of an interaction term (i.e., percent vegetated cover*location or habitat diversity*location) into a given model. Among all models (n = 36), no significant interactions were observed except for in one species-specific case. Additionally, spatiotemporal differences in fish community composition were measured using non-metric multivariate dimensional scaling (nMDS), analyses of similarity (ANOSIMs), and similarity percentages (SIMPER) analyses with PAST 3.22 software [99]. Density data were log-transformed to meet assumptions of parametric univariate testing (Levene’s test: F2,142 = 1.291; p = 0.278), and square-root transformed for multivariate analyses.
3. Results
A total of 40 fish species were observed among sites, with the majority present in P. oceanica or rock bottom habitats at sites T2 and T3, which were within the Tabarca marine reserve (Table S1). For total fish density, no significant effect of percent vegetated cover was observed, while site was significant for all three sampling periods (Table 2). Additionally, a significant effect of bottom habitat diversity on total density was consistently observed during all years (Table 3), while site was also significant in 2009 (p = 0.000) and 2011 (p = 0.021). Post-hoc comparisons showed higher total densities occurring at T2 than at SP (outside the Tabarca marine reserve) during all years when also accounting for percent vegetated cover (Figure 2 and Figure S1), and during 2009 and 2011 when also accounting for bottom habitat diversity (Figure 3 and Figure S2). When accounting for vegetated cover, total fish density was generally higher at T2 than at CH (outside the Tabarca marine reserve) and T3, except in 2013. During 2011, no significant difference was observed among total densities when only accounting for habitat diversity (Table 2 and Table 3, Figures S1 and S2). Similarly, higher densities were also observed in T3 compared to SP during 2011 and 2013 when also accounting for percent vegetated cover. No significant difference in total fish density was observed between CH and T3 during any of the sampling periods.
Table 2.
Analysis of covariance (ANCOVA) results examining within-year variability related to the percentage of total vegetated Caulerpa and Posidonia habitat (%vegetated) and location (site) for density (fish m−2) of all fishes and the five most abundant species. Significant values (p < 0.05) and factors for which significance was observed in a given year are indicated in bold. Interactions (%Vegetated*Location) between factors that were significant in at least one given year are additionally included below. All other interactions were non-significant (p > 0.05).
Table 3.
Analysis of covariance (ANCOVA) results examining within-year variability related to Shannon–Wiener habitat diversity index and location (site) for density (fish m−2) of all fishes and the five most abundant species. Significant values (p < 0.05) and factors for which significance was observed in a given year are indicated in bold. Interactions (Habitat Diversity*Location) between factors that were significant in at least one given year are additionally included below. All other interactions were non-significant (p > 0.05).
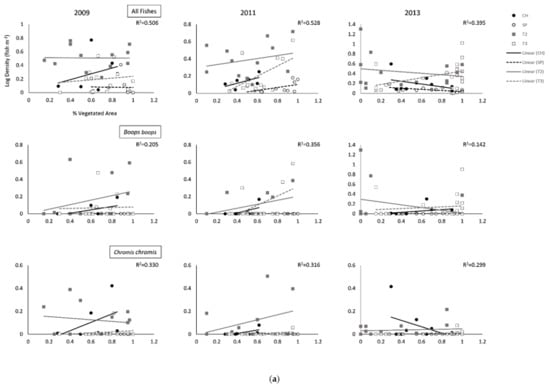
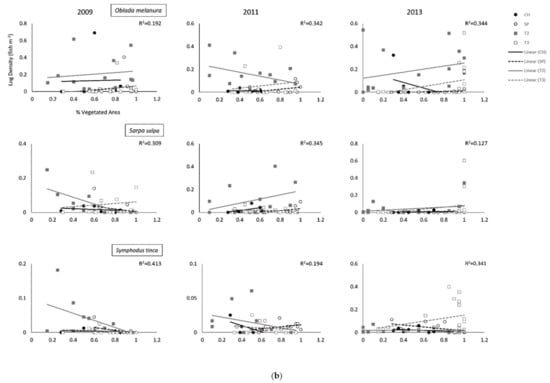
Figure 2.
(a) Relationships (Global R2) between the percentage of vegetated area surveyed and annual average density for all fishes and the five most abundant species per survey site (Cabo de las Huertas—CH; Santa Pola—SP; Tabarca II—T2; Tabarca III—T3). Global R2 values depict overall global fit for each ANCOVA model. (b). Relationships (Global R2) between the percentage of vegetated area surveyed and annual average density for all fishes and the five most abundant species per survey site (Cabo de las Huertas—CH; Santa Pola—SP; Tabarca II—T2; Tabarca III—T3). Global R2 values depict overall global fit for each ANCOVA model.
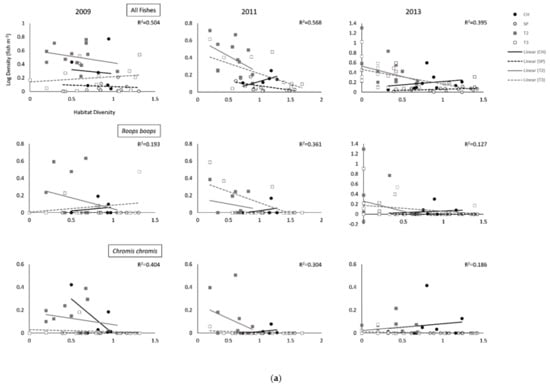
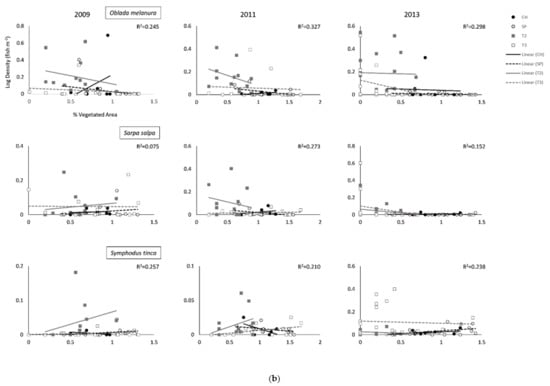
Figure 3.
(a). Relationships (Global R2) between Shannon–Wiener habitat diversity index and annual average density for all fishes and the five most abundant species per survey site (Cabo de las Huertas—CH; Santa Pola—SP; Tabarca II—T2; Tabarca III—T3). Global R2 values depict overall global fit for each ANCOVA model. (b). Relationships (Global R2) between Shannon–Wiener habitat diversity index and annual average density for all fishes and the five most abundant species per survey site (Cabo de las Huertas—CH; Santa Pola—SP; Tabarca II—T2; Tabarca III—T3). Global R2 values depict overall global fit for each ANCOVA model.
Some differences across sites were found for abundant species, particularly when accounting for percent vegetated cover (Table 2; Figure 2 and Figure 3 and Figures S1 and S2). For Chromis chromis (Mediterranean Chromis), significant differences in fish density were generally observed across sites during sampling years, but trends varied (Table 2 and Table 3; Figure 2a and Figure 3a, Figures S1 and S2). Overall, densities were generally highest in T2 Posidonia habitats (Table S1). In 2009, densities for C. chromis were significantly higher in CH and T2 than in SP and T3 when accounting for either percent vegetated cover or bottom habitat diversity. Additionally, a significantly negative influence of habitat diversity on C. chromis density was also observed during 2009 (p = 0.030) and 2011 (p = 0.015; Table 3; Figure 3b). During 2011, C. chromis densities were highest in T2 than all other sites when accounting for percent vegetated cover, while no significant differences among sites were found when accounting for habitat diversity. In 2013, densities were significantly higher in CH than in SP or T3 when accounting for either percent vegetated cover (p = 0.017) or habitat diversity (p = 0.020), and a significant interaction between percent cover and location was also observed (p = 0.023; Table 2). During this year, a negative relationship between vegetated cover and C. chromis density was observed in CH, while neutral relationships were observed for all other sites (Figure 2a).
In 2011, densities for Boops boops (Bogue) were significantly lower at SP than at all other sites when accounting for percent cover (p = 0.019), with significant effects of habitat diversity observed during 2011 (p = 0.004) and 2013 (p = 0.025; Table 2 and Table 3; Figure 2a and Figure 3a, Figures S1 and S2). For all years, B. boops densities were generally highest in Posidonia and rock habitats in T2 and T3 (Table S1). In 2011 and 2013, Oblada melanura (Saddled Seabream) densities in T2 were significantly higher than all other sites when accounting for percent cover, with significant effects of habitat diversity similarly observed during these years. O. melanura densities were generally highest in T2 and T3 Posidonia habitats (Table S1). Neutral to negative relationships between habitat diversity and B. boops and O. melanura densities were additionally observed (Figure 3a,b). Densities for Symphodus tinca (East Atlantic Peacock Wrasse) in 2013 were significantly highest in T3 among all sites when accounting for either percent cover (p = 0.003) or habitat diversity (p = 0.004; Table 3; Figures S1 and S2). Densities were generally highest in T2 and T3 Posidonia and rock habitats (Table S1). An additional significant and overall positive effect of percent vegetated cover (p = 0.001) was observed for 2009 S. tinca densities (Table 2; Figure 2b). Although no significant differences across sites were observed for Sarpa salpa (Salema Porgy) densities, significant effects of percent vegetated cover (2009, p = 0.014) and habitat diversity (2011, p = 0.027; 2013, p = 0.014) were found. Densities were generally highest in T2 and T3 Posidonia habitats (Table S1). Overall significant negative relationships between habitat diversity and S. salpa densities were observed, in addition to a negative relationship between S. salpa density and vegetated cover during 2009 (Figure 2b).
nMDS ordinations (Figure 4) and ANOSIM analyses revealed significant differences in fish community composition among sites within and across years (Table 4). Community composition in T2 consistently differed from that of all other sites across years, while no significant differences in composition were observed between CH and SP or CH and T3. Although no difference in composition was observed between SP and T3 in the period 2009–2011, these sites were found to differ significantly in 2013 (p = 0.0015). Among these sites, differences in the abundance of O. melanura, S. sarpa, C. chromis, S. tinca, and Diplodus annularis (Annular Seabream) contributed most toward composition dissimilarities (Table 5). Additionally, Trachurus trachurus (Atlantic horse mackerel) contributed up to 11.2% of the differential composition observed between T2 and all other sites in 2009, but did not have any contribution during other periods. Differences in composition among SP and T2 in 2013 were additionally influenced (9.5%) by a differential abundance of Thalassoma pavo (Ornate Wrasse).
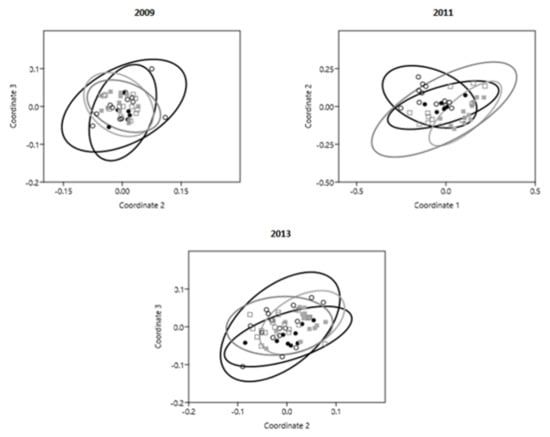
Figure 4.
Non-metric multidimensional scaling (nMDS) ordinations with 95% confidence ellipses per site (Cabo de las Huertas—CH, black solid circles; Santa Pola—SP, black open circles; Tabarca II—T2, gray solid squares; Tabarca III—T3, gray open squares).
Table 4.
Analysis of similarity (ANOSIM) results examining within-year and cross-year variability of fish community composition among study sites (Cabo de las Huertas—CH; Santa Pola—SP; Tabarca II—T2; Tabarca III—T3). Significant values (p < 0.005) are indicated in bold.
Table 5.
Similarity Percentages (SIMPER) analysis results examining within-year and cross-year differences in fish community composition among study sites (Cabo de las Huertas—CH; Santa Pola—SP; Tabarca II—T2; Tabarca III—T3) for which significant differences in composition were observed. Values presented as average dissimilarity and percent dissimilarity (in parentheses) for the top six contributing taxa per site comparison.
Across years, no significant difference in community composition was observed in T2, while composition changed in CH between 2009 and 2013 (p = 0.0041). Additionally, changes in composition were observed for SP and T3 between 2009 and 2011 (p(SP) = 0.0003; p(T3) = 0.0007) and between 2009 and 2013 (p(SP) = 0.0002; p(T3) = 0.0004). Differential abundance of O. melanura, S. salpa, S. tinca, D. annularis, and Diplodus vulgaris (Common Two-Banded Seabream) contributed most toward composition dissimilarities within sites across years. Additionally, differences in the abundance of C. chromis in CH contributed highly (26.1%) toward composition variability between 2009 and 2013.
4. Discussion
Examining the influences of vegetated cover and habitat diversity on fish density throughout a gradient of reserve protection illustrated the differential importance of these factors at the species and community level. Although vegetated cover did not significantly affect fish densities apart from the two herbivores (S. sarpa, S. tinca) during the 2009 sampling period, habitat diversity was a commonly influential factor across all three sampling periods. Overall, and as expected, fish density was positively associated with less diverse and therefore more continuous vegetated or unvegetated habitats among sampling areas, and was greatest in areas of highest protection (T2). Among all sites, fish community composition was distinct in the most protected portion of the Tabarca reserve (T2), where it was also most stable. These findings generally support our initial hypotheses, and demonstrate the effectiveness of protection and habitat dynamics toward reserve functioning in shallow coastal areas. They additionally align with previous investigations conducted throughout other portions of the Tabarca reserve and its surrounding areas [41,42,43,44,67,68,72,85].
The influence of habitat, particularly continuity, in supporting fish populations and communities has been shown throughout multiple studies, especially within reef and seagrass systems [16,17,18,19,20,21,22,23,24,25,26,27,41,42,43,44,100,101,102]. In addition, these factors have been shown to contribute directly to the responses of fishes within reserve systems, including among locations throughout the Mediterranean [3,17,21,23,36,41,42,43,44,67,68,72,85]. Forcada et al. [41,42] found that a lack of continuous habitat within the Tabarca reserve served as a bottleneck for effective spillover of targeted finfishes in the eastern and southern portions of the reserve. Similarly, Goñi et al. [44] observed that biomass export was most associated with continuous habitats across the reserve boundaries in the north and west regions. Overall habitat quality, particularly degradation of P. oceanica seagrass beds and their degree of patchiness, has been shown to affect fish community composition, density, and recovery [16,17,18,19,20,21,22,23,24,25,26,27,41,42,43,44,65,66,68,70,71,84,100,101,102]. As observed for other portions of the Mediterranean, the importance of continuous shallow rocky substrate and degree of protection in influencing fish density was also shown in our study [20,53,67,68,71,77,103,104], especially given the less consistent relationship with vegetated cover in a given transect. These findings demonstrate that higher fish densities are generally associated with less diverse and more protected habitats, independent of percent vegetated cover within a given transect. Generally, lower habitat diversity and the highest community stability were observed in our most protected sampling sites (T2). These findings reinforce those by Seytre and Fracour [66] and Fraschetti et al. [70], which demonstrated relationships among fish community stability, fishing prohibitions, and continuity of rocky or vegetated habitats in Mediterranean reserves.
In our study, negative relationships between fish density and habitat diversity were found for four abundant species (B. boops, C. chromis, O. melanura, S. sarpa) during at least one sampling period. Additionally, these species were often observed at the greatest densities in the most protected areas of the reserve. The importance of continuous habitats and greater protection in promoting the productivity of these species within the Tabarca reserve was previously observed by Ojeda-Martinez et al. [72]. They attributed these results to the faster growth and higher fecundity associated with these small fish species, in addition to more suitable habitats. Additional studies have also demonstrated the importance of complex and continuous habitats in promoting the abundance of these reef and seagrass associated species [42,102,103,104]. As observed in our study, Symphodus spp. did not benefit as much from high protection, as potentially related to increased predation pressure in the reserve and the importance of rocky substrate and vegetated cover for these species [72,105]. However, other studies have shown seasonal variation in their feeding behaviors and habitat affinities [106,107], suggesting that there may be differential reliance on habitats within and outside the reserve boundaries throughout a given year. Our findings suggest continued effectiveness of the Tabarca reserve protections in fostering more continuous and less fragmented or anthropogenically disturbed habitats, which in turn has allowed for ongoing enhancement of these populations [41,42,43,44,66]. Given their importance to piscivores, increased abundance of Symphodus spp. may also partially facilitate higher densities of mid- and upper trophic level species (e.g., groupers) in the reserve as noted in previous studies [41,42,43,44,67,85].
As climatic and anthropogenic pressures continue to affect Mediterranean coastal habitats [62,65,86,87,88,89,90,91,92,93,108,109], ongoing multiyear monitoring of reserve effectiveness, habitat quality, and biological stability remains necessary. Recurring examination of marine reserves among their encompassed habitats has demonstrated the importance of spatial management protections toward maintaining and enhancing biological communities [54,57,66,70,78,79]. Regular monitoring of reserves has shown varying spatiotemporal responses to management actions, with differential effects among depths, substrates, and species [41,42,43,44,54,57,66,70,78,79]. Our study found that habitat factors in repeatedly sampled locations influenced the degree of response observed for fish species among sites and substrates over time. Evaluations of reserve performance may occur as snapshots before and after establishment [50,52,59,61], and, if so, interannual variability in biological responses will not be readily captured. Therefore, regularly continued monitoring of reserve performance remains necessary to monitor reserve effects, which vary at different scales and are influenced by multiple ecological processes [50,52,59,61,66,70,72]. Factors including trophodynamics, habitat degradation, thermohaline properties, and management actions, among other natural pressures, can intermittently affect reserve functioning and additionally warrant continued attention at finer scales [2,3,9,14,21,22,23,33,36,37,38,39,40,41,42,43,44,45,46,53,61,66,67,68,69,70,71,72,73,74,75,76,77]. In addition, the utility of multiple monitoring periods to determine reserve stability or identify novel factors affecting a given reserve has been repeatedly demonstrated [50,52,59,61,66,70,72,93].
Our study highlights the ecological consequences of continued exploitation and human activity throughout southeastern Spanish coastal regions. Low fish densities and high patchiness of habitats continue to be observed in unprotected areas as a result of continued fishing pressure, destructive practices, nutrient loading, and desalination [85,87,88,89,90,91,92,104,105,108,109,110]. While 22 reserve networks occur in portions of the Spanish Mediterranean, they only make up ~8% of the exclusive economic zone [111,112]. Although management actions are working to address some stressors, their effectiveness has been limited to specific locations [85,87,88,89,90,91,92,104,105,108,109,110]. In addition, as other ocean uses and the human population continue to increase throughout the Mediterranean, their effects are likely to intensify within shallow coastal habitats, reinforcing the importance of ongoing protections and broader management approaches [62,63,64,65,85,87,88,89,90,91,92,104,105,108,109,110]. Given emergent effects of biological invasions and climate-driven changes to Mediterranean ecosystems, ongoing efforts that include spatial protections are urgently needed to preserve the integrity of their habitats, marine populations, and coastal communities. As recently documented, it is likely that in the time since our study, many factors have continued to affect both unprotected and protected regions of the western Mediterranean [62,63,64,65,80,85,87,88,89,90,91,92,93,103,105,108,109,110,113,114,115]. While our study was initiated ten years prior to its publication, the information contained in this work provides valuable baselines for which to compare ongoing monitoring of shallow fish communities and their habitats within and surrounding the reserve. We additionally reinforce the observed stability of fish communities and recurring habitat continuity within its most protected shallow areas for which continued investigations are warranted.
This study complements others that have demonstrated the effectiveness of marine reserves in enhancing fish populations over time, promoting habitat integrity, and housing distinct and more speciose biological communities as a result of diminished human pressures [8,9,10,11,12,13,14,15,16,17,18,19,20,21,22,41,42,43,44,66,67,68,69,70,71,72,84,116,117]. These types of results have been recurrently observed in portions of the Tabarca marine reserve, mainly where more continuous habitats occur [41,42,43,44,66,67,68,69,70,71,72,84]. Continued monitoring of the Tabarca reserve and its surrounding areas will be essential as additional stressors affect the coastal Mediterranean, and as differential responses within and outside the reserve occur among species and their habitats [41,42,43,44,62,63,64,65,67,68,72,84,85,87,88,89,90,91,92,93,104,105,108,109,110,113,114,115]. Future evaluations of the relationships among habitat patchiness, community composition, and fish population dynamics should be carried out among depths and expanded upon from our examination of shallow coastal areas. These studies can provide needed information on reserve functioning, in addition to the degree of human impacts in unprotected areas, and can be applied toward expanding or refining reserve boundaries as warranted. Given broader management actions occurring within the Spanish Mediterranean and throughout the European Union [117,118,119,120,121], approaches such as those for the Tabarca marine reserve provide a means for buffers on human activities while facilitating ecosystem-based strategies that consider multiple species, their habitats, and environmental factors. These investigations additionally advance understanding of longer-term multiscale reserve effects—the results of which can be applied toward enhancing other conservation efforts. As positive biological responses continue to be observed in this reserve [41,42,43,44,62,63,64,65,67,68,72,84,85] and throughout other reserves in the western Mediterranean [20,43,44,59,66,70,76,77], there is potential for ongoing enhancement of coastal habitats and marine communities. Together with more robust, progressive, and systematic management actions, broader spatial approaches that include marine reserves can contribute toward facilitating healthier and more resilient ecosystems.
Supplementary Materials
Available online at https://www.mdpi.com/2073-4441/12/6/1537/s1. Table S1. Average annual densities (fish m-2; ±SE) of all fish species per survey site and habitat classification. Figure S1. Least-squares mean density (fish m-2; ±SE) of all fishes and the five most abundant species per survey site. Uppercase letters indicate significant differences (p < 0.05, analysis of covariance examining site and %vegetated cover, with post-hoc Newman–Keuls tests) among sites for all fishes. Lowercase letters indicate significant differences (p < 0.05, analysis of variance examining site and %vegetated cover, with post-hoc Newman–Keuls tests) among sites for a given species. Figure S2. Least-squares mean density (fish m-2; ±SE) of all fishes and the five most abundant species per survey site. Uppercase letters indicate significant differences (p < 0.05, analysis of covariance examining site and habitat diversity, with post-hoc Newman–Keuls tests) among sites for all fishes. Lowercase letters indicate significant differences (p < 0.05, analysis of variance examining site and habitat diversity, with post-hoc Newman–Keuls tests) among sites for a given species.
Author Contributions
A.R.M.—conceptualization, data curation, formal analysis, investigation, methodology, project administration, validation, visualization, writing—original draft; J.C.—conceptualization, formal analysis, funding acquisition, methodology, resources, supervision, validation, visualization, writing—review and editing; K.L.H.J. and J.-L.S.-L.—conceptualization, funding acquisition, methodology, resources, supervision, validation, visualization, writing—review and editing; C.L.H., A.M.K., A.M., S.M., and T.S.—conceptualization, data curation, investigation, methodology, project administration, validation, visualization, writing—review and editing. All authors have read and agreed to the published version of the manuscript.
Funding
This research received no external funding.
Acknowledgments
The authors acknowledge the collaborative support provided by both the Department of Marine Science and Applied Biology (University of Alicante) and the Department of Marine Sciences (University of South Alabama), as well as funding provided by the latter. We thank the Centro de Investigación Marina de Santa Pola (CIMAR) and Dauphin Island Sea Lab (DISL) for additional institutional support during these studies. We are especially grateful to the staff of the Tabarca marine reserve (namely Felio Lozano-Quijada) for all their field assistance and insight during the planning and execution of this study. We additionally thank students from the University of South Alabama (Matt Ajemian, Matt Kenworthy) and the University of Alicante (Pablo Arechavala, Elena Martinez) for their assistance and field support. We also thank several anonymous reviewers whose feedback helped to improve the quality of our manuscript.
Conflicts of Interest
The authors declare no conflicts of interest.
References
- Roberts, C.M.; Bohnsack, J.A.; Gell, F.; Hawkins, J.P.; Goodridge, R. Effects of marine reserves on adjacent fisheries. Science 2001, 294, 1920–1923. [Google Scholar] [CrossRef] [PubMed]
- Hilborn, R.; Stokes, K.; Maguire, J.J.; Smith, T.; Botsford, L.W.; Mangel, M.; Orensanz, J.; Parma, A.; Rice, J.; Bell, J.; et al. When can marine reserves improve fisheries management? Ocean. Coast. Manag. 2004, 47, 197–205. [Google Scholar] [CrossRef]
- McClanahan, T.R.; Arthur, R. The effect of marine reserves and habitat on populations of East African coral reef fishes. Ecol. Appl. 2001, 11, 559–569. [Google Scholar] [CrossRef]
- Clark, C.W. Marine reserves and the precautionary management of fisheries. Ecol. Appl. 1996, 6, 369–370. [Google Scholar] [CrossRef]
- Costello, M.J.; Ballantine, B. Biodiversity conservation should focus on no-Take Marine Reserves: 94% of Marine Protected Areas allow fishing. Trends Ecol. Evol. 2015, 30, 507–509. [Google Scholar] [CrossRef]
- Alcala, A.C.; Russ, G.R. A direct test of the effects of protective management on abundance and yield of tropical marine resources. ICES J. Mar. Sci. 1990, 47, 40–47. [Google Scholar] [CrossRef]
- Russ, G.R.; Alcala, A.C. Do marine reserves export adult fish biomass? Evidence from Apo Island, central Philippines. Mar. Ecol. Prog. Ser. 1996, 132, 1–9. [Google Scholar] [CrossRef]
- Russ, G.R.; Alcala, A.C. Marine reserves: Long-Term protection is required for full recovery of predatory fish populations. Oecologia 2004, 138, 622–627. [Google Scholar] [CrossRef]
- Jennings, S. Patterns and prediction of population recovery in marine reserves. Rev. Fish. Biol. Fisher 2000, 10, 209–231. [Google Scholar] [CrossRef]
- Aburto-Oropeza, O.; Erisman, B.; Galland, G.R.; Mascareñas-Osorio, I.; Sala, E.; Ezcurra, E. Large recovery of fish biomass in a no-take marine reserve. PLoS ONE 2011, 6, 1–7. [Google Scholar] [CrossRef]
- McClanahan, T.R.; Graham, N.A.; Calnan, J.M.; MacNeil, M.A. Toward pristine biomass: Reef fish recovery in coral reef marine protected areas in Kenya. Ecol. Appl. 2007, 17, 1055–1067. [Google Scholar] [CrossRef] [PubMed]
- Micheli, F.; Halpern, B.S.; Botsford, L.W.; Warner, R.R. Trajectories and correlates of community change in no-take marine reserves. Ecol. Appl. 2004, 14, 1709–1723. [Google Scholar] [CrossRef]
- Guidetti, P. Potential of marine reserves to cause community-wide changes beyond their boundaries. Conserv. Biol. 2007, 21, 540–545. [Google Scholar] [CrossRef]
- Guidetti, P. Marine reserves reestablish lost predatory interactions and cause community changes in rocky reefs. Ecol. Appl. 2006, 16, 963–976. [Google Scholar] [CrossRef]
- Cook, D.; Malinauskaite, L.; Roman, J.; Davíðsdóttir, B.; Ögmundardóttir, H. Whale sanctuaries–An analysis of their contribution to marine ecosystem-based management. Ocean. Coast. Manag. 2019, 182, 104987. [Google Scholar] [CrossRef]
- Henderson, C.J.; Gilby, B.L.; Lee, S.Y.; Stevens, T. Contrasting effects of habitat complexity and connectivity on biodiversity in seagrass meadows. Mar. Biol. 2017, 164, 1–9. [Google Scholar] [CrossRef]
- Williamson, D.H.; Ceccarelli, D.M.; Evans, R.D.; Jones, G.P.; Russ, G.R. Habitat dynamics, marine reserve status, and the decline and recovery of coral reef fish communities. Ecol. Evol. 2014, 4, 337–354. [Google Scholar] [CrossRef]
- Van Lier, J.R.; Wilson, S.K.; Depczynski, M.; Wenger, L.N.; Fulton, C.J. Habitat connectivity and complexity underpin fish community structure across a seascape of tropical macroalgae meadows. Landsc. Ecol. 2018, 33, 1287–1300. [Google Scholar] [CrossRef]
- Gratwicke, B.; Speight, M.R. The relationship between fish species richness, abundance and habitat complexity in a range of shallow tropical marine habitats. J. Fish. Biol. 2005, 66, 650–667. [Google Scholar] [CrossRef]
- García-Charton, J.; Williams, I.D.; Ruzafa, A.P.; Milazzo, M.; Chemello, R.; Marcos, C.; Kitsos, M.S.; Koukouras, A.; Riggio, S. Evaluating the ecological effects of Mediterranean marine protected areas: Habitat, scale and the natural variability of ecosystems. Environ. Conserv. 2000, 27, 159–178. [Google Scholar] [CrossRef]
- Rees, M.J.; Knott, N.A.; Neilson, J.; Linklater, M.; Osterloh, I.; Jordan, A.; Davis, A.R. Accounting for habitat structural complexity improves the assessment of performance in no-take marine reserves. Biol. Conserv. 2018, 224, 100–110. [Google Scholar] [CrossRef]
- Berglund, M.; Jacobi, M.N.; Jonsson, P.R. Optimal selection of marine protected areas based on connectivity and habitat quality. Ecol. Model. 2012, 240, 105–112. [Google Scholar] [CrossRef]
- Olds, A.D.; Pitt, K.A.; Maxwell, P.S.; Connolly, R.M. Synergistic effects of reserves and connectivity on ecological resilience. J. Appl. Ecol. 2012, 49, 1195–1203. [Google Scholar] [CrossRef]
- Isaak, D.J.; Thurow, R.F.; Rieman, B.E.; Dunham, J.B. Chinook salmon use of spawning patches: Relative roles of habitat quality, size, and connectivity. Ecol. Appl. 2007, 17, 352–364. [Google Scholar] [CrossRef]
- Magris, R.A.; Treml, E.A.; Pressey, R.L.; Weeks, R. Integrating multiple species connectivity and habitat quality into conservation planning for coral reefs. Ecography 2016, 39, 649–664. [Google Scholar] [CrossRef]
- Peterson, M.S.; Lowe, M.R. Implications of cumulative impacts to estuarine and marine habitat quality for fish and invertebrate resources. Rev. Fish. Sci. 2009, 17, 505–523. [Google Scholar] [CrossRef]
- Cabral, R.B.; Gaines, S.D.; Lim, M.T.; Atrigenio, M.P.; Mamauag, S.S.; Pedemonte, G.C.; Aliño, P.M. Siting marine protected areas based on habitat quality and extent provides the greatest benefit to spatially structured metapopulations. Ecosphere 2016, 7, e01533. [Google Scholar] [CrossRef]
- Roberts, C.M.; O’Leary, B.C.; McCauley, D.J.; Cury, P.M.; Duarte, C.M.; Lubchenco, J.; Pauly, D.; Sáenz-Arroyo, A.; Sumaila, U.R.; Wilson, R.W.; et al. Marine reserves can mitigate and promote adaptation to climate change. Proc. Natl. Acad. Sci. USA 2017, 114, 6167–6175. [Google Scholar] [CrossRef]
- Ling, S.D.; Johnson, C.R. Marine reserves reduce risk of climate-driven phase shift by reinstating size-and habitat-specific trophic interactions. Ecol. Appl. 2012, 22, 1232–1245. [Google Scholar] [CrossRef]
- Schiel, D.R. The other 93%: Trophic cascades, stressors and managing coastlines in non-marine protected areas. N. Zeal. J. Mar. Fresh 2013, 47, 374–391. [Google Scholar] [CrossRef]
- Brown, C.J.; Saunders, M.I.; Possingham, H.P.; Richardson, A.J. Interactions between global and local stressors of ecosystems determine management effectiveness in cumulative impact mapping. Divers. Distrib. 2014, 20, 538–546. [Google Scholar] [CrossRef]
- Álvarez-Romero, J.G.; Munguía-Vega, A.; Beger, M.; del Mar Mancha-Cisneros, M.; Suárez-Castillo, A.N.; Gurney, G.G.; Pressey, R.L.; Gerber, L.R.; Morzaria-Luna, H.N.; Reyes-Bonilla, H.; et al. Designing connected marine reserves in the face of global warming. Glob. Chang. Biol. 2018, 24, e671–e691. [Google Scholar] [CrossRef]
- Gaines, S.D.; Gaylord, B.; Largier, J.L. Avoiding current oversights in marine reserve design. Ecol. Appl. 2013, 13, 32–46. [Google Scholar] [CrossRef]
- Shokri, M.R.; Gladstone, W. Limitations of habitats as biodiversity surrogates for conservation planning in estuaries. Environ. Monit. Assess. 2013, 185, 3477–3492. [Google Scholar] [CrossRef]
- Moffitt, E.A.; White, J.W.; Botsford, L.W. The utility and limitations of size and spacing guidelines for designing marine protected area (MPA) networks. Biol. Conserv. 2011, 144, 306–318. [Google Scholar] [CrossRef]
- Hawkins, J.P.; Roberts, C.M.; Dytham, C.; Schelten, C.; Nugues, M.M. Effects of habitat characteristics and sedimentation on performance of marine reserves in St. Lucia. Biol. Conserv. 2006, 127, 487–499. [Google Scholar] [CrossRef]
- Halpern, B.S.; Warner, R.R. Matching marine reserve design to reserve objectives. Proc. R Soc. Lond. Biol. 2003, 270, 1871–1878. [Google Scholar] [CrossRef]
- Roberts, C.M.; Branch, G.; Bustamante, R.H.; Castilla, J.C.; Dugan, J.; Halpern, B.S.; Lafferty, K.D.; Leslie, H.; Lubchenco, J.; McArdle, D.; et al. Application of ecological criteria in selecting marine reserves and developing reserve networks. Ecol. Appl. 2003, 13, 215–228. [Google Scholar] [CrossRef]
- Airamé, S.; Dugan, J.E.; Lafferty, K.D.; Leslie, H.; McArdle, D.A.; Warner, R.R. Applying ecological criteria to marine reserve design: A case study from the California Channel Islands. Ecol. Appl. 2003, 13, 170–184. [Google Scholar] [CrossRef]
- Roberts, C.M. Selecting marine reserve locations: Optimality versus opportunism. Bull. Mar. Sci. 2000, 66, 581–592. [Google Scholar]
- Forcada, A.; Valle, C.; Bonhomme, P.; Criquet, G.; Cadiou, G.; Lenfant, P.; Sánchez-Lizaso, J.L. Effects of habitat on spillover from marine protected areas to artisanal fisheries. Mar. Ecol. Prog. Ser. 2009, 379, 197–211. [Google Scholar] [CrossRef]
- Forcada, A.; Bayle-Sempere, J.T.; Valle, C.; Sánchez-Jerez, P. Habitat continuity effects on gradients of fish biomass across marine protected area boundaries. Mar. Environ. Res. 2008, 66, 536–547. [Google Scholar] [CrossRef]
- Harmelin-Vivien, M.; Le Diréach, L.; Bayle-Sempere, J.; Charbonnel, E.; García-Charton, J.A.; Ody, D.; Pérez-Ruzafa, A.; Reñones, O.; Sánchez-Jerez, P.; Valle, C. Gradients of abundance and biomass across reserve boundaries in six Mediterranean marine protected areas: Evidence of fish spillover? Biol. Conserv. 2008, 141, 1829–1839. [Google Scholar] [CrossRef]
- Goñi, R.; Adlerstein, S.; Alvarez-Berastegui, D.; Forcada, A.; Reñones, O.; Criquet, G.; Polti, S.; Cadiou, G.; Valle, C.; Lenfant, P.; et al. Spillover from six western Mediterranean marine protected areas: Evidence from artisanal fisheries. Mar. Ecol. Prog. Ser. 2008, 366, 159–174. [Google Scholar] [CrossRef]
- Di Lorenzo, M.; Claudet, J.; Guidetti, P. Spillover from marine protected areas to adjacent fisheries has an ecological and a fishery component. J. Nat. Conserv. 2016, 32, 62–66. [Google Scholar] [CrossRef]
- Allison, G.W.; Lubchenco, J.; Carr, M.H. Marine reserves are necessary but not sufficient for marine conservation. Ecol. Appl. 1998, 8, 79–92. [Google Scholar] [CrossRef]
- Terlizzi, A.; Delos, A.L.; Garaventa, F.; Faimali, M.; Geraci, S. Limited effectiveness of marine protected areas: Imposex in Hexaplex trunculus (Gastropoda, Muricidae) populations from Italian marine reserves. Mar. Poll. Bull. 2004, 48, 188–192. [Google Scholar] [CrossRef]
- Marshak, A.R.; Appeldoorn, R.S. Evaluation of seasonal closures of red hind, Epinephelus guttatus, spawning aggregations to fishing off the west coast of Puerto Rico using fishery-dependent and independent time series data. Proc. Gulf Caribb. Fisher Inst. 2007, 60, 566–572. [Google Scholar]
- Boersma, P.D.; Parrish, J.K. Limiting abuse: Marine protected areas, a limited solution. Ecol. Econ. 1999, 31, 287–304. [Google Scholar] [CrossRef]
- Hilborn, R.; Micheli, F.; De Leo, G.A. Integrating marine protected areas with catch regulation. Can. J. Fish. Aquat. Sci. 2006, 63, 642–649. [Google Scholar] [CrossRef]
- Lester, S.E.; Halpern, B.S. Biological responses in marine no-take reserves versus partially protected areas. Mar. Ecol. Prog. Ser. 2008, 367, 49–56. [Google Scholar] [CrossRef]
- Agardy, T.; Di Sciara, G.N.; Christie, P. Mind the gap: Addressing the shortcomings of marine protected areas through large scale marine spatial planning. Mar. Policy 2011, 35, 226–232. [Google Scholar] [CrossRef]
- Claudet, J.; Osenberg, C.W.; Domenici, P.; Badalamenti, F.; Milazzo, M.; Falcón, J.M.; Bertocci, I.; Benedetti-Cecchi, L.; García-Charton, J.A.; Goñi, R.; et al. Marine reserves: Fish life history and ecological traits matter. Ecol. Appl. 2010, 20, 830–839. [Google Scholar] [CrossRef]
- García-Rubies, A.; Hereu, B.; Zabala, M. Long-term recovery patterns and limited spillover of large predatory fish in a Mediterranean MPA. PLoS ONE 2013, 8, e73922. [Google Scholar] [CrossRef]
- Valentine, J.F.; Heck, K.L., Jr.; Blackmon, D.; Goecker, M.E.; Christian, J.; Kroutil, R.M.; Peterson, B.J.; Vanderklift, M.A.; Kirsch, K.D.; Beck, M. Exploited species impacts on trophic linkages along reef–seagrass interfaces in the Florida Keys. Ecol. Appl. 2008, 18, 1501–1515. [Google Scholar] [CrossRef]
- Pinnegar, J.K.; Polunin, N.V.C.; Francour, P.; Badalamenti, F.; Chemello, R.; Harmelin-Vivien, M.L.; Hereu, B.; Milazzo, M.; Zabala, M.; D’anna, G.; et al. Trophic cascades in benthic marine ecosystems: Lessons for fisheries and protected-area management. Environ. Conserv. 2000, 27, 179–200. [Google Scholar] [CrossRef]
- Shears, N.T.; Babcock, R.C. Continuing trophic cascade effects after 25 years of no-take marine reserve protection. Mar. Ecol. Prog. Ser. 2003, 246, 1–16. [Google Scholar] [CrossRef]
- Shears, N.T.; Babcock, R.C. Marine reserves demonstrate top-down control of community structure on temperate reefs. Oecologia 2002, 132, 131–142. [Google Scholar] [CrossRef]
- Guidetti, P.; Sala, E. Community-wide effects of marine reserves in the Mediterranean Sea. Mar. Ecol. Prog. Ser. 2007, 335, 43–56. [Google Scholar] [CrossRef]
- Sullivan, D.O.; Emmerson, M. Marine reserve designation, trophic cascades and altered community dynamics. Mar. Ecol. Prog. Ser. 2011, 440, 115–125. [Google Scholar] [CrossRef]
- Babcock, R.C.; Shears, N.T.; Alcala, A.C.; Barrett, N.S.; Edgar, G.J.; Lafferty, K.D.; McClanahan, T.R.; Russ, G.R. Decadal trends in marine reserves reveal differential rates of change in direct and indirect effects. Proc. Natl. Acad. Sci. USA 2010, 107, 18256–18261. [Google Scholar] [CrossRef]
- Castilla, J.C. Coastal marine communities: Trends and perspectives from human-exclusion experiments. Trends Ecol. Evol. 1999, 14, 280–283. [Google Scholar] [CrossRef]
- Rick, T.C.; Erlandson, J.M. Coastal exploitation. Science 2009, 325, 952–953. [Google Scholar] [CrossRef]
- Smith, S.D.; Rule, M.J.; Harrison, M.; Dalton, S.J. Monitoring the sea change: Preliminary assessment of the conservation value of nearshore reefs, and existing impacts, in a high-growth, coastal region of subtropical eastern Australia. Mar. Poll. Bull. 2008, 56, 525–534. [Google Scholar] [CrossRef]
- Montefalcone, M.; Parravicini, V.; Vacchi, M.; Albertelli, G.; Ferrari, M.; Morri, C.; Bianchi, C.N. Human influence on seagrass habitat fragmentation in NW Mediterranean Sea. Estuar Coast. Shelf S 2010, 86, 292–298. [Google Scholar] [CrossRef]
- Seytre, C.; Francour, P. A long-term survey of Posidonia oceanica fish assemblages in a Mediterranean marine protected area: Emphasis on stability and no-take area effectiveness. Mar. Freshw. Res. 2014, 65, 244–254. [Google Scholar] [CrossRef]
- Werner-Hackradt, C.; García-Charton, J.A.; Harmelin-Vivien, M.; Perez-Ruzafa, A.; Le Direach, L.; Bayle-Sempere, J.; Charbonnel, E.; Ody, D.; Renones, O.; Sanchez-Jerez, P.; et al. Response of rocky reef top predators (Serranidae: Epinephelinae) in and around marine protected areas in the Western Mediterranean Sea. PLoS ONE 2014, 9, e98206. [Google Scholar]
- Valle, C.; Bayle-Sempere, J.T. Effects of a marine protected area on fish assemblage associated with Posidonia oceanica seagrass beds: Temporal and depth variations. J. Appl. Ichthyol. 2009, 25, 537–544. [Google Scholar] [CrossRef]
- Villamor, A.; Becerro, M.A. Species, trophic, and functional diversity in marine protected and non-protected areas. J. Sea Res. 2012, 73, 109–116. [Google Scholar] [CrossRef]
- Fraschetti, S.; Guarnieri, G.; Bevilacqua, S.; Terlizzi, A.; Boero, F. Protection enhances community and habitat stability: Evidence from a Mediterranean Marine Protected Area. PLoS ONE 2013, 8, e81838. [Google Scholar] [CrossRef]
- García-Charton, J.A.; Ruzafa, Á.P. Ecological heterogeneity and the evaluation of the effects of marine reserves. Fish. Res. 1999, 42, 1–20. [Google Scholar] [CrossRef]
- Ojeda-Martínez, C.; Bayle-Sempere, J.T.; Sanchez-Jerez, P.; Forcada, A.; Valle, C. Detecting conservation benefits in spatially protected fish populations with meta-analysis of long-term monitoring data. Mar. Biol. 2007, 151, 1153–1161. [Google Scholar] [CrossRef]
- Stoms, D.M.; Davis, F.W.; Andelman, S.J.; Carr, M.H.; Gaines, S.D.; Halpern, B.S.; Hoenicke, R.; Leibowitz, S.G.; Leydecker, A.; Madin, E.M.; et al. Integrated coastal reserve planning: Making the land–sea connection. Front. Ecol. Environ. 2005, 3, 429–436. [Google Scholar]
- Klein, C.J.; Tulloch, V.J.; Halpern, B.S.; Selkoe, K.A.; Watts, M.E.; Steinback, C.; Scholz, A.; Possingham, H.P. Tradeoffs in marine reserve design: Habitat condition, representation, and socioeconomic costs. Conserv. Lett. 2013, 6, 324–332. [Google Scholar] [CrossRef]
- Moranta, J.; Palmer, M.; Morey, G.; Ruiz, A.; Morales-Nin, B. Multi-scale spatial variability in fish assemblages associated with Posidonia oceanica meadows in the Western Mediterranean Sea. Estuar. Coast. Shelf S 2006, 68, 579–592. [Google Scholar] [CrossRef]
- Rodríguez-Rodríguez, D.; Rodríguez, J.; Malak, D.A.; Nastasi, A.; Hernández, P. Marine protected areas and fisheries restricted areas in the Mediterranean: Assessing “actual” marine biodiversity protection coverage at multiple scales. Mar. Policy 2016, 64, 24–30. [Google Scholar] [CrossRef]
- García-Charton, J.A.; Pérez-Ruzafa, A.; Sánchez-Jerez, P.; Bayle-Sempere, J.T.; Reñones, O.; Moreno, D. Multi-scale spatial heterogeneity, habitat structure, and the effect of marine reserves on Western Mediterranean rocky reef fish assemblages. Mar. Biol. 2004, 144, 161–182. [Google Scholar] [CrossRef]
- Francour, P. Evolution spatio-temporelle à long terme des peuplements de poissons des herbiers à Posidonia oceanica de la réserve naturelle de Scandola (Corse, Méditerranée nord-occidentale). Cybium 2000, 24, 85–95. [Google Scholar]
- Shears, N.T.; Grace, R.V.; Usmar, N.R.; Kerr, V.; Babcock, R.C. Long-term trends in lobster populations in a partially protected vs. no-take Marine Park. Biol. Conserv. 2006, 132, 222–231. [Google Scholar] [CrossRef]
- Vázquez-Luis, M.; Guerra-García, J.M.; Sanchez-Jerez, P.; Bayle-Sempere, J.T. Caprellid assemblages (Crustacea: Amphipoda) in shallow waters invaded by Caulerpa racemosa var. cylindracea from southeastern Spain. Helgol. Mar. Res. 2009, 63, 107. [Google Scholar] [CrossRef]
- Ramos, A.A. La reserva marina de la Isla Plana o Núeva Tabarca (Alicante); Universidad de Alicante: Alicante, Spain, 1985. [Google Scholar]
- Ramos-Esplá, A.A. La Reserva Marina de la Isla de Tabarca, una realidad después de un sueño. Canelobre 2012, 60, 284–297. [Google Scholar]
- Gillanders, B.M.; Sanchez-Jerez, P.; Bayle-Sempere, J.; Ramos-Espla, A. Trace elements in otoliths of the two-banded bream from a coastal region in the south-west Mediterranean: Are there differences among locations? J. Fish. Biol. 2001, 59, 350–363. [Google Scholar] [CrossRef]
- Bayle-Sempere, J.T.; Ramos-Esplá, A.A.; García Charton, J.A. Intra-annual variability of an artificial reef fish assemblage in the marine reserve of Tabarca (Alicante, Spain, SW Mediterranean). Bull. Mar. Sci. 1994, 55, 824–835. [Google Scholar]
- Forcada, A.; Valle, C.; Sánchez-Lizaso, J.L.; Bayle-Sempere, J.T.; Corsi, F. Structure and spatio-temporal dynamics of artisanal fisheries around a Mediterranean marine protected area. ICES J. Mar. Sci. 2010, 67, 191–203. [Google Scholar] [CrossRef]
- Ramos-Espla, A.A.; McNeill, S.E. The status of marine conservation in Spain. Ocean. Coast. Manag. 1994, 24, 125–138. [Google Scholar] [CrossRef]
- González, E.; Arconada, B.; Delgado, P.; Alcaraz, A.; Álvarez, A.; Antequera, M.; Fernández, Y.; Garrote, A.; De Rico, S.; Salete, E.; et al. Environmental research on brine discharge optimization: A case study approach. Desalin Water Treat. 2011, 31, 197–205. [Google Scholar] [CrossRef]
- Palazón, A.; Aragonés, L.; López, I. Evaluation of coastal management: Study case in the province of Alicante, Spain. Sci. Total Environ. 2016, 572, 1184–1194. [Google Scholar] [CrossRef]
- Schrandt, M.N.; Cebrián, J.; Darrow, E.S.; Dalrymple, D.J.; Marco-Méndez, C.; Ferrero-Vicente, L.M.; Heck Jr, K.L.; Sánchez-Lizaso, J.L. Evidence of short-term burial response by benthic macrofauna associated with the Mediterranean seagrass Cymodocea nodosa. Cienc. Mar. 2015, 41, 33–47. [Google Scholar] [CrossRef]
- González-Correa, J.M.; Fernández-Torquemada, Y.; Sánchez-Lizaso, J.L. Long-term effect of beach replenishment on natural recovery of shallow Posidonia oceanica meadows. Estuar Coast. Shelf S. 2008, 76, 834–844. [Google Scholar] [CrossRef]
- De-la-Ossa-Carretero, J.A.; Del-Pilar-Ruso, Y.; Giménez-Casalduero, F. Sánchez-Lizaso, J.L. Amphipoda assemblages in a disturbed area (Alicante, Spain, Western Mediterranean). Mar. Ecol. 2016, 37, 503–517. [Google Scholar] [CrossRef]
- García-Rivera, S.; Sánchez Lizaso, J.L.; Bellido Millán, J.M. Composition, spatial distribution and sources of macro-marine litter on the Gulf of Alicante seafloor (Spanish Mediterranean). Mar. Poll. Bull. 2017, 121, 249–259. [Google Scholar] [CrossRef]
- Rubio-Portillo, E.; Izquierdo-Muñoz, A.; Gago, J.F.; Rosselló-Mora, R.; Antón, J.; Ramos-Esplá, A.A. Effects of the 2015 heat wave on benthic invertebrates in the Tabarca Marine Protected Area (southeast Spain). Mar. Environ. Res. 2016, 122, 135–142. [Google Scholar] [CrossRef]
- Rodríguez-Rodríguez, D. Rapid assessment of protection and ecological effectiveness of the Spanish Fishing Reserve Network. Mar. Policy 2018, 90, 29–36. [Google Scholar] [CrossRef]
- Zar, J.H. Biostatistical Analysis, 3rd ed.; Prentice Hall: Upper Saddle River, NJ, USA, 1996. [Google Scholar]
- Abdi, H.; Williams, L.J. Newman-Keuls test. In Encyclopedia of Research Design; Sage: Thousand Oaks, CA, USA, 2010; pp. 1–11. [Google Scholar]
- Eggleston, D.B. Recruitment in Nassau grouper Epinephelus striatus: Post-Settlement abundance, microhabitat features, and ontogenetic habitat shifts. Mar. Ecol. Prog. Ser. 1995, 124, 9–22. [Google Scholar] [CrossRef]
- McShane, P.E.; Naylor, J.R. Small-scale spatial variation in growth, size at maturity, and yield-and egg-per-recruit relations in the New Zealand abalone Haliotis iris. N. Zeal. J. Mar. Fresh 1995, 29, 603–612. [Google Scholar] [CrossRef]
- Hammer, Ø.; Harper, D.A.; Ryan, P.D. PAST: Paleontological statistics software package for education and data analysis. Palaeontol. Electron. 2001, 4, 9. [Google Scholar]
- Horinouchi, M.; Tongnunui, P.; Nanjyo, K.; Nakamura, Y.; Sano, M.; Ogawa, H. Differences in fish assemblage structures between fragmented and continuous seagrass beds in Trang, southern Thailand. Fish. Sci. 2009, 75, 1409–1416. [Google Scholar] [CrossRef]
- Grober-Dunsmore, R.; Frazer, T.K.; Beets, J.P.; Lindberg, W.J.; Zwick, P.; Funicelli, N.A. Influence of landscape structure on reef fish assemblages. Landsc. Ecol. 2008, 23, 37–53. [Google Scholar] [CrossRef]
- Fernández, T.V.; D’anna, G.; Badalamenti, F.; Pérez-Ruzafa, A. Habitat connectivity as a factor affecting fish assemblages in temperate reefs. Aquat. Biol. 2008, 1, 239–248. [Google Scholar] [CrossRef]
- García-Charton, J.G.; Ruzafa, A.P. Correlation between habitat structure and a rocky reef fish assemblage in the southwest Mediterranean. Mar. Ecol. 1998, 19, 111–128. [Google Scholar] [CrossRef]
- Giakoumi, S.; Kokkoris, G.D. Effects of habitat and substrate complexity on shallow sublittoral fish assemblages in the Cyclades Archipelago, North-eastern Mediterranean Sea. Mediterr. Mar. Sci. 2013, 14, 58–68. [Google Scholar] [CrossRef]
- Guidetti, P. Differences among fish assemblages associated with nearshore Posidonia oceanica seagrass beds, rocky–algal reefs and unvegetated sand habitats in the Adriatic Sea. Estuar Coast. Shelf S 2000, 50, 515–529. [Google Scholar] [CrossRef]
- Rodrigues, D.; Horta e Costa, B.; Cabral, H.N.; Gonçalves, E.J. Habitat associations and behavioural patterns of Symphodus spp. (Pisces: Labridae). Acta Ethol. 2015, 18, 269–282. [Google Scholar] [CrossRef]
- Bonaca, M.O.; Lipej, L. Factors affecting habitat occupancy of fish assemblage in the Gulf of Trieste (Northern Adriatic Sea). Mar. Ecol. 2005, 26, 42–53. [Google Scholar] [CrossRef]
- Claudet, J.; Fraschetti, S. Human-driven impacts on marine habitats: A regional meta-analysis in the Mediterranean Sea. Biol. Conserv. 2010, 143, 2195–2206. [Google Scholar] [CrossRef]
- Sala, E.; Ballesteros, E.; Dendrinos, P.; Di Franco, A.; Ferretti, F.; Foley, D.; Fraschetti, S.; Friedlander, A.; Garrabou, J.; Güçlüsoy, H.; et al. The structure of Mediterranean rocky reef ecosystems across environmental and human gradients, and conservation implications. PLoS ONE 2012, 7, e32742. [Google Scholar] [CrossRef]
- Del-Pilar-Ruso, Y.; De-la-Ossa-Carretero, J.A.; Loya-Fernández, A.; Ferrero-Vicente, L.M.; Giménez-Casalduero, F.; Sánchez-Lizaso, J.L. Assessment of soft-bottom Polychaeta assemblage affected by a spatial confluence of impacts: Sewage and brine discharges. Mar. Poll. Bull. 2009, 58, 765–786. [Google Scholar]
- PRC (Policy Research Corporation). Final report. Exploring the potential of Maritime Spatial Planning in the Mediterranean Sea. Framework contract FISH/2007/04 Specific contract No. 6 February 2011. 2011, p. 123. Available online: https://www.msp-platform.eu/sites/default/files/msp-med_final_report_en.pdf (accessed on 1 May 2020).
- World Bank. World Bank Open Data. 2020. Available online: https://data.worldbank.org/ (accessed on 22 February 2020).
- Correa, J.M.G.; Sempere, J.T.B.; Juanes, F.; Rountree, R.; Ruíz, J.F.; Ramis, J. Recreational boat traffic effects on fish assemblages: First evidence of detrimental consequences at regulated mooring zones in sensitive marine areas detected by passive acoustics. Ocean. Coast. Manag. 2019, 168, 22–34. [Google Scholar] [CrossRef]
- Galil, B.S. Alien species in the Mediterranean Sea—which, when, where, why? Hydrobiologia 2008, 606, 105–116. [Google Scholar] [CrossRef]
- Rubio -Portillo, E.; Vázquez -Luis, M.; Valle, C.; Izquierdo -Muñoz, A.; Ramos -Esplá, A.A. Growth and bleaching of the coral Oculina patagonica under different environmental conditions in the western Mediterranean Sea. Mar. Biol. 2014, 161, 2333–2343. [Google Scholar] [CrossRef]
- Fogarty, M.J.; Murawski, S.A. Large-scale disturbance and the structure of marine systems: Fishery impacts on Georges Bank. Ecol. Appl. 1998, 8, S6–S22. [Google Scholar] [CrossRef]
- Sardá, R.; Requena, S.; Dominguez-Carrió, C.; Gili, J.M. Ecosystem-Based Management for Marine Protected Areas: A Systematic Approach. In Management of Marine Protected Areas: A Network Perspective; Goriup, P.D., Ed.; John Wiley & Sons: Sussex, UK, 2017; pp. 145–162. [Google Scholar]
- Ballesteros, M.; Chapela, R.; Ramírez-Monsalve, P.; Raakjaer, J.; Hegland, T.J.; Nielsen, K.N.; Laksá, U.; Degnbol, P. Do not shoot the messenger: ICES advice for an ecosystem approach to fisheries management in the European Union. ICES J. Mar. Sci. 2018, 75, 519–530. [Google Scholar] [CrossRef]
- Rudd, M.A.; Dickey-Collas, M.; Ferretti, J.; Johannesen, E.; Macdonald, N.M.; McLaughlin, R.; Rae, M.; Thiele, T.; Link, J.S. Ocean ecosystem-based management mandates and implementation in the North Atlantic. Front. Mar. Sci. 2018, 5, 485. [Google Scholar] [CrossRef]
- Hilborn, R.; Amoroso, R.O.; Anderson, C.M.; Baum, J.K.; Branch, T.A.; Costello, C.; de Moor, C.L.; Faraj, A.; Hively, D.; Jensen, O.P.; et al. Effective fisheries management instrumental in improving fish stock status. Proc. Nat. Acad. Sci. USA 2020, 117, 2218–2224. [Google Scholar] [CrossRef]
- Sánchez-Lizaso, J.L.; Sola Macia, I.; Guijarro-García, E.; Bellido Millán, J.M.; Franquesa, R. A new management framework for western Mediterranean demersal fisheries. Mar. Policy 2020, 112, 103772. [Google Scholar] [CrossRef]
© 2020 by the authors. Licensee MDPI, Basel, Switzerland. This article is an open access article distributed under the terms and conditions of the Creative Commons Attribution (CC BY) license (http://creativecommons.org/licenses/by/4.0/).