A Performance Prediction Model for Pumps as Turbines (PATs)


 , and
, and
Abstract
1. Introduction
2. Data Available
3. Performance Prediction of a PAT
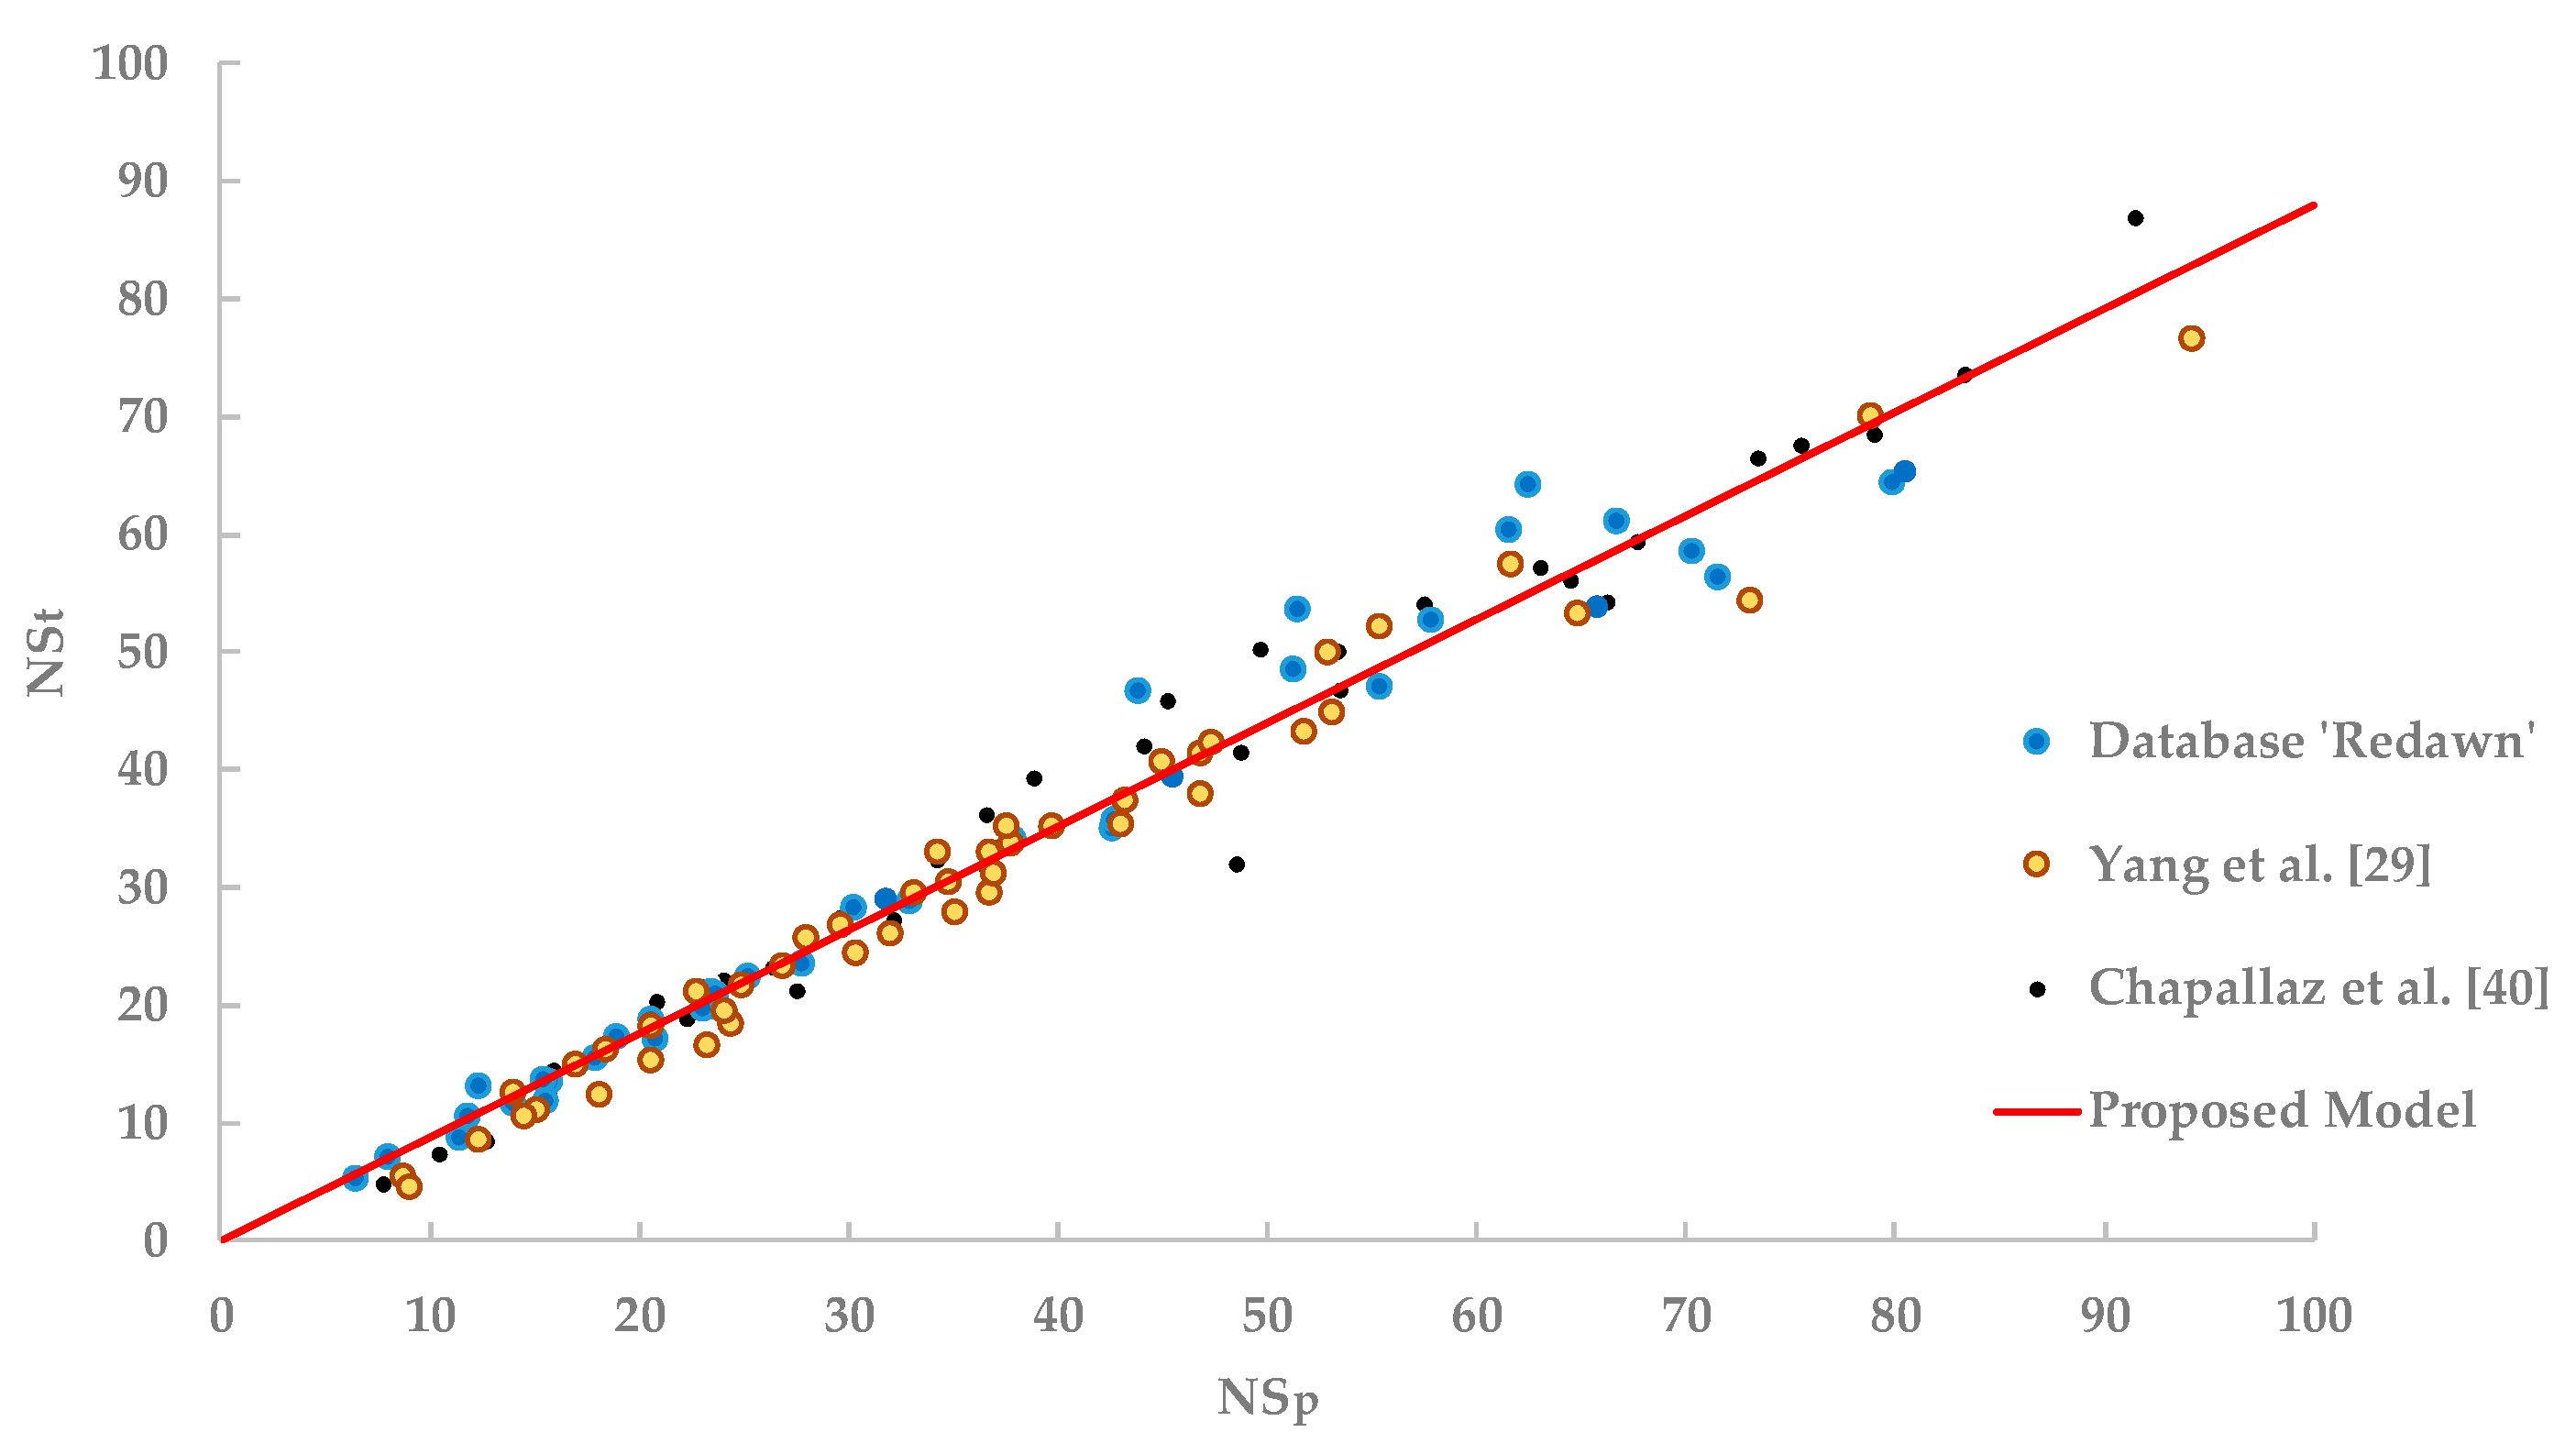
3.1. Specific Speed
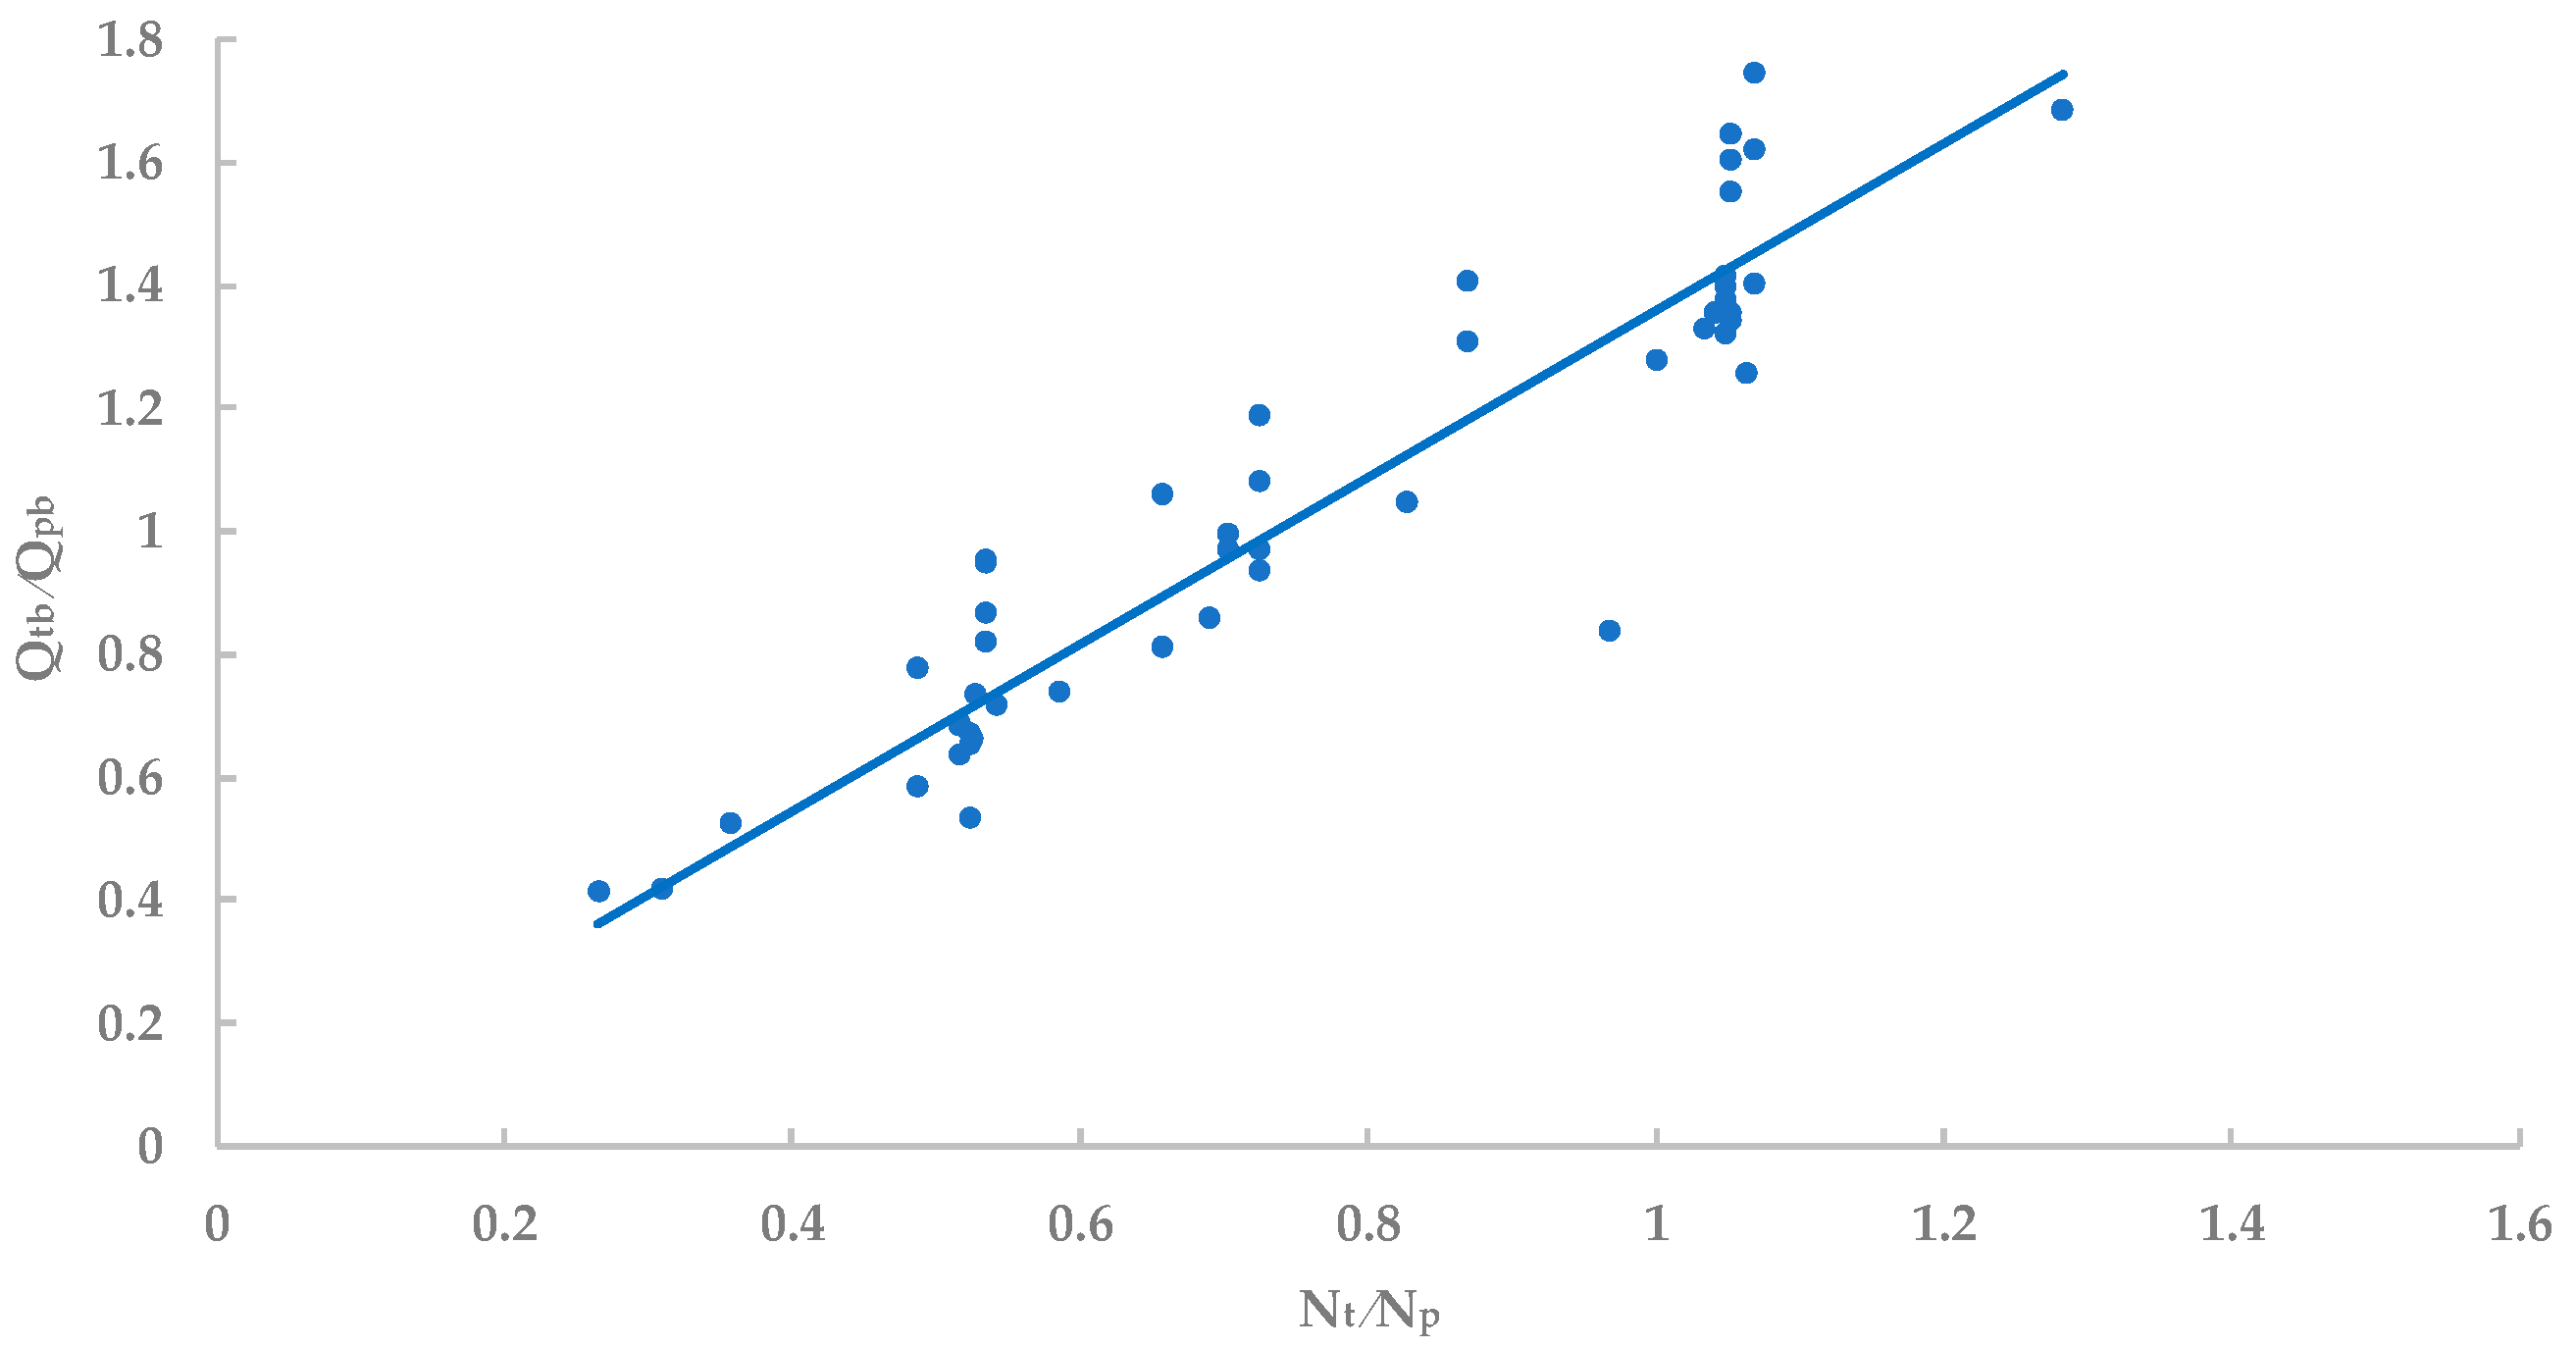
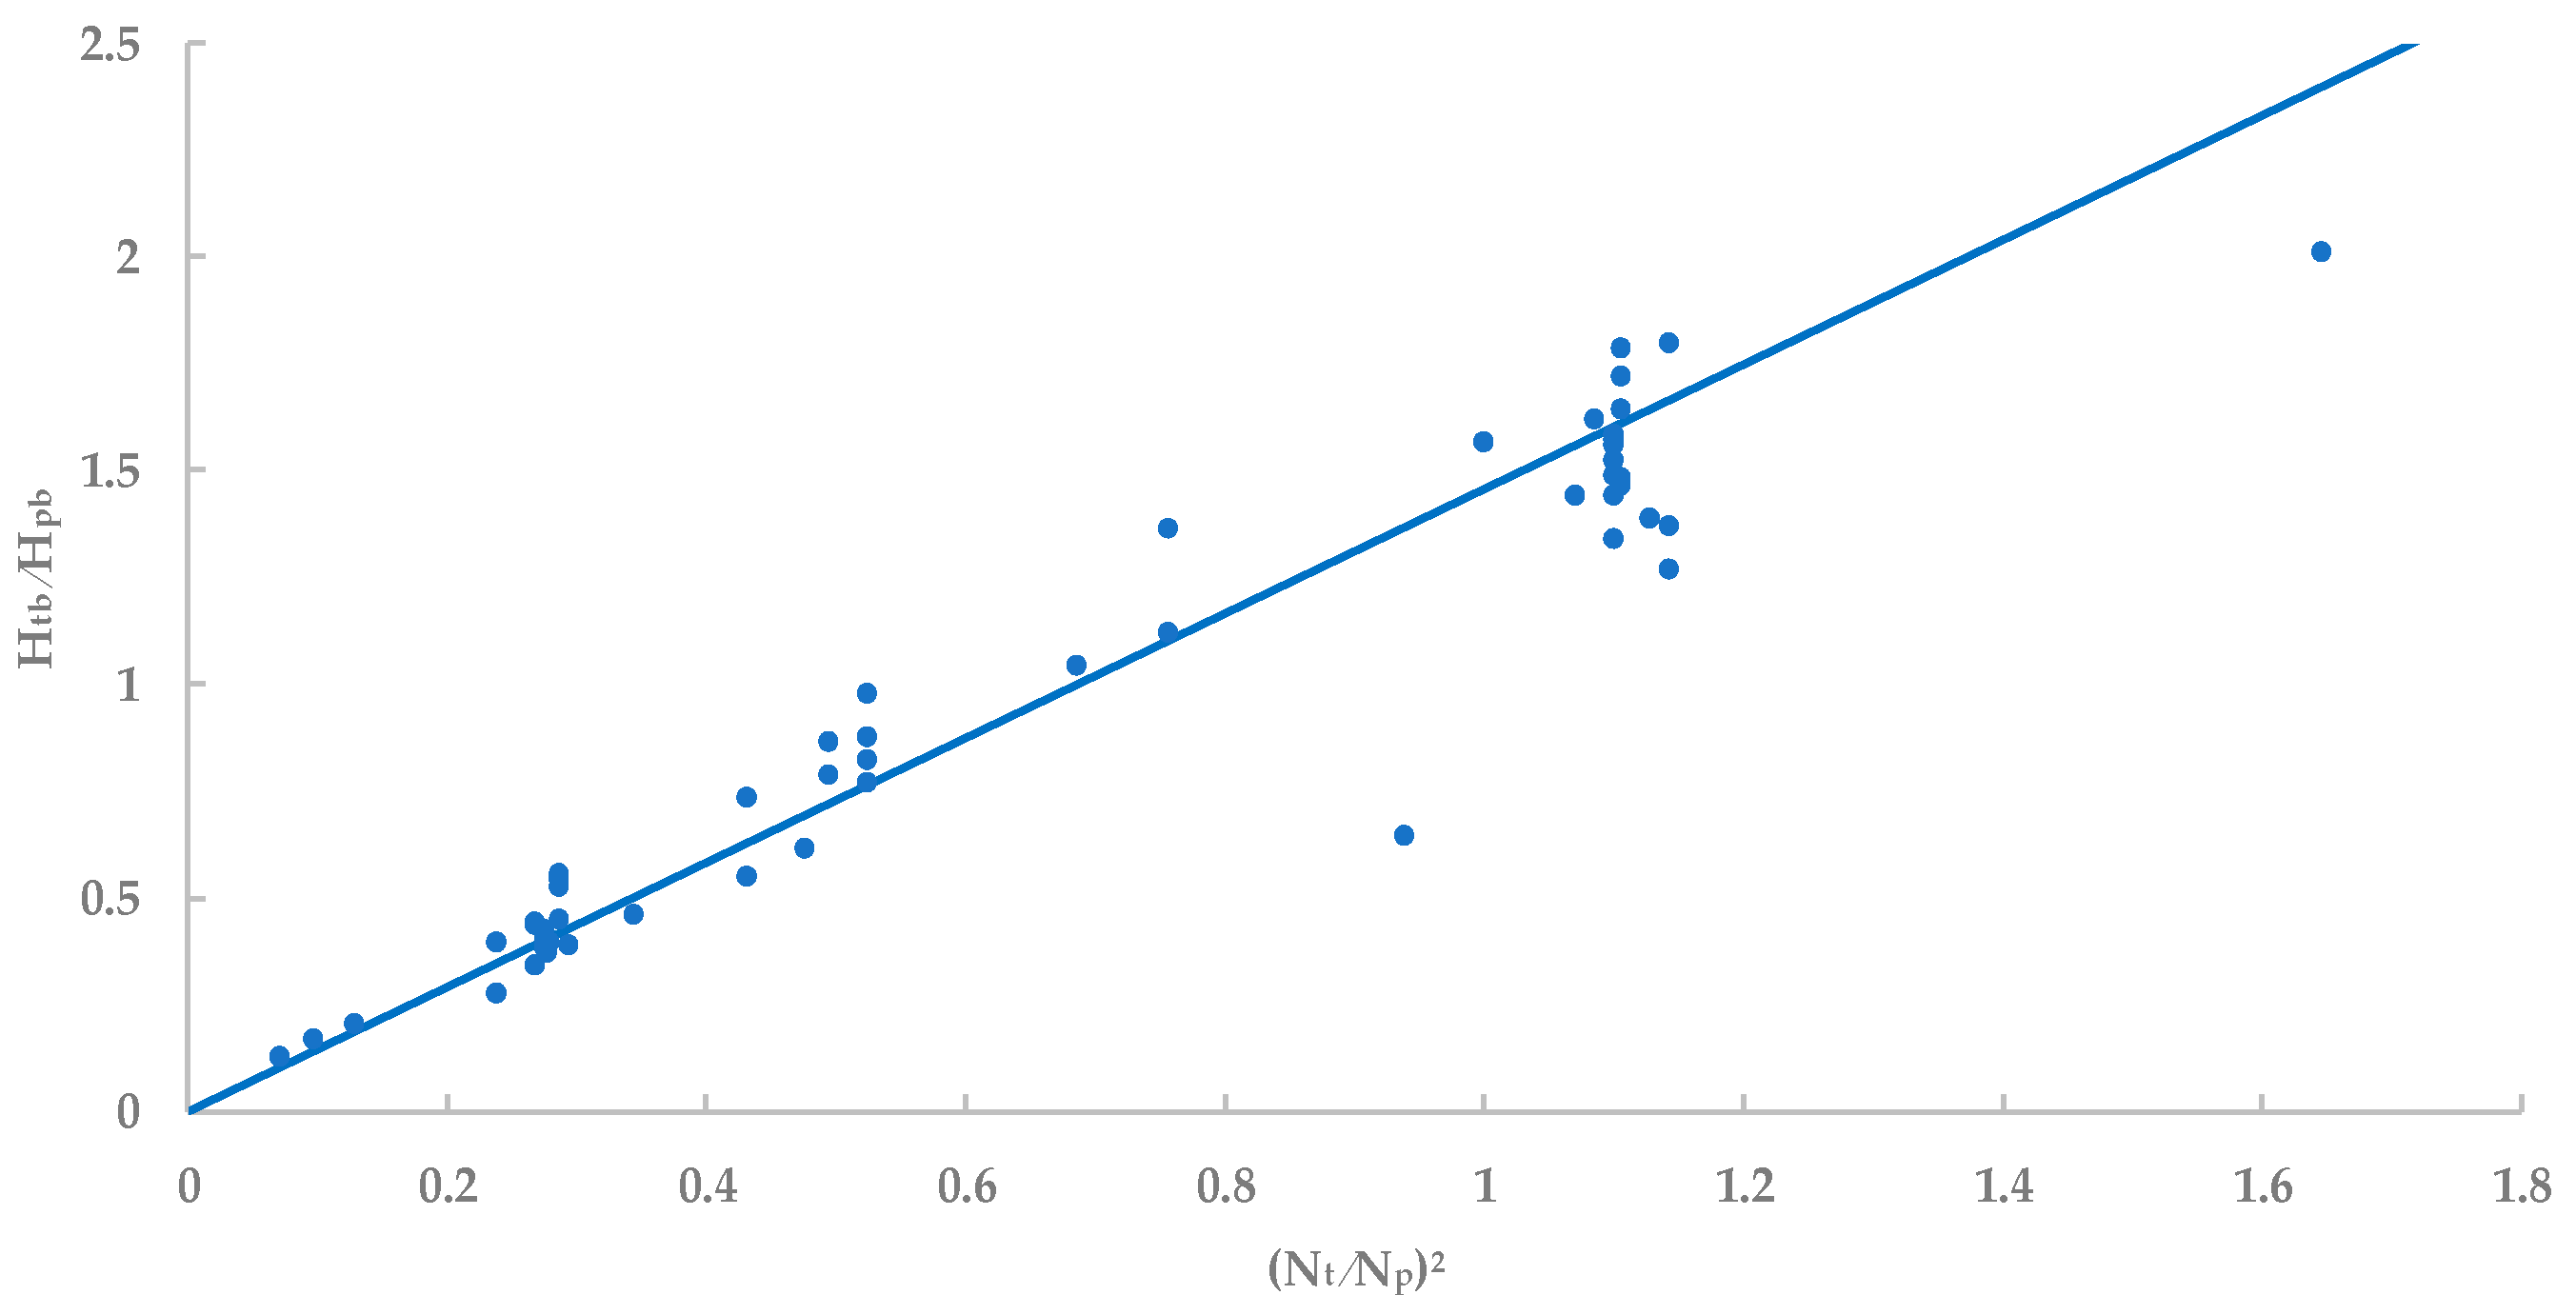
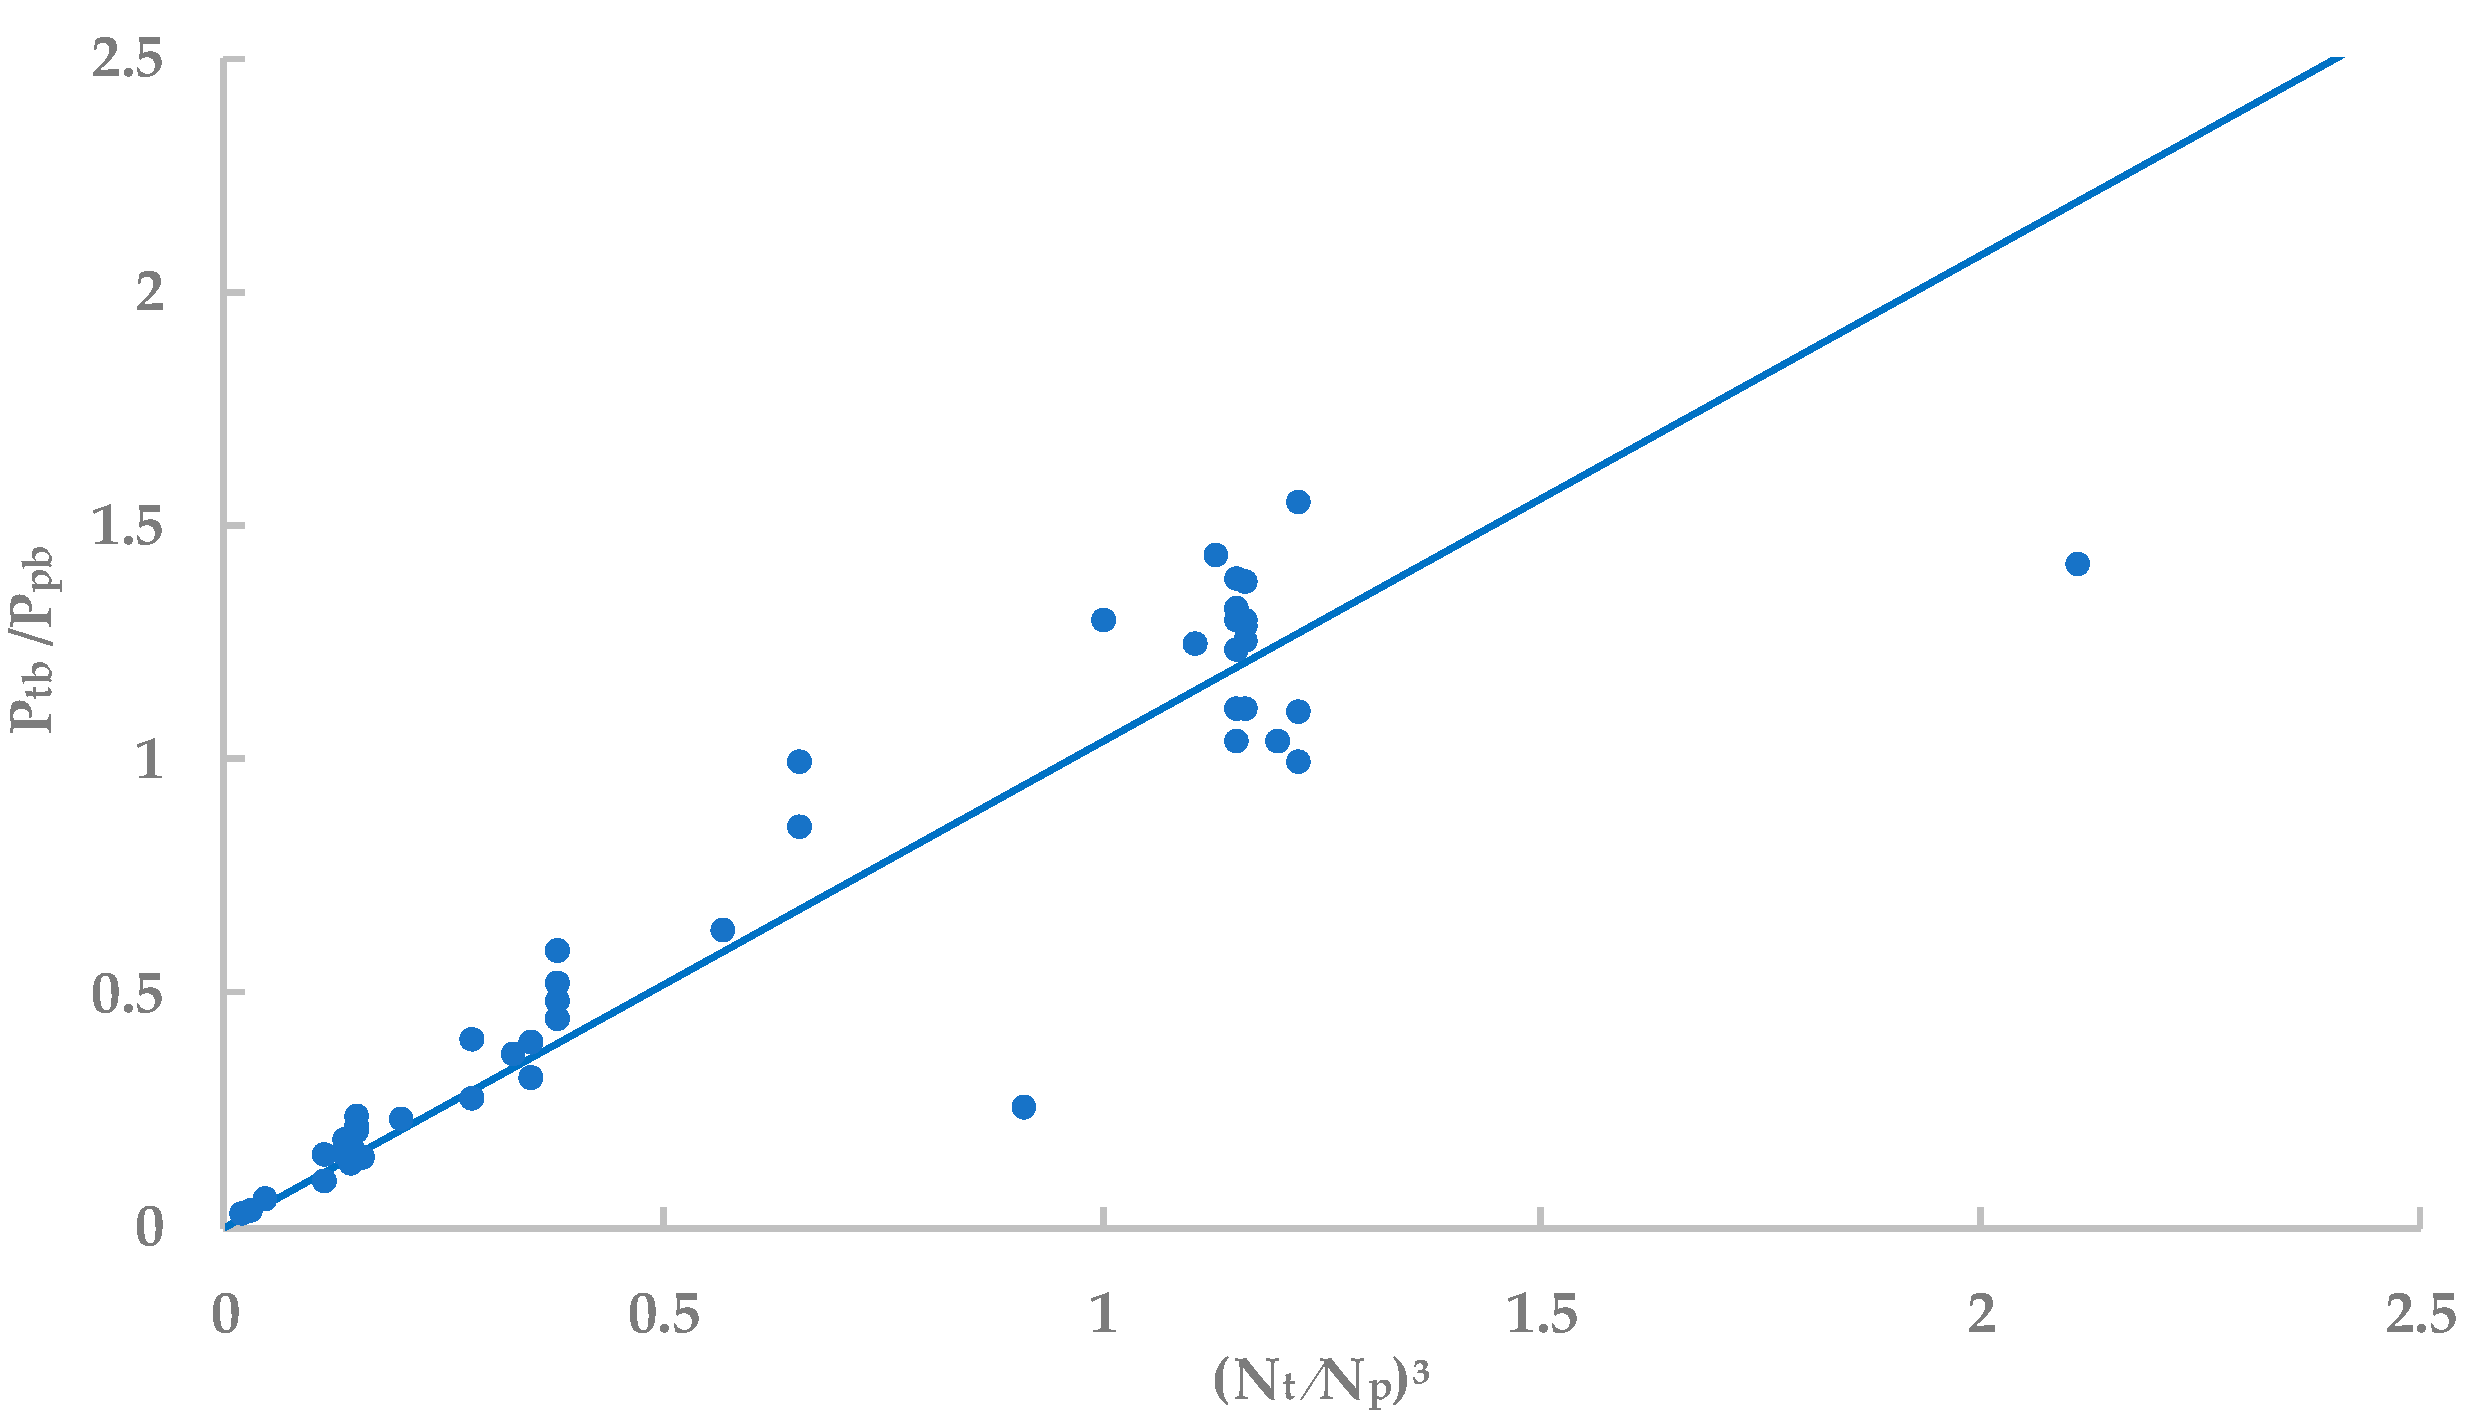
3.2. BEP Performance
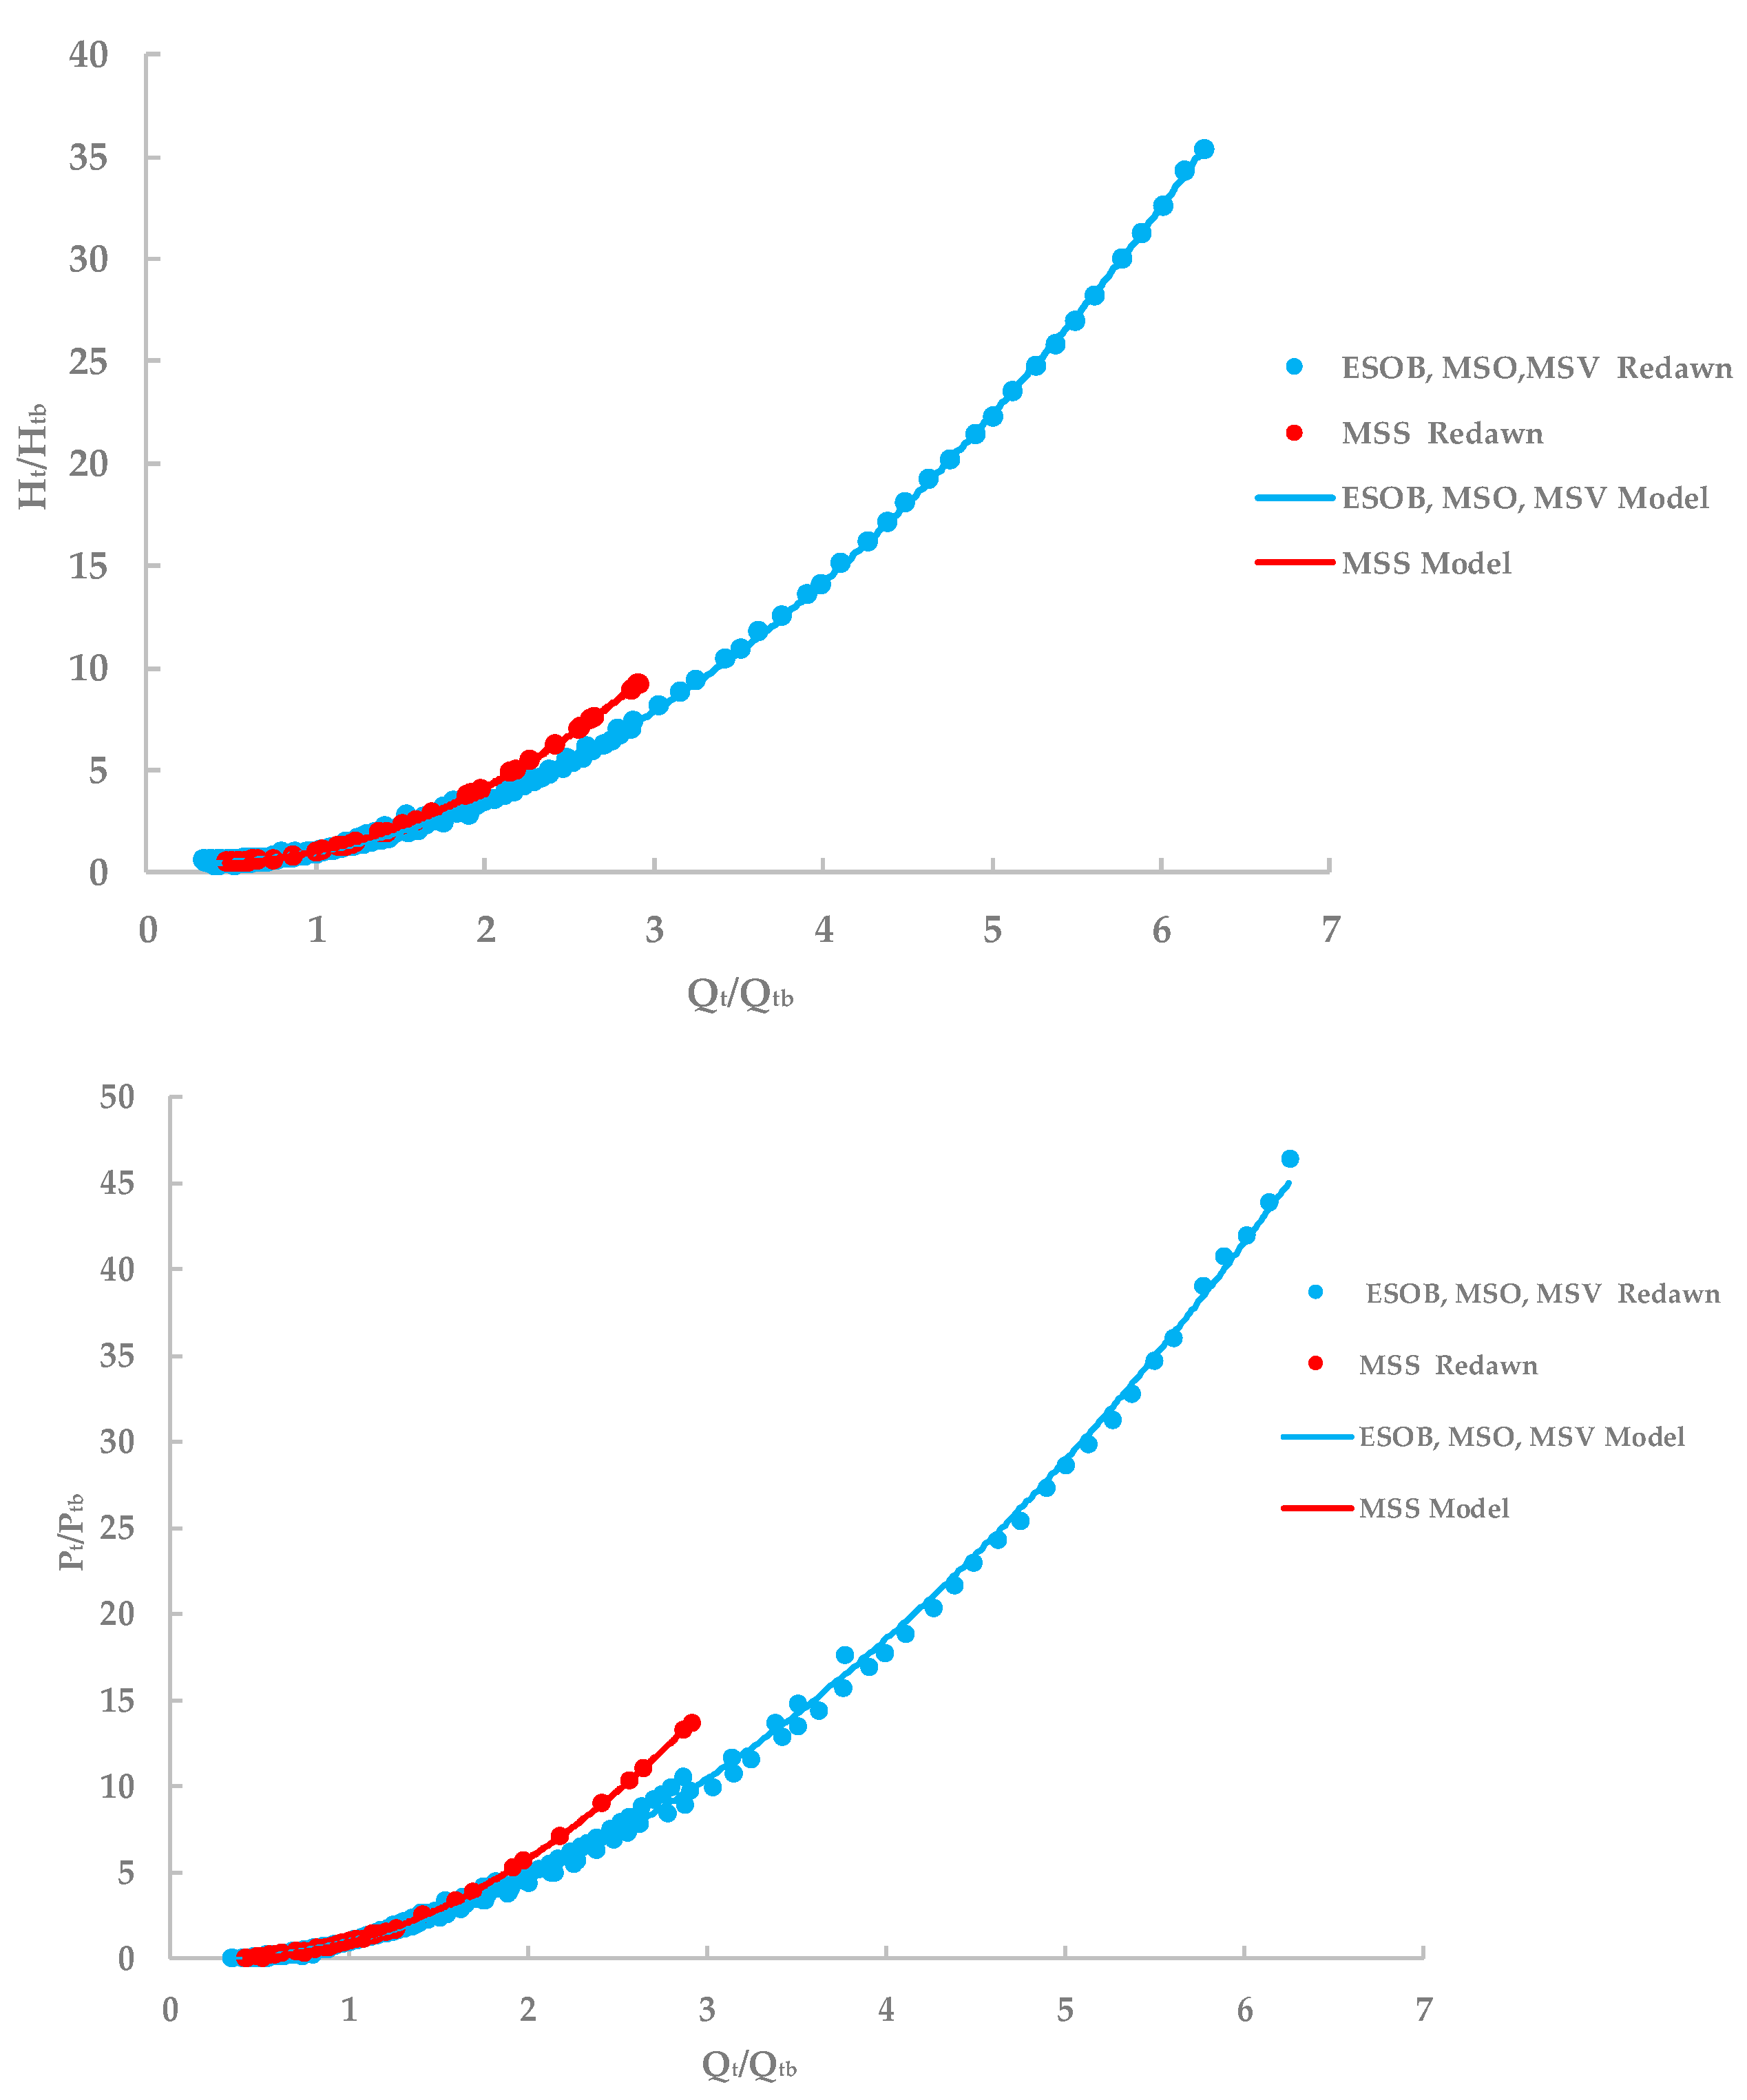
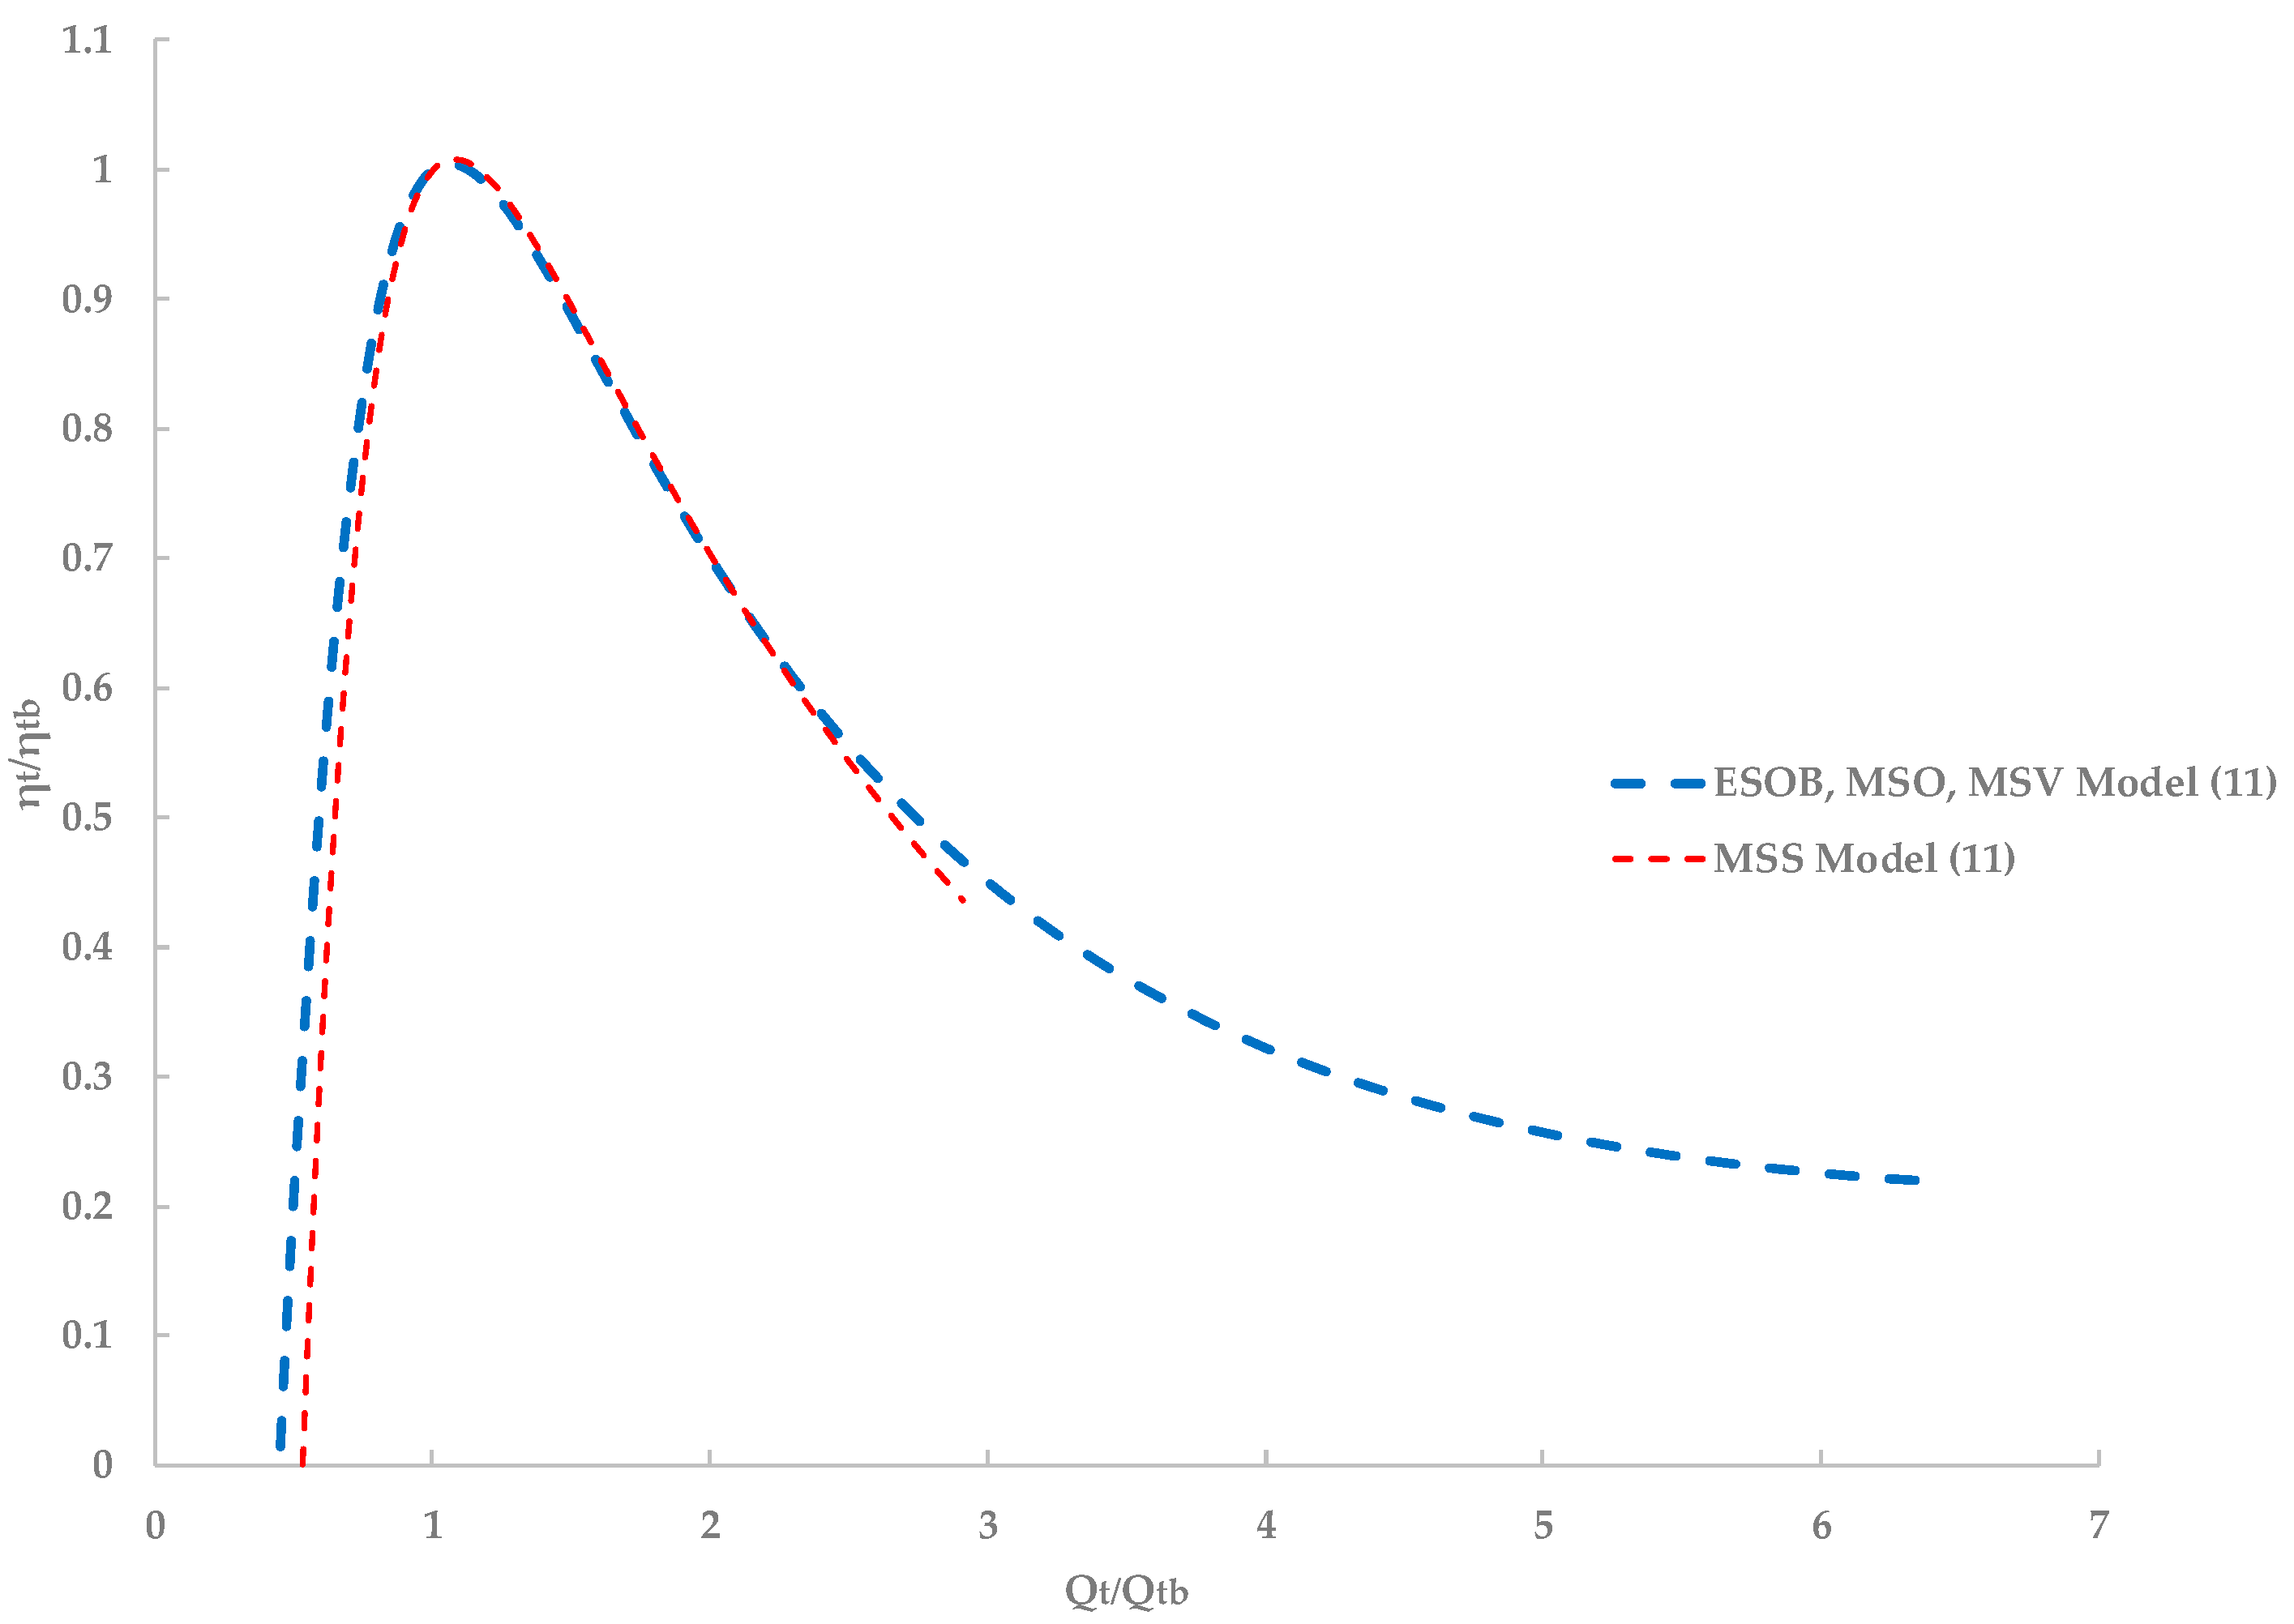
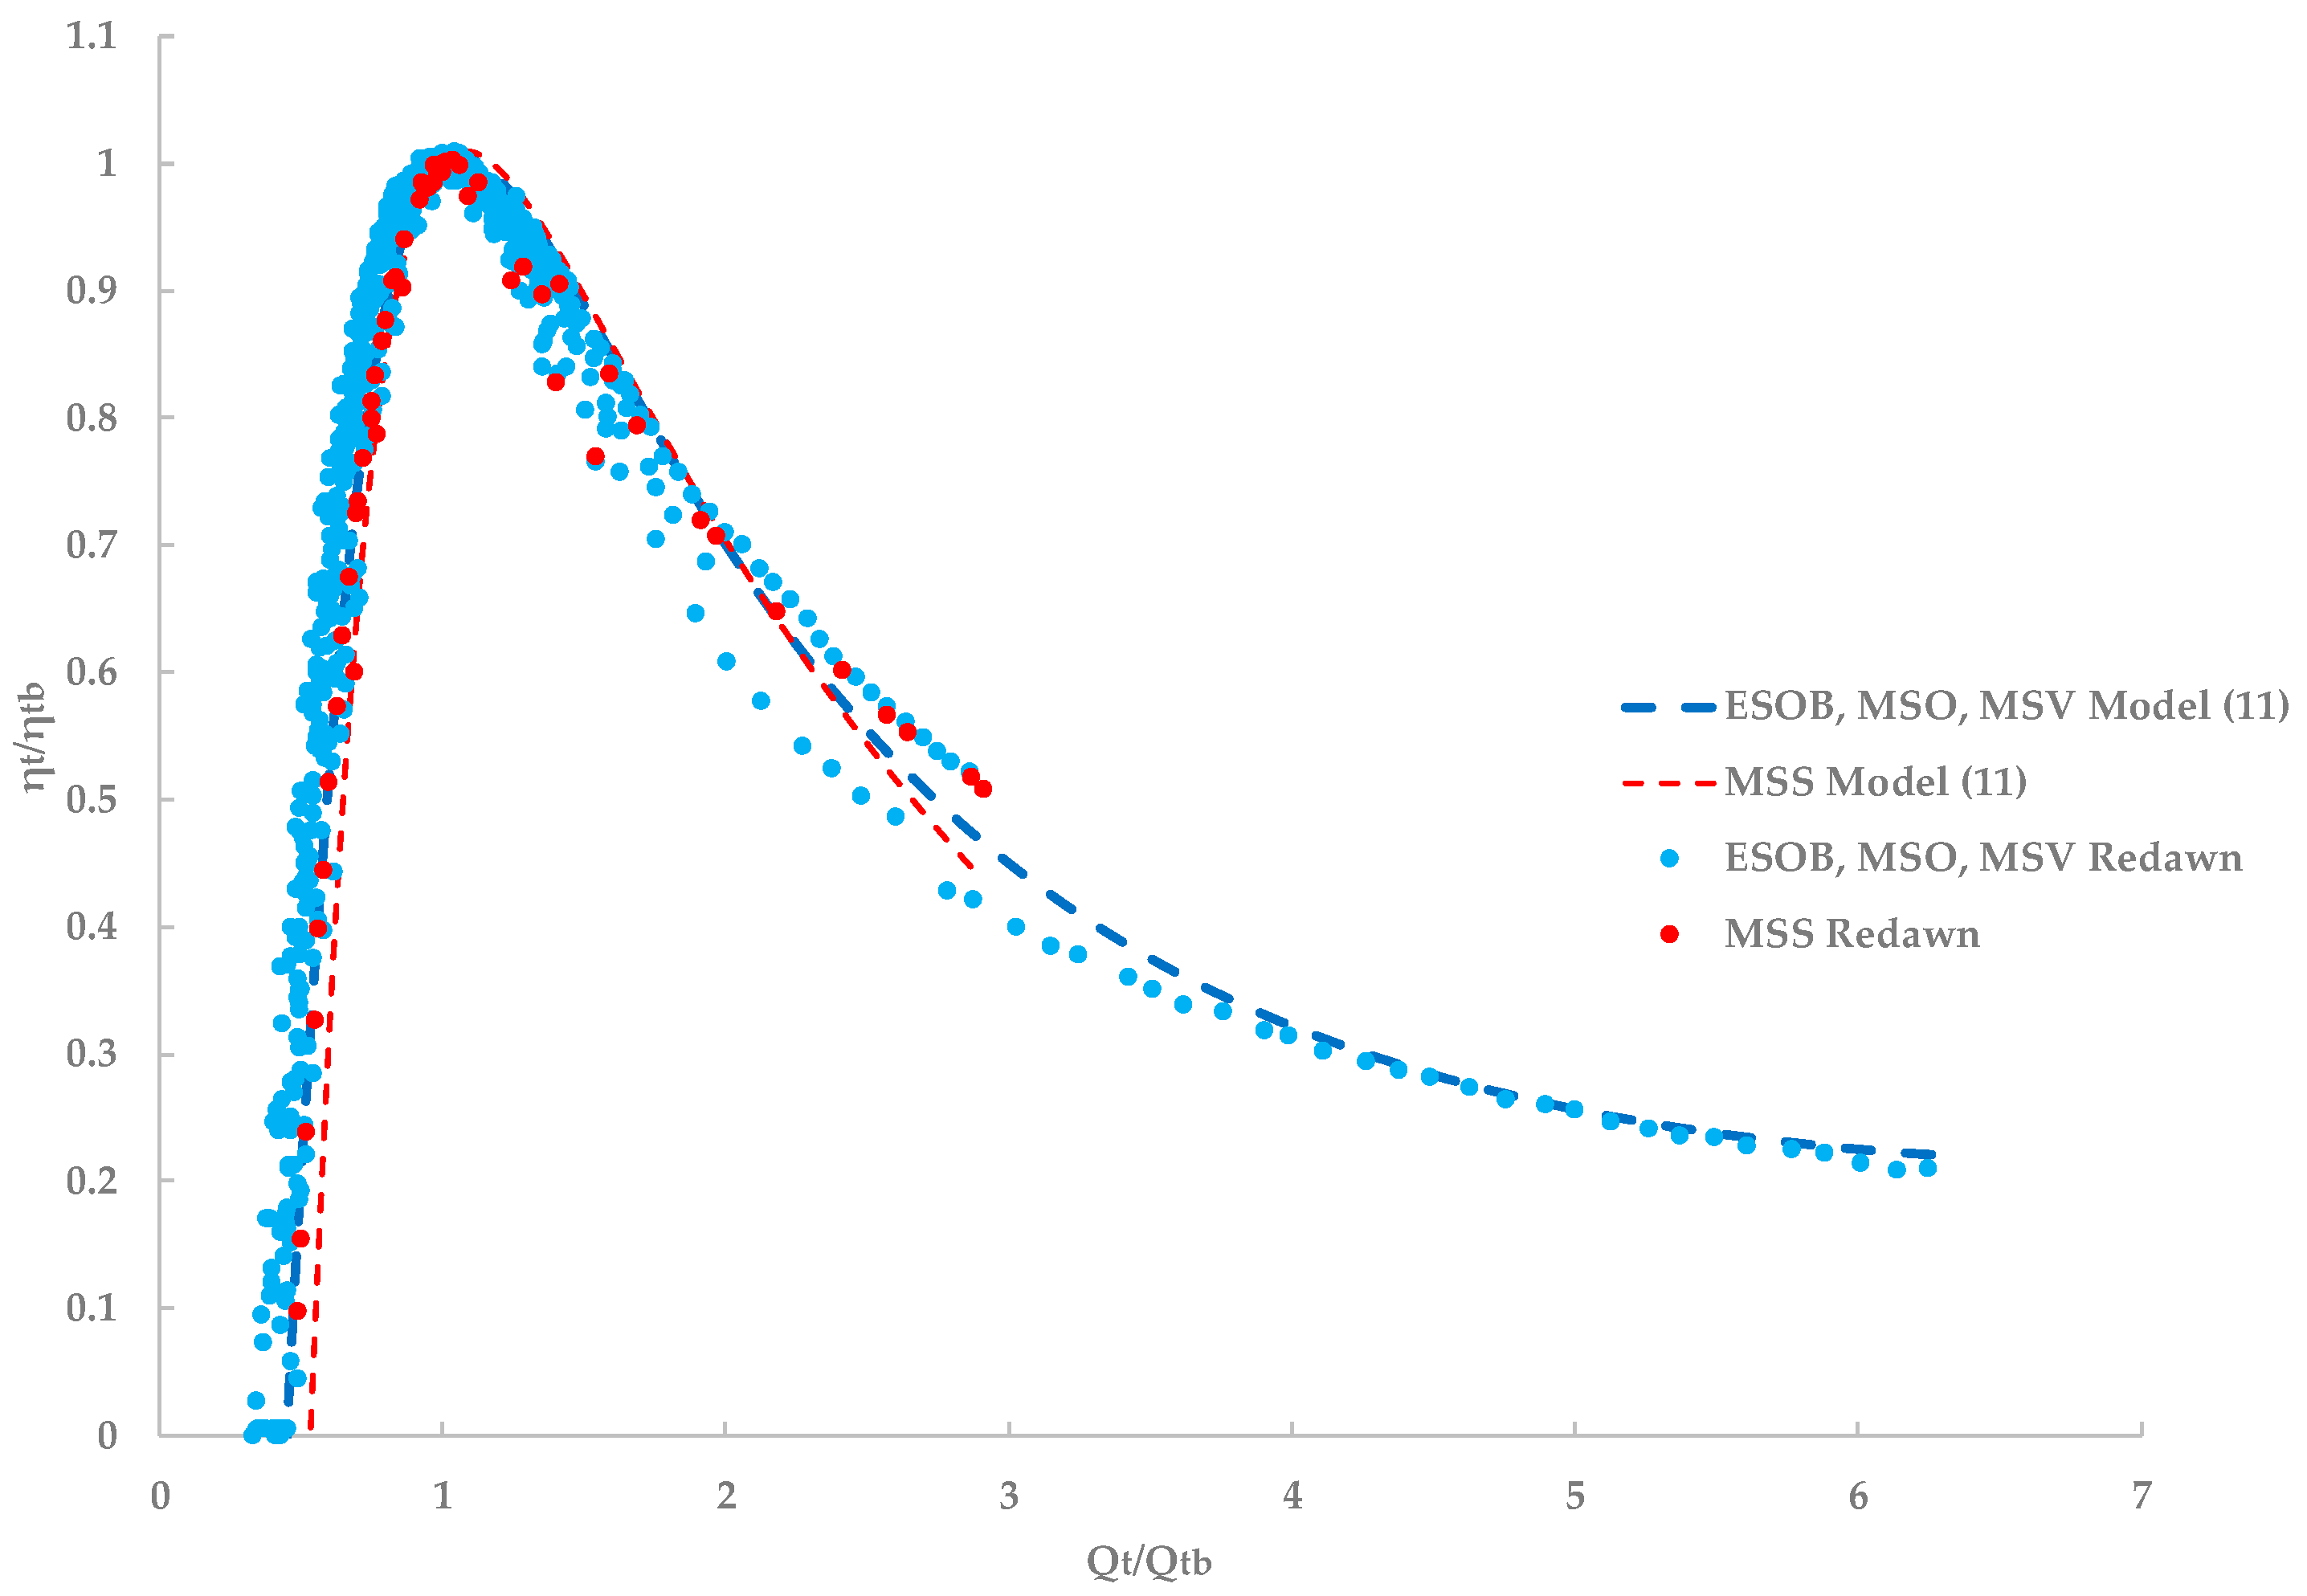
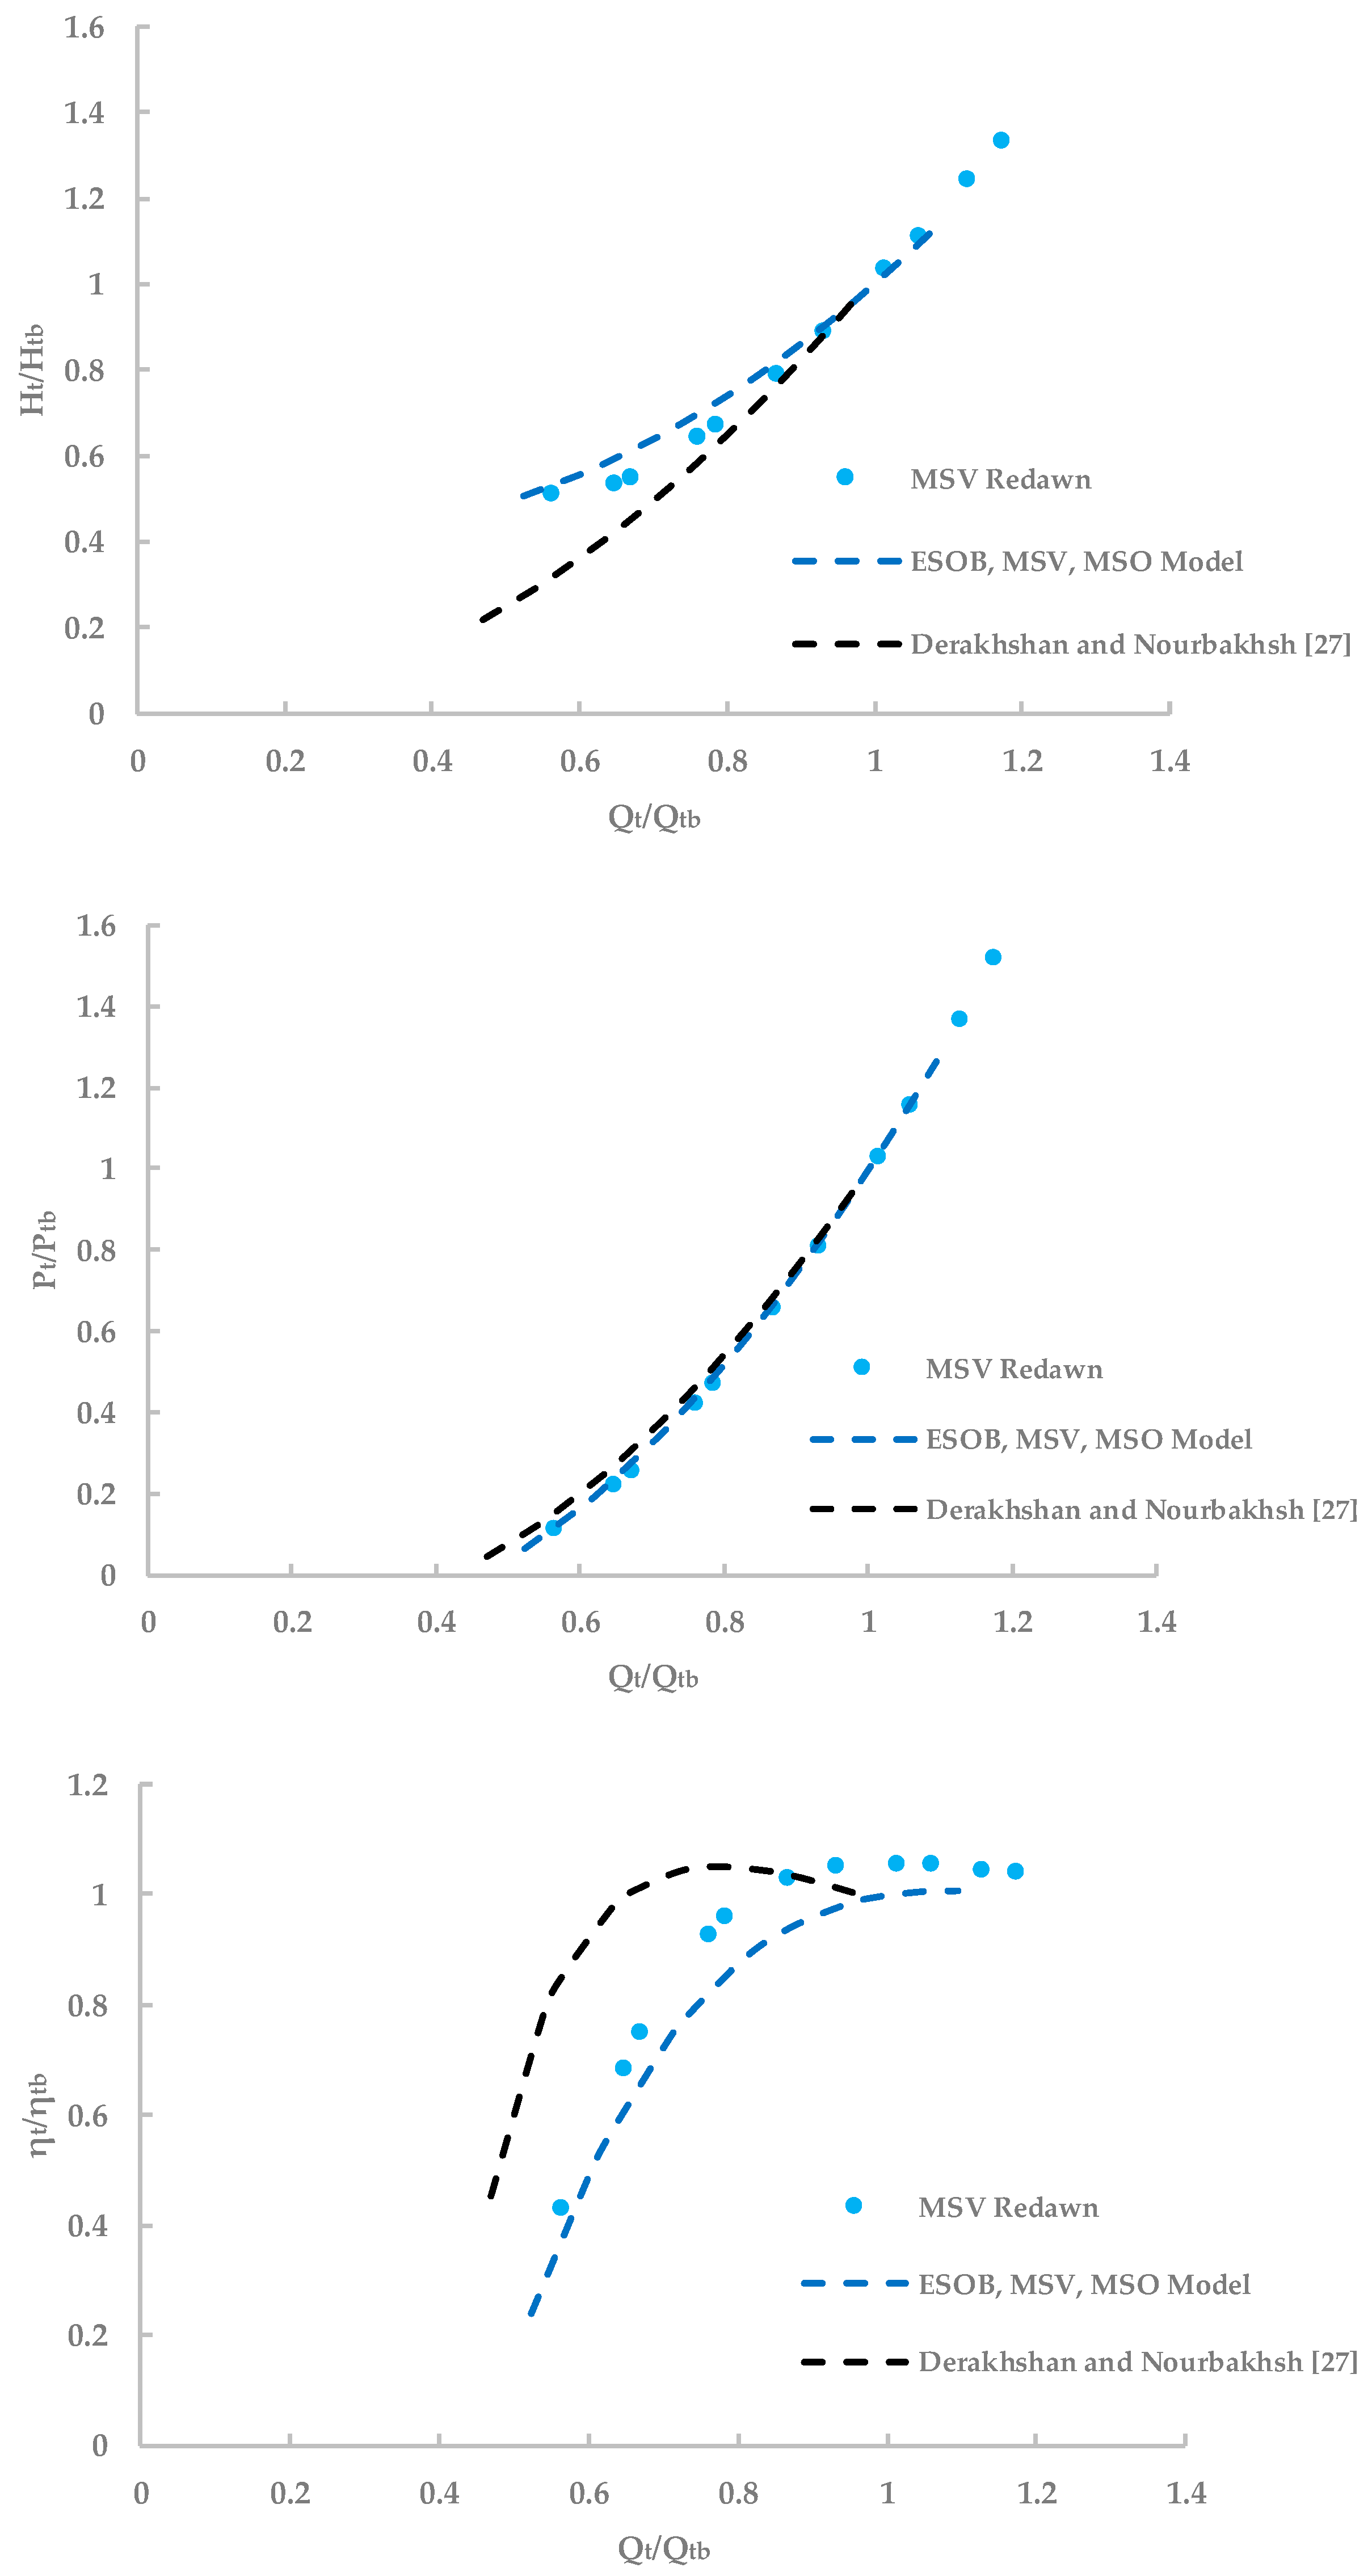
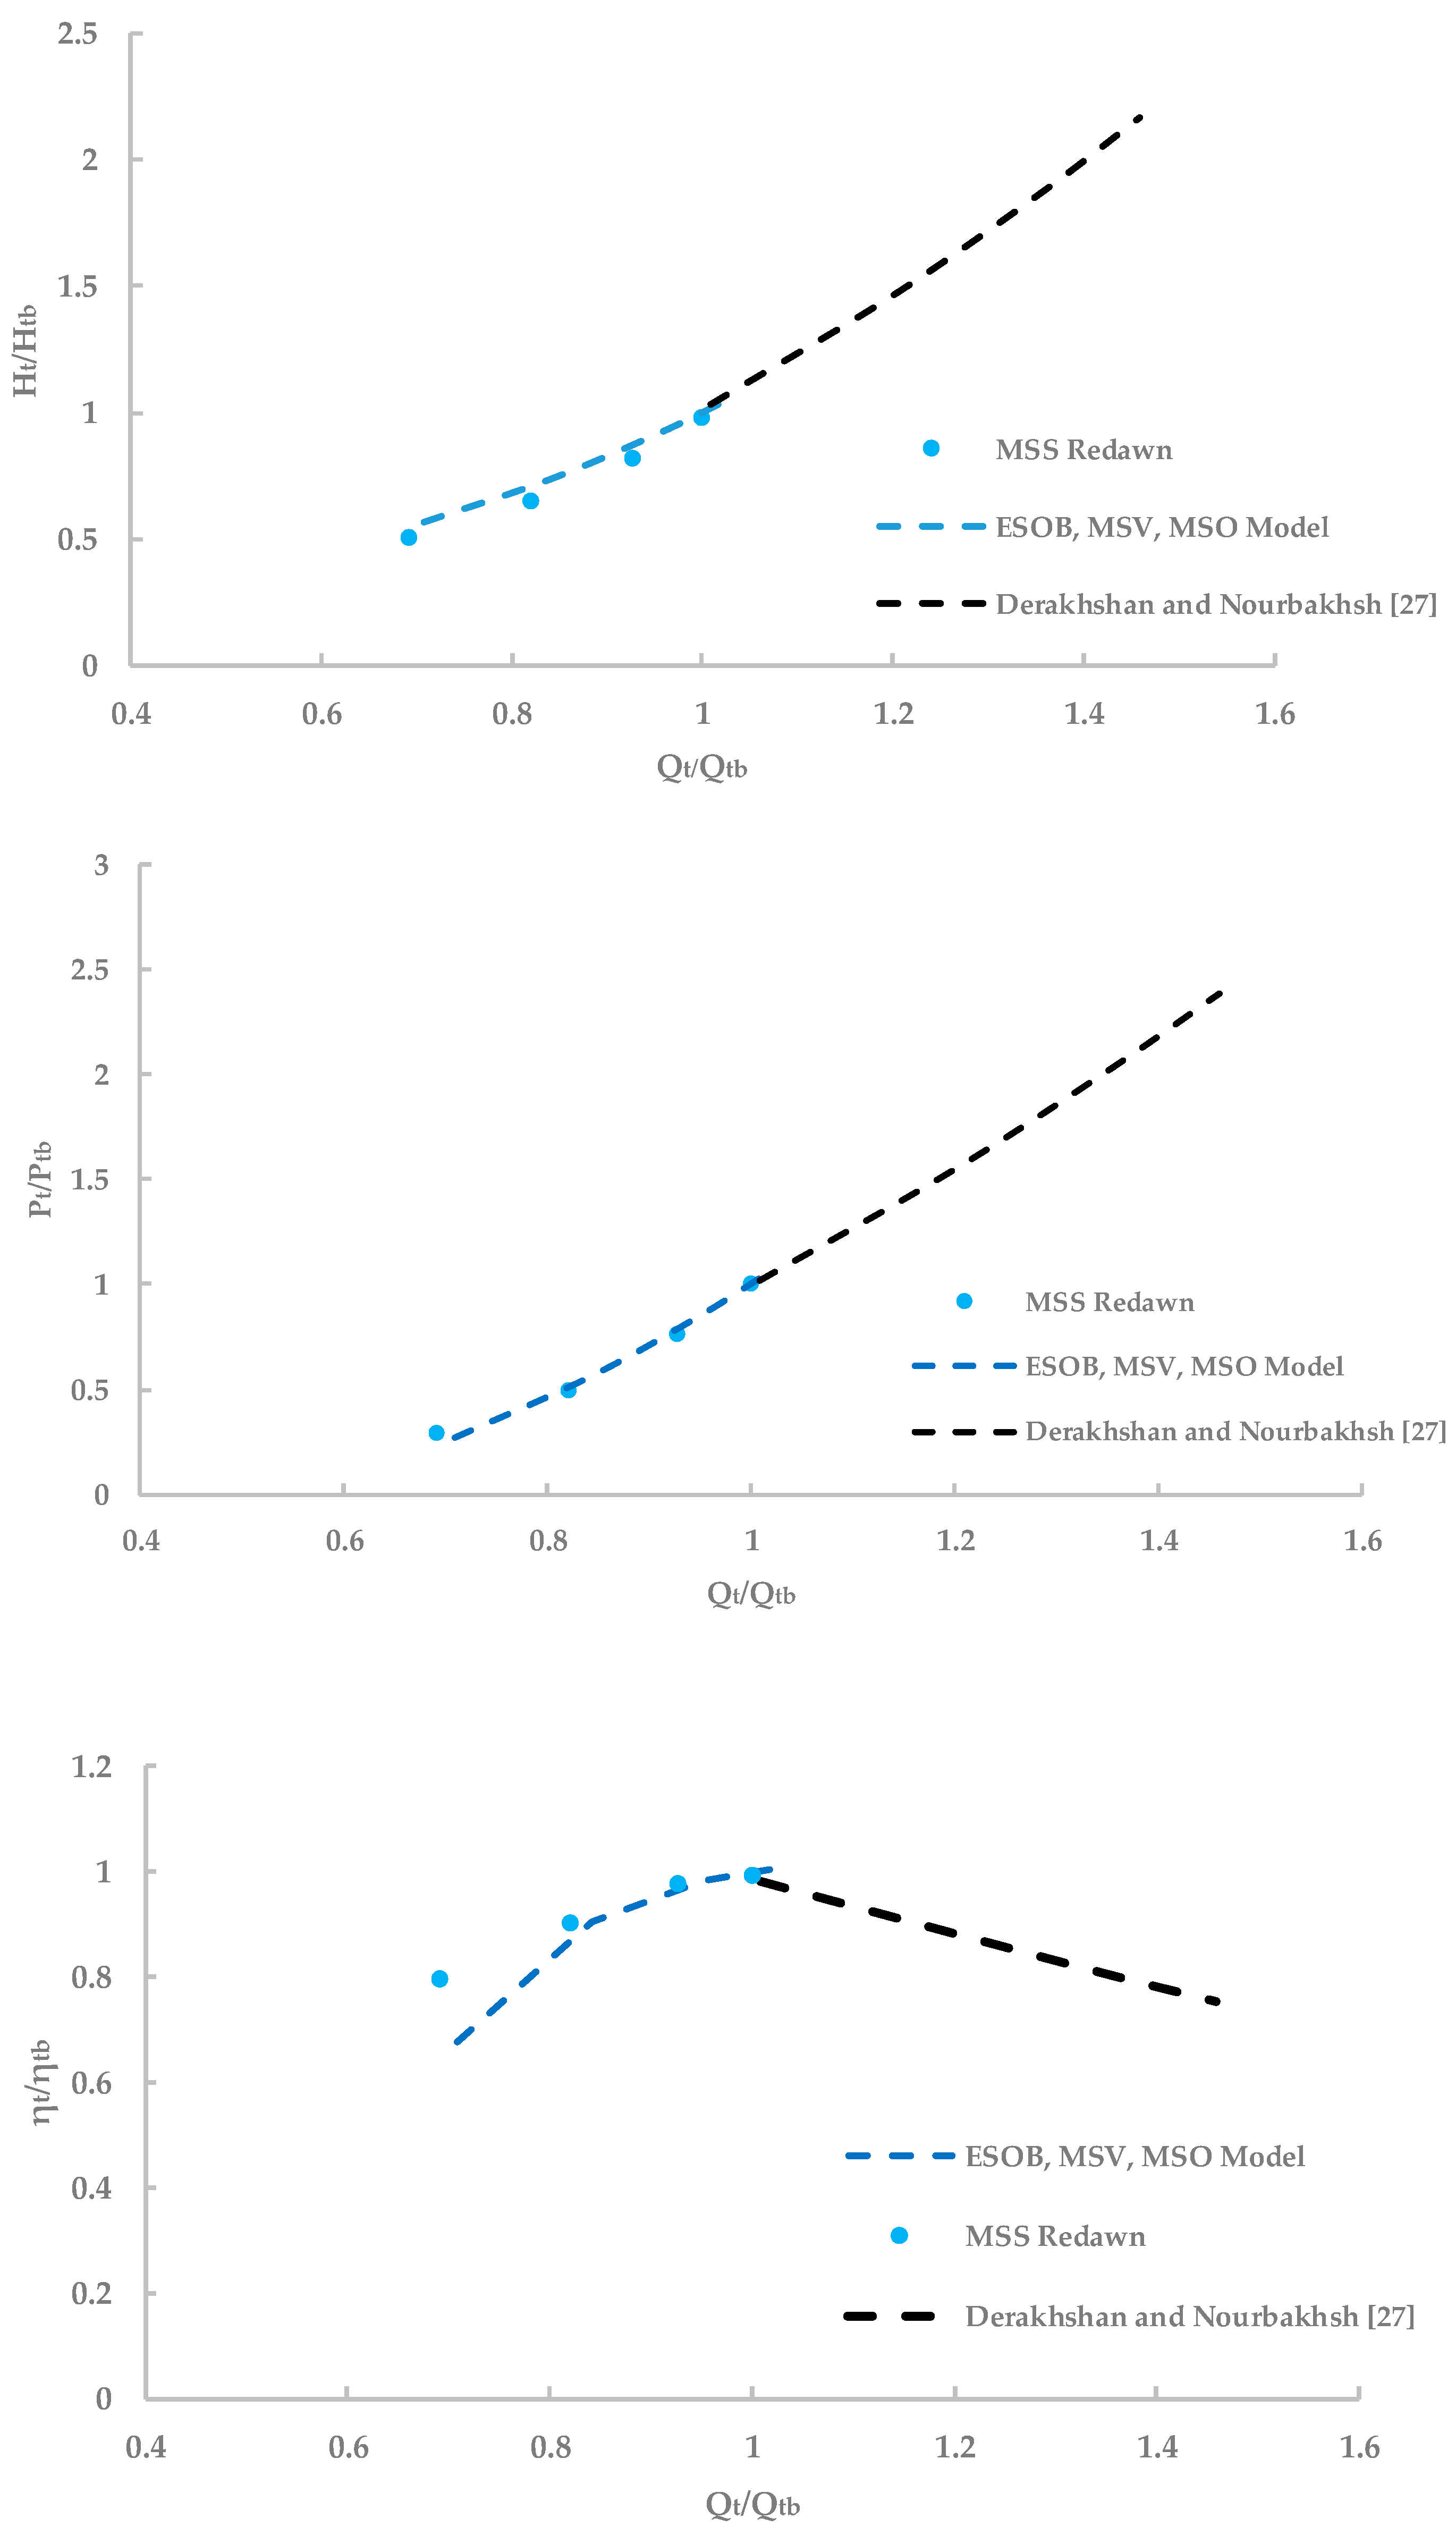
3.3. Characteristic Curves
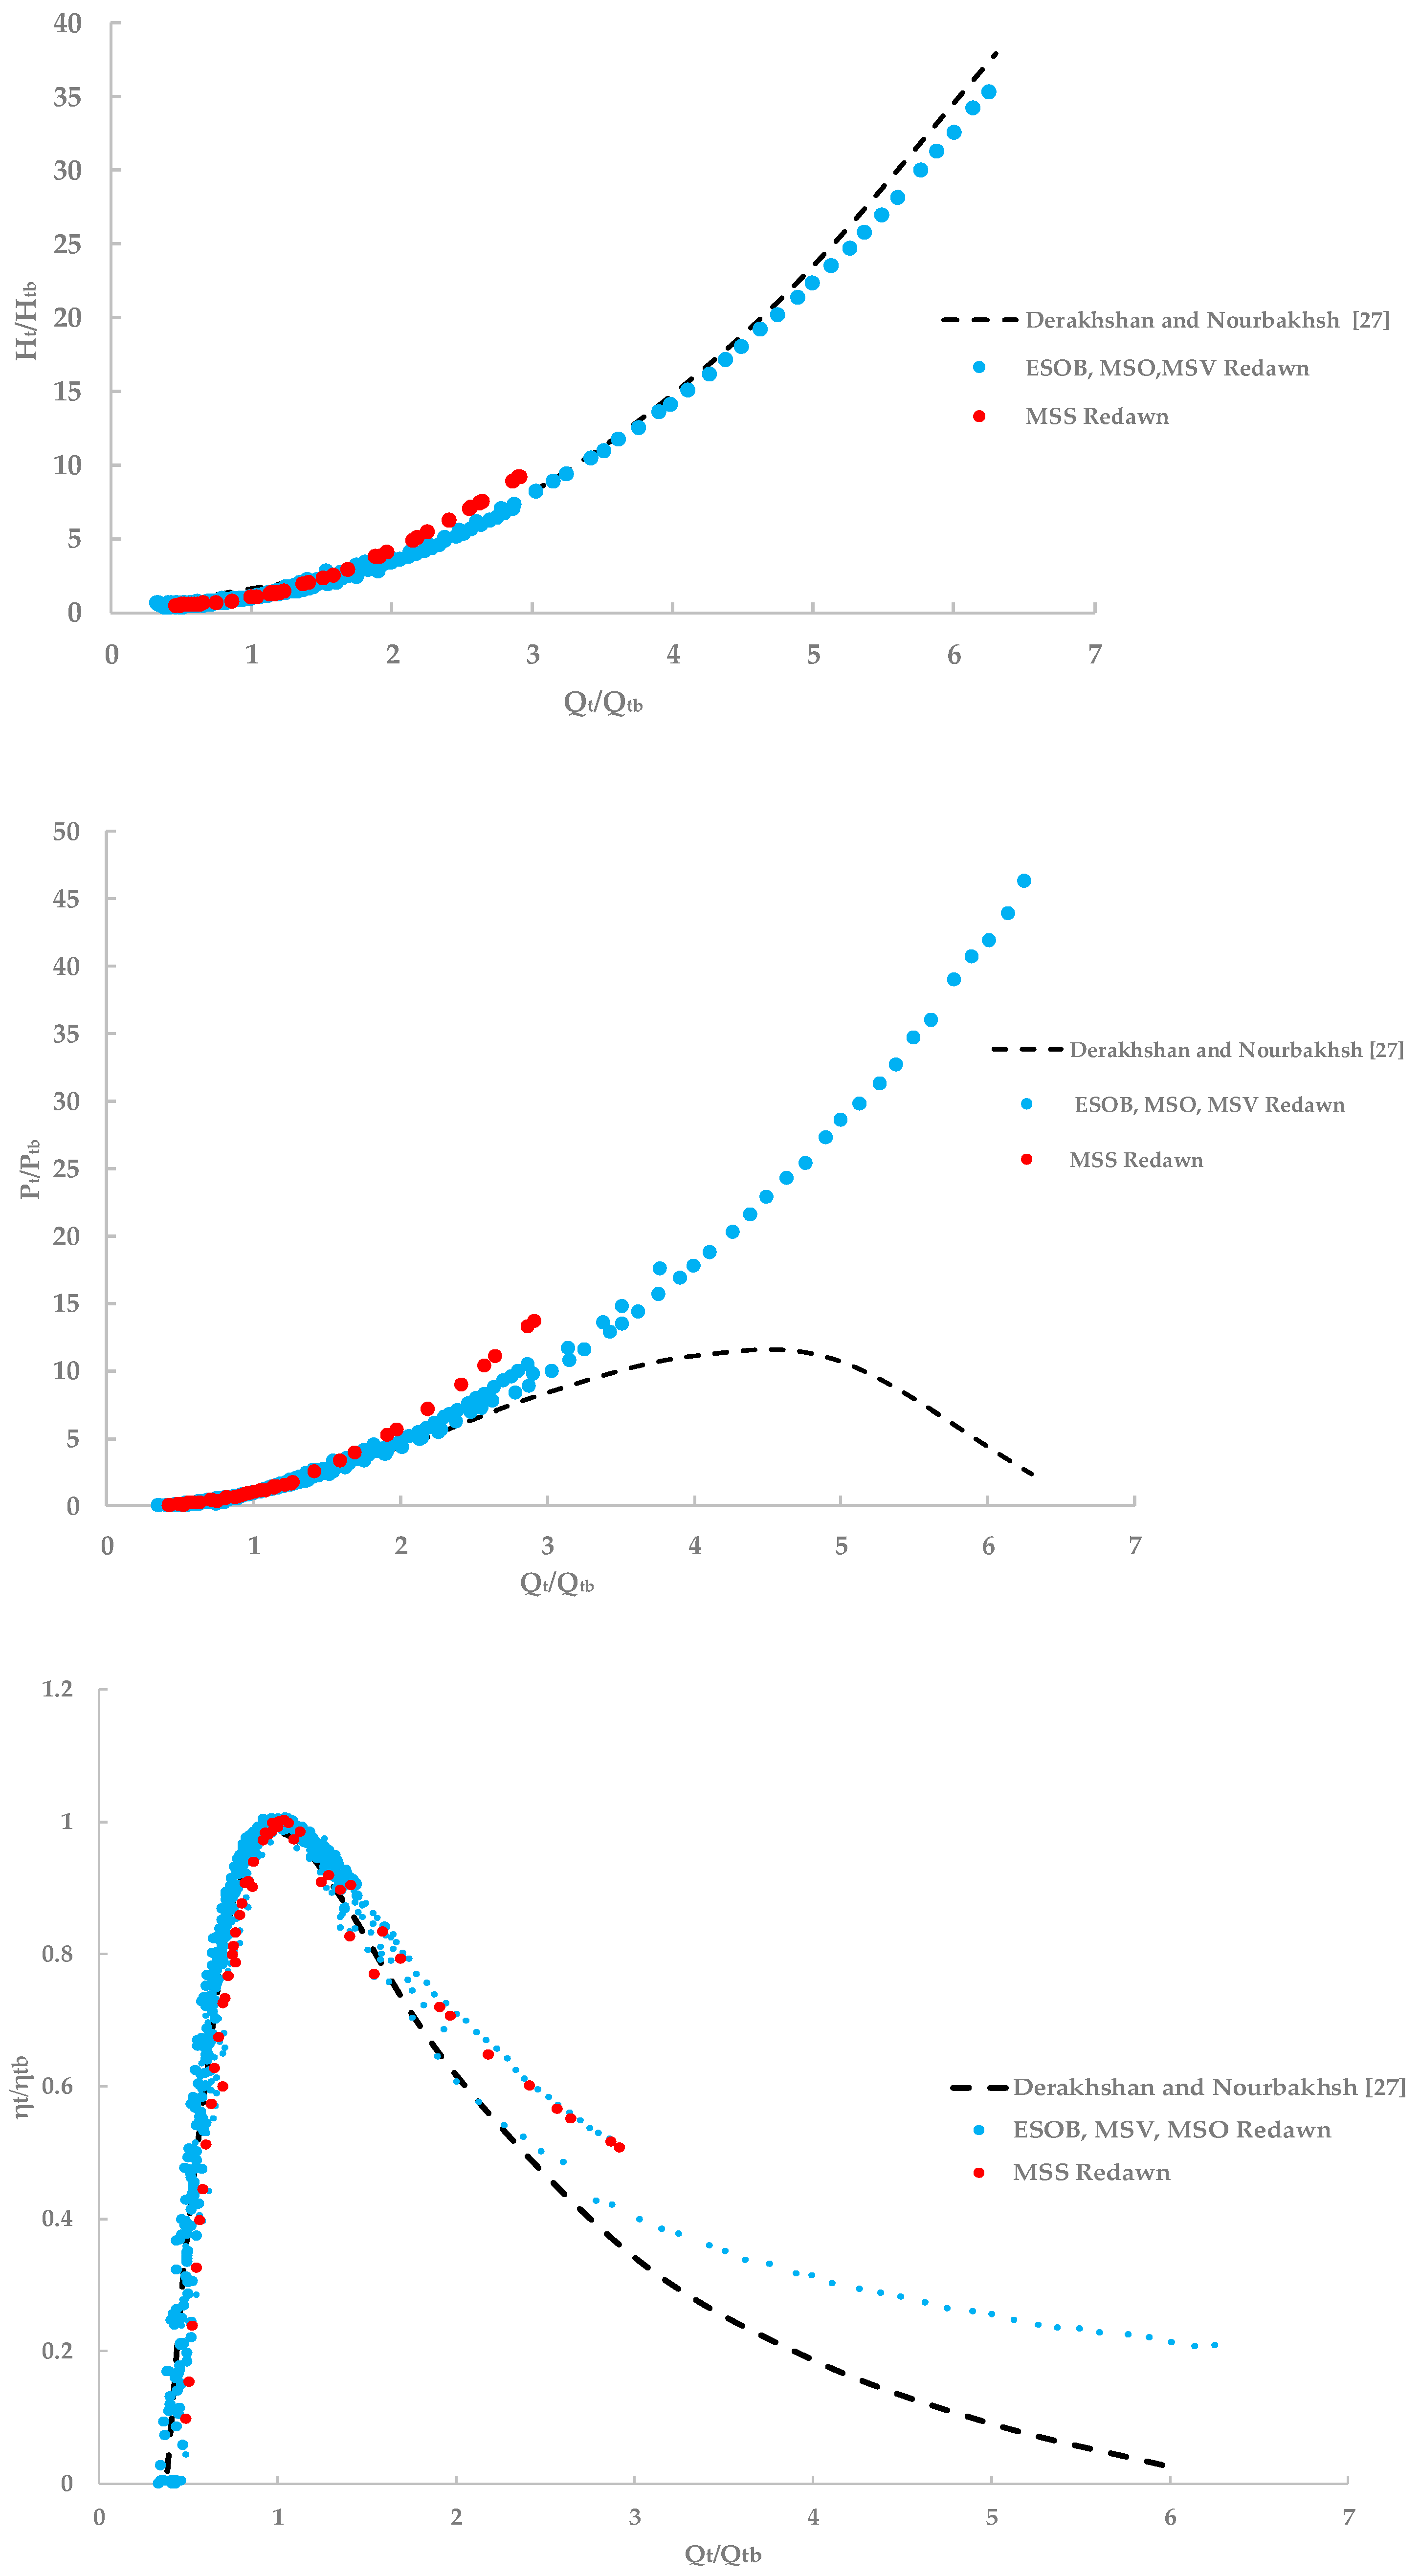
3.4. Comparison with Methods Available in the Literature
4. Application
5. Conclusions
Author Contributions
Funding
Conflicts of Interest
References
- Nazif, S.; Karamouz, M.; Tabesh, M.; Moridi, A. Pressure management model for urban water distribution networks. Water Resour. Manag. 2010, 24, 437–458. [Google Scholar] [CrossRef]
- Bozorgi, A.; Javidpour, E.; Riasi, A.; Nourbakhsh, A. Numerical and experimental study of using axial pump as turbine in pico hydropower plants. Renew. Energy 2013, 53, 258e264. [Google Scholar] [CrossRef]
- Fecarotta, O.; Ramos, H.M.; Derakhshan, S.; Del Giudice, G.; Carravetta, A. Fine tuning a PAT Hydropower plant in a water supply network to improve system effectiveness. J. Water Resour. Plan. Manag. 2018, 144, 04018038. [Google Scholar] [CrossRef]
- Fontana, N.; Giugni, M.; Glielmo, L.; Marini, G. Real time control of a prototype for pressure regulation and energy production in water distribution networks. J. Water Resour. Plan. Manag. 2016, 142, 04016015. [Google Scholar] [CrossRef]
- Pérez-Sánchez, M.; Sánchez-Romero, F.J.; Ramos, H.M.; López-Jiménez, P.A. Energy recovery in existing water networks: Towards greater sustainability. Water 2017, 9, 97. [Google Scholar] [CrossRef]
- Carravetta, A.; Del Giudice, G.; Fecarotta, O.; Ramos, H. PAT Design Strategy for Energy Recovery in Water Distribution Networks by Electrical Regulation. Energies 2013, 6, 411–424. [Google Scholar] [CrossRef]
- Goncalves Costa, F.; Ramos, H. ANN for Hybrid Energy System Evaluation: Methodology and WSS Case Study. Water Resour. Manag. 2011, 25, 2295–2317. [Google Scholar]
- Gallagher, J.; Styles, D.; McNabola, A.; Williams, A.P.P. Life cycle environmental balance and greenhouse gas mitigation potential of micro-hydropower energy recovery in the water industry. J. Clean. Prod. 2015, 99, 152–159. [Google Scholar] [CrossRef]
- Morani, M.C.; Carravetta, A.; Del Giudice, G.; McNabola, A.; Fecarotta, O. A comparison of energy recovery by PATs against direct variable speed pumping in water distribution networks. Fluids 2018, 3, 41. [Google Scholar] [CrossRef]
- Carravetta, A.; Derakhshan, S.; Ramos, H.M. Pumps as Turbines: Fundamentals and Applications; Springer International Publishing: Basel, Switzerland, 2017. [Google Scholar]
- Fecarotta, O.; Carravetta, A.; Ramos, H.; Martino, R. An improved affinity model to enhance variable operating strategy for pumps used as turbines. J. Hydraul. Res. 2016, 54, 332–341. [Google Scholar] [CrossRef]
- Sinagra, M.; Sammartano, V.; Morreale, G.; Tucciarelli, T. A new device for pressure control and energy recovery in water distribution networks. Water 2017, 2017, 309. [Google Scholar] [CrossRef]
- Nourbakhsh, A.; Derakhshan, S.; Javidpour, E.; Riasi, A. Centrifugal & axial pumps used as turbines in small hydropower stations. In Proceedings of the International Congress on Small Hydropower Conference and Exhibition on Small Hydropower, Lisbon, Portugal, 27–29 September 2010; pp. 16–19. [Google Scholar]
- Ramos, H.; Borga, A. Pumps as turbines: An unconventional solution to energy production. Urban Water 1999, 412, 261–263. [Google Scholar] [CrossRef]
- Ramos, H.M.; Vieira, F.; Covas, D.I.C. Energy efficiency in a water supply system: Energy consumption and CO2 emission. Water Sci. Eng. 2010, 3, 331–340. [Google Scholar]
- Morani, M.C.; Carravetta, A.; Fecarotta, O.; McNabola, A. Energy transfer from the freshwater to the wastewater network using a pat-equipped Turbopump. Water 2020, 12, 38. [Google Scholar] [CrossRef]
- Carravetta, A.; Fecarotta, O.; Del Giudice, G.; Ramos, H. energy recovery in water systems by PATs: A comparisons among the different installation schemes. Procedia Eng. 2014, 70, 275–284. [Google Scholar] [CrossRef]
- Ramos, H.; Mello, M.; De, P.K. Clean power in water supply systems as a sustainable solution: From planning to practical implementation. Water Sci. Technol. Water Supply 2010, 10, 39–49. [Google Scholar] [CrossRef]
- Singh, P.; Nestmann, F. An optimization routine on a prediction and selection model for the turbine operation of centrifugal pumps. Exp. Fluid Sci. 2010, 34, 152e164. [Google Scholar] [CrossRef]
- Stepanoff, A.J. Centrifugal and Axial Flow Pumps, 2nd ed.; John Wiley & Sons, Inc.: New York, NY, USA, 1957; Volume 276. [Google Scholar]
- Childs, S.M. Convert pumps to turbine and recover HP. Hydrocarb. Process. Pet. Rejner 1962, 41, 173–174. [Google Scholar]
- Hancock, J.W. Centrifugal pump or water turbine. Pipe Line News 1963, 6, 25–27. [Google Scholar]
- Grover, K.M. Conversion of Pumps to Turbines; GSA Inter Corp: Katonah, NY, USA, 1980. [Google Scholar]
- Williams, A. The turbine performance of centrifugal pumps: A comparison of prediction methods. J. Power Energy 1994, 208, 59–66. [Google Scholar] [CrossRef]
- Alatorre-Frenk, C.; Thomas, T.H. The pumps as turbines approach to small hydropower. In Proceedings of the World Congress on Renewable Energy, Reading, UK, 23–28 September 1990. [Google Scholar]
- Carravetta, A.; Ramos, H.; Derakhshan, S. Pumps as Turbines Fundamentals and Applications; Springer International Publishing Ag: Cham, Switzerland, 2018; ISBN 978-3-319-67506-0. [Google Scholar]
- Derakhshan, S.; Nourbakhsh, A. Experimental study of characteristic curves of centrifugal pumps working as turbines in different specific speeds. Exp. Therm. Fluid Sci. 2008, 32, 800–807. [Google Scholar] [CrossRef]
- Nautiyal, H.; Varun, V.; Kumar, A.; Yadav, S. Experimental investigation of centrifugal pump working as turbine for small hydropower system. Energy Sci. Technol. 2011. [Google Scholar] [CrossRef]
- Yang, S.; Derakhshan, S.; Kong, F. Theoretical, numerical and experimental prediction of pump as turbine performance. Renew. Energy 2012, 48, 507–513. [Google Scholar] [CrossRef]
- Williams, A. Pumps as Turbines Used with Induction Generations of Stand-Alone Micro-Hydroelectric Power Plants. Ph.D. Thesis, Nottingham Polytechnic, Nottingham, UK, 1992. [Google Scholar]
- Singh, P. Optimization of the Internal Hydraulic and of System Design in Pumps as Turbines with Field Implementation and Evaluation. Ph.D. Thesis, Fakultät für Bauingenieur-, Geo- und Umweltwissenschaften der Universität Fridericiana zu Karlsruhe (TH), Karlsruhe, Germany, 2005. [Google Scholar]
- Joshi, S.; Gordon, A.; Holloway, L.; Chang, L. Selecting a high specific speed pump for low head hydro-electric power generation. Can. Conf. Electr. Comput. Eng. 2005. [Google Scholar] [CrossRef]
- Tan, X.; Engeda, A. Performance of centrifugal pumps running in reverse as turbine: Part II—Systematic specific speed and specific diameter based performance prediction. Renew. Energy 2016, 99, 188–197. [Google Scholar] [CrossRef]
- Barbarelli, S.; Amelio, M.; Florio, G. Predictive model estimating the performances of centrifugal pumps used as turbines. Energy 2016, 107, 103–121. [Google Scholar] [CrossRef]
- Nautiyal, H.; Goel, V.; Kumar, A. Reverse running pumps analytical, experimental and computational study: A review. Renew. Sustain. Energy Rev. 2010, 14, 2059–2067. [Google Scholar] [CrossRef]
- Fecarotta, O.; Carravetta, A.; Ramos, H. CFD and comparisons for a pump as turbine: Mesh reliability and performance concerns. Int. J. Energy Environ. 2011, 2, 39–48. [Google Scholar]
- Pugliese, F. Experimental and Numerical Investigation of Pumps as Turbines in Water Distribution Networks. Ph.D. Thesis, University of Naples Federico II, Naples, Italy, 2017. [Google Scholar]
- Commission Regulation (EU) No 547/2012. Implementing Directive 2009/125/EC of the European Parliament and of the Council with regard to eco-design requirements for water pumps. Off. J. Eur. Union 2012, L165, 28–36. [Google Scholar]
- Pumps, S. Centrifugal Pump Handbook, 3rd ed.; Elsevier: Amsterdam, The Netherlands, 2010. [Google Scholar]
- Chapallaz, J.M.; Eichenberger, P.; Fisher, G. Manual on Pumps Used as Turbines; Vieweg: Braunschweig, Germany, 1992; Chapter 1. [Google Scholar]


| Device Code | Manufacturer | Type | K |
|---|---|---|---|
| ‘Etanorm 32-125’ | KSB (Frankenthal, Germany) | ESOB | 1 |
| ‘Etanorm 50-160’ | KSB (Frankenthal, Germany) | ESOB | 1 |
| ‘FHE80-200’ | Lowara (Vicenza, Italy) | ESOB | 2 |
| ‘Etanorm 150-200’ | KSB (Frankenthal, Germany) | ESOB | 1 |
| ‘Etanorm 100-315’ | KSB (Frankenthal, Germany) | ESOB | 1 |
| ‘Etanorm 50-315?’ | KSB (Frankenthal, Germany) | ESOB | 1 |
| ‘Etanorm 65-125’ | KSB (Frankenthal, Germany) | ESOB | 1 |
| ‘Etanorm 65-160’ | KSB (Frankenthal, Germany) | ESOB | 1 |
| ‘Etanorm 65-200’ | KSB (Frankenthal, Germany) | ESOB | 1 |
| ‘Etanorm 65-250’ | KSB (Frankenthal, Germany) | ESOB | 1 |
| ‘Etanorm 65-315’ | KSB (Frankenthal, Germany) | ESOB | 1 |
| ‘Etanorm 80-200’ | KSB (Frankenthal, Germany) | ESOB | 1 |
| ‘Etanorm 80-250’ | KSB (Frankenthal, Germany) | ESOB | 1 |
| ‘Etanorm 80-315’ | KSB (Frankenthal, Germany) | ESOB | 1 |
| ‘Etanorm 80-400’ | KSB (Frankenthal, Germany) | ESOB | 1 |
| ‘Etanorm 100-200’ | KSB (Frankenthal, Germany) | ESOB | 1 |
| ‘Etanorm 100-315’ | KSB (Frankenthal, Germany) | ESOB | 1 |
| ‘Etanorm 100-400’ | KSB (Frankenthal, Germany) | ESOB | 1 |
| ‘Etanorm 125-400’ | KSB (Frankenthal, Germany) | ESOB | 1 |
| ‘Etanorm 150-250’ | KSB (Frankenthal, Germany) | ESOB | 1 |
| ‘P(E18S64)/1A’ | Caprari (Modena, Italy) | MSS | 3 |
| ‘P14C/1G’ | Caprari (Modena, Italy) | MSV | 3 |
| ‘P14C/1A’ | Caprari (Modena, Italy) | MSV | 3 |
| ‘P14C/1C’ | Caprari (Modena, Italy) | MSV | 3 |
| ‘P16D/1B’ | Caprari (Modena, Italy) | MSV | 3 |
| ‘P16C/1A’ | Caprari (Modena, Italy) | MSV | 3 |
| ‘P18C/1A’ | Caprari (Modena, Italy) | MSV | 2 |
| ‘92SV2G150T_IE3’ | Lowara (Vicenza, Italy) | MSV | 4 |
| ‘PM50/3’ | Caprari (Modena, Italy) | MSO | 1 |
| ‘PM50/4’ | Caprari (Modena, Italy) | MSO | 1 |
| ‘HMU40-2/2’ | Caprari (Modena, Italy) | MSO | 1 |
| ‘HMU50-1/2’ | Caprari (Modena, Italy) | MSO | 1 |
| ‘HMU50-2/2’ | Caprari (Modena, Italy) | MSO | 1 |
| ‘MEC-MR80-3/2A’ | Caprari (Modena, Italy) | MSO | 2 |
| Qtb | Htb | Ptb | ηtb | |
|---|---|---|---|---|
| Proposed model | 0.48% | 1.03% | 2.00% | 4.48% |
| Derakhshan & Nourbakhsh [27] | 1.6% | 20.0% | 30.0% | 4.5% |
| Tan et Engeda [33] | 1.2% | 38.0% | 86.0% | 14.0% |
| Devices | Manufacturer | Qpb (m³/s) | Hpb (m) | Ppb (KW) | ηpb | Np (rpm) |
|---|---|---|---|---|---|---|
| ESOB, Etanorm 100-400 | KSB (Frankenthal, Germany) | 0.052673 | 49.37302837 | 33.95912663 | 0.750954 | 1450 |
| MSO, MEC-MR80-3/2A | Caprari (Modena, Italy) | 0.042037 | 130.9518891 | 69.89042498 | 0.772358 | 2900 |
| MSV, 92SV2G150T_IE3 | Lowara (Vicenza, Italy) | 0.025474 | 42.28917636 | 13.42392097 | 0.786942 | 2900 |
| MSS, ’P(E18S64)/1A’ | Caprari (Modena, Italy) | 0.1964461 | 48.9573971 | 114.3579978 | 0.8246829 | 2935 |
| Device | Manufacturer | Qtb (m³/s) | Htb (m) | Ptb (KW) | ηtb | Nt (rpm) |
|---|---|---|---|---|---|---|
| ESOB, Etanorm 100-400 | KSB (Frankenthal, Germany) | 0.072615 | 77.57348 | 41.93998986 | 0.759266 | 1520 |
| MSO, MEC-MR80-3/2A | Caprari (Modena, Italy) | 0.030197 | 51.0721 | 10.41159796 | 0.68847 | 1570 |
| MSV, 92SV2G150T_IE3 | Lowara (Vicenza, Italy) | 0.026722 | 44.25196 | 8.521971903 | 0.734943 | 2400 |
| MSS, ’P(E18S64)/1A’ | Caprari (Modena, Italy) | 0.1447000 | 19.5269 | 18.7352210 | 0.6761843 | 1550 |
| Devices | QtbEV (m³/s) | EQtb | HtbEV (m) | EHtb | PtbEV (KW) | EPt | ηtEV | Eηt |
|---|---|---|---|---|---|---|---|---|
| ESOB, Etanorm 100-400 | 0.0750659 | −3.37% | 79.03889 | −1.89% | 40.6951 | 2.97% | 0.6992 | 7.91% |
| MSO, MEC-MR80-3/2A | 0.0309395 | −2.46% | 55.91328 | −9.48% | 11.5367 | −10.81% | 0.6798 | 1.26% |
| MSV, 92SV2G150T_IE3 | 0.0286611 | −7.26% | 42.19448 | 4.65% | 7.9155 | 7.12% | 0.6672 | 9.22% |
| MSS, ’P(E18S64)/1A’ | 0.1410412 | 2.53% | 19.89140 | −1.87% | 17.5225 | 6.47% | 0.6367 | 5.84% |
| Devices | QtbD (m³/s) | EQtb | HtbD (m) | EHtb | PtbD (KW) | EPt | ηtD | Eηt |
|---|---|---|---|---|---|---|---|---|
| ESOB, Etanorm 100-400 | 0.083529 | −15.03% | 104.217 | −34.35% | 53.33965 | −27.18% | 0.62486 | 17.70% |
| MSO, MEC-MR80-3/2A | 0.0331197 | −9.68% | 75.92709 | −48.67% | 12.72625 | −22.23% | 0.51609 | 25.04% |
| MSV, 92SV2G150T_IE3 | 0.0319179 | −19.45% | 49.65282 | −12.20% | 11.65847 | −36.80% | 0.75019 | −2.07% |
| MSS, ’P(E18S64)/1A’ | 0.099137 | 31.49% | 15.3896 | 21.19% | 13.134578 | 29.89% | 0.87793 | −29.84% |
© 2020 by the authors. Licensee MDPI, Basel, Switzerland. This article is an open access article distributed under the terms and conditions of the Creative Commons Attribution (CC BY) license (http://creativecommons.org/licenses/by/4.0/).
Share and Cite
Fontanella, S.; Fecarotta, O.; Molino, B.; Cozzolino, L.; Della Morte, R. A Performance Prediction Model for Pumps as Turbines (PATs). Water 2020, 12, 1175. https://doi.org/10.3390/w12041175
Fontanella S, Fecarotta O, Molino B, Cozzolino L, Della Morte R. A Performance Prediction Model for Pumps as Turbines (PATs). Water. 2020; 12(4):1175. https://doi.org/10.3390/w12041175
Chicago/Turabian StyleFontanella, Stefania, Oreste Fecarotta, Bruno Molino, Luca Cozzolino, and Renata Della Morte. 2020. "A Performance Prediction Model for Pumps as Turbines (PATs)" Water 12, no. 4: 1175. https://doi.org/10.3390/w12041175
APA StyleFontanella, S., Fecarotta, O., Molino, B., Cozzolino, L., & Della Morte, R. (2020). A Performance Prediction Model for Pumps as Turbines (PATs). Water, 12(4), 1175. https://doi.org/10.3390/w12041175