Article

Enhancing Nitrate Removal from Waters with Low Organic Carbon Concentration Using a Bioelectrochemical System—A Pilot-Scale Study

1
Department of Geography, Institute of Ecology and Earth Sciences, University of Tartu, Vanemuise 46, 50410 Tartu, Estonia
2
Institute of Chemistry, University of Tartu, Ravila 14a, 50411 Tartu, Estonia
*
Author to whom correspondence should be addressed.
Water 2020, 12(2), 516; https://doi.org/10.3390/w12020516
Submission received: 25 December 2019 / Revised: 3 February 2020 / Accepted: 8 February 2020 / Published: 13 February 2020

Abstract

:
Assessments of groundwater aquifers made around the world show that in many cases, nitrate concentrations exceed the safe drinking water threshold. This study assessed how bioelectrochemical systems could be used to enhance nitrate removal from waters with low organic carbon concentrations. A two-chamber microbial electrosynthesis cell (MES) was constructed and operated for 45 days with inoculum that was taken from a municipal wastewater treatment plant. A study showed that MES can be used to enhance nitrate removal efficiency from 3.66% day−1 in a control reactor to 8.54% day−1 in the MES reactor, if a cathode is able to act as an electron donor for autotrophic denitrifying bacteria or there is reducing oxygen in a cathodic chamber to favor denitrification. In the MES, greenhouse gas emissions were also lower compared to the control. Nitrous oxide average fluxes were −639.59 and −9.15 µg N m−2 h−1 for the MES and control, respectively, and the average carbon dioxide fluxes were −5.28 and 43.80 mg C m−2 h−1, respectively. The current density correlated significantly with the dissolved oxygen concentration, indicating that it is essential to keep the dissolved oxygen concentration in the cathode chamber as low as possible, not only to suppress oxygen’s inhibiting effect on denitrification but also to achieve better power efficiency.

1. Introduction

Studies have shown that excessive use of fertilizers in agriculture and insufficient sewer systems are causing surface and groundwater pollution globally [1,2]. Assessments of groundwater aquifers made in Portugal, Iran, Saudi Arabia, France, and other countries have shown that in many cases, nitrate (NO3) concentrations are exceeding the safe drinking water threshold of 50 mg NO3‾ L−1, which is specified by the World Health Organization [3,4,5,6,7,8]. High NO3‾ concentrations in surface water and groundwater are causing environmental problems, such as eutrophication [9], and since NO3‾ becomes toxic to humans at concentrations of 50 mg NO3‾ L−1 and above, this relates to health issues like methemoglobinemia and cancer [2,8].
In water treatment systems, the structure and operating practices vary considerably depending on the characteristics of treatable water. If treatable water has a low organic carbon to nitrogen ratio, then there is a lack of electron donors in the environment and one of the main questions becomes how to remove the nitrogen compounds [10,11,12]. Often, organic carbon is added to the system to enhance the microbial denitrification process [13]. In wastewater treatment plants, methanol and ethanol are widely used, and in case of constructed wetlands, organic wood-mulch, activated carbon, and biochar are used as additional organic carbon sources [10,12,14]. This means that when wastewater is being treated, adding organic carbon is feasible and widely used, but when it comes to polluted groundwater, the addition of organic carbon is excluded as it can cause secondary pollution; therefore, another type of approach is necessary [15].
Recent studies have shown that microbial electrosynthesis cell (MES) reactors can be a viable alternative to organic carbon addition to enhance the denitrification process [16,17,18,19]. In 2004, Gregory et al. [20], demonstrated that anaerobically respirating Geobacter species from Proteobacteria phylum can consume electrons that are served by electrodes and use them for autotrophic denitrification. Following that, additional research has been conducted related to MES, but the technology has not reached wide usage yet [21,22].
Denitrification is a four-step process where NO3 is sequentially reduced to molecular nitrogen (N2) by denitrifying bacteria. Denitrification can happen via heterotrophic or autotrophic pathways, depending on the compounds and the bacteria that are available in the environment [23]. In heterotrophic denitrification, organic carbon is used as the electron and carbon source (1); however, in autotrophic denitrification, the source of electrons can be sulphur or hydrogen (2). Inorganic carbon, such as carbonate or carbon dioxide (CO2), is used as a carbon source [23,24]. Depending on the availability of electron donors, the intermediate compounds such as nitrite (NO2) or nitrous oxide (N2O) can start to accumulate, causing the inhibition of denitrification or increased release of GHGs respectively [25].
5[CH2O] + 4NO3 + 4H+ → 5CO2 + 2N2 + 7H2O
5H2 + 2NO3‾ + 2H+ → N2 + 6H2O.
According to Intergovernmental Panel on Climate Change (IPCC) report 2018 [26], CO2, methane (CH4), and N2O concentrations in the atmosphere have increased from 315 to 415 ppm (1955–2018), from 1625 to 1860 ppb (1980–2018) and from 300 to 332 ppm (1980–2018) respectively [26]. As they all act as a greenhouse gases (GHG), it is essential to evaluate their fluxes in different biochemical systems to see how they could affect the climate [26].
MES systems are similar to microbial fuel cells; however, instead of harvesting electricity from the system, it is added by a power supply to carry out unspontaneous reactions [27]. All bioelectrochemical systems have at least two electrodes: an anode and a cathode. If the cell is separated by an ion- or proton exchange membrane, then one of the chambers is filled with anolyte and the second one with catholyte. In the anodic chamber, the substrate is being oxidized, producing electrons and protons. Those electrons are then directed to the cathode via an external circuit, where they are consumed to reduce to substrates in the cathodic chamber [28]. In the case of bioelectrochemical systems, microorganisms act as catalysts, reducing the overpotential [28]. For example, in MES where autotrophic denitrification has been carried out, the microorganisms use electrons, provided by the cathode, to reduce NO3, NO2, nitric oxide (NO), or N2O (Figure A1).
In previous work, denitrification performance in MESs with different electrode materials [29,30,31], cathode potentials [21,32,33], inoculums [34], substrates [22,35], and operating techniques [17,36] has been studied. However, there is still a need for studies that would give a full overview about the changes of chemical and physical properties that take place in the system.
The main goal of this study was to analyze the abiotic and biotic processes in MES systems that are used to enhance nitrate removal in low organic carbon environments, such as groundwater. More specifically, we evaluated the possibility of enhancing denitrification using MES and determine the effect on GHG emissions. The possibility of using the cation exchange membrane as a barrier for oxygen from one chamber to another was also evaluated.

2. Materials and Methods

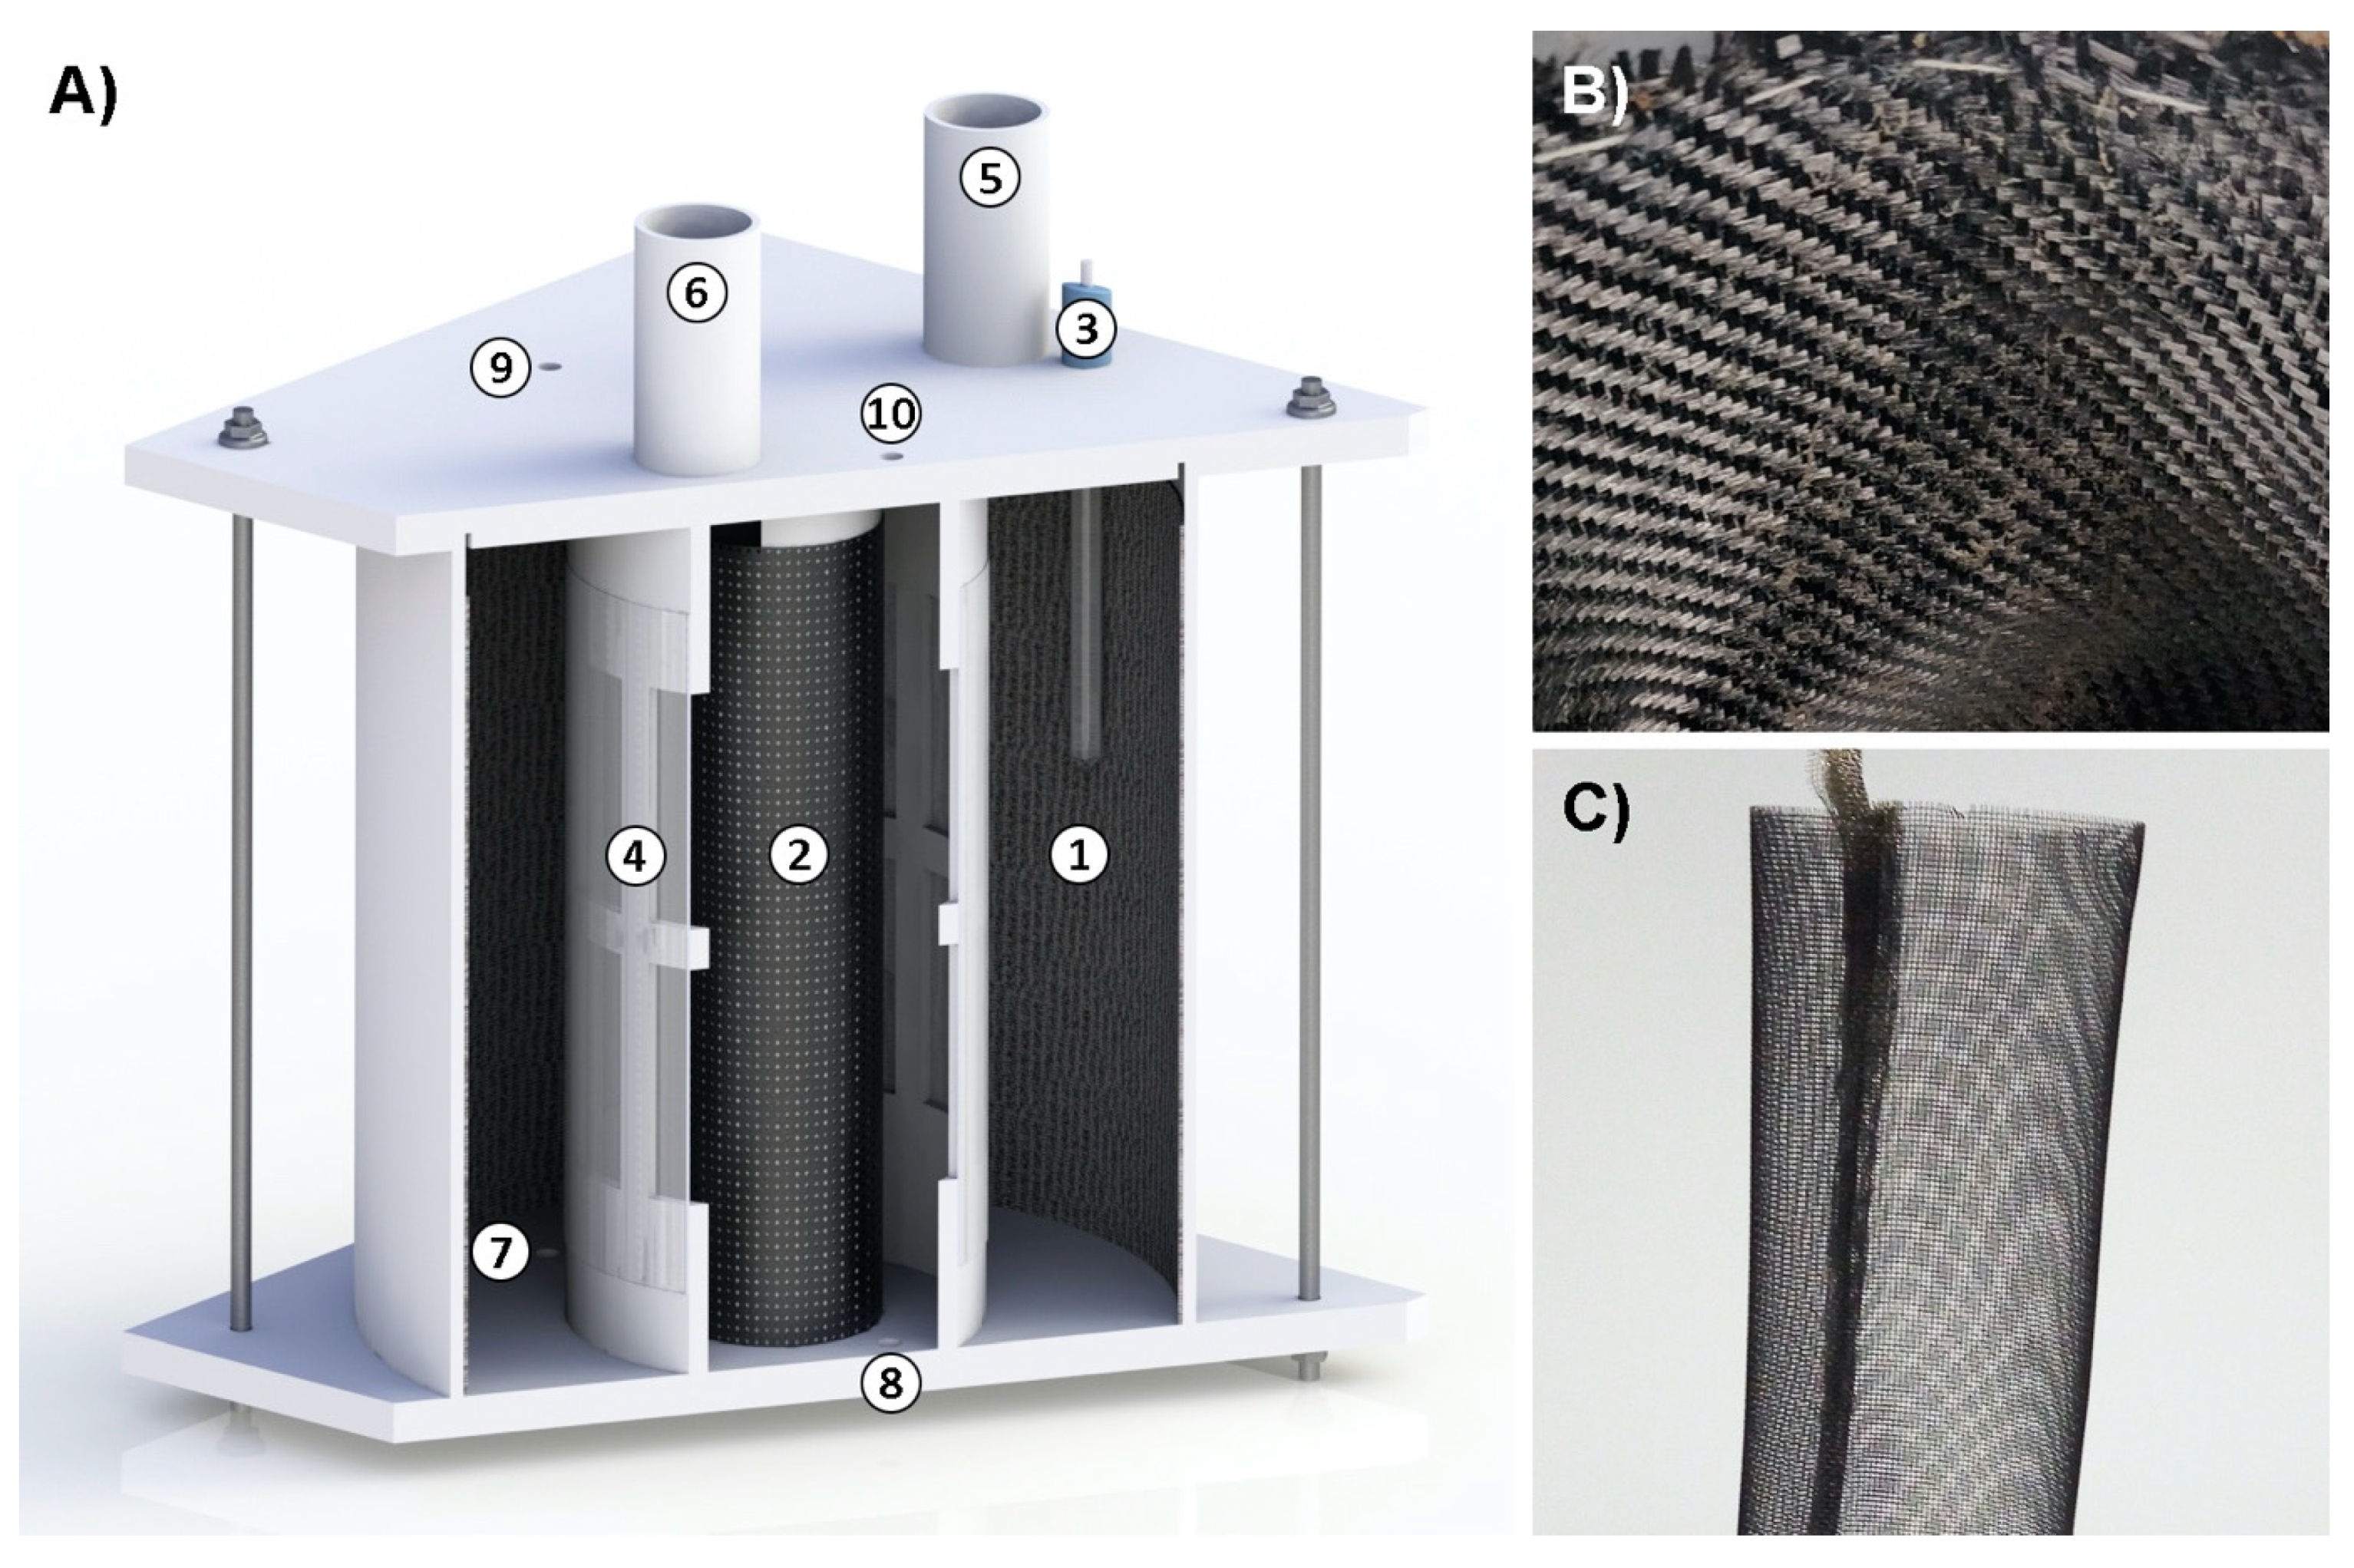
2.1. Experimental Set-up

Experiments were carried out in two-chamber (anodic chamber and cathodic chamber) MES reactors made of Plexiglas with a total volume of 5.86 L (Figure 1A). An anodic chamber with a volume of 1.37 L was separated from a cathodic chamber with a volume of 4.49 L by a Nafion 117 cation exchange membrane (The Chemours Company, Wilmington, DE, USA). The cation exchange membrane was treated in a solution of hydrogen peroxide and boiled in 0.5 M sulphuric acid solution prior to each measurement series. The cathode electrode/working electrode (20 × 61 cm) was made of carbon cloth (Figure 1B) and the anode electrode/counter electrode (20 × 16 cm) was made of steel mesh (SS321 Grade, #20 Mesh, The Mesh Company, Warrington, England, UK) that was covered with 1 mg cm−2 carbon powder (Vulcan XC72R, Fuel Cell Earth, Woburn, MA, USA) (Figure 1C). Two pumps were used to mix the electrolyte in either chamber.
One reactor was used as a control with an open electrical circuit and the second one as the MES where the cathode was polarized by a potentiostat (Autolab PGSTAT30 with FRA32 and software Nova 1.10, Metrohm Autolab B.V, Utrecht, The Netherlands). A saturated calomel electrode (SCE) was used as a reference electrode (Radiometer Analytical REF401 Reference Electrode, Hach Company, Loveland, CO, USA) with a potential +244 mV vs. a standard hydrogen electrode. Both chambers also had openings for gathering gas and water samples.

2.2. Inoculum and Synthetic Wastewater Characteristics

Activated sludge was taken from a basin of the Tartu municipal wastewater treatment plant where annamox and denitrification processes are performed. The collected sludge was then centrifuged with a relative centrifugal force of 3550 g for 10 min to separate the sludge from the wastewater and used as an inoculum in the cathodic chamber.
Synthetic wastewater was used as electrolyte in both chambers and was made out of tap water, where 4.644 g L−1 Na2HPO4, 1.747 g L−1 NaH2PO4, 1.394 g L−1 NaHCO3, and 0.165 g L−1 KNO3 were added [17].

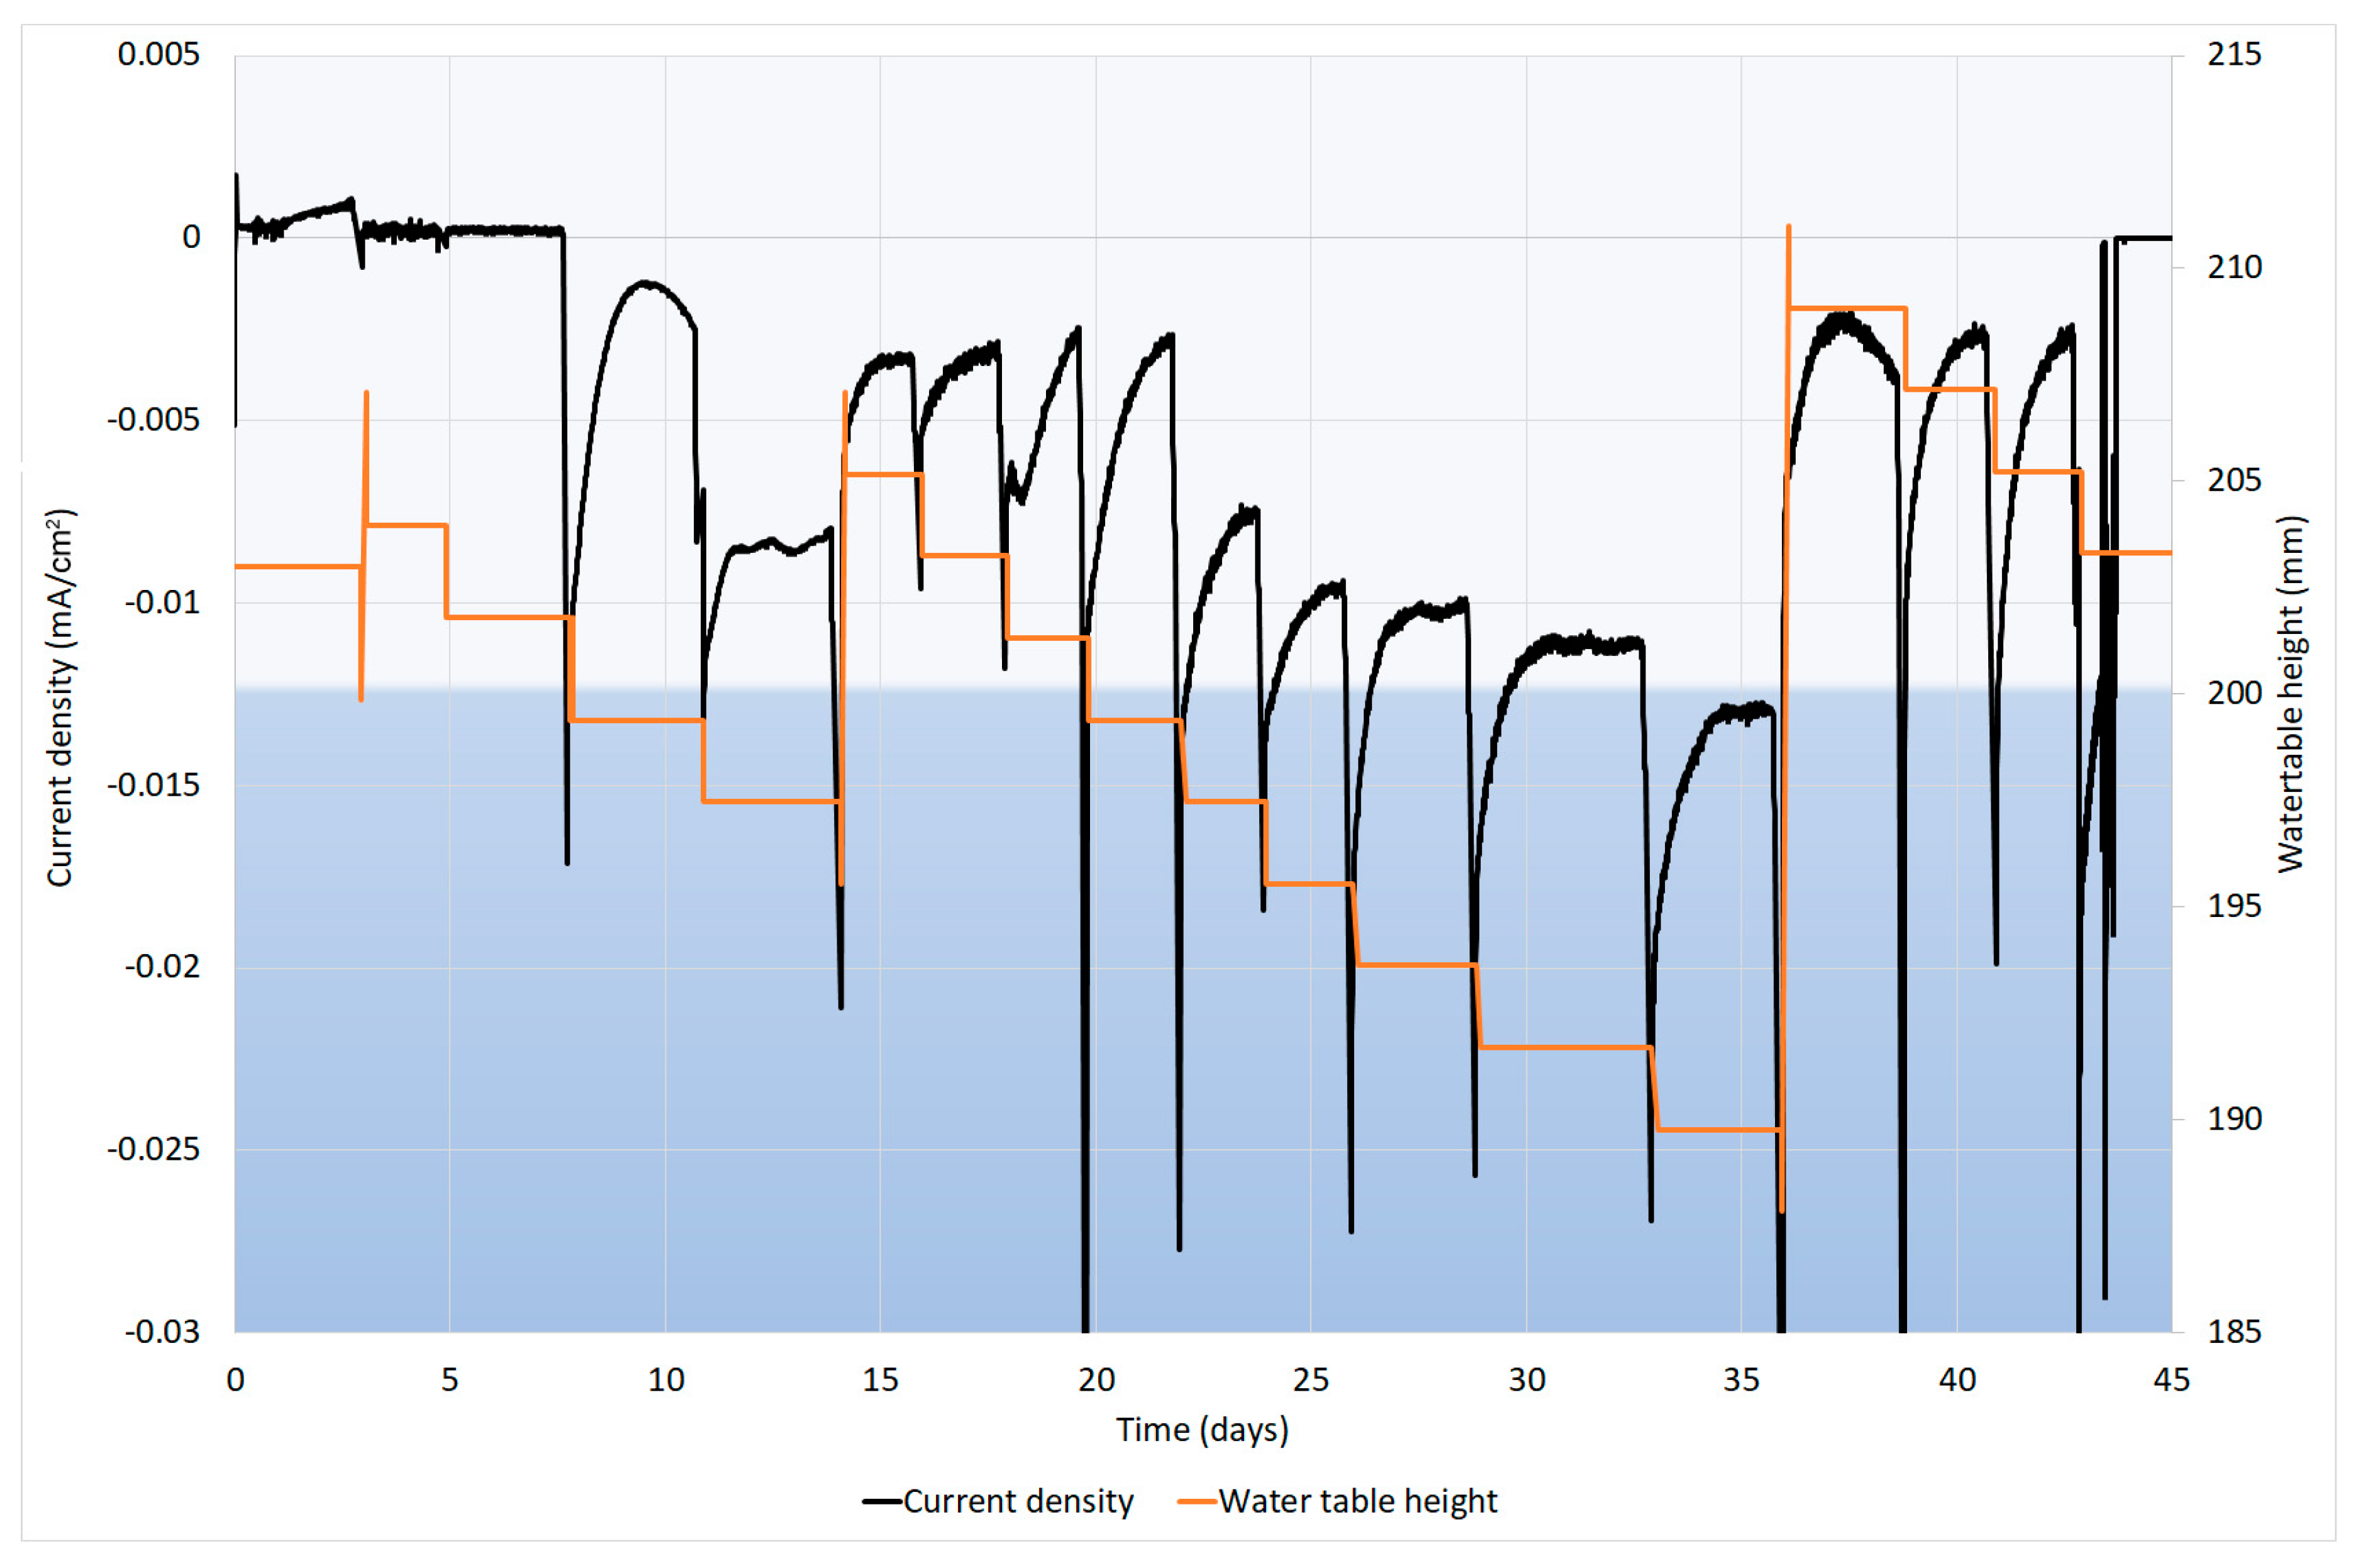
2.3. Operating Conditions

Both reactors were operated as patch reactors. At the beginning of the experiment, the reactors were filled with synthetic wastewater: 4.22 L and 1.29 L to the cathodic and anodic chambers, respectively. Then, 40 g of pretreated inoculum was added to the cathodic chambers. After that, the reactors were purged with N2 until the dissolved oxygen (DO) concentration dropped below 0.30 mg O2 L−1.
Then, the circulation pumps were turned on and the cathode polarization was posed at +150 mV vs. SCE for 7 days to enhance biocathode inoculation. On the eighth day, the polarization was changed to −550 mV vs. SCE to enhance the denitrification, as has been proven to work in previous articles [37].
The entire experiment lasted for 45 days and during that time, gas (from the cathode chamber) and water samples (40 mL from the cathode and anode chambers) were collected after every 2 to 4 days depending on the rate of NO3 removal. Every time samples were collected, the DO concentration, pH, and temperature were measured and cyclic voltammetry measurements and electrochemical impedance spectroscopy were performed.
When the NO3 concentration in the cathodic chamber dropped below 5 mgN L−1, the KNO3 was added. NaOH and HCl was added to the cathodic and anodic chambers accordingly to maintain the pH at around 7.

2.4. Chemical Analysis

Dissolved organic carbon (DOC) and total nitrogen (TN) were analyzed with a Vario TOC cube (Elementar Analysensysteme GmbH, Langenselbold, Germany) following EVS-EN 1484 and EVS-EN 12260 standards, respectively. Ammonium (NH4+), NO3‾, and NO2 concentrations were measured spectrophotometrically using USEPA-8038 Hach Lange Nessler, SFS 5752, and SFS 3029 methods, respectively.
The DO concentration, pH, and temperature were measured using a WTW Multi 3420 instrument and WTW FDO 925, WTW pH-Electrode SenTix 940-3, and WTW FDO 925 detectors, respectively.

2.5. Gas Analysis

CO2, CH4, and N2O gas fluxes were measured using the closed chamber method [38]. Gas samples were drawn from the 0.2–0.6 L and 0.1–0.5 L chamber headspace (cathodic chamber and anodic chamber, respectively) in pre-evacuated (0.3 mbar) 50 mL glass bottles six times an hour (sample time-points: 0, 10, 20, 40, 50, and 60 min) using polypropylene syringes through a silicon tube. The gas samples were analysed for CO2, CH4, and N2O concentrations using a Shimadzu GC-2014 gas chromatograph combined with a Loftfield automatic sample injection system, an electron capture detector for CO2 and N2O, and a flame ionization detector for CH4 [39]. Since the gas concentration in the chamber increased in a near-linear fashion, a linear regression was applied to calculate the gas fluxes. Flux measurements with a coefficient of determination (R2) of 0.9 or greater were used in further analyses.

2.6. Statistical Analysis

Shapiro–Wilk tests were used to check the normality of variables and as the distribution of the data was skewed, we used non-parametric Kruskal–Wallis test to analyze the differences between water chemical parameters and GHG emissions between control and MES. The analyses were performed by using R version 3.4.4 (R Core Team, Vienna, Austria) software. The level of significance of p < 0.05 was accepted in all cases. To evaluate different parameter effects on the current density, a Pearson r linear correlation was used.

3. Results and Discussion

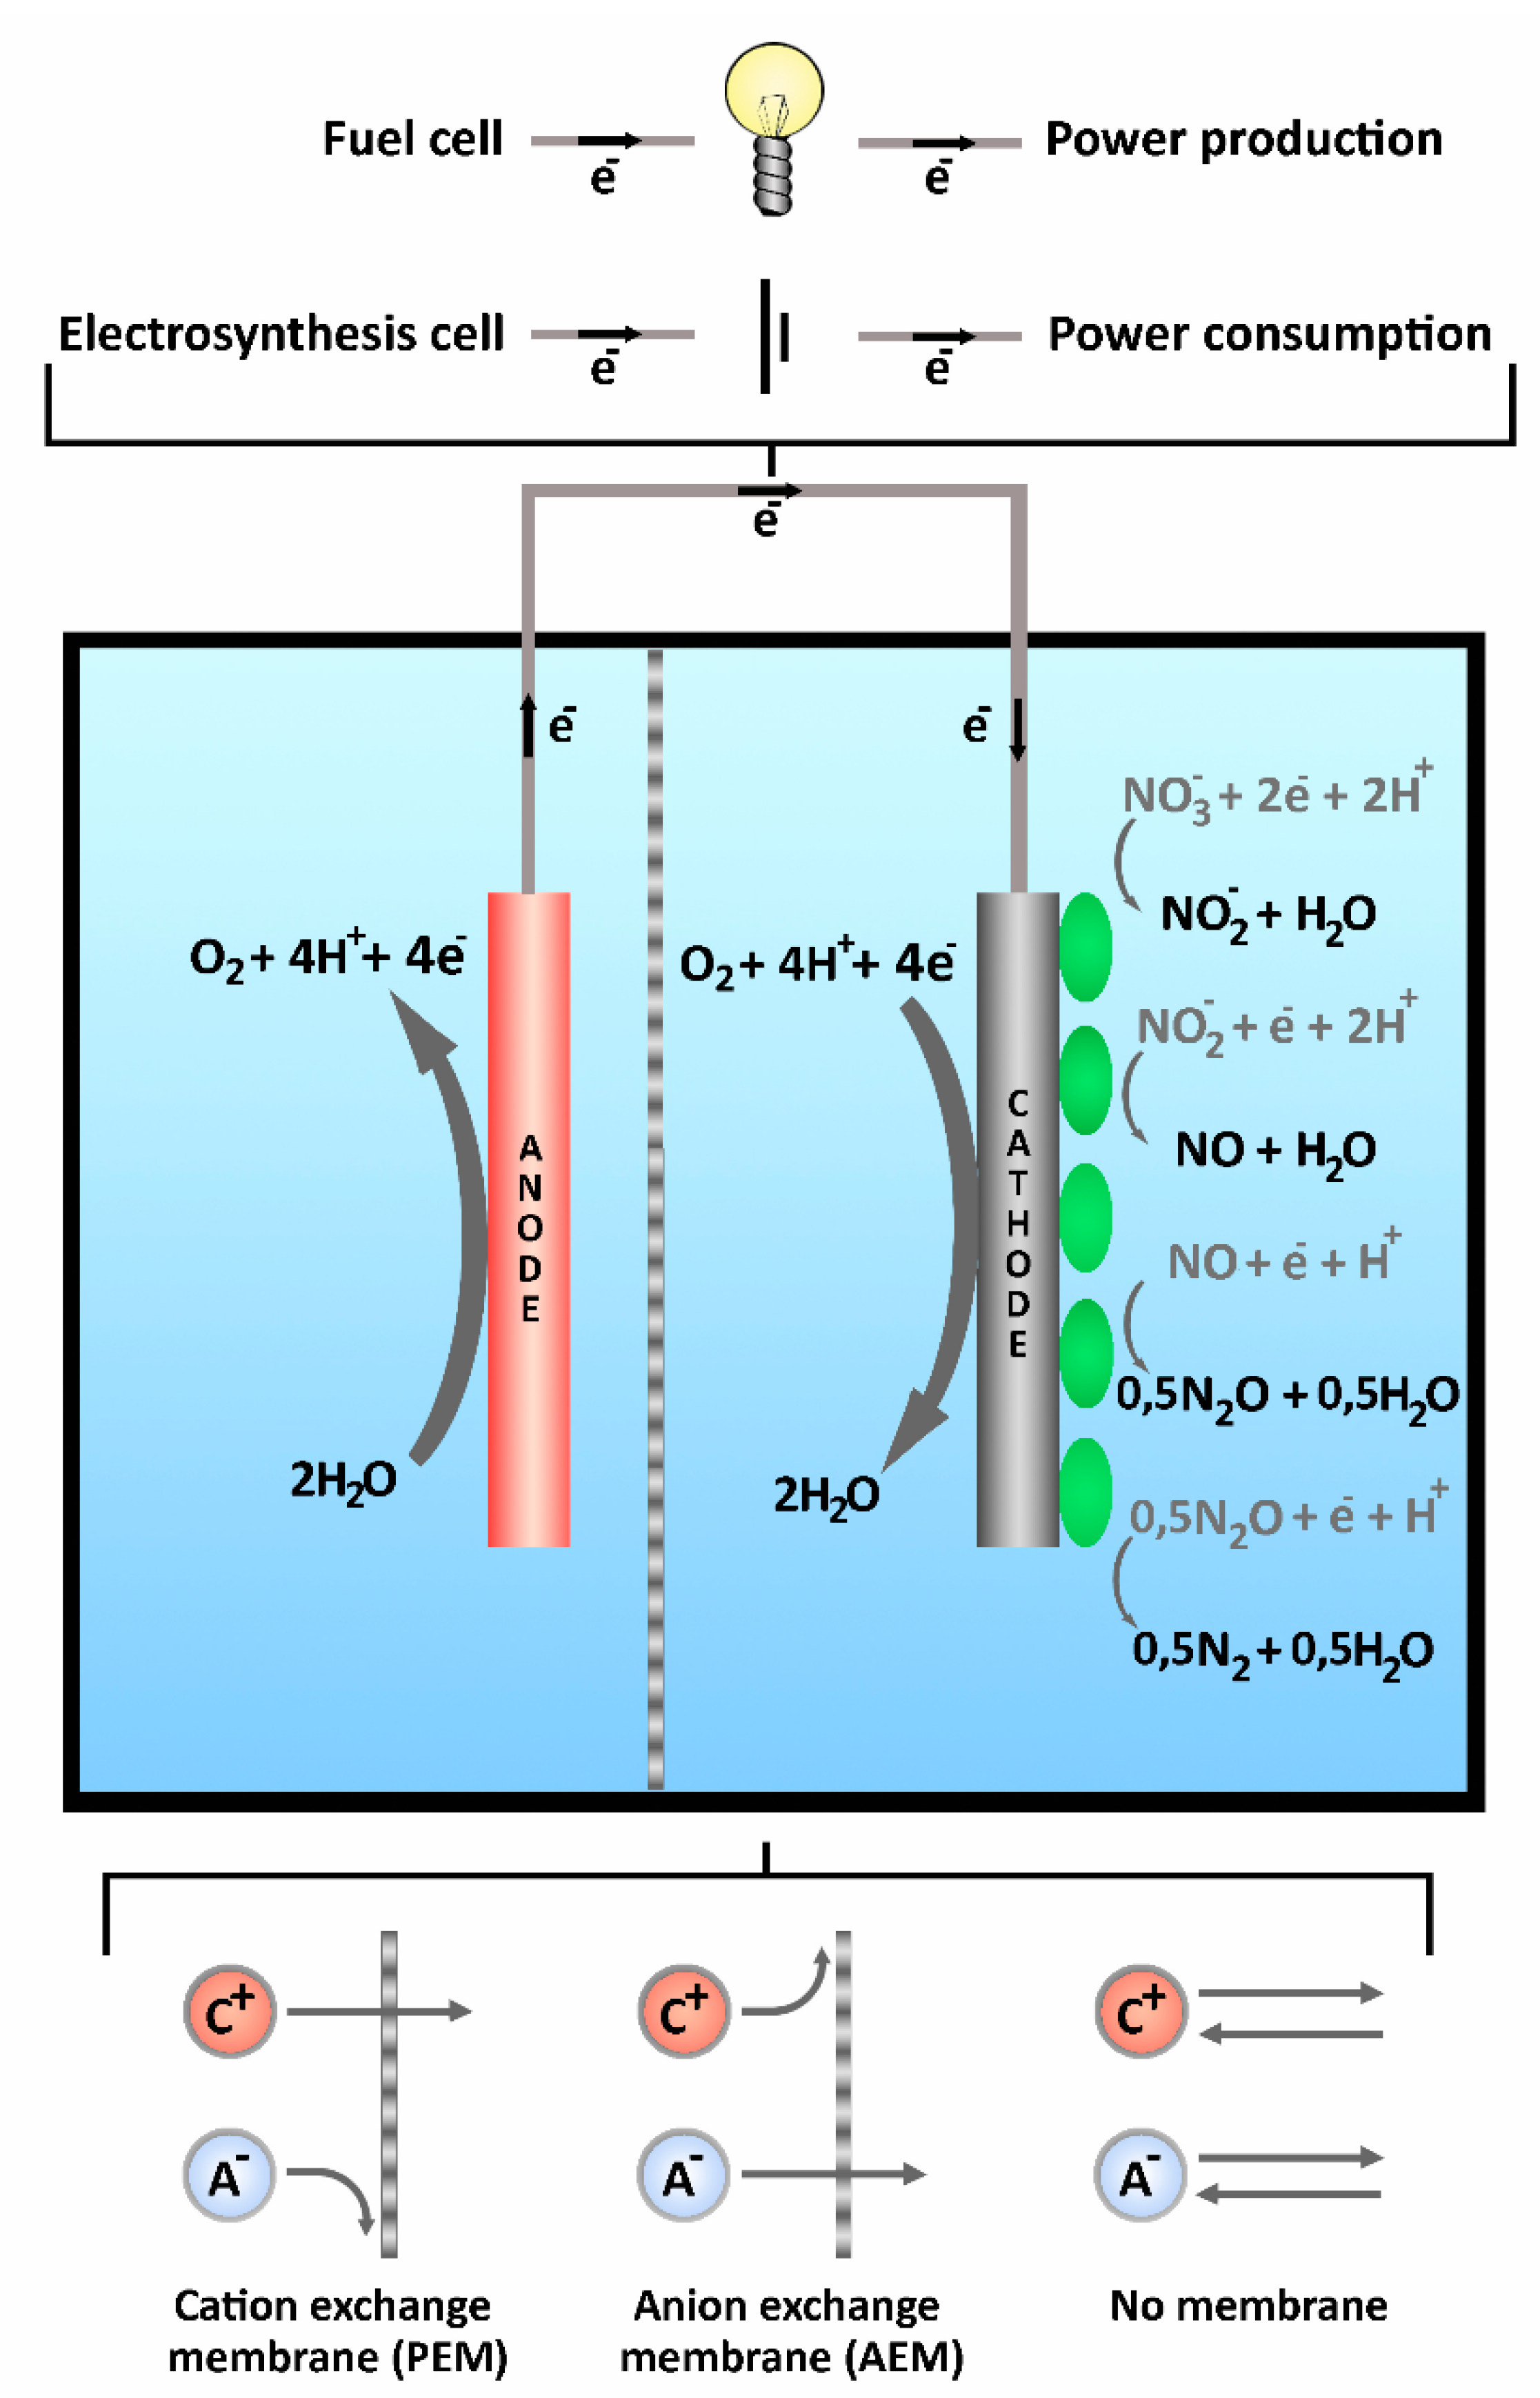
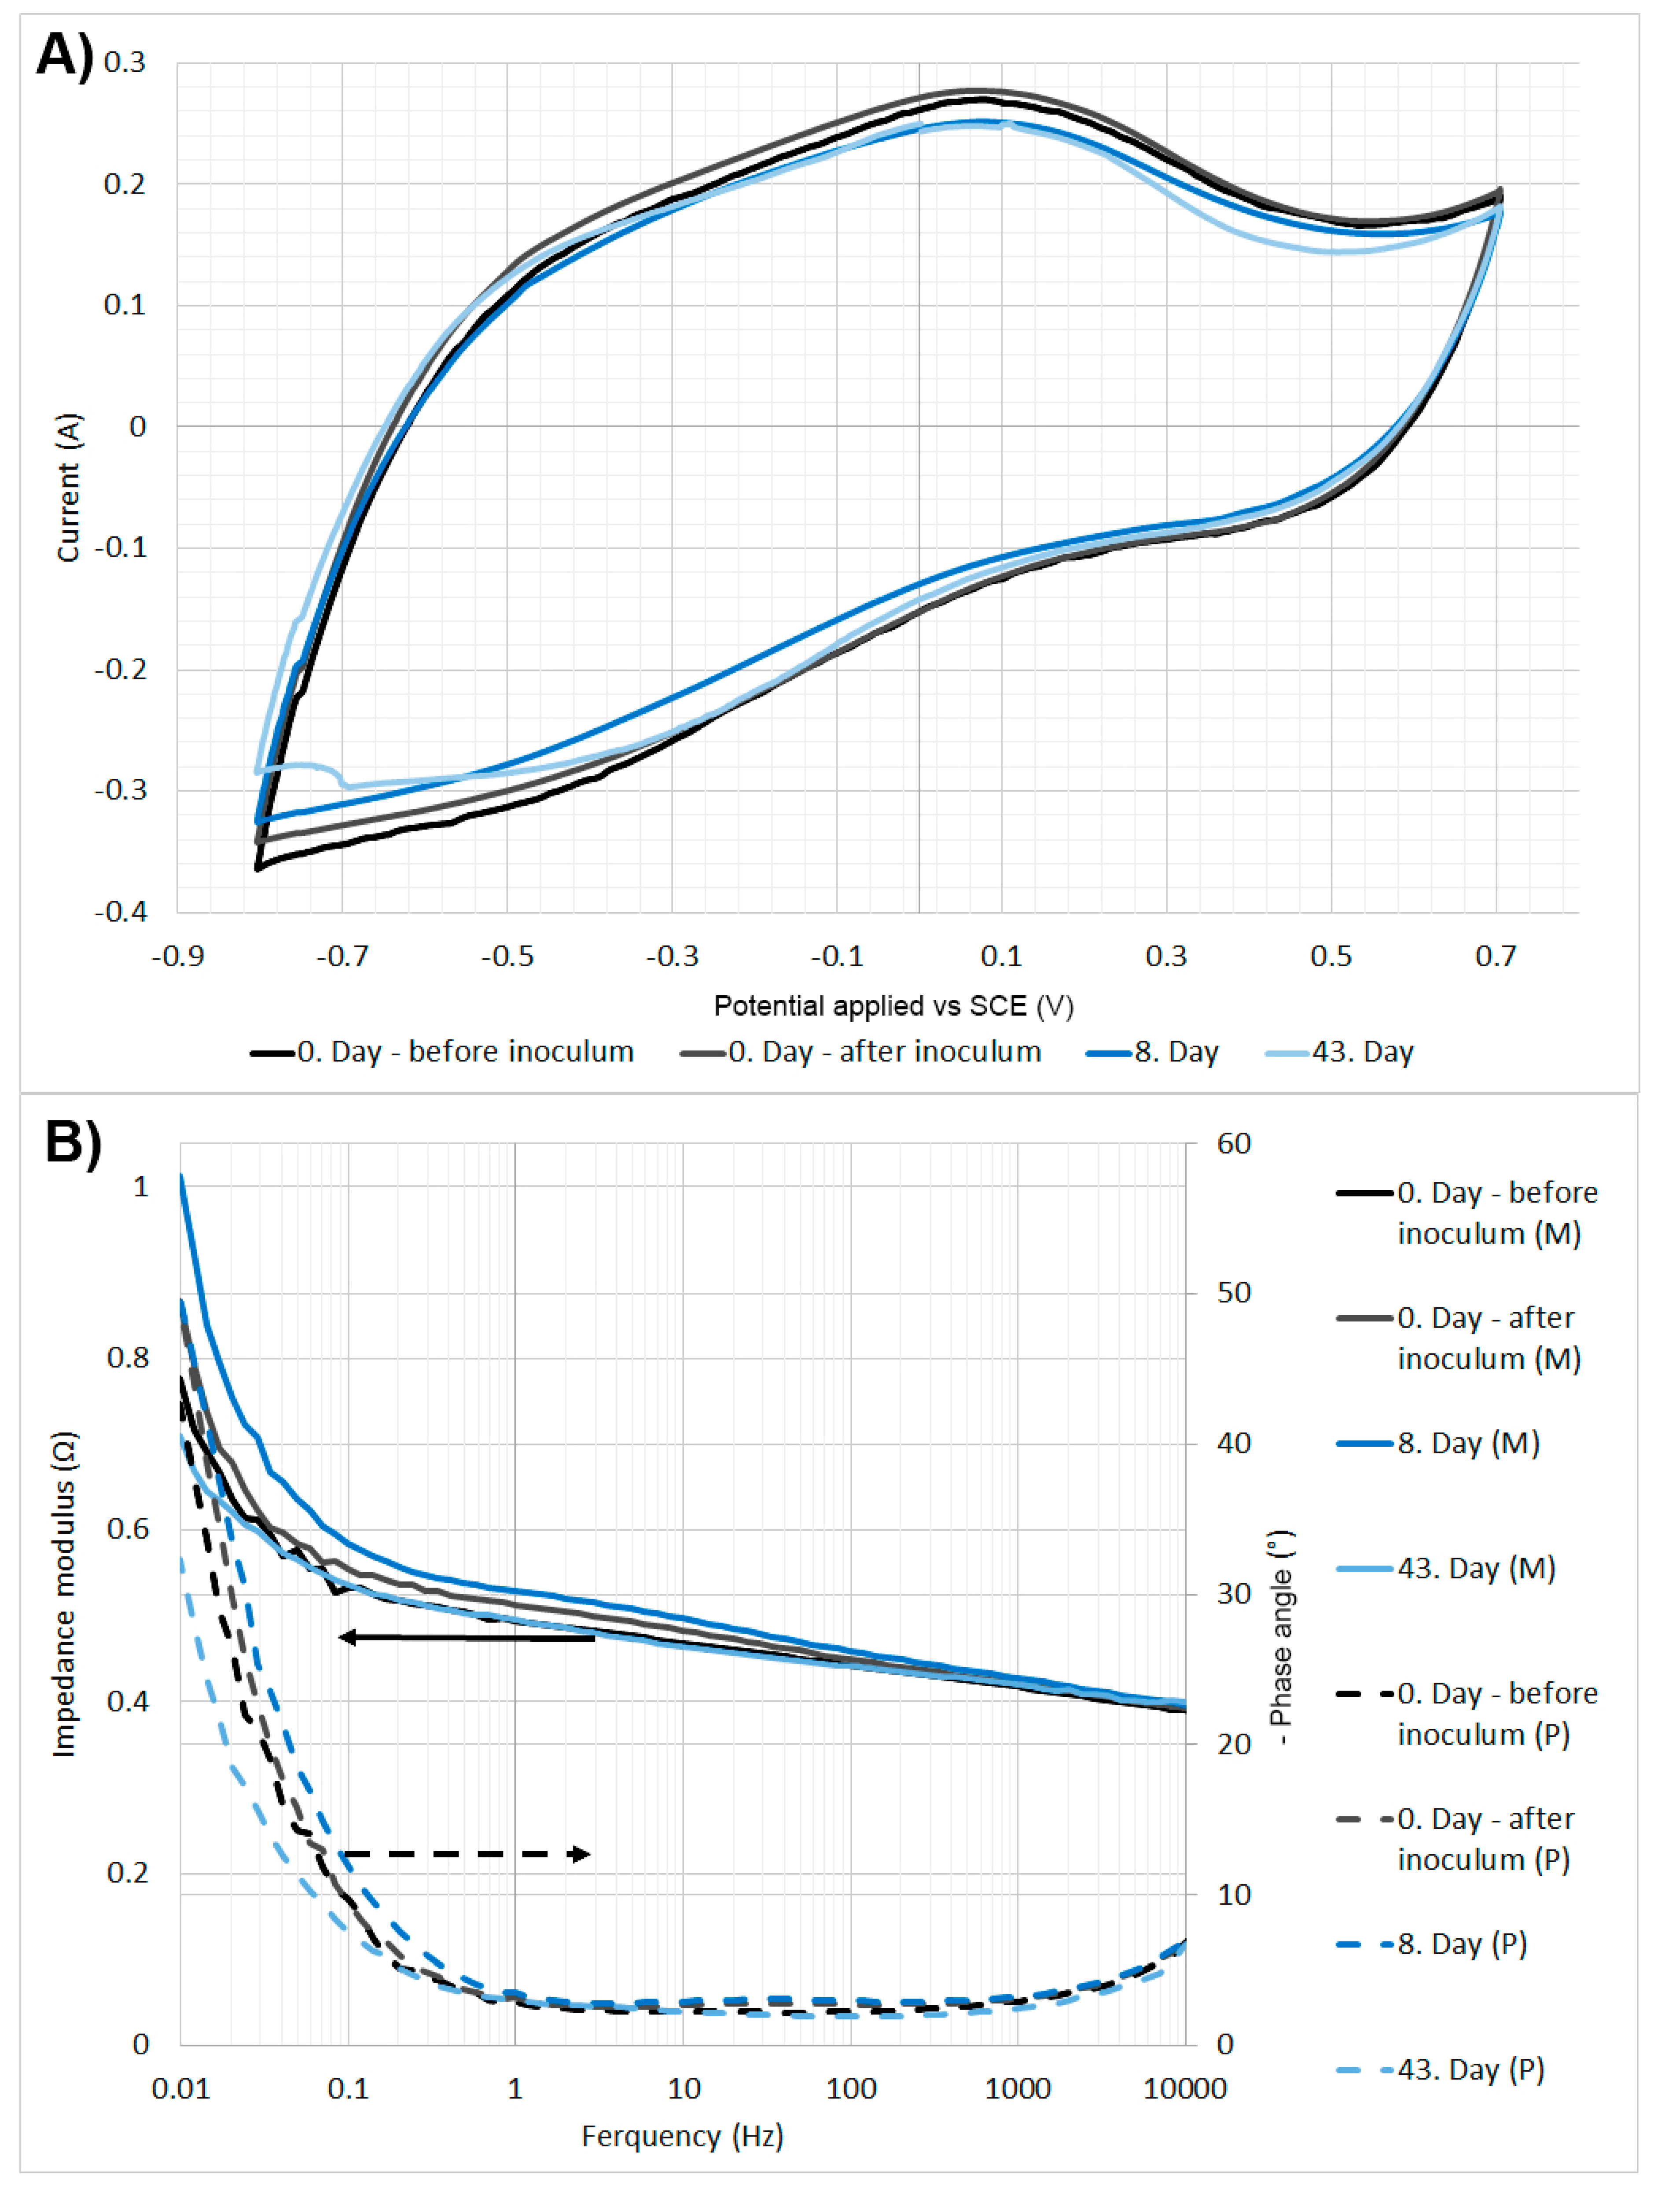
3.1. Microbial Electrosynthesis Cell Performance
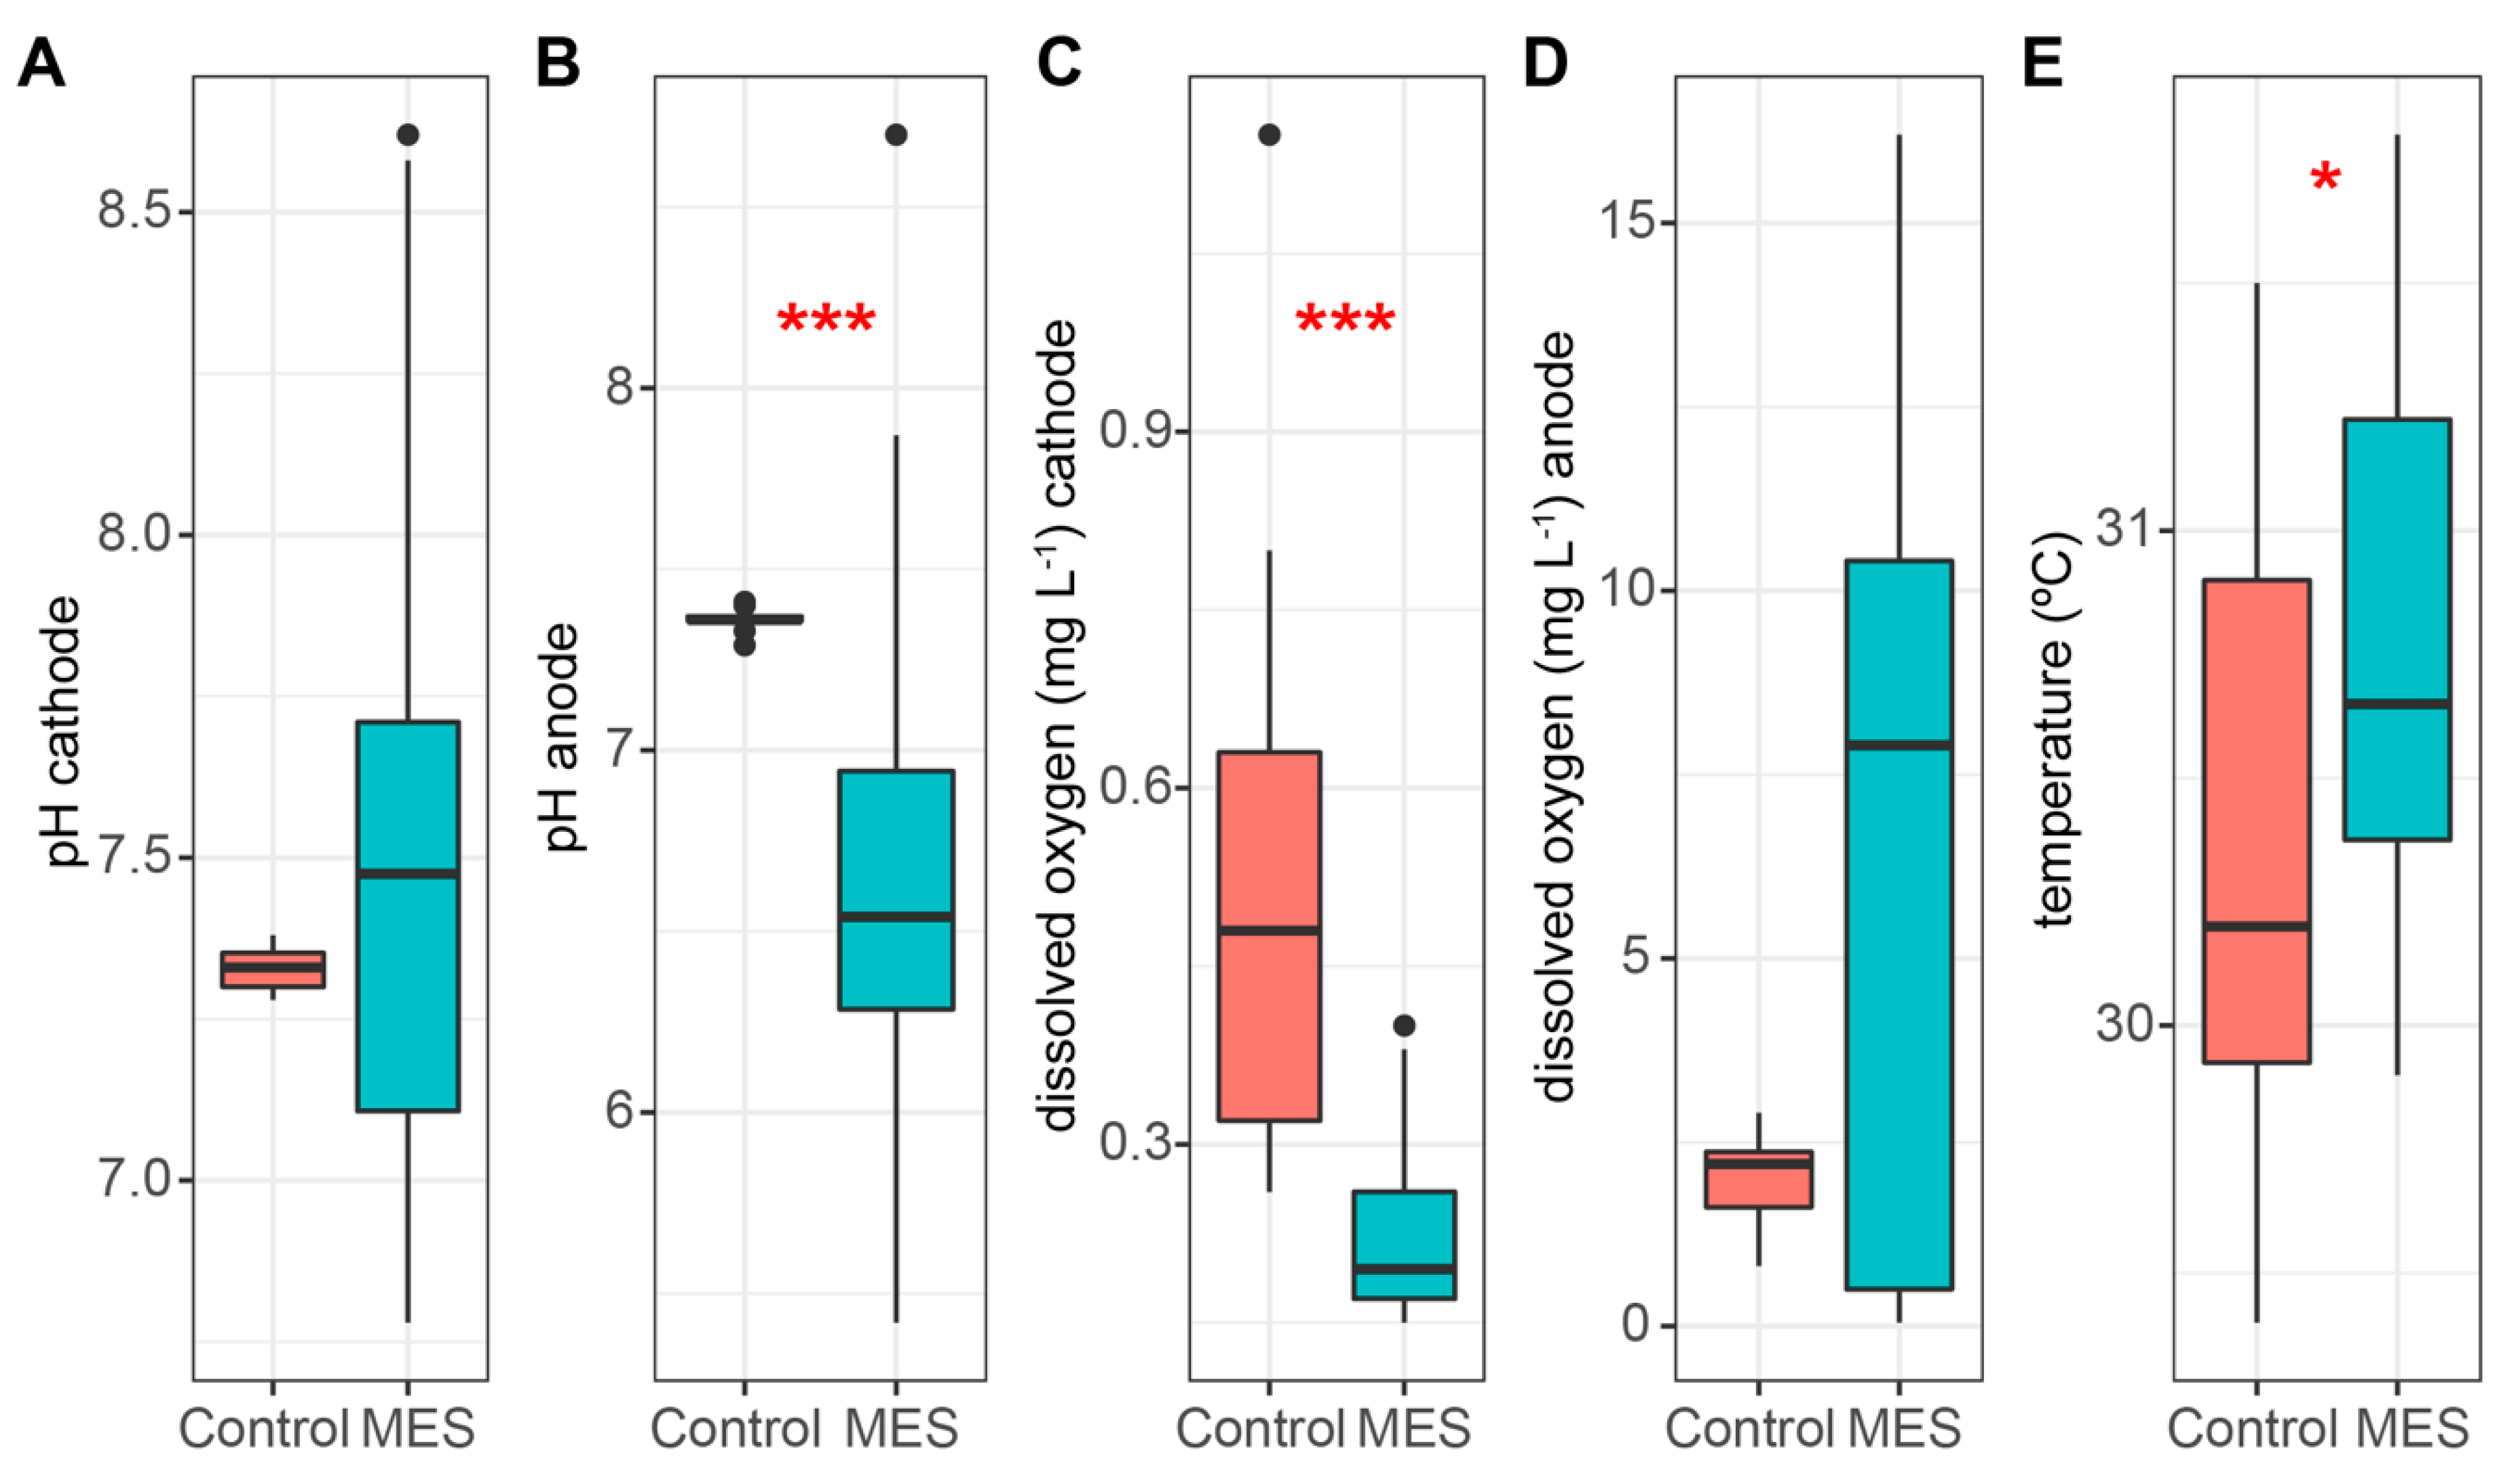
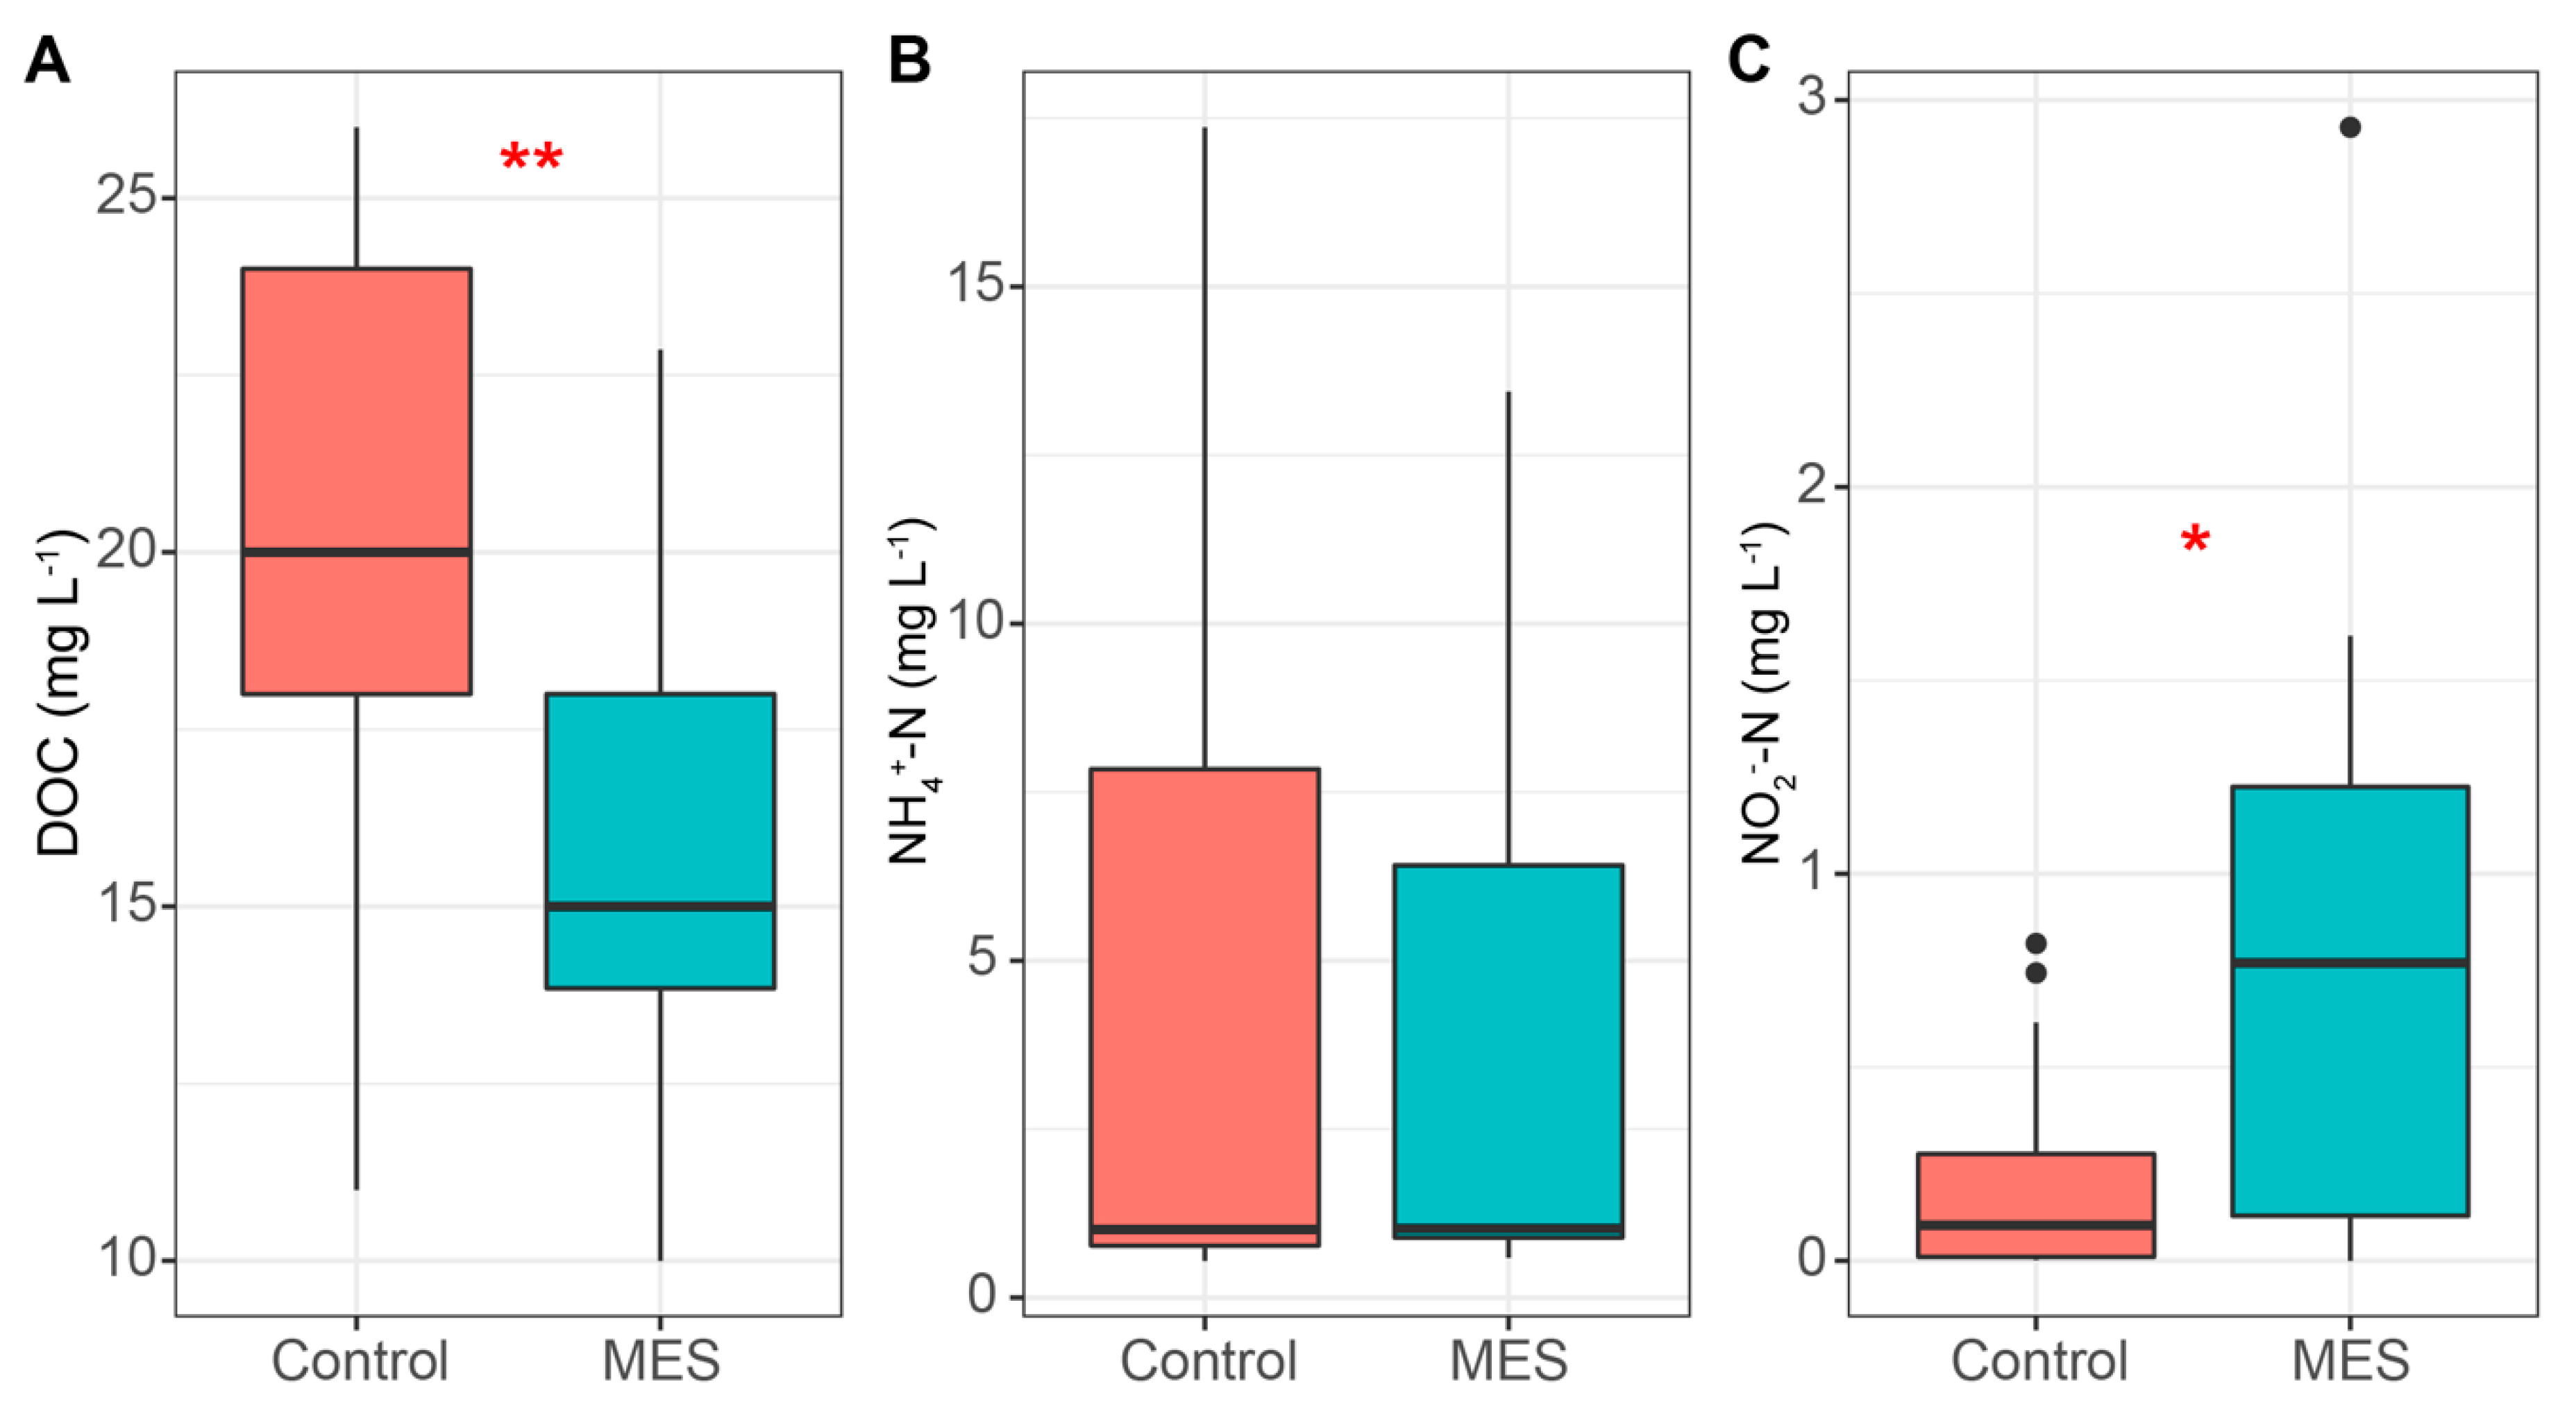
During the inoculation period (days 0–7) when the cathode polarization was posed at +150 mV vs. SCE, the current density showed no changes, although the NO3 concentration dropped below the detecting range twice (Figure 2). At the same time, the NH4+ concentration increased and it could have been caused by ammonification (3) or dissimilatory nitrate reduction to ammonium (DNRA) (4) [10,24,40]. It is possible that the initial drop in NO3 could have been caused not just by denitrification but also by DNRA and anammox (5) [40]. However, it was the same in both reactors so the use of polarization did not seem to have an effect.
R-NH2 → NH4+
NO2 + 3/4CH3COO + 5/4H+ + H2O → NH4+ + 3/2HCO3
NH4+ + NO2 → N2 + 2H2O.
After changing the cathode polarization to −550mV vs. SCE on day 8, the cathodic current density |j| started to rise, although the correlation was opposite to what was anticipated. As NO3 was, in this case, a reagent, the cathodic current density should have been higher when more NO3 was present, as it have been presented in previous studies; however, in this case, it was the opposite [20,41].
During days 8 to 14, the NH4+ concentration started to decrease and was most probably used in the annamox process with NO2 [10]. After the NH4+ concentration dropped below 12 mg N L−1 the NO2 concentration started to rise, indicating that there was NO2 in the system, but was most probably used in the annamox process when NH4+ was present. Nitrification at that point was improbable as both reactors had low DO concentrations (around 0.25 mg O2 L−1) and during that time, the NO3 concentration still declined. Therefore, the changes in processes were mainly related to the initialization of experiment where microorganisms were introduced to the new environment, causing changes in the bacterial community and were less caused by the change of polarization from +150 mV to −550 mV vs. SCE, as the control reactor was behaving in the same way as MES.
From day 14 to 36, the difference in MES and control reactor appeared. This was most probably caused by the depletion of easily degradable organic compounds that were introduced to the system with inoculum, meaning that the reactors did not have enough organic compounds needed for denitrification anymore. During that time, the NO3 removal rate was also lowered in the MES reactor, but not as much as in the control, indicating that the cathode electrode was able to act as the electron donor for denitrifying bacteria, therefore enhancing NO3 removal by autotrophic denitrification. As the NO3 concentration dropped below 5 mg N L−1, a new patch of KNO3 was added on day 36. During days 36 to 45, the NO3 removal rate was still higher in the MES compared to the control, but the experiment ended, as the anode electrode was largely damaged by corrosion and the connection between the potentsiostate and anode electrode was lost.
Current density was significantly correlated with the water level (p = 0.013; r2 = 0.411). As shown in Figure 3, the cathodic current density was higher when the water level was lower. As the cathode was able to reduce O2, it can be said that the increase of current density was caused by the reduction of O2 on the electrode. When the water level dropped, more O2 was present in the system, resulting higher cathodic current density. Statistical analyses also show a significant correlation (p = 0.048; r2 = 0.286) between the DO concentration and current density. Water table height had a better correlation than DO concentration because the latter does not include the effect of the electrode being exposed to the gaseous phase. When the water table height was lower than 200 mm, the upper part of the electrode was exposed to the gaseous phase and more oxygen was able to be in contact with the electrode, resulting in an increase in the current density.
On days 0, 8, and 43, cyclic voltammetry (CV) was performed from −800 mV to +700 mV vs. SCE at a scan rate of 2 mV s−1 (Figure A2A). On the first day, CV was performed before and after inoculation. No reduction peaks or any significant changes were observed in the CV measurements, throughout the experiment. This was mostly due to the characteristics of the cathode electrode, which had a very large surface area and therefore a high capacity, i.e., the other processes were not visible due to the high capacitive current and likely by the lack of bacteria that were able to interact with the electrode. The resistance of the working electrode was measured using electrochemical impedance spectroscopy. Measurements were made for a three-electrode system, the range of frequencies was from 10 kHz to 10 mHz (12 ponts per decade; ∆E = 5 mVrms), and the potential was −350 mV vs. SCE. Throughout the experiment, the resistance of the working electrode stayed stable around 0.45 Ω (Figure A2B).
Although microbial activity did not show any changes in the electrochemical measurements, the use of electrical manipulation showed some increase in TN (Figure 4A) and NO3‾ (Figure 4B) removal efficiency. The average TN removal efficiency and rate were 7.68% (1.89 mg N L−1) and 4.06% (1.00 mg N L−1) day−1 in the MES and control reactors, while the average NO3‾ removal efficiency and rate were 8.54% (1.35 mg N L−1) and 3.66% (0.71 mg N L−1) day−1 respectively. Compared to previous work in which the NO3 removal rate ranged from 27.36 to 98.00 mg N L−1 day−1, the removal rate in the current experiment was low [17,21,42]. This could have been caused by the lack of electroactive bacteria in the inoculum and by the short experiment period, as it takes time for a bacterial community to develop; however, this cannot be said in certainty as no microbial analyses were conducted during the experiment. A possible factor that caused the low nitrogen removal rate might have been the strong pH changes in the cathode chamber, which also inhibits denitrification when it leaves the optimal range of 7.0–7.5 (Figure 5A) [10], or possibly, a biofilm could not form on the cathode as no extra micronutrients were supplied with the synthetic wastewater.

3.2. Water Quality

As O2 can inhibit the denitrification process above concentrations of 0.5 mg O2 L−1, the DO concentration was monitored [10]. The MES showed significantly lower DO concentrations compared to the control reactor, at 0.23 and 0.59 mg O2 L−1, respectively (Figure 5C). A lower DO concentration in the MES could be caused by the reduction of O2 on the cathode. Starting on day 20, the DO concentration started to rise in the control reactor, reaching a concentration of 0.58 mg O2 L−1 on day 26 and going above 0.8 mg O2 L−1 on day 41, while in the MES, the DO concentration stayed under 0.4 mg O2 L−1. Based on previous studies, it is possible that the O2 was starting to inhibit the denitrification process in the control reactor at the end when the DO concentration rose above 0.5 mg O2 L−1 although the NO3- removal efficiency did not show any decline during that time [10]. In the MES anode chamber, the DO concentration was much higher (average value 6.68 mg O2 L1) due to the electrolysis. Meanwhile, the oxygen concentration stayed low in the cathode chamber and therefore, it is clear that the cation exchange membrane is a good barrier for oxygen in these systems (Figure 5C,D).
The temperature (Figure 5E) was slightly higher in the MES compared to the control reactor, at 30.8 and 30.3 °C, respectively. The higher temperature in the MES could be caused by the electrical resistance of the electrolyte between the electrodes and hydrolysis. As the temperature variation was small, the effect on the NO3 removal efficiency between the control and MES can be considered as non-existent. Overall, the temperature was in a range that is suitable for denitrifying bacteria (25–30 °C) and cannot be considered as a reason for the relatively low nitrogen removal efficiency [10,43].
The pH was strongly influenced by electric manipulation. In the MES the pH had to be constantly regulated by adding HCl and NaOH to the cathode and anode chamber, respectively, while the control reactor did not need any pH regulation. This resulted in a wide pH variation (Figure 5A,B) in the MES, but in the cathode chambers, where nitrogen removal efficiency was studied, the pH did not show statistically significant discrepancy (Figure 5A). The pH mean value was around 7.38 and 7.35 in the MES and control reactor respectively, which is within the optimal range [10,31]. The pH is important as it influences bacteria and therefore the nitrogen removal efficiency [31].
During the experiment, the DOC was measured to ensure that the MES did not have a higher DOC/N ratio than the control reactor, as organic carbon compounds are used for heterotrophic denitrification [25,35]. As shown in Figure 6A, the MES had a significantly lower DOC concentration compared to the control reactor at 15.2 and 19.9 mg C L−1, which indicates that the organic carbon concentration could not have been the reason why nitrogen removal efficiency was better in the MES. During the experiment the DOC did not change enough to say much about the organic compounds being used for heterotrophic denitrification; however, it showed that the DOC was similar enough in both reactors to not have any significant effect on the discrepancy of nitrate removal rate.
The rise in NH4+ concentration was presumably caused by the DNRA and ammonification, as stated previously, and was most probably used in the anammox process until the 22nd day, when the concentration dropped below the detection range in both reactors [44]. Overall the mean NH4+ concentrations (Figure 6B) were essentially the same, 4.51 and 5.25 mg N L−1 in the MES and control reactor, respectively. During the time when NH4+ concentrations started to decline, NO2 started to accumulate. In the MES reactor (Figure 6C), the NO2 concentrations were significantly higher compared to the control reactor, at 0.82 and 0.21 mg N L−1, respectively. A rise in NO2 concentration is common in MES, where autotrophic denitrification is being performed [29,45]. This is likely caused by the enhancement of denitrifications first stage, where NO3 is reduced to NO2, which is also the most rapid stage of denitrification, causing the accumulation of NO2 [46].

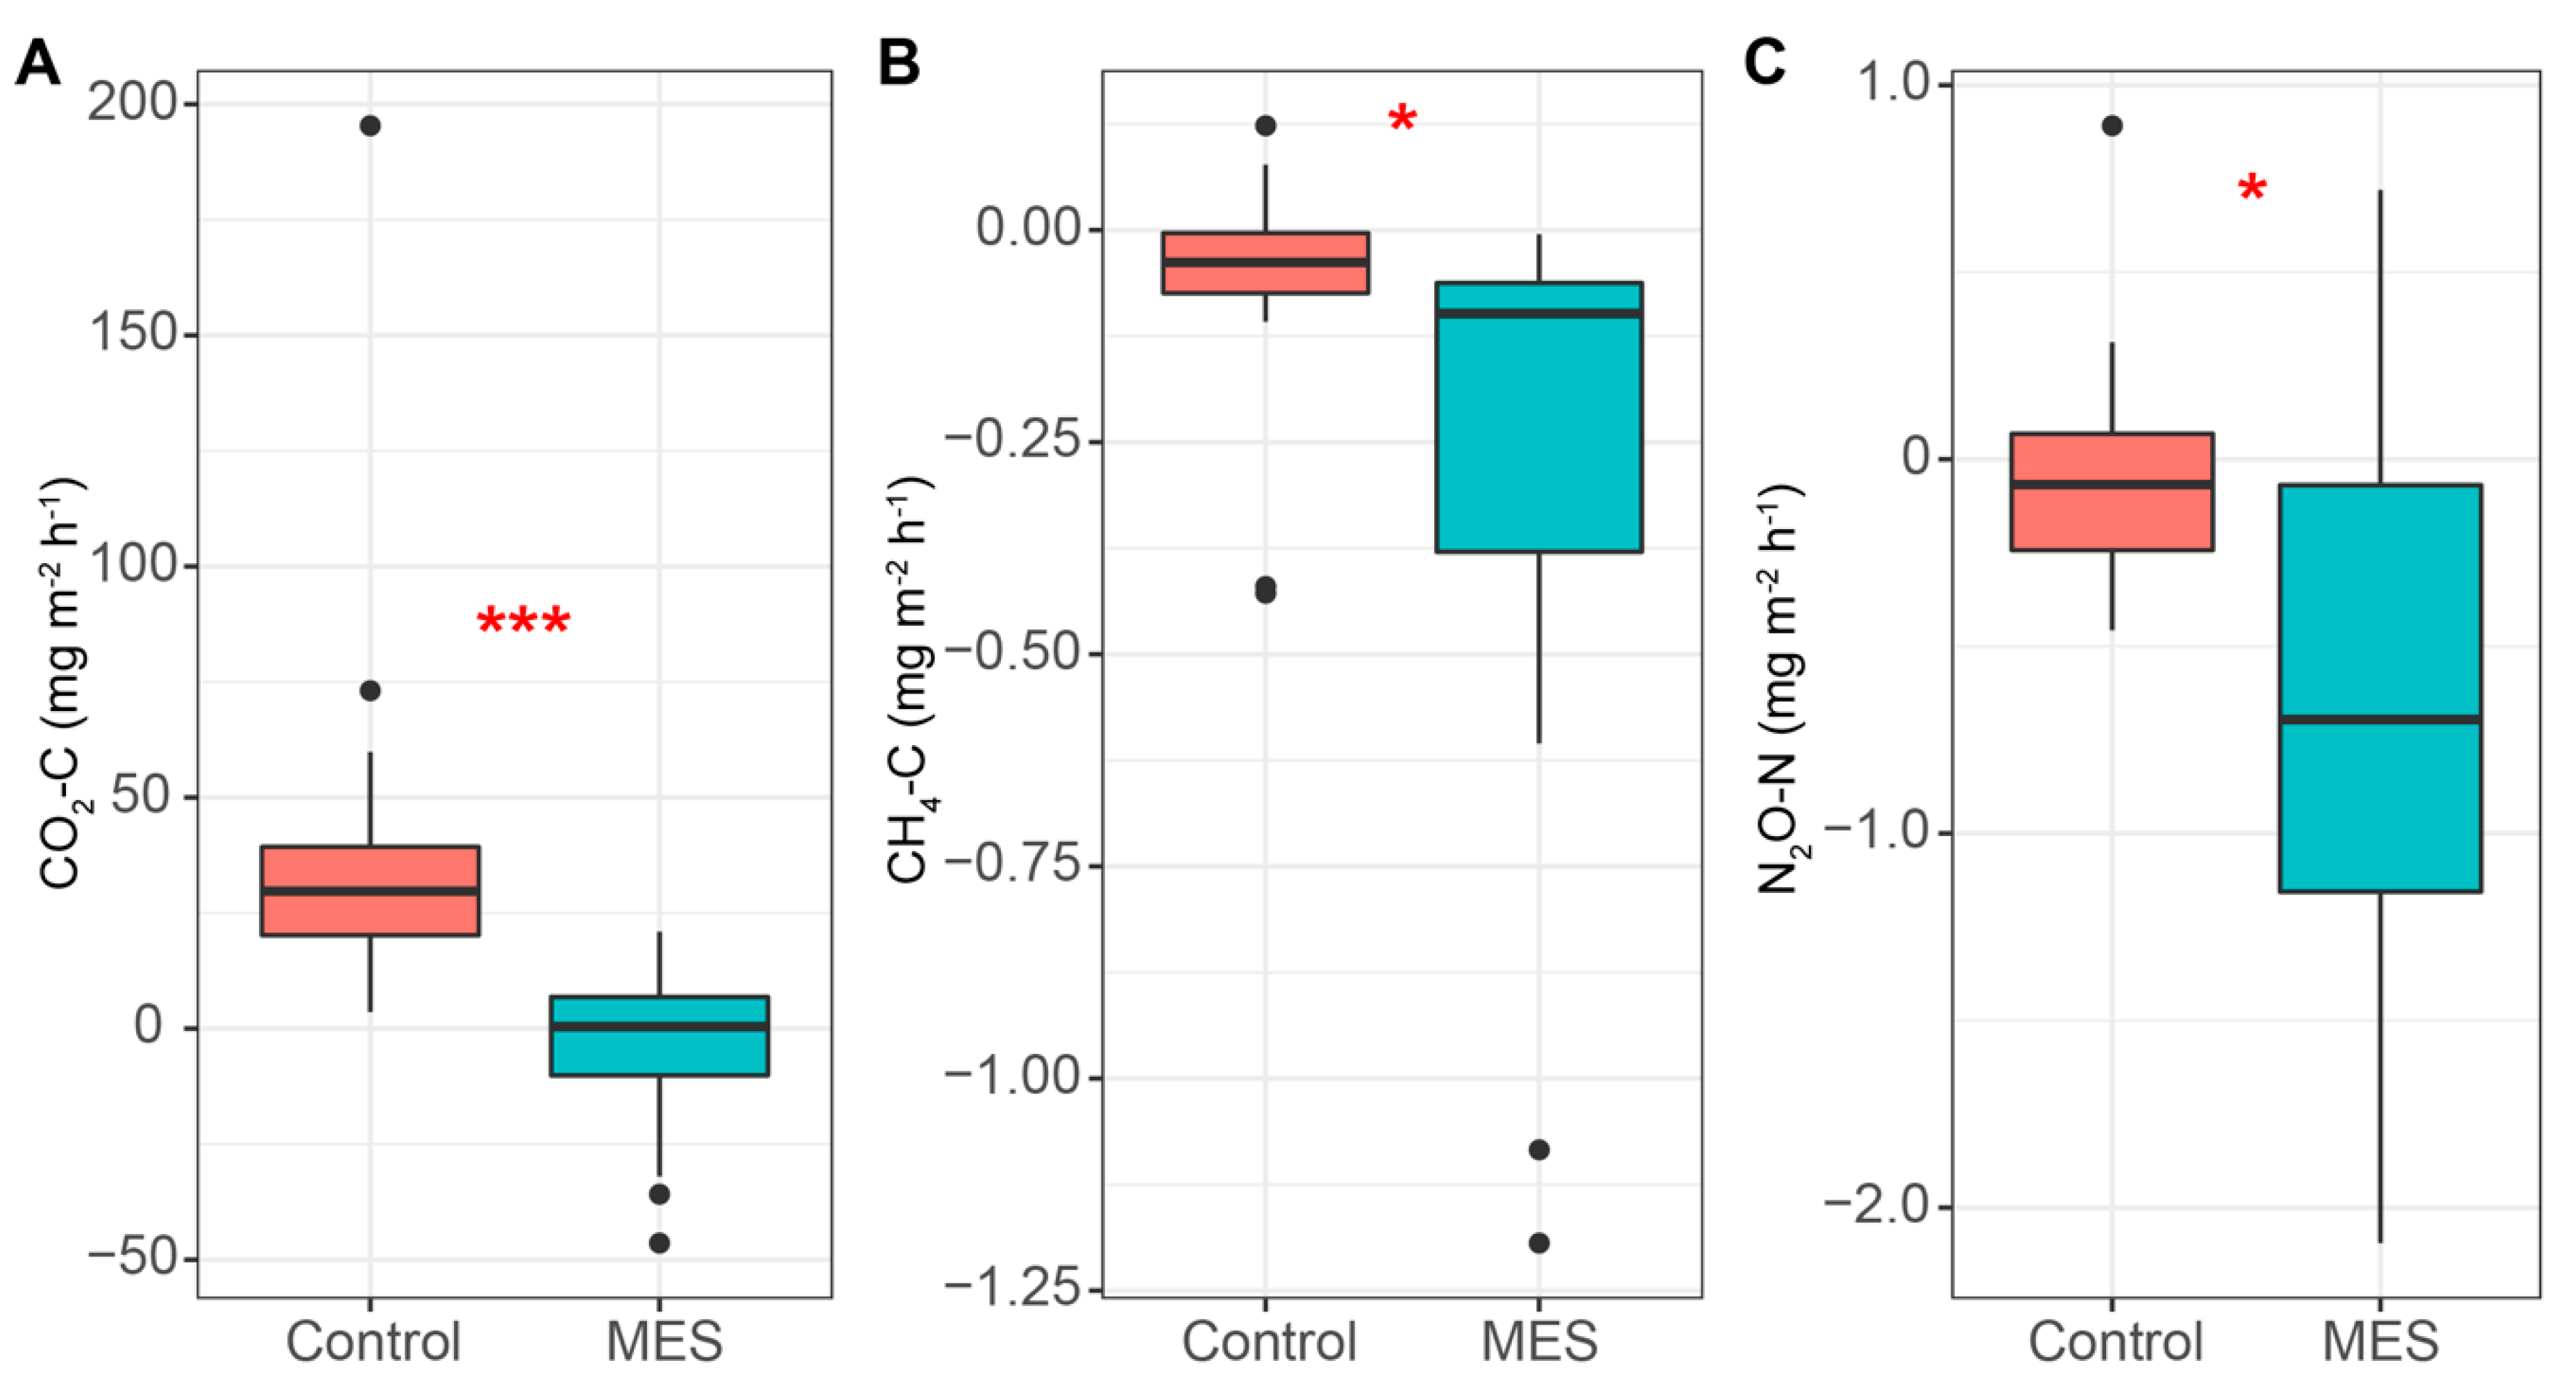
3.3. Greenhouse Gas Emissions

Greenhouse gas measurements showed lower fluxes throughout the experiment in the MES (Figure 7). On average lower CO2 fluxes (Figure 7A) in the MES (−5.28 mg C m2 h1) against the control (43.79 mg C m2 h1) may have been caused by autotrophic denitrification, where CO2 is used as a carbon source. In heterotrophic denitrification, organic carbon compounds are oxidized, resulting in a release of CO2 (reactions 1 and 2).
The MES showed some ability to act as a sink for CH4 (Figure 7B); however, the fluxes were very low, averaging −0.31 and −0.08 mg C m2 h1 for the MES and control, respectively, and this was encountered only at the beginning of the experiment (days 3 to 8). At the same time, when the CH4 was consumed, the ammonium concentration rose, which indicates that it could have been used for CH4-dependent nitrate reduction to ammonium [40].
N2O fluxes showed a much larger variation in the MES (Figure 7C), but the mean value was significantly lower than in the control reactor, at −639.59 and −9.15 µg N m−2 h−1, respectively. As the NO3 removal rate was higher in the MES, it could not have been caused by the lack of denitrification in the reactor. This means that lower N2O fluxes from the MES could have been caused by the electric enhancement and most of the NO3 was completely denitrified to nitrogen gas. Previous work has also shown that less N2O is emitted during denitrification when more electron donors are present [25].

4. Conclusions

Our results show that the MES increased NO3 removal efficiency from 3.66% day−1 in the control to 8.54% day−1 in the MES and TN removal efficiency from 4.06% day−1 in the control to 7.68% day−1 in the MES. We measured CO2, CH4, and N2O fluxes and found significant decreases in all GHGs. Nafion 117 cation exchange membrane acted as an excellent oxygen barrier and kept the DO concentration low in the cathode chamber while DO concentrations were high in the anode chamber. The use of a two-chamber system with cation exchange membrane also caused strong pH changes and due to that, one chamber reactor could achieve better results in future studies, but only if oxygen formation on the anode electrode is suppressed. Although the MES showed a better nitrogen removal efficiency compared to the control, it was still lower than some other studies have shown. This could have been caused by the lack of bacteria that could engage with the electrode in the current inoculum. Thus, in future studies, specific bacteria must be used to inoculate the reactors more efficiently.

Author Contributions

Conceptualization, R.L. and Ü.M.; methodology, R.L., Ü.M.; software, R.L.; validation, R.L., Ü.M., K.K. and J.N.; formal analysis, R.L.; investigation, R.L., J.N., Ü.M. and K.K.; resources, Ü.M. and J.N.; data curation, R.L.; writing—original draft preparation, R.L.; writing—review and editing, R.L., K.K. and Ü.M.; visualization, R.L.; supervision, J.N., Ü.M. and K.K.; project administration, Ü.M.; funding acquisition, Ü.M. All authors have read and agreed to the published version of the manuscript.

Funding

This study was supported by the Estonian Research Council (PUTJD715, IUT2-16, PRG352 and PRG676); the EU through the European Regional Development Fund (Centre of Excellence EcolChange, Estonia; TK141 “Advanced materials and high-technology devices for energy recuperation systems” (2014-2020.4.01.15-0011)) and by the European Structural and Investment Funds.

Acknowledgments

We thank Alar Teemusk for analyzing gas samples.

Conflicts of Interest

The authors declare no conflict of interest.

Appendix A

Figure A1. A basic setup of the bioelectrochemical system, where water is oxidized on the abiotic anode and NO3 and oxygen are reduced by the biocathode via autotrophic denitrification. The electrodes can be separated by the membrane to process two different types of electrolyte, different type of membranes are shown at the bottom. Electron flow direction when it is operated as a electrosynthesis cell is shown on the wire and different external circuit options are shown on top. Four step autotrophic denitrification is shown on the biocathode [45].
Water 12 00516 g0a1
Figure A2. (A) The biocathode’s cyclic voltammetry from −800 mV to +700 mV vs SCE at scan rate of 2 mV/s. (B) The biocathode’s electrochemical impedance spectroscopy—Bode plot, (M)—modulus, (P)—phase.
Water 12 00516 g0a2

References

  1. Xiao, Y.; Zheng, Y.; Wu, S.; Yang, Z.-H.; Zhao, F. Bacterial Community Structure of Autotrophic Denitrification Biocathode by 454 Pyrosequencing of the 16S rRNA Gene. Microb. Ecol. 2014, 69, 492–499. [Google Scholar] [CrossRef] [PubMed]
  2. Camargo, J.A.; Alonso, Á. Ecological and toxicological effects of inorganic nitrogen pollution in aquatic ecosystems: A global assessment. Environ. Int. 2006, 32, 831–849. [Google Scholar] [CrossRef] [PubMed]
  3. Alabdula’aly, A.I.; Al-Rehaili, A.M.; Al-Zarah, A.I.; Khan, M.A. Assessment of nitrate concentration in groundwater in Saudi Arabia. Environ. Monit. Assess. 2010, 161, 1–9. [Google Scholar] [CrossRef] [PubMed]
  4. Barroso, M.F.; Ramalhosa, M.J.; Olhero, A.; Antão, M.C.; Pina, M.F.; Guimarães, L.; Teixeira, J.; Afonso, M.J.; Delerue-Matos, C.; Chaminé, H.I. Assessment of groundwater contamination in an agricultural peri-urban area (NW Portugal): An integrated approach. Environ. Earth Sci. 2015, 73, 2881–2894. [Google Scholar] [CrossRef] [Green Version]
  5. El Khattabi, J.; Louche, B.; Darwishe, H.; Chaaban, F.; Carlier, E. Impact of Fertilizer Application and Agricultural Crops on the Quality of Groundwater in the Alluvial Aquifer, Northern France. Water Air Soil Pollut. 2018, 229, 128. [Google Scholar] [CrossRef]
  6. Flem, B.; Reimann, C.; Birke, M.; Banks, D.; Filzmoser, P.; Frengstad, B. Inorganic chemical quality of European tap-water: 2. Geographical distribution. Appl. Geochem. 2015, 59, 211–224. [Google Scholar] [CrossRef]
  7. Rahmati, O.; Samani, A.N.; Mahmoodi, N.; Mahdavi, M. Assessment of the Contribution of N-Fertilizers to Nitrate Pollution of Groundwater in Western Iran (Case Study: Ghorveh-Dehgelan Aquifer). Water Qual. Expo. Health 2015, 7, 143–151. [Google Scholar] [CrossRef]
  8. World Health Organization (Ed.) Guidelines for Drinking-Water Quality, 4th ed.; World Health Organization: Geneva, Switzerland, 2011. [Google Scholar]
  9. Kill, K.; Pärn, J.; Lust, R.; Mander, Ü.; Kasak, K. Treatment Efficiency of Diffuse Agricultural Pollution in a Constructed Wetland Impacted by Groundwater Seepage. Water 2018, 10, 1601. [Google Scholar] [CrossRef] [Green Version]
  10. Saeed, T.; Sun, G. A review on nitrogen and organics removal mechanisms in subsurface flow constructed wetlands: Dependency on environmental parameters, operating conditions and supporting media. J. Environ. Manag. 2012, 112, 429–448. [Google Scholar] [CrossRef]
  11. Bezirgiannidis, A.; Marinakis, N.; Ntougias, S.; Melidis, P. Membrane Bioreactor Performance during Processing of a Low Carbon to Nitrogen Ratio Municipal Wastewater. Environ. Process. 2018, 5, 87–100. [Google Scholar] [CrossRef]
  12. Shao, M.; Guo, L.; She, Z.; Gao, M.; Zhao, Y.; Sun, M.; Guo, Y. Enhancing denitrification efficiency for nitrogen removal using waste sludge alkaline fermentation liquid as external carbon source. Environ. Sci. Pollut. Res. 2019, 26, 4633–4644. [Google Scholar] [CrossRef] [PubMed]
  13. Lin, Y.-F.; Jing, S.-R.; Wang, T.-W.; Lee, D.-Y. Effects of macrophytes and external carbon sources on nitrate removal from groundwater in constructed wetlands. Environ. Pollut. 2002, 119, 413–420. [Google Scholar] [CrossRef]
  14. Kasak, K.; Truu, J.; Ostonen, I.; Sarjas, J.; Oopkaup, K.; Paiste, P.; Kõiv-Vainik, M.; Mander, Ü.; Truu, M. Biochar enhances plant growth and nutrient removal in horizontal subsurface flow constructed wetlands. Sci. Total Environ. 2018, 639, 67–74. [Google Scholar] [CrossRef] [PubMed]
  15. Davies, J.-M.; Mazumder, A. Health and environmental policy issues in Canada: The role of watershed management in sustaining clean drinking water quality at surface sources. J. Environ. Manag. 2003, 68, 273–286. [Google Scholar] [CrossRef]
  16. Cecconet, D.; Bolognesi, S.; Callegari, A.; Capodaglio, A.G. Controlled sequential biocathodic denitrification for contaminated groundwater bioremediation. Sci. Total Environ. 2019, 651, 3107–3116. [Google Scholar] [CrossRef]
  17. Cecconet, D.; Devecseri, M.; Callegari, A.; Capodaglio, A.G. Effects of process operating conditions on the autotrophic denitrification of nitrate-contaminated groundwater using bioelectrochemical systems. Sci. Total Environ. 2018, 613–614, 663–671. [Google Scholar] [CrossRef]
  18. Molognoni, D.; Devecseri, M.; Cecconet, D.; Capodaglio, A.G. Cathodic groundwater denitrification with a bioelectrochemical system. J. Water Process. Eng. 2017, 19, 67–73. [Google Scholar] [CrossRef]
  19. Yu, L.; Yuan, Y.; Chen, S.; Zhuang, L.; Zhou, S. Direct uptake of electrode electrons for autotrophic denitrification by Thiobacillus denitrificans. Electrochem. Commun. 2015, 60, 126–130. [Google Scholar] [CrossRef]
  20. Gregory, K.B.; Bond, D.R.; Lovley, D.R. Graphite electrodes as electron donors for anaerobic respiration. Environ. Microbiol. 2004, 6, 596–604. [Google Scholar] [CrossRef]
  21. Pous, N.; Puig, S.; Balaguer, M.D.; Colprim, J. Cathode potential and anode electron donor evaluation for a suitable treatment of nitrate-contaminated groundwater in bioelectrochemical systems. Chem. Eng. J. 2015, 263, 151–159. [Google Scholar] [CrossRef] [Green Version]
  22. Srivastava, P.; Yadav, A.K.; Abbassi, R.; Garaniya, V.; Lewis, T. Denitrification in a low carbon environment of a constructed wetland incorporating a microbial electrolysis cell. J. Environ. Chem. Eng. 2018, 6, 5602–5607. [Google Scholar] [CrossRef]
  23. Vidal, S.; Rocha, C.; Galvão, H. A comparison of organic and inorganic carbon controls over biological denitrification in aquaria. Chemosphere 2002, 48, 445–451. [Google Scholar] [CrossRef]
  24. Zehr, J.P.; Kudela, R.M. Nitrogen Cycle of the Open Ocean: From Genes to Ecosystems. Annu. Rev. Mar. Sci. 2011, 3, 197–225. [Google Scholar] [CrossRef] [PubMed] [Green Version]
  25. Andalib, M.; Taher, E.; Donohue, J.; Ledwell, S.; Andersen, M.H.; Sangrey, K. Correlation between nitrous oxide (N2O) emission and carbon to nitrogen (COD/N) ratio in denitrification process: A mitigation strategy to decrease greenhouse gas emission and cost of operation. Water Sci. Technol. 2018, 77, 426–438. [Google Scholar] [CrossRef] [PubMed]
  26. IPCC. 2018: Global Warming of 1.5 °C; An IPCC Special Report on the Impacts of Global Warming of 1.5 °C above Pre-Industrial Levels and Related Global Greenhouse Gas Emission Pathways, in the Context of Strengthening the Global Response to the Threat of Climate Change, Sustainable Development, and Efforts to Eradicate Poverty; Masson-Delmotte, V., Zhai, P., Pörtner, H.O., Roberts, D., Skea, J., Shukla, P.R., Pirani, A., Moufouma-Okia, W., Péan, C., Pidcock, R., et al., Eds.; IPCC: Geneva, Switzerland, in press.
  27. Zhou, M.; Wang, H.; Hassett, D.J.; Gu, T. Recent advances in microbial fuel cells (MFCs) and microbial electrolysis cells (MECs) for wastewater treatment, bioenergy and bioproducts. J. Chem. Technol. Biotechnol. 2013, 88, 508–518. [Google Scholar] [CrossRef]
  28. Rabaey, K.; Rozendal, R.A. Microbial Electrosynthesis—Revisiting the Electrical Route for Microbial Production. Nat. Rev. Microbiol. 2010, 8, 706–716. [Google Scholar] [CrossRef]
  29. Kondaveeti, S.; Min, B. Nitrate reduction with biotic and abiotic cathodes at various cell voltages in bioelectrochemical denitrification system. Bioprocess. Biosyst. Eng. 2013, 36, 231–238. [Google Scholar] [CrossRef]
  30. Safari, M.; Rezaee, A.; Ayati, B.; Jonidi-Jafari, A. Bio-electrochemical reduction of nitrate utilizing MWCNT supported on carbon base electrodes: A comparison study. J. Taiwan Inst. Chem. Eng. 2014, 45, 2212–2216. [Google Scholar] [CrossRef]
  31. Rezaee, A.; Safari, M.; Hossini, H. Bioelectrochemical denitrification using carbon felt/multiwall carbon nanotube. Environ. Technol. 2015, 36, 1057–1062. [Google Scholar] [CrossRef]
  32. Tong, S.; Zhang, B.; Feng, C.; Zhao, Y.; Chen, N.; Hao, C.; Pu, J.; Zhao, L. Characteristics of heterotrophic/biofilm-electrode autotrophic denitrification for nitrate removal from groundwater. Bioresour. Technol. 2013, 148, 121–127. [Google Scholar] [CrossRef]
  33. Pous, N.; Koch, C.; Colprim, J.; Puig, S.; Harnisch, F. Extracellular electron transfer of biocathodes: Revealing the potentials for nitrate and nitrite reduction of denitrifying microbiomes dominated by Thiobacillus sp. Electrochem. Commun. 2014, 49, 93–97. [Google Scholar] [CrossRef] [Green Version]
  34. Rosenbaum, M.; Aulenta, F.; Villano, M.; Angenent, L.T. Cathodes as electron donors for microbial metabolism: Which extracellular electron transfer mechanisms are involved? Bioresour. Technol. 2011, 102, 324–333. [Google Scholar] [CrossRef]
  35. Liu, H.; Chen, N.; Feng, C.; Tong, S.; Li, R. Impact of electro-stimulation on denitrifying bacterial growth and analysis of bacterial growth kinetics using a modified Gompertz model in a bio-electrochemical denitrification reactor. Bioresour. Technol. 2017, 232, 344–353. [Google Scholar] [CrossRef] [PubMed]
  36. Mook, W.T.; Aroua, M.K.T.; Chakrabarti, M.H.; Noor, I.M.; Irfan, M.F.; Low, C.T.J. A review on the effect of bio-electrodes on denitrification and organic matter removal processes in bio-electrochemical systems. J. Ind. Eng. Chem. 2013, 19, 1–13. [Google Scholar] [CrossRef]
  37. Pous, N.; Carmona-Martínez, A.A.; Vilajeliu-Pons, A.; Fiset, E.; Bañeras, L.; Trably, E.; Balaguer, M.D.; Colprim, J.; Bernet, N.; Puig, S. Bidirectional microbial electron transfer: Switching an acetate oxidizing biofilm to nitrate reducing conditions, Biosens. Bioelectron. 2016, 75, 352–358. [Google Scholar] [CrossRef] [PubMed]
  38. Hutchinson, G.L.; Livingston, G.P. Use of Chamber Systems to Measure Trace Gas Fluxes. Agric. Ecosyst. Eff. Trace Gases Glob. Clim. Chang. 1993, 55, 63–78. [Google Scholar] [CrossRef] [Green Version]
  39. Loftfield, N.; Flessa, H.; Augustin, J.; Beese, F. Automated gas chromatographic system for rapid analysis of the atmospheric trace gases methane, carbon dioxide, and nitrous oxide. J. Environ. Qual. 1997, 26, 560–564. [Google Scholar] [CrossRef]
  40. Thamdrup, B. New Pathways and Processes in the Global Nitrogen Cycle. Annu. Rev. Ecol. Evol. Syst. 2012, 43, 407–428. [Google Scholar] [CrossRef]
  41. Gregoire, K.P.; Glaven, S.M.; Hervey, J.; Lin, B.; Tender, L.M. Enrichment of a High-Current Density Denitrifying Microbial Biocathode. J. Electrochem. Soc. 2014, 161, H3049–H3057. [Google Scholar] [CrossRef]
  42. Chen, W.; Wu, D.; Wan, H.; Tang, R.; Li, C.; Wang, G.; Feng, C. Carbon-based cathode as an electron donor driving direct bioelectrochemical denitrification in biofilm-electrode reactors: Role of oxygen functional groups. Carbon 2017, 118, 310–318. [Google Scholar] [CrossRef]
  43. Chen, D.; Yang, K.; Wang, H. High nitrate removal by autohydrogenotrophic bacteria in a biofilm-electrode reactor. Desalin. Water Treat. 2015, 55, 1316–1324. [Google Scholar] [CrossRef]
  44. Hayatsu, M.; Tago, K.; Saito, M. Various players in the nitrogen cycle: Diversity and functions of the microorganisms involved in nitrification and denitrification. Soil Sci. Plant. Nutr. 2008, 54, 33–45. [Google Scholar] [CrossRef]
  45. Nguyen, V.K.; Hong, S.; Park, Y.; Jo, K.; Lee, T. Autotrophic denitrification performance and bacterial community at biocathodes of bioelectrochemical systems with either abiotic or biotic anodes. J. Biosci. Bioeng. 2015, 119, 180–187. [Google Scholar] [CrossRef] [PubMed]
  46. Betlach, M.R.; Tiedje, J.M. Kinetic Explanation for Accumulation of Nitrite, Nitric Oxide, and Nitrous Oxide During Bacterial Denitrification. Appl. Environ. Microbiol. 1981, 42, 1074–1084. [Google Scholar] [CrossRef] [PubMed] [Green Version]
Figure 1. Reactor scheme (A): 1—biocathode; 2—anode; 3—reference electrode; 4—cation exchange membrane; 5, 6—sampling ports of cathode and anode chambers; 7, 8—cathodic and anodic chambers electrolyte inlets; 9, 10—cathodic and anodic chambers electrolyte outlets; (B) biocathode; (C) anode.
Water 12 00516 g001
Figure 2. Current density, NO3, NO2‾, and NH4+ concentration in cathode chamber. The black line shows current density, the red lines NO3, the green lines NO2 and the blue lines NH4+ concentration. Rapid increases in NO3 concentration on days 3, 7, 14, and 36 are related to KNO3 addition. On days 0–7 (yellow background), the cathode polarization was posed at +150 mV SCE. On day 8, it was switched to −550mV vs. SCE.
Water 12 00516 g002
Figure 3. The current density and water level in cathode chamber. The black line shows the current density and the orange line shows the water table height in the cathode chamber. The water level is affected by the sample collection and increases on days 14 and 36 are related to the adding of new substrate. The light blue background represents the height of the electrode from the bottom of the reactor.
Water 12 00516 g003
Figure 4. Total nitrogen (A) and NO3‾ (B) removal efficiencies per day (% day−1). Median, min/max, 25% and 75% quartile values are presented. The asterisks denote statistically significant differences between the MES and control reactors * p < 0.05.
Water 12 00516 g004
Figure 5. pH in the cathode chamber (A), pH in the anode chamber (B), dissolved oxygen concentration in the cathode chamber (C), dissolved oxygen concentration in the anode chamber (D), and temperature in the cathode chamber (E). Median, min/max, 25% and 75% quartile values are presented. The asterisks denote statistically significant differences between the MES and control reactors * p < 0.05; *** p < 0.001.
Water 12 00516 g005
Figure 6. DOC (A), NH4+ (B), and NO2 (C) concentrations in the MES and control reactors. Median, min/max, 25% and 75% quartile values are presented. The asterisks denote statistically significant differences between the MES and control reactors * p < 0.05; ** p < 0.01.
Water 12 00516 g006
Figure 7. CO2 (A), CH4 (B) and N2O (C) gas fluxes in the MES and control reactors. Median, min/max, 25% and 75% quartile values are presented. The asterisks denote statistically significant differences between the MES and control reactors * p < 0.05; *** p > 0.001.
Water 12 00516 g007

