Article

No Clear Response in the Stormwater Phytoplankton Community to Biocide Contamination

1
Department of the Built Environment, Aalborg University, Thomas Manns Vej 23, 9220 AalborgØ, Denmark
2
NIRAS, Ceres Allé 3, 8000 Aarhus, Denmark
*
Author to whom correspondence should be addressed.
Water 2020, 12(11), 3120; https://doi.org/10.3390/w12113120
Submission received: 20 September 2020 / Revised: 27 October 2020 / Accepted: 3 November 2020 / Published: 7 November 2020
(This article belongs to the Section Urban Water Management)

Abstract

:
This study investigated the responses of natural phytoplankton communities of an urban stormwater pond to biocide contamination. The biocides carbendazim, terbutryn, diuron, and irgarol 1051, and their mixture, were used in two laboratory microcosm and one outdoor mesocosm studies at concentrations of 10, 100, and 1000 ng L−1. The water samples were collected in a pond receiving significant biocide contamination. The mesocosm study was carried out in the same pond. The phytoplankton community response was evaluated after 10–15 days of exposure, with respect to its taxonomic composition, abundance and biovolume. No significant changes were observed in any of the experiments. Only at the highest applied terbutryn concentration were lower numbers of taxa identified in both microcosm and mesocosm experiments. Additionally, increases in Chlorophyta abundance and biovolume, along with an increase in irgarol concentration, were observed throughout the three experiments. Nevertheless, the statistical analysis did not confirm any significant differences among the biocide treatments. These results suggest that the biocide concentrations probably were below the harmful or toxic threshold to the stormwater pond phytoplankton. On the other hand, as the investigated pond phytoplankton taxa face biocide inputs throughout the year, they could have already adapted to the tested biocide contamination.

1. Introduction

Biocides are used to suppress the growth of unwanted organisms. Coating materials of buildings are, for instance, enriched with algaecides and fungicides to protect them from algae and fungi attacks. Many materials also contain in-can preservatives to prevent bacterial growth before application. However, next to the many benefits that biocides bring, there are some significant drawbacks, especially when considering biocide toxicity to the natural environment [1].
Wet weather conditions cause leaching of biocides from building materials into the surrounding environment [2,3]. In many urban areas, runoff is directed to man-made ponds designed to mitigate flooding and pollution carried by the stormwater [4]. In addition to more traditional pollutants such as heavy metals and PAHs, the stormwater entering these ponds can contain considerable amounts of biocides, some of which exceed, for instance, the recommended annual average values of the European Water Framework Directive for priority substances in inland waters or the predicted-no-effect-concentrations [5]. A number of studies acknowledge that a variety of organisms populate stormwater ponds [6,7,8]. They can contribute to the biodiversity of the urban environment [9]. However, organisms in these aquatic systems become exposed to elevated amounts of pollutants, which pose a risk to the ecosystem quality and diversity [10].
Many biocides are algaecides, and hence affect organisms such as phytoplankton—the microscopic water column algae of the aquatic environment. Phytoplankton forms the basis of the aquatic food web [11] and any effects on its density or community composition caused by the presence of pollutants could lead to changes in the entire food web. Similarly to many other pollutants, biocides can experience a number of changes while in the stormwater pond. They might become photodegraded, biodegraded, and adsorbed into particulate matter [12]. The remaining bulk water biocide concentrations could have an impact on planktonic algae communities [13]. The phytoplankton could furthermore be affected by biocide degradation products or by biocides bound to sediments when these are re-suspended by high water column turbulence. The biocides and their breakdown products could inhibit growth of certain algal species [14]; change the taxonomic composition and thereby induce shifts in the algae community [15]; or alter the biovolume of the taxonomic groups [16].
Several studies have been carried out testing the effects of different pesticides and biocides on phytoplankton communities. For instance, [16] investigated the effects of irgarol in an indoor pond mesocosm study and observed a decrease in phytoplankton abundance after application at concentrations of 1 and 5 µg L−1. [17] examined natural phytoplankton communities in outdoor mesocosms and their sensitivity to constant exposure of the herbicides atrazine (70 µg L−1), isoproturon (14 µg L−1), and diuron (5 µg L−1). The authors observed changes in phytoplankton community composition, where chrysophytes and chlorophytes were found to be less sensitive to herbicide contamination compared to cryptophytes or diatoms. Reference [18] investigated phytoplankton changes in Lake Geneva in response to herbicide contaminations. Hazardous concentrations for 5% of the species were found to be 0.03 µg L−1 for terbutryn and 0.05 µg L−1 for diuron.
While various studies provide evidence that biocide contamination might induce changes in freshwater phytoplankton communities, few have addressed the man-made aquatic ecosystems of stormwater ponds. The present study investigated whether natural phytoplankton communities of stormwater ponds reflect the presence of biocides at environmentally realistic concentrations. The community response was measured in terms of its taxonomic composition, abundance, and biovolume. The biocides and their concentrations were chosen to reflect what has previously been measured in the same systems, namely, terbutryn, diuron, carbendazim, and irgarol 1051 (cybutryne) in concentrations from 10 to 1000 ng L−1 [5,19]. The responses of the phytoplankton communities were studied in two types of laboratory microcosms and one type of in-situ outdoor mesocosm.

2. Materials and Methods

Samples for the two laboratory microcosm experiments were collected from a residential stormwater pond located in Silkeborg, Denmark (56°11′39.3″ N, 9°32′56.9″ E). The in situ mesocosm study was carried out in the same pond. The Silkeborg pond was selected based on previous studies documenting considerable biocide loads received by this pond, building coating materials being one of the sources of origin [5]. In the study, biocides terbutryn and irgarol in some stormwater samples were found to exceed the recommended annual average values of the European Water Framework Directive for priority substances in inland waters [20]. Additionally, the measured median concentrations of biocides such as terbutryn and carbendazim were exceeding the predicted-no-effect-concentrations referred in [21]. During dry weather, the pond holds 2.680 m3 of water, has a surface area of 3.260 m2, and has a maximum depth of 1 m, and the slope of the embankments is 20%. It is sub-divided into 3 sections by sand barriers that rise to approximately 0.2 m below the water surface. The barriers and part of the embankments are vegetated by primarily Phragmites australis. The pond receives surface runoff from a residential area of 21.5 ha of which 33% contributes to the runoff.
Four biocides, which are typically found in stormwater ponds and measured at significant concentrations during some wet-weather events [5,19], namely, tebutryn (TB), diuron (DR), carbendazim (CD), and irgarol 1051 (cybutryne) (IRG) were selected for the study. The biocides were purchased from Sigma-Aldrich as a powder (Pestanal®, analytical standards, Broendby, Denmark). Stock solutions were prepared for each compound and their mixture (MIX) using acetonitrile as a solvent and stored in a freezer until dosing into microcosms and mesocosms (0.01% final acetonitrile concentration in each microcosm and mesocosm).

2.1. Microcosm Setups

The two laboratory microcosm setups consisted of 18 individual microcosms each. In the first setup the microcosms held only a water phase, while the microcosms of the second setup held both sediments and water phase (Figures S1 and S2, Supplementary Material). For both setups, the 18 microcosms were organized in two parallel rows and illuminated from the sides by LED lamps consisting of a number of red (254 W m−2) and white (342 W m−2) bulbs. The light energy was measured with a fiber-optic spectrometer (USB2000+, Ocean Optics, Dunedin, FL, USA) and a light-dark cycle of 12 h was selected for the experiments to mimic day-night changes. In order to prevent sample evaporation as much as possible, the microcosm setups were placed in a dark room where the measured average temperature was 18.7 °C and the relative humidity was 55–74%, as the microcosms from both setups were kept open throughout the experiment. No additional CO2 source was used for the experiments.
For the water phase microcosms, samples were collected from several locations distributed around the shoreline of the pond. Collected water was mixed in large containers and 1 L of it was poured into each of the 18 microcosms (1 L glass bottles). For the sediment microcosms, sediment cores were collected by glass corers of 5 cm diameter around the shoreline of the stormwater pond at a similar depth. This way, sediment disturbance among samples was prevented, and it was assumed that the water column phytoplankton communities would be more alike in the microcosms. Furthermore, the slope of the pond is shallow (1:5), and sediments hence also accumulate on the slopes of the pond. The glass corers holding the sediments were placed in the same setup as the water phase microcosms and hence used directly as microcosms. As sediment levels were not even in all cores (microcosms), pond water was adjusted to achieve identical water depths (25 cm). Samples for both setups were collected in spring, April 2015.
For both setups, biocide solution was added to the microcosms aiming at final concentrations of 10, 100, and 1000 ng L−1 of each biocide: 0.1 mL of the prepared stock solution was injected into each water phase microcosm, and 50 µL into each sediment microcosm. Additionally, 3 columns were spiked to hold a mix of the 4 biocides at the same final concentrations of each biocide. Three microcosms were selected as controls where no biocides were added, but the same amount of acetonitrile as in other microcosms was injected. Acetonitrile was used as solvent to prepare biocide stock solutions because of their low/moderate solubility in water. The experiments were carried out for 10 days and the water of each microcosm was mixed once per day. The 10 days exposure time was chosen because of the water residence time in stormwater ponds, which in designs following Danish best engineering practices is around two weeks. If no biocide effect on phytoplankton communities was observed after 10 days of exposure at controlled laboratory conditions, it was not expected to be significant later on either. This was considered especially due to the typical water exchange in stormwater ponds happening on average shortly after this tested period of time. At the end of the experiment, water was collected from each microcosm and preserved with Lugol’s solution for later phytoplankton identification and enumeration (40 mL from each water phase microcosm and 20 mL from each sediment microcosm).

2.2. In Situ Mesocosm Setup

The mesocosm experiment was carried out in August 2015. Ten cylinders of 50 cm diameter and 100 cm of height, with an upper part made of transparent and flexible 2-mm polycarbonate plastic, and a lower part made of stainless steel, were positioned along the shoreline of the stormwater pond. The mecosoms were pressed into the pond bottom, so that most of each of the steel cylinders was in the sediment and approximately 20 cm of the polycarbonate cylinder was above the waterline (Figure S3, Supplementary Material). The latter was done to avoid inflow of pond water during excessive rain and consequent water level fluctuations in the pond. The pond bottom was originally constructed as a 0.5 m layer of clay to avoid seepage, and pressing the cylinders into this clay layer consequently hindered water exchange through the bottom sediments. After positioning the mesocosms, they were left in the pond for several days to let the disturbed bottom sediment settle before dosing of biocides.
The water volume in the mesocosms was estimated and biocide stock solution was dosed into each to achieve final concentrations of 100 and 1000 ng L−1 for every biocide individually. Two mesocosms were selected as controls where no biocides were added, but the same amount of acetonitrile as in other mesocosms was dosed. The experiment was run for 15 days in order to cover an average two-week water residence time in Danish stormwater ponds. According to Danish Meteorological Institute [22], the average temperature of the month for the region where Silkeborg pond is located was 17 °C with the lowest temperature of 2.8 °C and highest of 27.6 °C. Sunshine hours during the experiment ranged from approximately 2 to 14 h per day.
To follow the biocide concentration throughout the experiment, 1 L water samples were collected from each mesocosm and from the pond itself right after biocide dosing and then continuously every 3 days. The samples were stored cool and dark until further analysis, which was carried out within 24 h. At the end of the experiment, an additional 40 mL of water was sampled from each mesocosm and from the pond and right after sampling preserved with Lugol’s solution for phytoplankton identification and enumeration.
Microcosms and mesocosms are referred to according to the amounts of biocides they received. For example, TB100 is a cosm that received 100 ng L−1 of terbutryn, while MIX10 is a cosm that received 10 ng L−1 of all 4 biocides. Cosms labeled Control 1, 2, and 3 did not receive biocides, but were in all other respect treated identically to cosms that received biocides.

2.3. Water Quality Parameters

The water quality parameters, such as total phosphorus (TP, µg L−1), dissolved reactive phosphorus (DRP, µg L−1), NO3 + NO2-N (µg L−1), and chlorophyll-a, were measured in all samples collected from the pond, and in each microcosm and mesocosm at the end of the experiment. For the mesocosm experiment, this was also done on day 9. Total and dissolved reactive phosphorus were measured according to methods adapted from Danish Standard 292 [23] and Standard Methods 4500-P [24], respectively. NO3 + NO2-N was measured according to Danish Standard 223 [25]. Water samples for measurement of dissolved reactive phosphorus and NO3 + NO2-N were first filtered through 0.3 µm glass fiber filters. Chlorophyll-a measurements were done as described in [26]. Each analysis was carried out only once for each sample, except at the start of each experiment where triple determinations were made. During the mesocosm study, conductivity, pH, dissolved oxygen, and water temperature were measured in the pond (WTW, Multi 3430 set G), and in every mesocosm every 3 days until the end of the experiment.

2.4. Biocide Analysis

Bulk water background concentrations of the 4 biocides were measured before all experiments. At the end of each experiment, the remaining concentrations in the water phase were measured for every microcosm and mesocosm. Mesocosm biocide concentrations were additionally measured every 3rd day during the experiment.
Biocide concentrations were measured with an Ultimate 3000 HPLC system coupled to an MSQ Plus single quadrupole Mass Spectrometer (Thermo Scientific, Waltham, MA, USA). The compound separation was performed at 30 °C using a Synergy polar–RP column of 150 mm length, 2 mm ID, and 4 µm particle size (Phenomenex, Torrance, CA, USA). A multi-step gradient of MiliQ HPLC-grade water (A) with 0.1% formic acid and HPLC-grade acetonitrile (B) with 0.1% formic acid was used: 0–1 min 30% of eluent B, 1–10 min 30–90%, 10–14 min 90%, and 14–19 min 30%. All collected water samples were first filtered through 1.2 µm glass fiber filters to remove larger particles; 200–600 mL of filtered water was used for solid phase extraction (Sol Ex Octadecyl C18 cartridges), which was carried out with a Dionex Autotrace 280 fully automated system. The selected program consisted of the steps: (1) cartridge conditioning with 10 mL of acetonitrile and 10 mL MiliQ water; (2) sample load on the cartridges; (3) cartridge rinse with 10 mL of MiliQ water; (4) cartridge drying for 8 min; (5) stepwise soaking and collecting of the sample using acetonitrile and methanol as solvents. Samples with the lowest biocide concentration were evaporated under nitrogen gas to 1 mL. The evaporated samples were centrifuged at 11,000 rpm for 10 min before injection into the HPLC. Limits of detection (LOD) and quantification (LOQ) for the 4 biocides were: LOD: CD: 1.05 µg L−1; DR: 7.5 µg L−1; TB: 0.3 µg L−1; and IRG: 0.4 µg L−1. LOQ: CD: 3.5 µg L−1; DR: 25 µg L−1; TB: 1 µg L−1; and IRG: 1.3 µg L−1.

2.5. Phytoplankton Identification and Enumeration

Phytoplankton identification and enumeration were carried out with EVOS XL-Core and GX Optical XDS-3 inverted microscopes. HydroBios or KC-Denmark counting chambers were used and depending on sample richness, dilutions with demineralized water were made. The largest organisms were counted in the whole chamber at 100 × magnification, while smaller organisms were counted in transects at 400 × or 600 × magnification; 95% of a sample (by biovolume) was counted and taxa biovolume was estimated according to [27,28]. Organisms were identified and classified to genus or higher taxonomical levels using the keys by [11,29,30,31,32,33,34,35,36,37].

2.6. Statistical Analysis

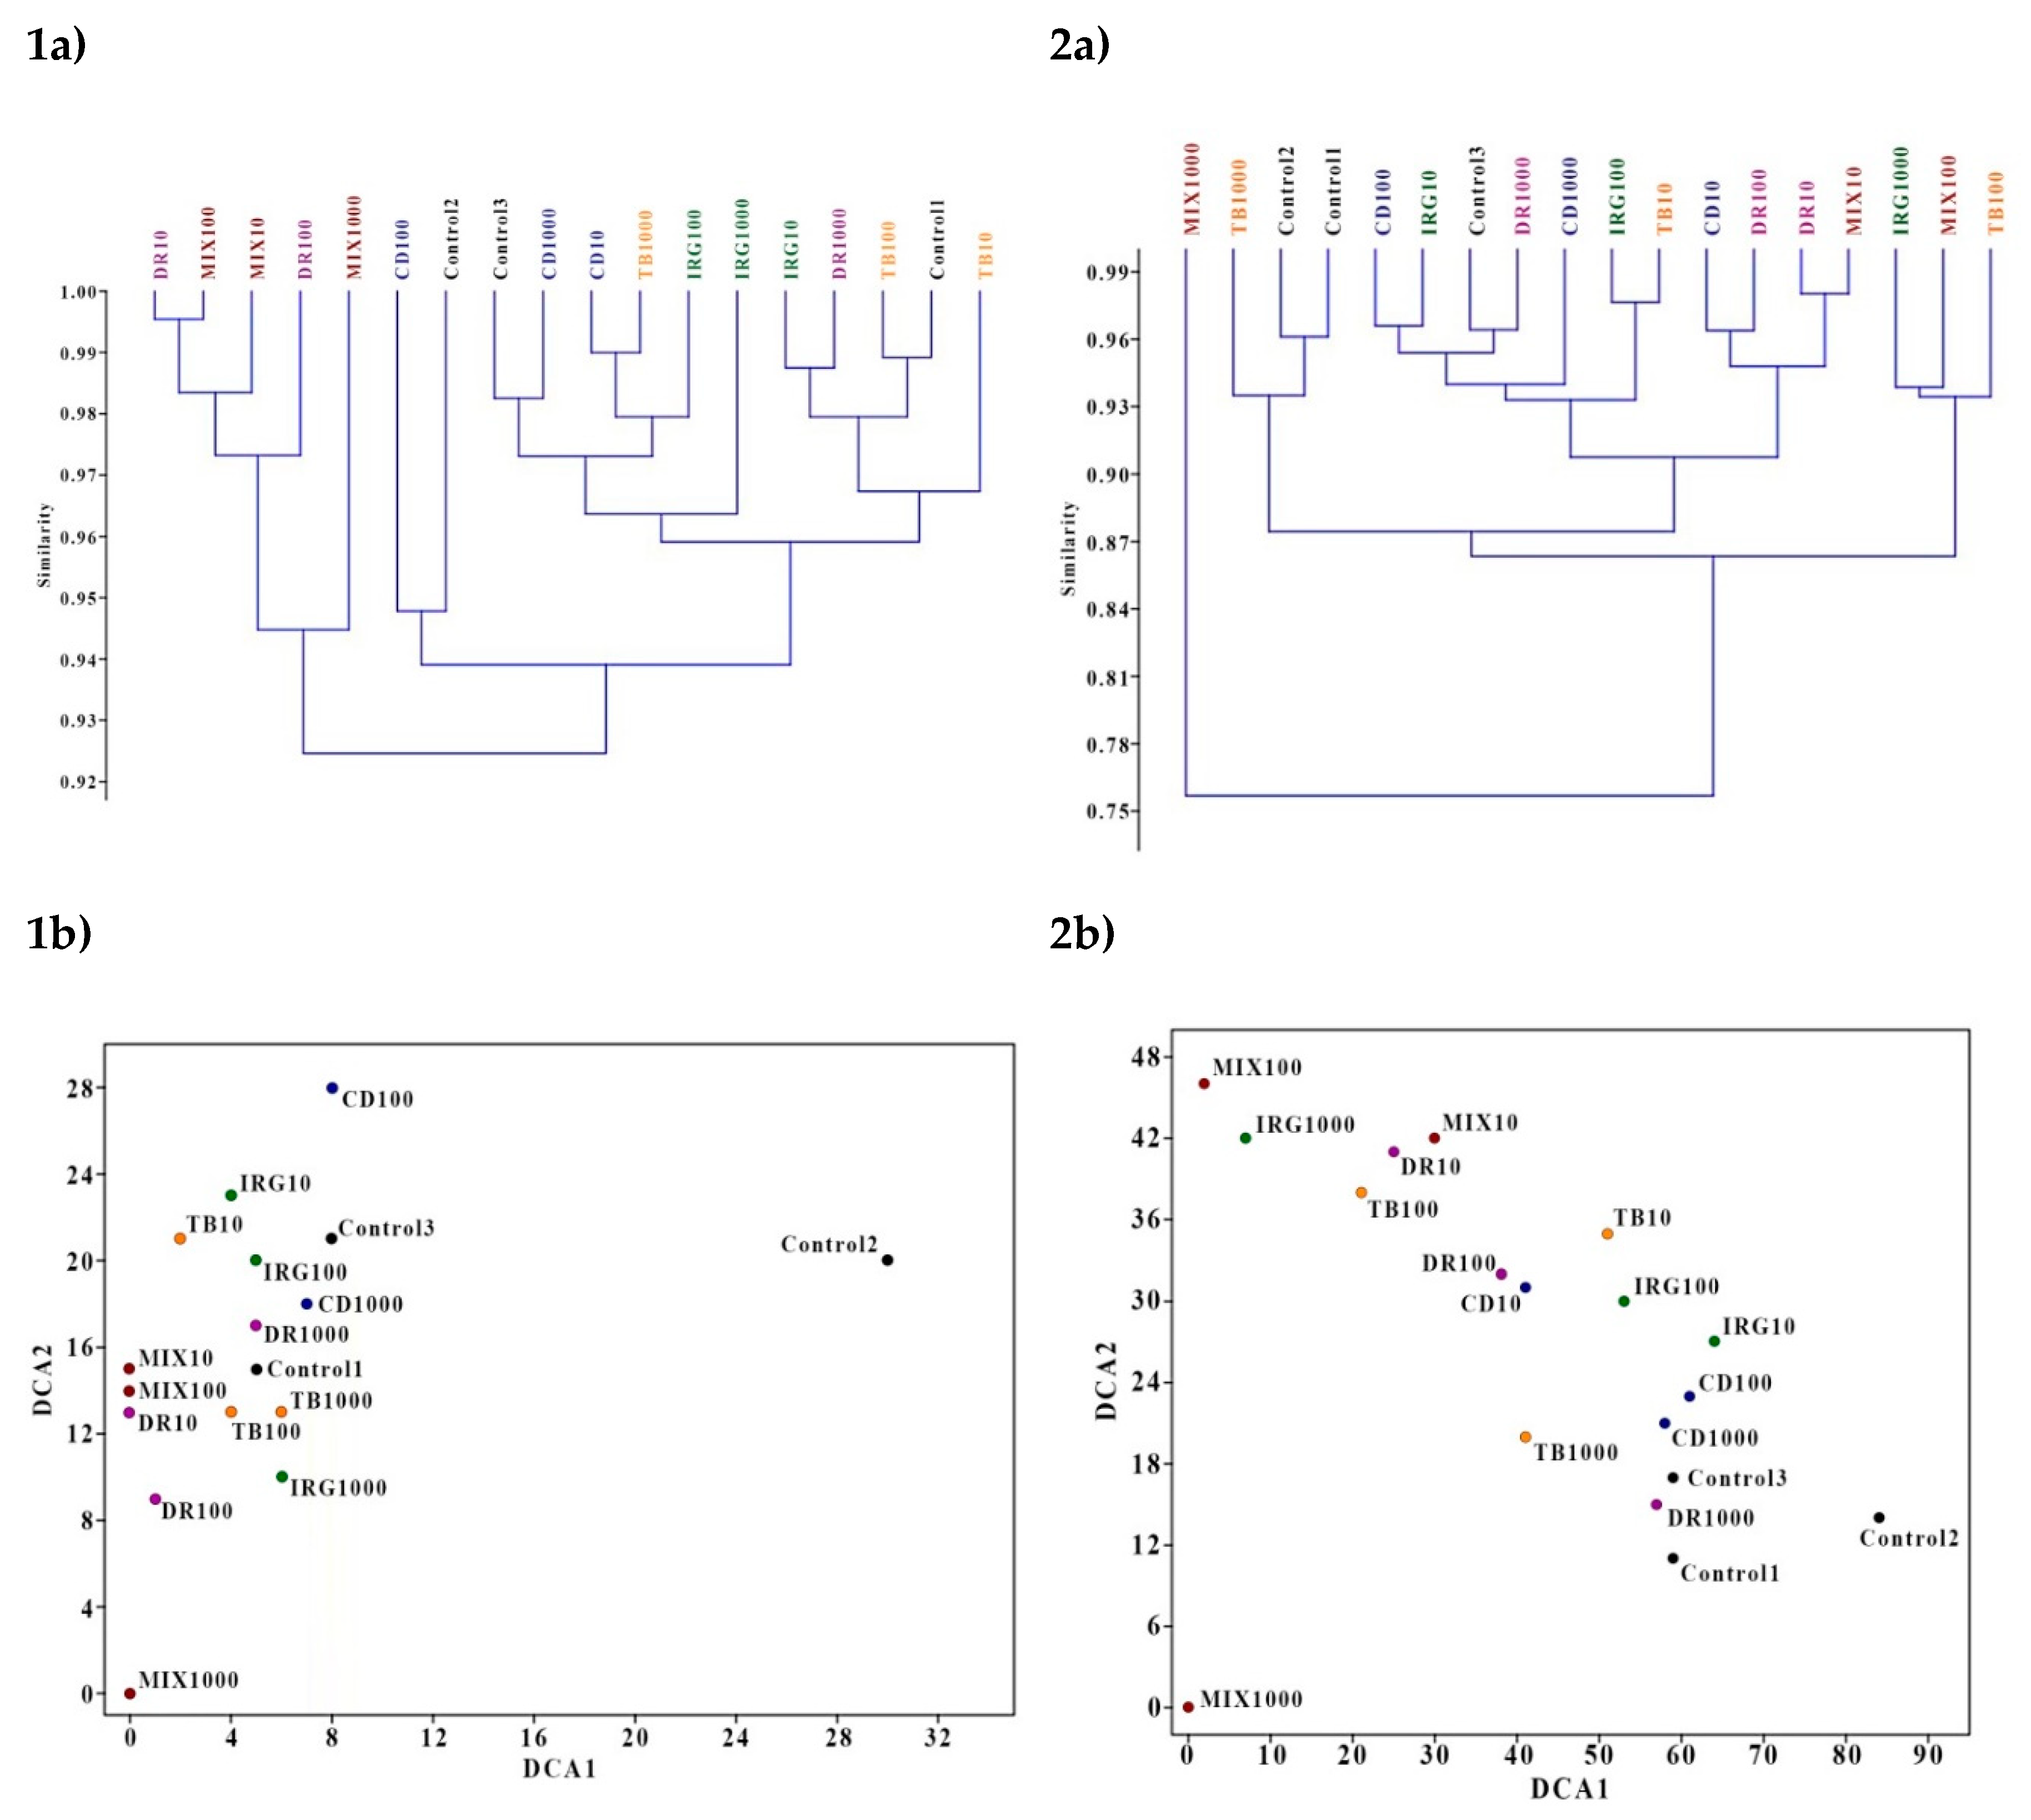
Total numbers of organisms and biovolumes were grouped into different biocide treatment groups for each experimental study. One-way ANOVA tests in SigmaPlot version 12.3 [38,39,40] were run to test whether there were any significant differences among the treatments by different biocides and their concentrations. Multivariate analysis, such as classical cluster analysis, DCA, and Bray–Curtis similarity and distance indices were carried out for each microcosm and mesocosm study using the program Past version 3.15 [41,42]. Multivariate tests were done on log-transformed relative abundance and relative biovolume data of different phytoplankton phyla.

3. Results

3.1. Water Phase Microcosms

The pond water used for the water phase microcosms had background concentrations of CD and TB of 6 ng L−1, while IRG and DR were below LOD. By the end of the experiment, the biocide concentrations in the microcosms either remained rather stable or had dropped to approximately 40–90% of the initially added concentrations (Table S1, Supplementary Material). The fate of biocides was not investigated in the present study and their final concentrations were measured only as an indication of biocidal persistence.
Other measured water quality parameters are provided in the Supplementary Material (Table S1). The different biocide treatment groups (CD, TB, DR, IRG, and MIX) and controls were compared by one-way ANOVA tests for each of the measured parameters. TP concentrations were found to be significantly higher in CD, DR, IRG, and MIX biocide treatments groups than in controls, and the pH measured in CD samples. No significant differences were found for the rest of the parameters.
The identified phytoplankton taxa and taxonomic groups were ascribed to seven phyla: Chlorophyta, Cyanophyta, Euglenophyta, Cryptophyta, Xanthophyta, Dinophyta, and Bacillariophyta (Table S2, Supplementary Material). A total of 46 taxa were identified. Taxa numbers varied little among the microcosms and ranged from 23 in TB1000 to 34 in Control 2. A total of 27 taxa were found to be present in more than half of the microcosms, while 19 taxa were observed occasionally in the microcosms. The majority of taxa contributing to the total biovolume were the same in most of the biocide-treated microcosms and the control microcosms. No obvious taxa susceptibility to a specific biocide application could be distinguished.
The counted numbers and the estimated biovolumes of different taxa were ascribed to their corresponding phyla. The phyla contribution to total counts and biovolumes is shown in Figure 1. Total numbers of organisms ranged from 17,341 mL−1 in Control 3 to 47,725 mL−1 in MIX10. One microcosm, namely, MIX1000, singled out from the rest of the dataset with a 2–5 times higher number of organisms (94,510 mL−1), mainly due to higher abundance of single-celled Chroococcales (Figure 1). Somewhat lower biovolume values were determined in the microcosms that had received biocides compared to two out of the three controls. The absolute and relative abundance varied highly among the microcosms, and the biovolume of individual phytoplankton phyla. However, no obvious trend with respect to the controls and the biocide treatments could be distinguished. Only in the IRG treatments a common tendency of Chlorophyta absolute and relative abundance and biovolume to increase with an increase in biocide concentrations was observed (Figure 1).
The total numbers and biovolumes of phytoplankton were compared by one-way ANOVA tests. The different biocide treatment groups (CD, TB, DR, IRG, controls) and the applied biocide concentrations (10, 100, 1000 ng L−1, no biocides) were tested. No significant differences could be found. The different treatment groups were also compared by multivariate analysis, namely, Bray–Curtis similarity and distance indices, classical Bray–Curtis cluster analysis, and DCA. The similarity indices ranged from 0.86 to 0.99 and from 0.68 to 0.98 with respect to numbers of organisms and biovolumes. The values close to 1 indicate high similarity between two samples, while 0 indicates no similarity. The lowest similarity to controls was found for the estimated phytoplankton biovolume of the MIX1000 treatment (0.69–0.72). Cluster and DCA analysis did not show any apparent grouping of different treatments (Figure 2). Only the biovolume estimated for MIX1000 treatment was somewhat distinguished from the rest of the treatment groups and controls. The taxonomic composition of day 0 sample (water sample collected from the pond before the start of the experiment) was also analyzed, and the data are provided in the Supplementary Material (Table S2). The comparison with day 0 is not discussed in this work, as no significant differences among the biocide treatments and controls were found at the end of the experiment.

3.2. Sediment Microcosms

The pond water used for the sediment microcosms had background concentrations of CD and TB of 7 ng L−1, while IRG and DR were below the LOD. By the end of the experiment, the biocide concentrations in the microcosms either remained rather stable or had dropped to approximately 10–70% of the initially added concentrations (Table S3, Supplementary Material). The final concentrations in the sediment microcosms were lower than in the water phase microcosms, probably due to the biocides diffusing into and adsorbing to the sediments.
Other measured water quality parameters are provided in the Supplementary Material (Table S3). The different biocide treatment groups (CD, TB, DR, IRG, and MIX) and controls were compared by one-way ANOVA tests for each of the measured parameters. No significant differences were found for any of them.
The identified phytoplankton taxa and taxonomic groups were ascribed to the same seven phyla as in the water phase microcosms (Table S4, Supplementary Material). A total of 51 taxa were identified, of which 23 were observed in more than half of the microcosms, while 28 were observed occasionally. Taxa numbers ranged from 17 in TB1000 to 35 in Control 1. There was no obvious trend that presence or absence of taxa was related to the initially added biocide concentrations.
The distribution of phytoplankton phyla measured as counted numbers and estimated biovolumes is shown in Figure 3. The total numbers of organisms counted in the sediment microcosms ranged from 3537 mL−1 (DR10) to 25,015 mL−1 (IRG100). Several microcosms, namely, Control 1, Control 2, CB1000, IRG1000, TB10, and MIX100, were considerably higher in counted numbers of organisms and biovolumes compared to the rest (Figure 3). This was due to observed excessive growth of Chlorella and Monoraphidium organisms. Thus, it is rather difficult to determine whether numbers of organisms and biovolumes were affected by the addition of biocides or not. TB1000’s numbers of organisms and biovolume were the lowest compared with the other microcosms. However, the microcosm MIX1000 had also received 1000 ng L−1 of TB, and it can hence not be excluded that the low values in TB1000 were due to random variability between microcosms. No systematic response of the individual phytoplankton phyla was observed. Absolute and relative abundance and biovolume varied highly and inconsistently with the added biocide and its concentration. Only in IRG treatments was a common tendency of Chlorophyta to increase with an increase in biocide concentrations observed (Figure 3).
One-way ANOVA statistics did not show any significant differences among different biocide treatments and their concentrations. The multivariate Bray–Curtis similarity indices ranged from 0.54 to 0.99 and from 0.44 to 0.94 for numbers of organisms and biovolumes respectively. The indices varied greatly among the samples and no clear evidence that biocide-treated samples would be significantly different from controls could be observed. The cluster analysis did not show any grouping of treatments either. Only the estimated biovolume of MIX1000 treatment was located more distinctly from the rest of the biocide treatments and controls. Similarly, no apparent treatment differences were observed by the DCA test. The taxonomic composition of day 0 sample (water sample collected from the pond before the start of the experiment) was also analyzed, and the data are provided in the Supplementary Material (Table S4). The comparison with day 0 is not discussed in this work, as no significant differences among the biocide treatments and controls were found at the end of the experiment.

3.3. In Situ Mesocosms

Background concentrations of TB and CD in the pond were rather stable, with an average of 31 and 24 ng L−1 respectively, while IRG and DR were below the LOD (Table S5, Supplementary Material). Biocide concentrations were also measured in the two control mesocosms, even though no biocides were added. Here the average concentration of TB stayed around the pond background concentration, whereas CD was much higher and increased systematically throughout the 15 days of the experiment: in Control 1, the concentration increased from 200 ng L−1 at day 0 till about 800 ng L−1 at day 12 (the sample of day 15 was unfortunately lost). In Control 2, CD concentration increased from 50 ng L−1 at day 0 to 150 ng L−1 at day 15. A similar phenomenon with an increase in concentration of CD was observed for the rest of the mesocosms as well. The possibility of CD-leaching from the polycarbonate applied to construct the mesocosms was tested extensively in the laboratory without finding any traces of leached CD. A literature study on biocides and pesticides and their breakdown products did, though, reveal that CD is formed as a metabolite during thiophanate methyl degradation. Thiophanate methyl is a pesticide registered for outdoor use on fields and indoor use in greenhouses [43]. It could have entered the stormwater pond with a runoff event that occurred shortly before the mesocosms were put in place and then been degraded herein, forming CD as a metabolite. Conditions established in the mesocosms might further have favored its degradation and the lack of continuous water exchange might have led to the observed build-up during the experiment. This was not investigated further, but was a likely cause of the observed phenomenon.
In the mesocosms, where compounds other than CD were applied, a decrease in their concentration was observed throughout the duration of the experiment. This decrease was likely caused by diffusion into the sediments where the biocides subsequently would have been adsorbed. Average and maximum biocide concentrations measured in the mesocosms during the experiment are given in the Supplementary Material, Table S6.
Other measured water quality parameters are provided in the Supplementary Material (Table S5). The different biocide treatments (CD, TB, DR, and IRG) and controls were compared by one-way ANOVA tests for each of the measured parameters. No significant differences were found for any of them.
The observed phytoplankton taxa were ascribed to a total of eight phyla, namely, Chlorophyta, Cyanophyta, Euglenophyta, Chrysophyta, Xanthophyta, Dinophyta, Cryptophyta, and Bacillariophyta (Supplementary Material, Table S7). Forty-nine taxa were identified in the in-situ mesocosms, of which 23 were common in more than half of the mesocosms, while 26 were observed occasionally. There was no clear pattern that an organism present in one of the control mesocosms would be absent or present in the biocide-treated mesocosms. Whether this was an effect of the generally high level of CD in all mesocosms or due to random variability between mesocosms is not known. The number of taxa identified in the mesocosms ranged from 19 (TB1000) to 30 (Control 1).
The total numbers of organisms ranged from 195 mL−1 (TB100) to 51,989 mL−1 (DR100). Several mesocosms, namely, Control 1 (412,563 mL−1), IRG1000 (594,131 mL−1), and DR1000 (409,416 mL−1) singled out from the rest of the dataset (Figure 4), mainly due to high numbers of counted single-celled Chroococcales and Chlorella cells. The two controls were very different from each other. This is likely due to the location of the mesocosms in the pond and the conditions at that specific location. Higher background concentration of CD in Control 1 could have affected the observed result as well.
The total biovolume tended to increase with increased biocide concentration. This is in contrast to what would be expected. A contributor to said result was probably the enhanced growth of Chlorella cells in IRG1000 and DR1000 mesocosms (Figure 4). The lowest biovolume was estimated for the TB100 mesocosm (141 · 103 µm3). The differences among biocide-treated mesocosms compared to controls were insufficient to allow a conclusive statement about the effects of the applied biocides on phytoplankton communities. Whether this was a consequence of rather high CD background concentrations or due to the biocides not having a measurable effect on the phytoplankton composition could not be concluded. The response of the individual phytoplankton phyla varied highly among the biocide treatments and controls. Only in IRG and DR treatments could a common trend of Chlorophyta absolute and relative abundance and biovolume to increase with an increase in biocide concentrations be observed (Figure 4).
One-way ANOVA statistical tests did not show any significant differences among the biocide treatments. A high variability was observed among the Bray–Curtis similarity indices: 0.19–0.93 for the counted numbers and 0.52–0.95 for the biovolumes. Two samples (TB100 and TB1000) were found to be more different with respect to phytoplankton phyla relative abundance (similarity indices < 0.5) from most of the other samples (7 out of 10). Such a result is likely to be related to the low abundance or absence of Chlorella and single-celled Chroococcales (Table S7, Supplementary Material). Cluster and DCA tests did not reveal any apparent phytoplankton response to biocide treatment either.

4. Discussion

In all three types of control cosms the majority of the abundant phytoplankton taxa were identical to those found in the biocide-treated cosms. The few observed differences were not sufficient to conclude that the phytoplankton community composition reflected the applied biocide contaminations. On the other hand, a common observation throughout the three types of cosms was that the lowest taxa numbers were consistently found in the TB1000 treated cosms. Nevertheless, the differences were not statistically significant from the rest of the cosms, and this effect was not seen for the two MIX1000 microcosms that contained 1000 ng L−1 of all four biocides.
A number of water quality parameters were also measured, such as available nutrients, chlorophyll-a, dissolved oxygen, conductivity, and pH for all the cosms, to see whether there were any significant differences among the biocide-treated samples and controls (Supplementary Material, Tables S1, S3, and S5). No significant differences were found, except for the water phase microcosm experiment where total phosphorus concentrations in control samples were significantly lower than in those treated by biocides CD, DR, IRG, and MIX. Such a result suggests possible slower utilization of this nutrient by phytoplankton communities in the samples affected by biocides. Nevertheless, this was not observed in the sediment microcosm or mesocosm experiments. In order to draw firm conclusions about possible combined biocide contamination and different water quality parameter induced changes in phytoplankton communities, this could be explicitly studied in future works.
Different observations have been reported by a number of studies investigating phytoplankton responses to pesticide contamination. For instance, reference [18] in a study of Lake Geneva correlated the monitored concentrations of 14 herbicides with phytoplankton species. The study did not show direct herbicide toxicity to phytoplankton, but indicated that different species have different susceptibility towards certain compounds. For instance, hazardous concentrations of TB and DR for 5% of species were found to be 30 and 50 ng L−1, respectively. Reference [44] tested the effects of different concentrations of IRG on single phytoplankton species in indoor nanocosms. The study showed that the effect of IRG differed greatly depending on the species. A similar conclusion has been reached by [45], who investigated the sensitivity of different algal species to 12 pesticides. For instance, EC50 concentrations for Asterionella formosa, Navicula accomoda, Scenedesmus acutus, and Chlorella vulgaris after a 96 h experiment were found to be >253, 0.5, 5.1, and 1.5 µg L−1, respectively.
Reference [46] carried out an outdoor mesocosm experiment where constant exposure of atrazine (70 µg L−1), isoproturon (14 µg L−1), and diuron (5 µg L−1) on phytoplankton communities was tested. After a 5 day experiment, no differences between biocide-treated and control mesocosms in terms of species composition was observed. Herbicide influence on the species diversity was seen on day 12, only due to a few sensitive species, however, while diversity in most mesocosms remained the same. Reference [15] investigated natural plankton communities in tropical freshwater microcosms, and for tested diuron concentrations of 2.2 and 11 µg L−1 phytoplankton taxonomic diversity was found to be unaffected. However, the phytoplankton abundance and biovolume had decreased.
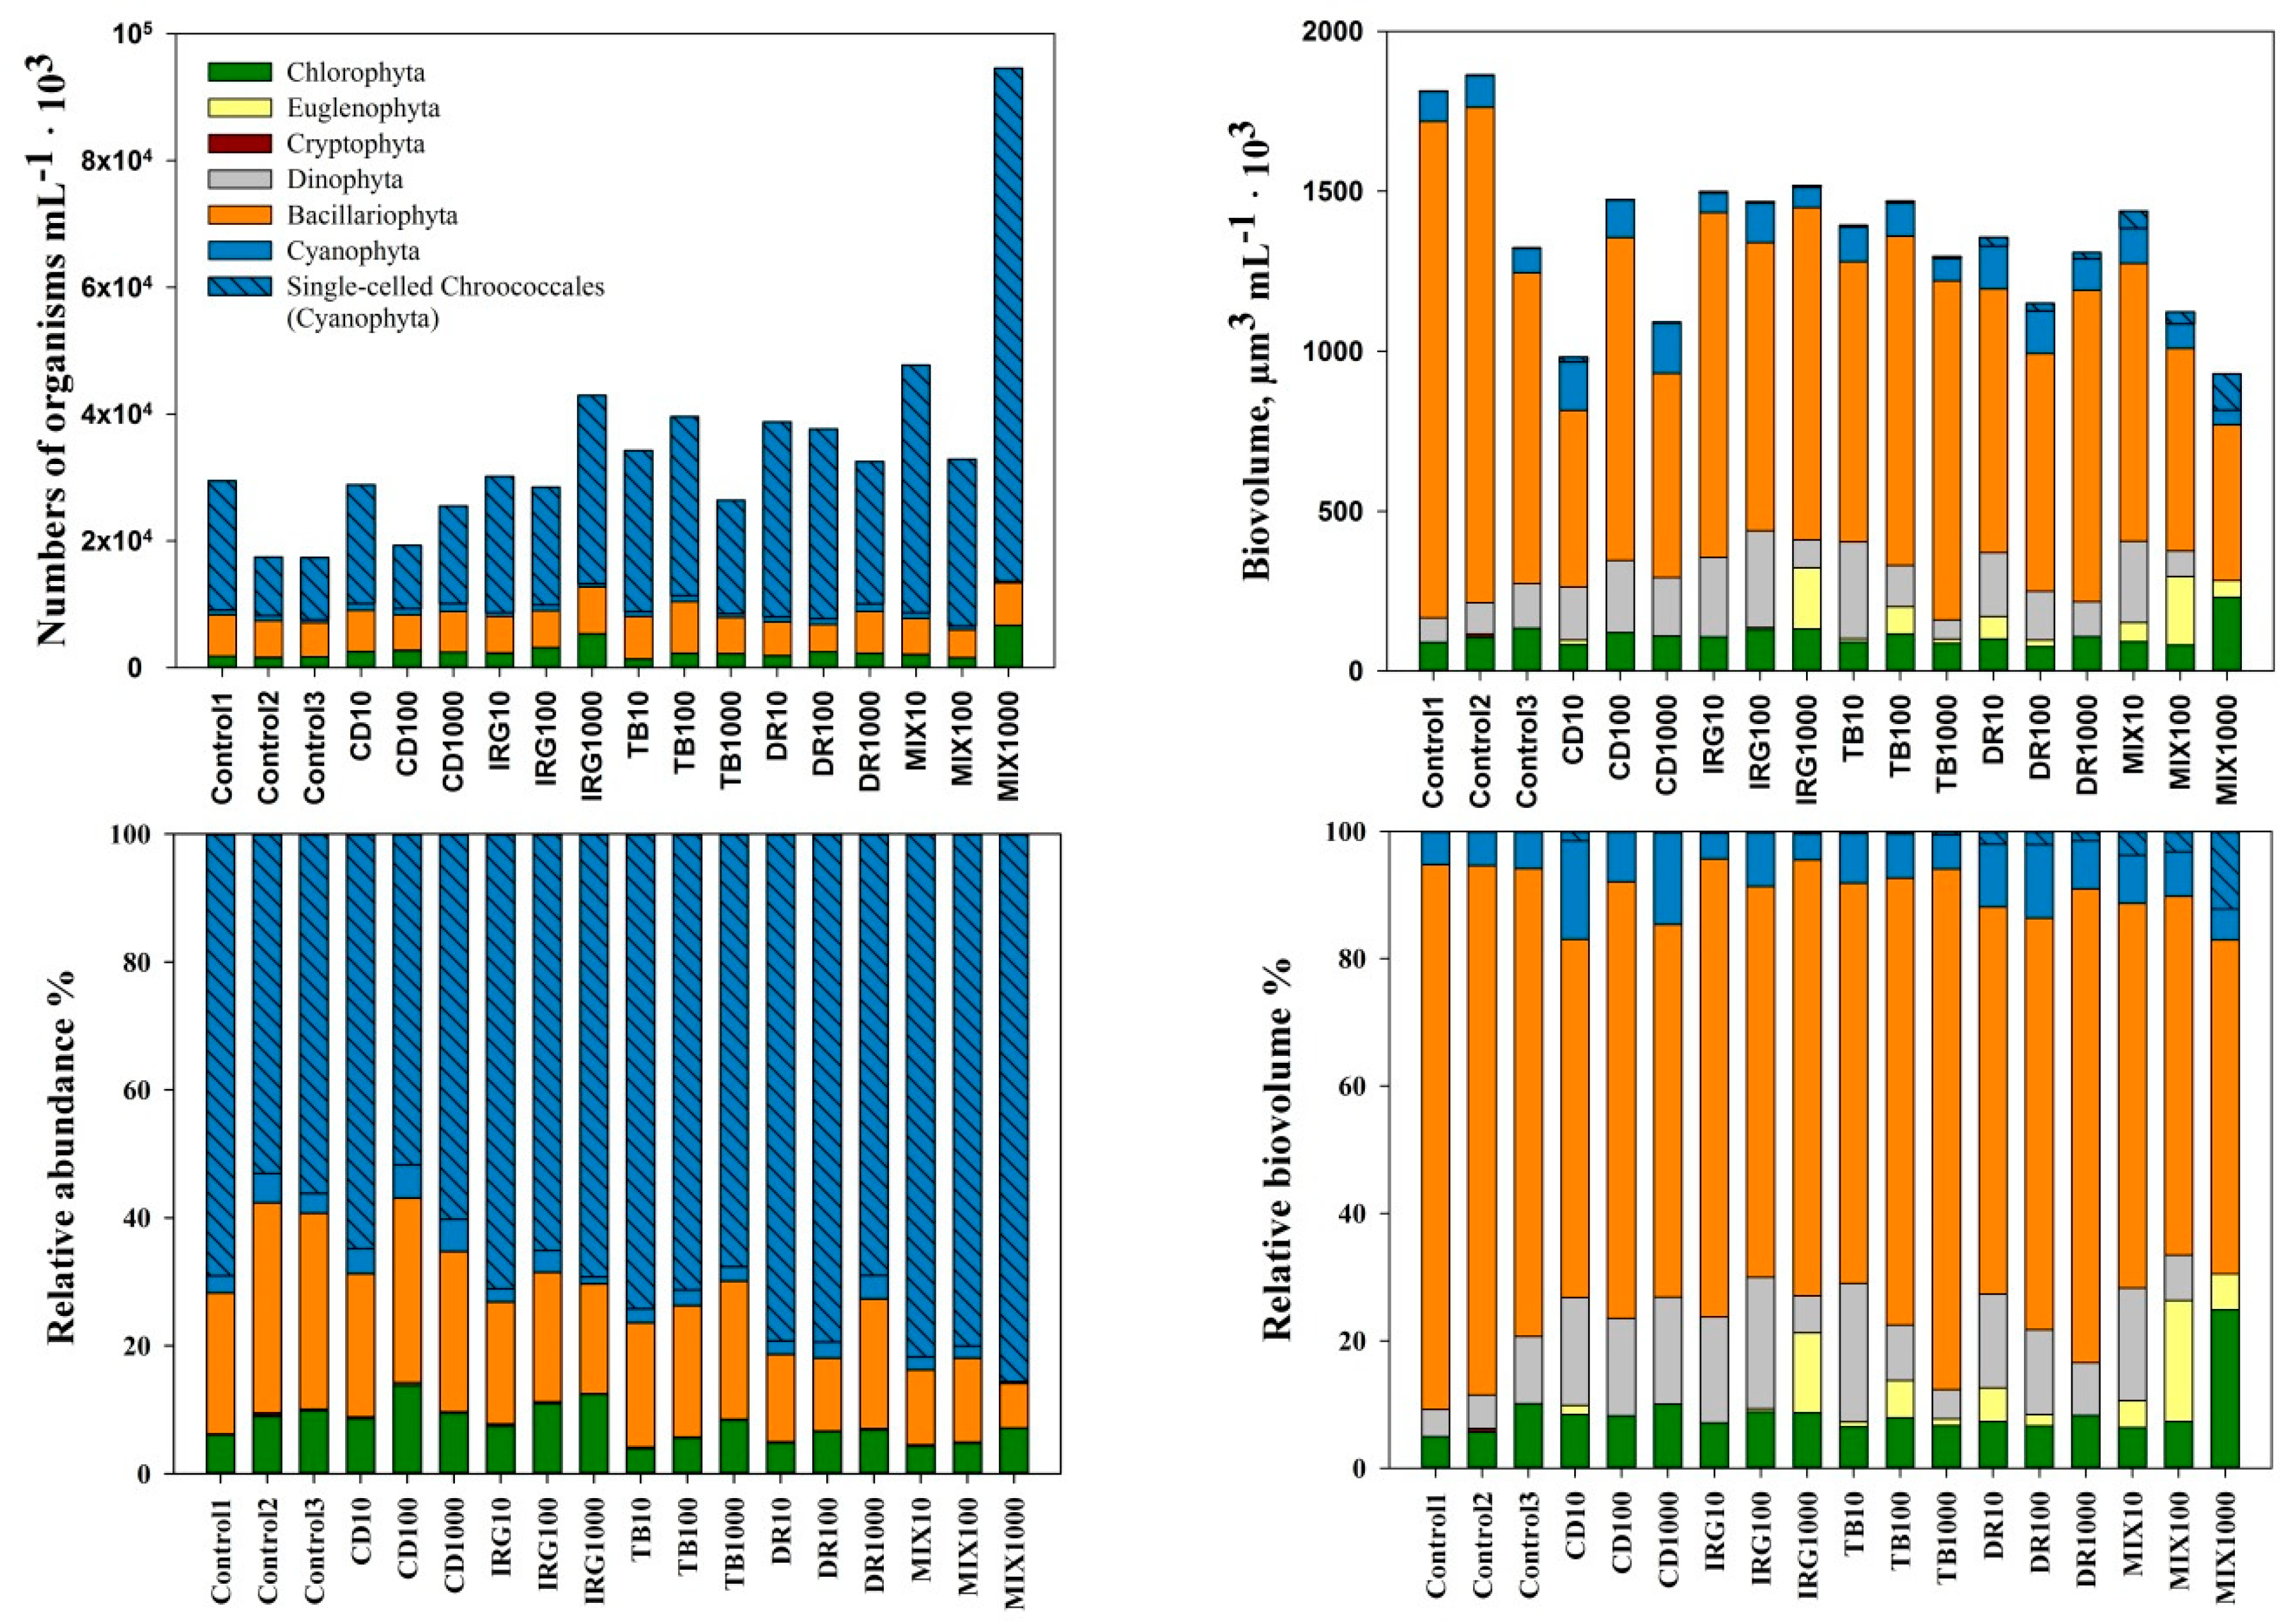
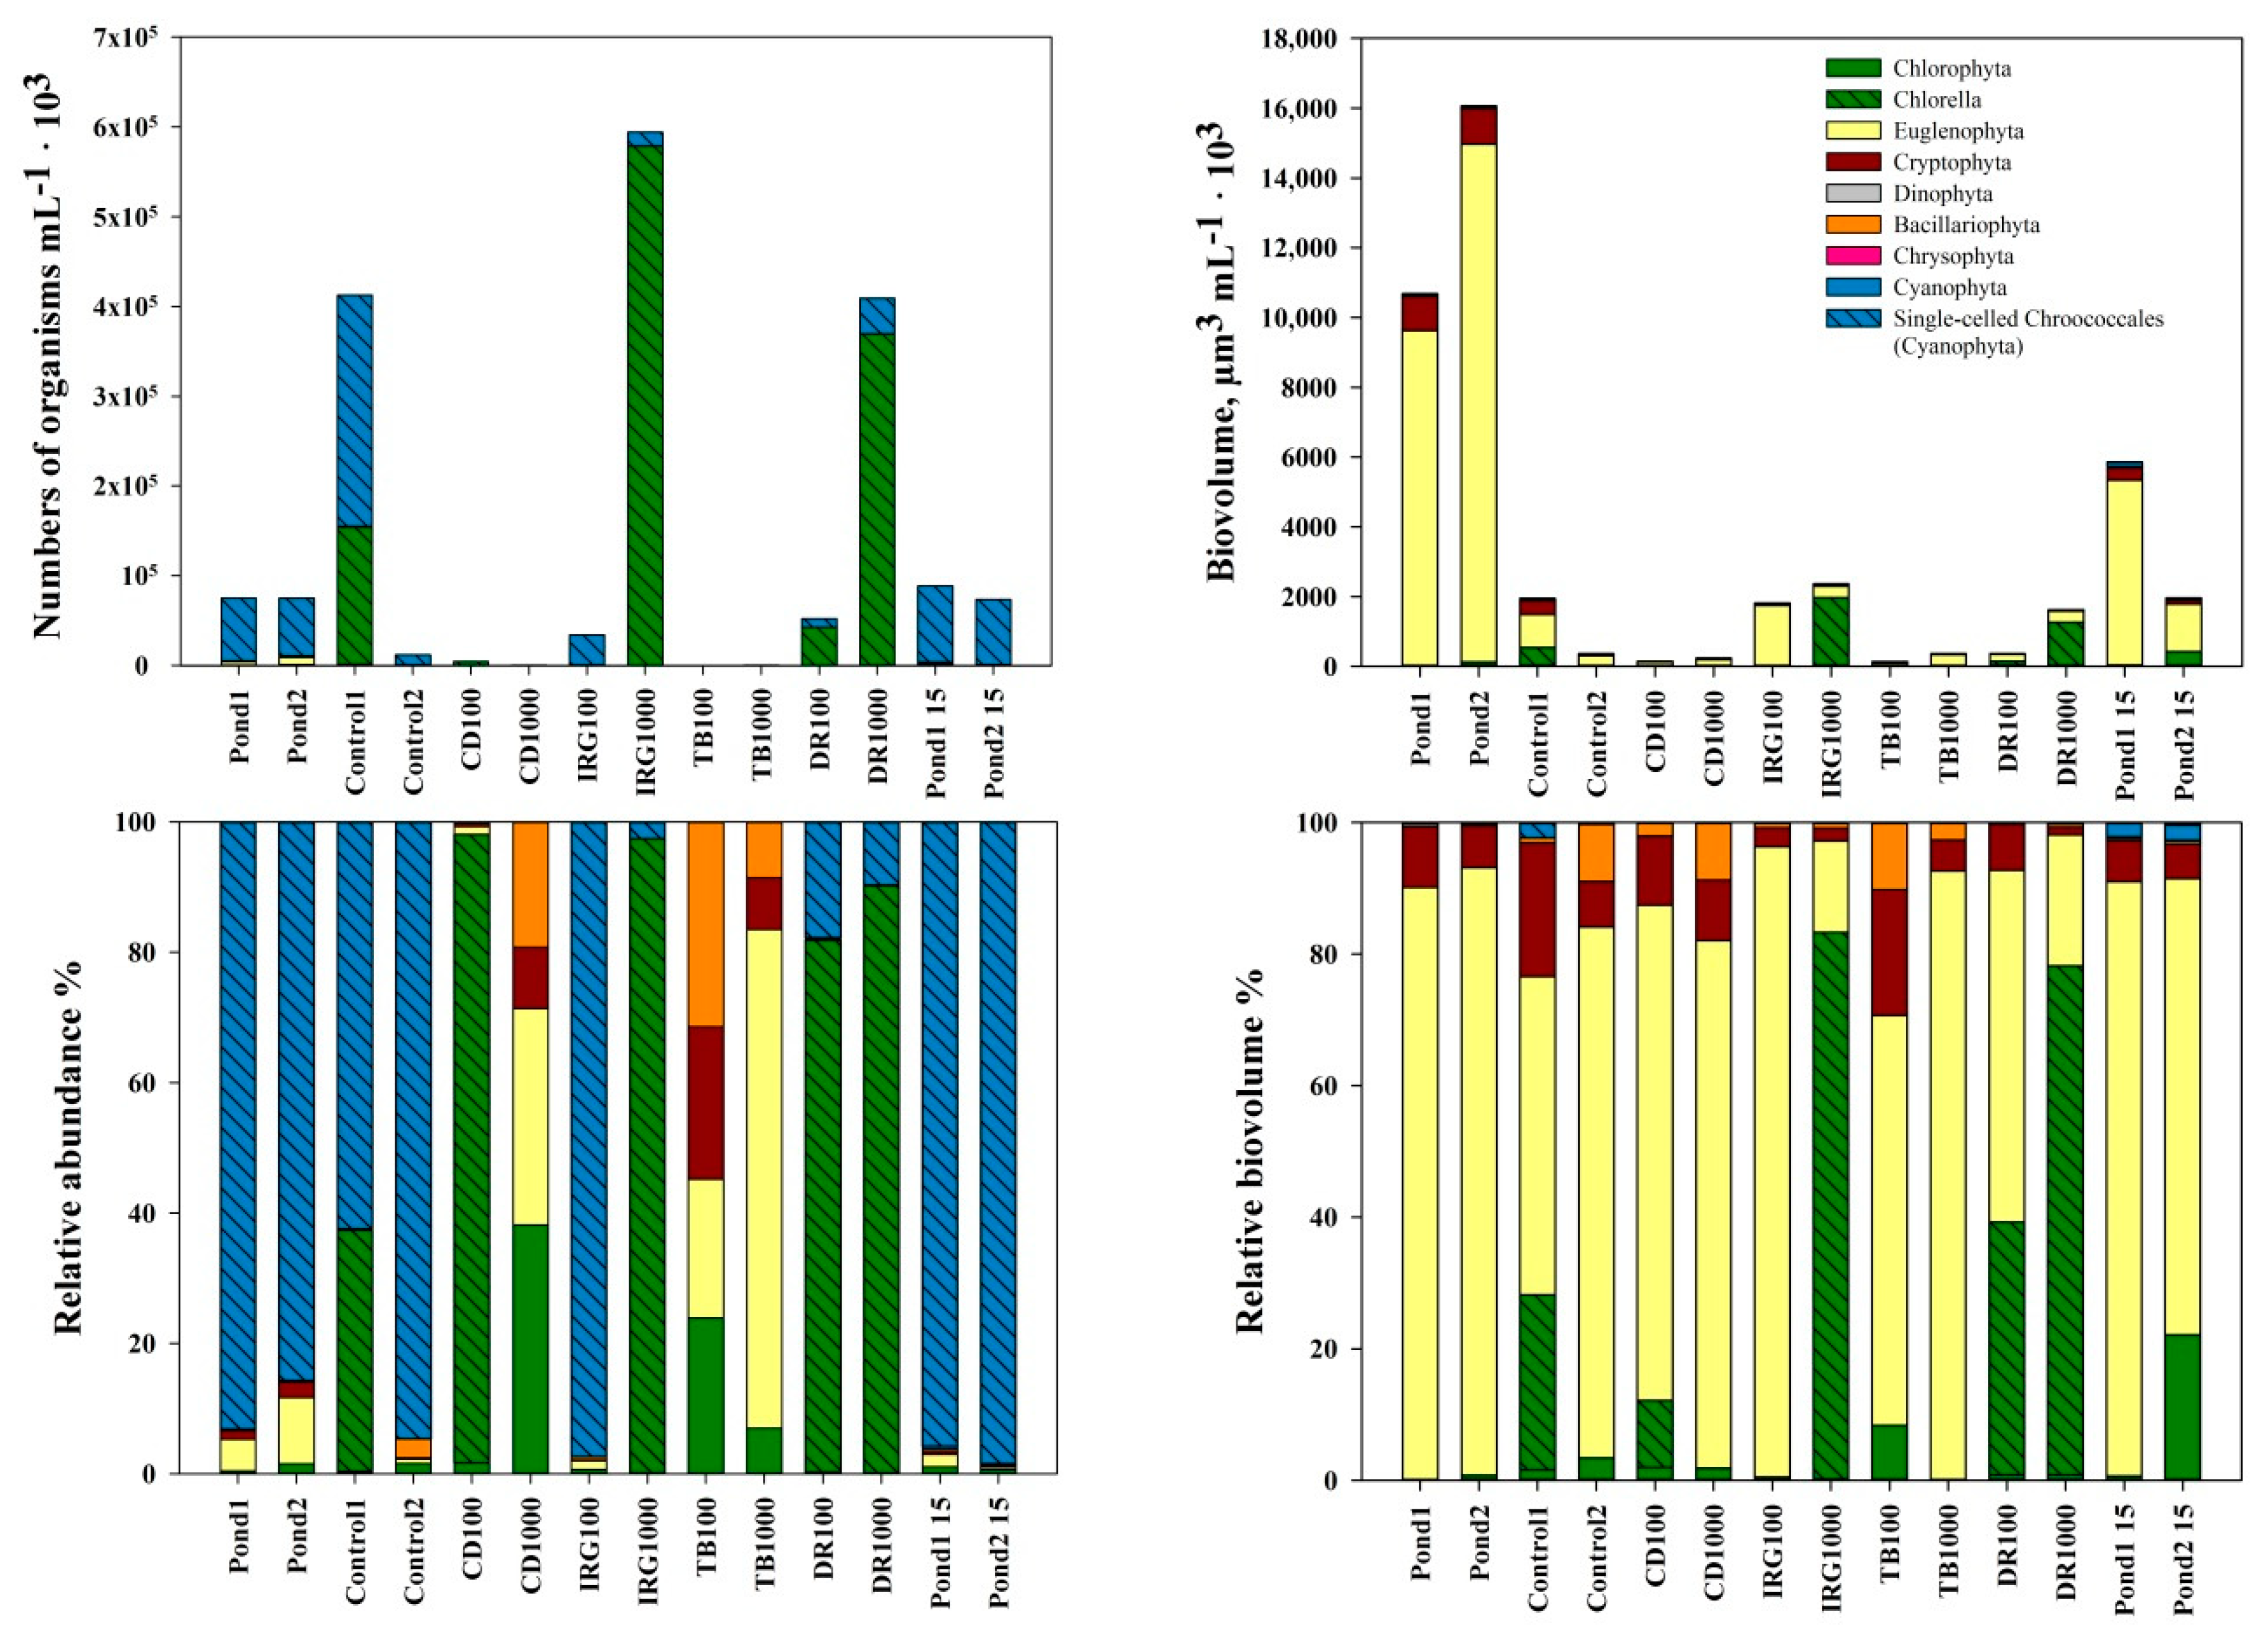
In the present study, the abundance and biovolume of the phytoplankton varied greatly among the three studied cosm types. The water phase microcosms exhibited the lowest variability among biocide treatments, while several of the sediment microcosms and in situ mesocosms peaked out from the datasets with respect to the organism counts. These differences were mainly due to increased numbers of single-celled Chroococcales, Chlorella, and Monoraphidium. The conducted statistical tests did not show any significant differences among the biocide treatments. Despite that, visually it could be seen that phytoplankton numbers and biovolumes were somewhat lower in biocide-treated cosms compared to the control ones. In a similar study, reference [47] studied the effect of a somewhat higher diuron concentration, 0.01 mg L−1, on the phytoplankton ecology of a catfish pond. The authors found similar phytoplankton biomass in the diuron treated ponds and the control ponds. Yet, the biomass of filamentous blue-green algae was somewhat replaced by diatoms, indicating possible biocide pollution induced response/changes in distinct phytoplankton taxonomic groups leading to changes in dominance patterns.
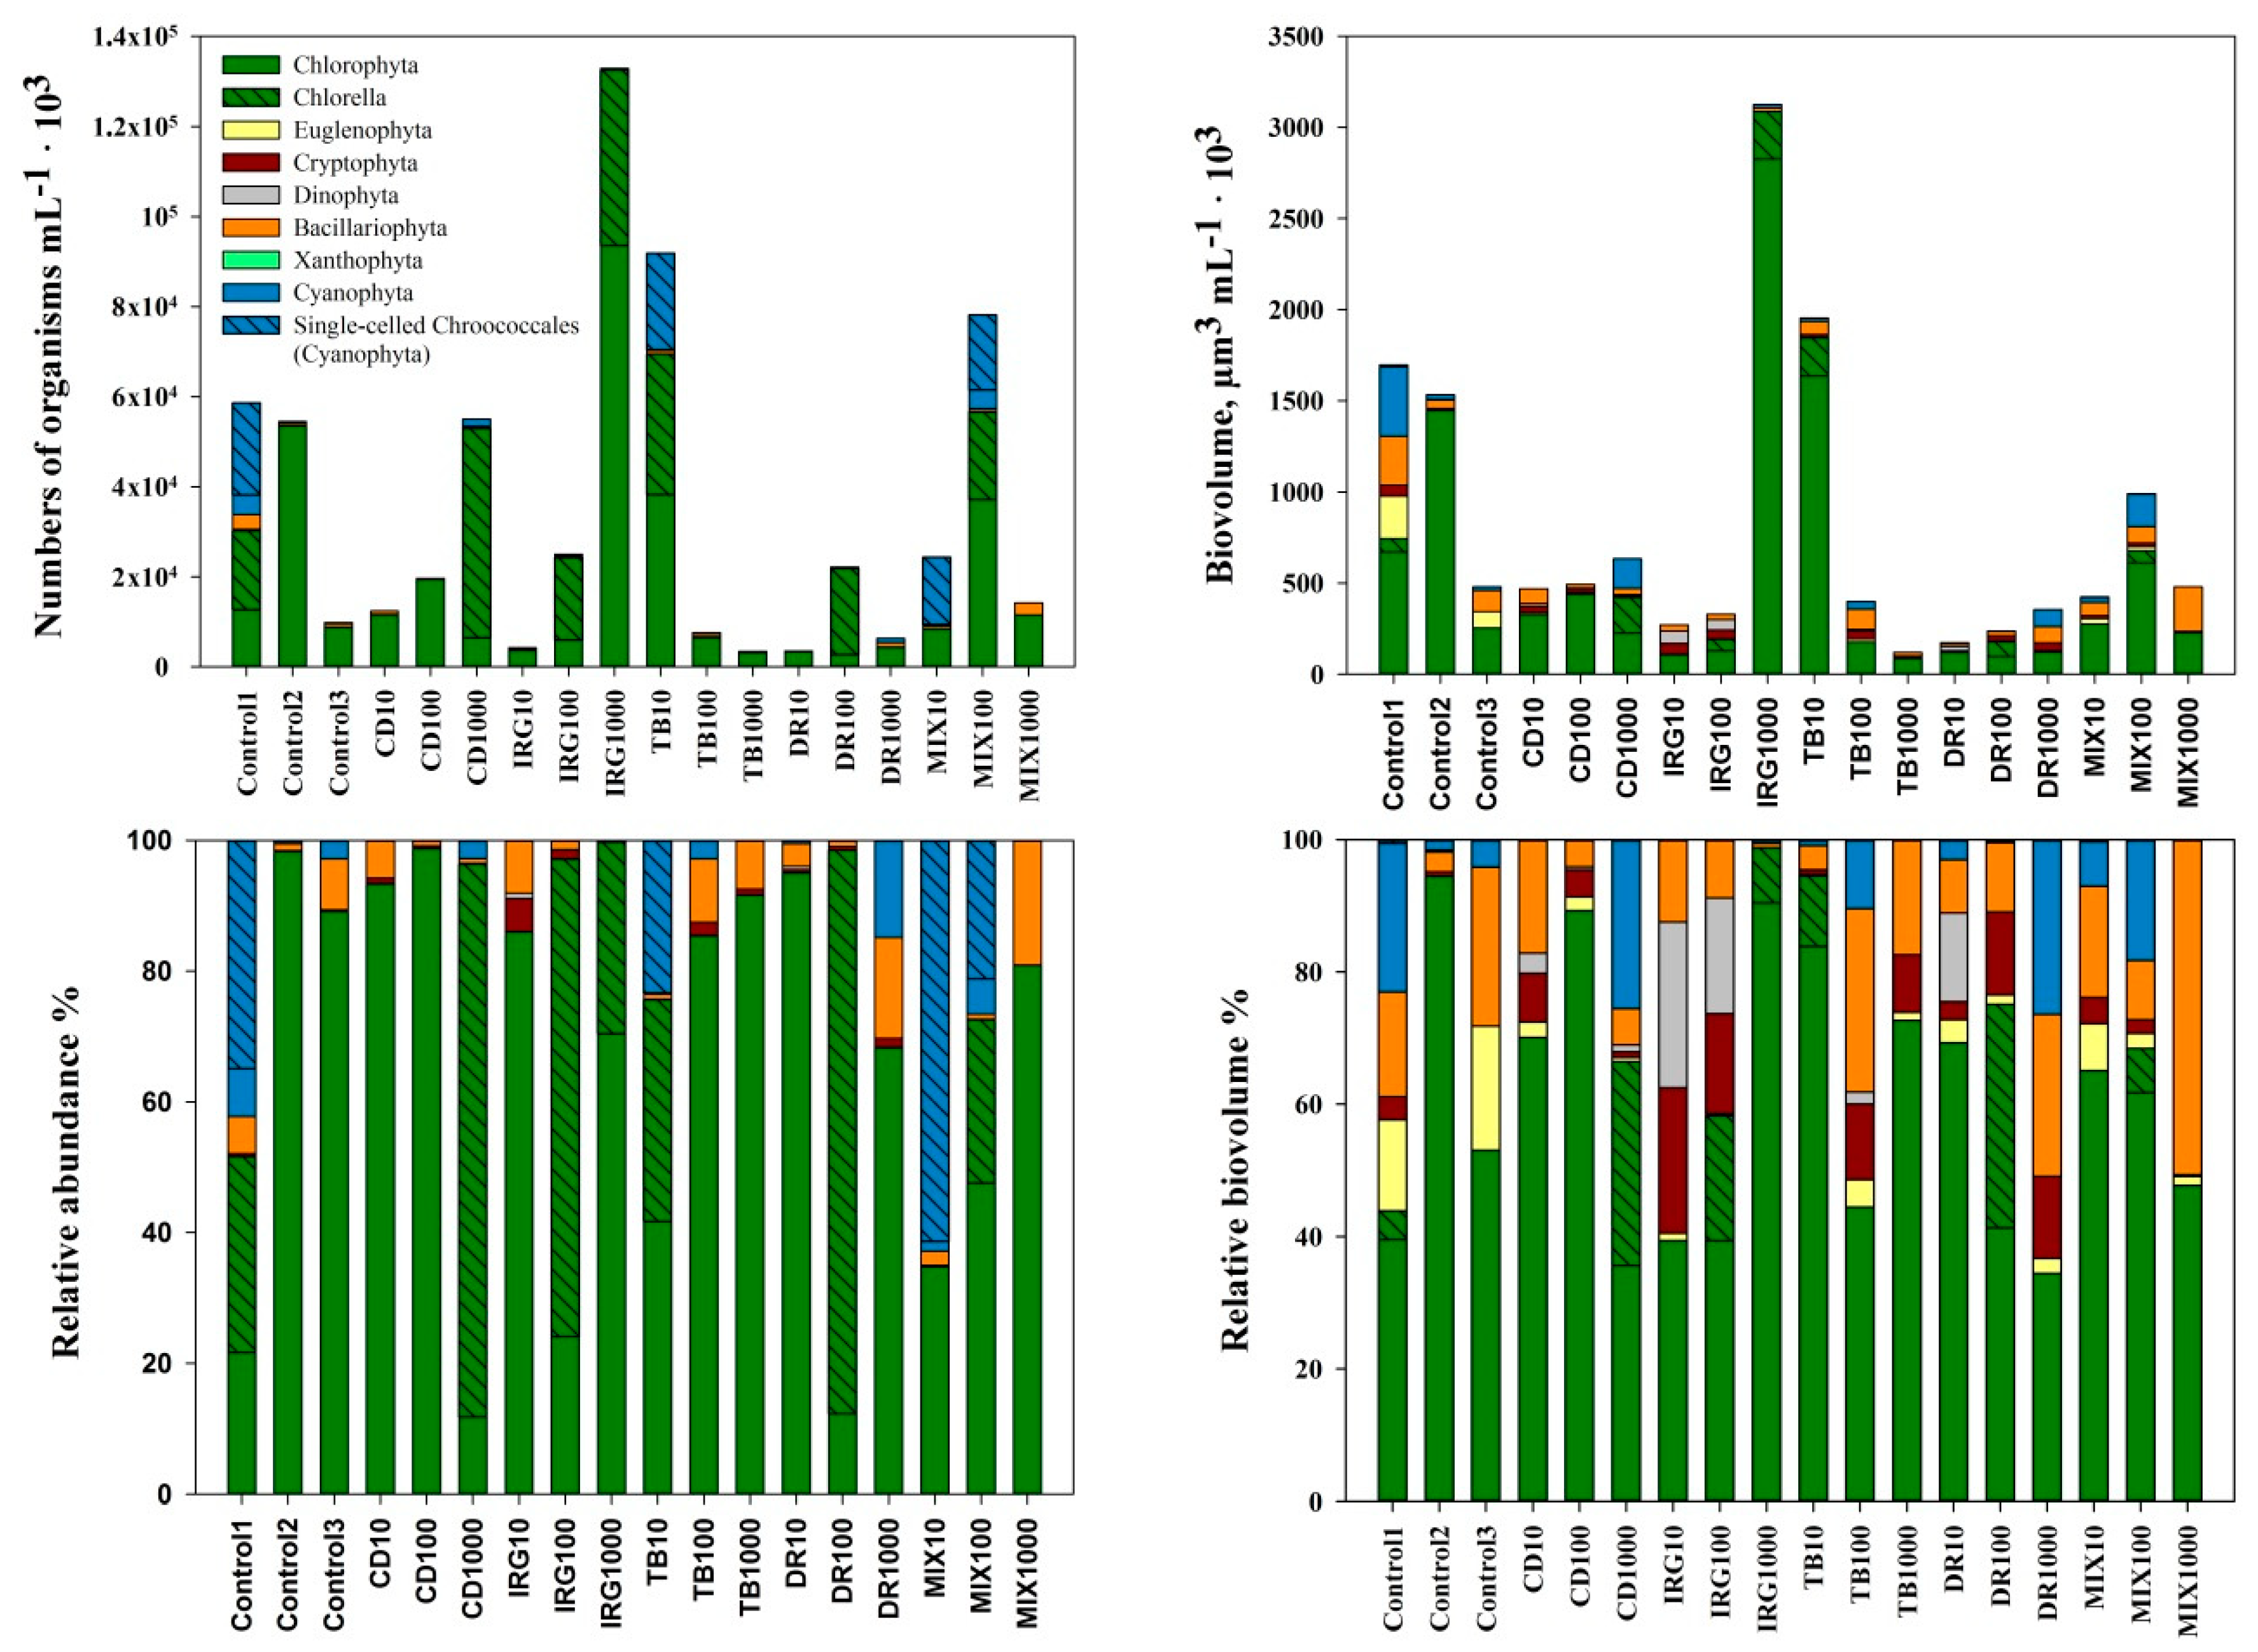
In all three types of cosms of the present investigation, the response of phytoplankton phyla to the added biocide concentrations varied highly and inconsistently. One common observed tendency was though that Chlorophyta total numbers and biovolumes increased with an increase in IRG concentration. This suggests a possible higher Chlorophyta tolerance to the biocide. A similar observation was made by [46], who in their herbicide affected outdoor mesocosm found that the phytoplankton communities were dominated by Chrysophyceae, Chlorophyceae, and Cyanophyceae. Additionally, reference [16] carried out an indoor pond mesocosm study, where effects of IRG at concentrations ranging from 0.04–5 µg L−1 on phytoplankton, periphyton, and ecosystem function were tested. In that study, the biovolumes of diatom communities decreased, while green and blue-green algae increased in the more contaminated ponds.
Despite the few observations, addressing the probable stormwater phytoplankton community response to biocide contamination, the statistical analysis did not provide any clear evidence to draw firm conclusions. It is more likely that any observed differences among samples were driven by factors other than biocides, such as, nutrient limitation or the presence of zooplankton which could have regulated the abundance of certain taxa, inducing species competition for the resources and survival [48]. Moreover, the phytoplankton communities of the studied pond are subject to considerable biocide contamination throughout the year, including terbutryn, diuron, carbendazim, and irgarol, which were investigated in the present study [5]. As a consequence, phytoplankton might have developed a tolerance to biocide contamination and thus did not show any apparent response to the applied compounds and their concentrations. Pollution induced community tolerance is well reported in the mesocosm study by [17], where phytoplankton sensitivity to atrazine, diuron, and isoproturon was tested. Phytoplankton communities which previously experienced exposure to these compounds were more tolerant to their contamination compared to the tested controls. A similar conclusion was drawn by [45], who reported that phytoplankton communities which were previously subject to IRG contamination were more tolerant to IRG.

5. Conclusions

We examined the responses of natural stormwater phytoplankton communities to biocide contamination in laboratory microcosm and outdoor mesocosms. The selected biocides, namely, carbendazim, terbutryn, diuron, irgarol, and their mixture were applied at concentrations from 10 to 1000 ng L−1 of each biocide. At the ends of the tests, the phytoplankton were analyzed with respect to taxonomic diversity, abundance, and biovolume.
No apparent differences among the biocide treatment groups were observed in any of the cosm experiments at the investigated taxonomic level. The conducted statistical tests and multivariate analysis did not show any significant differences among phytoplankton communities, after being exposed to different biocide contamination. Nevertheless, a few consistent tendencies throughout the three cosm setups were observed, such as a decrease in taxa numbers where the highest terbutryn concentration was applied, and an increase in Chlorophyta abundance and biovolume with an increase in the applied IRG concentration.
One of the possible explanations for the absence of an evident phytoplankton community response to the applied biocides at the tested concentrations could be that those are probably below the threshold which causes significant toxic effects on the phytoplankton taxa. It is likely that other factors, such as nutrient limitation and the presence of zooplankton, are as much, or even more, responsible for the phytoplankton community behavior compared to the examined biocides and their concentrations.
On the other hand, the investigated stormwater pond receives inputs of biocides from the surrounding residential catchment throughout the year, including terbutryn, diuron, carbendazim, and irgarol, which were used in the cosm experiments of this study. Thus, the possibility that previous phytoplankton exposure to biocide contamination might have induced community tolerance towards them should not be neglected and could be further investigated in the future studies.

Supplementary Materials

The following are available online at https://www.mdpi.com/2073-4441/12/11/3120/s1. Figure S1: Schematic of the water phase microcosm setup. Figure S2: Schematic of the sediment microcosm setup. Figure S3: Schematic of the in situ mesocosm setup. Table S1: Concentrations of NO3+NO2-N, total phosphorus (TP), dissolved reactive phosphorus (DRP), chlorophyll-a, and dissolved oxygen (DO); conductivity; pH; and concentrations of biocides carbendazim (CD), diuron (DR), terbutryn (TB), and irgarol (IRG), measured at the beginning (day 0, water sample collected from the pond) and at the end (day 10) of the water phase microcosm experiment. NA—not analyzed or not available. Table S2: Numbers of organisms (mL−1) per phytoplankton taxa identified at day 0 (water sample collected from the pond) and at the end (day 10) of the water phase microcosm experiment. A + indicates that at least one organism belonging to that taxa was observed. Table S3: Concentrations of NO3+NO2-N, total phosphorus (TP), dissolved reactive phosphorus (DRP) chlorophyll-a, and dissolved oxygen (DO); conductivity; pH, and concentrations of biocides carbendazim (CD), diuron (DR), terbutryn (TB), and irgarol (IRG), measured at the beginning (day 0, water sample collected from the pond) and at the end (day 10) of the sediment microcosm experiment. NA—not analyzed or not available. Table S4: Numbers of organisms (mL−1) per phytoplankton taxa identified at day 0 (water sample collected from the pond) and at the end (day 10) of the sediment core laboratory microcosm experiment. A + indicates that at least one organism belonging to that taxa was observed. Table S5: NO3+NO2-N, total phosphorus (TP); dissolved reactive phosphorus (DRP); chlorophyll-a, dissolved oxygen (DO); conductivity; pH; water temperature (T); biocide carbendazim (CD), diuron (DR), terbutryn (TB), and irgarol (IRG) concentrations, measured for the outdoor mesocosm experiment. NA—not analyzed or not available. Table S6: Average and maximum biocide concentrations (ng L−1), measured in mesocosms during the experiment period. Table S7. Numbers of organisms (mL−1) per phytoplankton taxa identified at the end (day 15) of the outdoor mesocosm experiment. A + indicates that at least one organism belonging to that taxa was observed.

Author Contributions

Conceptualization: D.A.S., M.L.F., and J.V.; data curation: G.M., M.L.F., and J.V.; formal analysis: G.M., D.A.S., and J.V.; funding acquisition: J.V.; investigation: G.M., D.A.S., and M.S.; methodology, G.M., D.A.S., M.S., M.L.F., and J.V.; project administration: J.V.; supervision: D.A.S., M.L.F., and J.V.; writing—original draft: G.M.; writing—review and editing: D.A.S., M.S., M.L.F., and J.V. All authors have read and agreed to the published version of the manuscript.

Funding

This research was funded by the Danish Environmental Protection Agency, project number MST- 667-00151.

Conflicts of Interest

The authors declare no conflict of interest. The funders had no role in the design of the study; in the collection, analyses, or interpretation of data; in the writing of the manuscript, or in the decision to publish the results.

References

  1. Paulus, W. Directory of Microbicides for the Protection of Materials—A Handbook; Paulus, W., Ed.; Springer: Berlin/Heidelberg, Germany, 2004; p. 787. ISBN 1-4020-2818-0. (e-book). [Google Scholar]
  2. Burkhardt, M.; Kupper, T.; Hean, S.; Haag, R.; Schmid, P.; Kohler, M.; Boller, M. Biocides used in building materials and their leaching behavior to sewer systems. Water Sci. Technol. 2007, 56, 63–67. [Google Scholar] [CrossRef] [PubMed]
  3. Paijens, C.; Bressy, A.; Frere, B.; Moilleron, R. Biocide emissions from building materials during wet weather: Identification of substances, mechanism of release and transfer to the aquatic environment. Environ. Sci. Pollut. Res. 2020, 27, 3768–3791. [Google Scholar] [CrossRef] [PubMed]
  4. Hvitved-Jacobsen, T.; Vollertsen, J.; Nielsen, A.H. Urban and Highway Stormwater Pollution; Concepts and Engineering; CRC Press: Boca Raton, FL, USA, 2010. [Google Scholar]
  5. Bollmann, U.E.; Vollertsen, J.; Carmeliet, J.; Bester, K. Dynamics of biocide emissions from buildings in a suburban stormwater catchment—Concentrations, mass loads and emission processes. Water Res. 2014, 56, 66–76. [Google Scholar] [CrossRef] [PubMed]
  6. Scher, O.; Thiery, A. Odonata, Amphibia and environmental characteristics in motorway stormwater retention ponds (Southern France). Hydrobiologia 2005, 551, 237–251. [Google Scholar] [CrossRef]
  7. Le Viol, I.; Mocq, J.; Julliard, R.; Kerbiriou, C. The contribution of motorway stormwater retention ponds to the biodiversity of aquatic macroinvertebrates. Biol. Conserv. 2009, 142, 3163–3171. [Google Scholar] [CrossRef]
  8. Koziel, L.; Juhl, M.; Egemose, S. Effects on biodiversity, physical conditions and sediment in streams receiving stormwater discharge treated and delayed in wet ponds. Limnologica 2018, 75, 11–18. [Google Scholar] [CrossRef]
  9. Oertli, B.; Parris, K.M. Review: Toward management of urban ponds for freshwater biodiversity. Ecosphere 2019, 10, e02810. [Google Scholar] [CrossRef] [Green Version]
  10. Bishop, C.A.; Struger, J.; Shirose, L.J.; Dunn, L.; Campbell, G.D. Contamination and Wildlife Communities in Stormwater Detention Ponds in Guelph and The Greater Toronto Area, Ontario, 1997 and 1998. Part II—Contamination and Biological Effects of Contamination. Water Qual. Res. J. Can. 2000, 35, 437–474. [Google Scholar] [CrossRef]
  11. John, D.M.; Whitton, B.A.; Brook, A.J. The Freshwater Algal Flora of the British Isles, 2nd ed.; An Identification Guide to Freshwater and Terrestrial Algae; Cambridge University Press: Cambridge, UK, 2011; p. 878. ISBN 978-0-521-19375-7. [Google Scholar]
  12. Thomas, K.V.; Brooks, S. The environmental fate and effects of antifouling paint biocides. Mini review. Biofouling 2010, 26, 73–88. [Google Scholar] [CrossRef]
  13. Martins, S.E.; Fillmann, G.; Lillicrap, A.; Thomas, K.V. Review: Ecotoxicity of organic and organo-metallic antifouling co-biocides and implications for environmental hazard and risk assessments in aquatic ecosystems. Biofouling 2018, 34, 34–52. [Google Scholar] [CrossRef]
  14. Nyström, B.; Slooten, K.B.V.; Berard, A.; Grandjean, D.; Druart, J.C.; Laboulanger, C. Toxic effects of Irgarol 1051 on phytoplankton and macrophytes in Lake Geneva. Water Res. 2002, 36, 2020–2028. [Google Scholar] [CrossRef]
  15. Leboulanger, C.; Bouvy, M.; Carre, C.; Cecchi, P.; Almalric, L.; Bouchez, A.; Pagano, M.; Sarazin, G. Comparison of the Effects of Two Herbicides and an Insecticide on Tropical Freshwater Plankton in Microcosms. Arch. Environ. Contam. Toxicol. 2011, 61, 599–613. [Google Scholar] [CrossRef]
  16. Mohr, S.; Schröder, H.; Feibicke, M.; Berghahn, R.; Arp, W.; Nicklisch, A. Long-term effects of the antifouling booster biocide Irgarol 1051 on periphyton, plankton and ecosystem function in freshwater pond mesocosms. Aquat. Toxicol. 2008, 90, 109–120. [Google Scholar] [CrossRef] [PubMed]
  17. Knauer, K.; Leimgruber, A.; Hommen, U.; Knauert, S. Co-tolerance of phytoplankton communities to photosynthesis II inhibitors. Aquat. Toxicol. 2010, 96, 256–263. [Google Scholar] [CrossRef]
  18. Gregorio, V.; Büchi, L.; Anneville, O.; Rimet, F.; Bouchez, A.; Chevre, N. Risk of herbicide mixtures as a key parameter to explain phytoplankton fluctuation in a great lake: The case of Lake Geneva, Switzerland. Ecotoxicology 2012, 21, 2306–2318. [Google Scholar] [CrossRef] [Green Version]
  19. Minelgaite, G.; van Alst, N.; Stephansen, D.A.; Bollmann, U.E.; Bester, K.; Fejerskov, M.L.; Nielsen, A.H.; Vollertsen, J. An exploratory study of benthic diatom communities in stormwater ponds of different land uses and varying biocide contamination. Aquat. Ecology 2020, 54, 761–774. [Google Scholar] [CrossRef]
  20. WFD (Water Framework Directive). Directive 2013/39/EU of the European Parliament and of the council of 12 August 2013 amending Directives 2000/60/EC and 2008/105/EC as regards priority substances in the field of water policy. Off. J. Eur. Union L 2013, 226, 1–17. [Google Scholar]
  21. Burkhardt, M.; Junghans, M.; Zuleeg, S.; Schoknecht, U.; Lamani, X.; Bester, K.; Vonbank, R.; Simmler, H.; Boller, M. Biozide in Gebaudefassaden—Okotoxikologische Effekte, Auswaschung und Belastungsabschatzung fur Gewasser. Umweltwiss Schadst Forsch 2009, 21, 36–47. [Google Scholar] [CrossRef] [Green Version]
  22. DMI—Danish Meteorological Institute. 2015. Available online: http://www.dmi.dk (accessed on 28 August 2020).
  23. DS 292. Vandundersøgelse. Total Phosphor. Fotometrisk Metode; Fonden Dansk Standard: Nordhavn, Denmark, 1985. [Google Scholar]
  24. SM. Standard Method Approved by American Public Health Association, American Water Works Association, Water Environment Federation, 1999. Available online: https://www.standardmethods.org/doi/10.2105/SMWW.2882.093 (accessed on 5 November 2020).
  25. DS 223. Vandundersøgelse. Bestemmelse af Summen af Nitrit-og Nitratnitrogen; Fonden Dansk Standard: Nordhavn, Denmark, 1991. [Google Scholar]
  26. Minelgaite, G.; Frost, P.C.; Xenopoulos, M.A.; Stephansen, D.A.; Fejerskov, M.L.; Vollertsen, J. Planktonic algae abundance and diversity are similar in urban stormwater ponds of different geographic locations and natural shallow lakes. Urban Ecosyst. 2020, 23, 841–850. [Google Scholar] [CrossRef] [Green Version]
  27. Hillebrand, H.; Durselen, C.-D.; Kirschtel, D.; Pollingher, U.; Zohary, T. Biovolume calculation for pelagic and benthic microalgae. J. Phycol. 1999, 35, 403–424. [Google Scholar] [CrossRef]
  28. Lauridsen, T.L.; Søndergaard, M.; Jensen, J.P.; Jeppesen, E. Undersøgelser i Søer; NOVANA; 234 s.; Teknisk anvisning fra DMU; Danmarks Miljøundersøgelser: Copenhagen, Denmark, 2005; Volume 22. [Google Scholar]
  29. SPIPHES—The Shiga Prefectural Institute of Public Health and Environmental Science. The Plankton of Lake Biwa; SPIPHES: Shiga, Japan, 1982. (In Japanese) [Google Scholar]
  30. Tikkanen, T.; Willen, T.; Andersson, B. Växtplanktonflora; Statens Naturvårdsverk: Solna, Sweden, 1992; p. 280. ISBN 9162011154, 9789162011154. [Google Scholar]
  31. Nygaard, G. Dansk Planteplankton, 3rd ed.; Kristiansen, J., Ed.; Gyldendal: Copenhagen, Denmark, 2001; p. 36. ISBN 13 9788700499126. [Google Scholar]
  32. Wehr, J.D.; Sheath, R.G.; Kociolek, J.P.; Thorp, J.H. Freshwater Algae of North America: Ecology and Classification (Aquatic Ecology), 1st ed.; Academic Press: Cambridge, MA, USA, 2003; p. 913. ISBN 0-12-741550-5. [Google Scholar]
  33. Cronberg, G.; Annadotter, H. A Photo Guide and Synopsis of Their Toxicology; ISSHA and IOC UNESCO: Copenhagen, Denmark, 2006; p. 106. [Google Scholar]
  34. Komarek, J.; Anagnostidis, K. Cyanoprokaryota; Süßwasserflora von Mitteleuropa, Bd. 19/2: Bd. 2/Part 2: Oscillatoriales; Springer: Berlin/Heidelberg, Germany, 2007; p. 759. ISBN 978-3-8274-1914-9. [Google Scholar]
  35. Komarek, J. Cyanoprokaryota; Teil 1/Part 1: Chroococcales; Süßwasserflora von Mitteleuropa, 19/1; Springer: Berlin/Heidelberg, Germany, 2008; p. 548. ISBN 978-3-8274-2111-1. [Google Scholar]
  36. Komarek, J. Cyanoprokaryota; Süßwasserflora von Mitteleuropa, Bd. 19/3; 3. Teil/3rd part: Heterocytous Genera; Springer: Berlin/Heidelberg, Germany, 2013; p. 1131. ISBN 978-3-8274-0932-4. [Google Scholar]
  37. Algaebase. SITE © 1996–2017 M.D. Guiry. 2017. Available online: http://www.algaebase.org/ (accessed on 28 August 2020).
  38. Conover, W.J. Practical Nonparametric Statistics, 2nd ed.; John Wiley & Sons: Hoboken, NJ, USA, 1980. [Google Scholar]
  39. Snedecor, G.W.; Cochran, W.G. Statistical Methods; Iowa State College Press: Ames, IA, USA, 1989. [Google Scholar]
  40. Systat Software Inc. Sigmaplot v. 13.2; Systat Inc.: San Jose, CA, USA, 2016. [Google Scholar]
  41. Hammer, Ø.; Harper, D.A.T.; Ryan, P.D. PAST: Paleontological Statistics Software Package for Education and Data Analysis. Palaeontol. Electron. 2001, 4, 9. Available online: http://palaeo-electronica.org/2001_1/past/issue1_01.htm (accessed on 28 August 2020).
  42. Legendre, P.; Legendre, L. Numerical Ecology, 3rd ed.; Elsevier: Amsterdam, The Netherlands, 2012; ISBN 9780444538680. [Google Scholar]
  43. European Commission. 5030/VI/98; Review Report for the Active Substance Thiophanate-Methyl Finalised in the Standing Committee on the Food Chain and Animal Health at Its Meeting on 15 February 2005 in View of the Inclusion of Thiophanate-Methyl in Annex I of Directive 91/414/EEC; European Commission, Health and Consumer Protection Directorate-General, Directorate D—Food Safety: Production and distribution chain, D3—Chemicals, Contaminants and Pesticides: Brussels, Belgium, 2005. [Google Scholar]
  44. Berard, A.; Dorigo, U.; Mercier, I.; Slooten, K.B.V.; Grandjean, D.; Leboulanger, C. Comparison of the ecotoxicological impact of the triazines Irgarol 1051 and atrazine on microalgal cultures and natural microalgal communities in Lake Geneva. Chemosphere 2003, 53, 935–944. [Google Scholar] [CrossRef]
  45. Ma, J.; Zheng, R.; Xu, L.; Wang, S. Differential Sensitivity of Two Green Algae, Scenedesmus obliqnus and Chlorella pyrenoidosa, to 12 Pesticides. Ecotoxicol. Environ. Saf. 2002, 52, 57–61. [Google Scholar] [CrossRef] [PubMed]
  46. Knauert, S.; Dawo, U.; Hollender, J.; Hommen, U.; Knauer, K. Effects of Photosystem II Inhibitors and Their Mixture on Freshwater Phytoplankton Succession in Outdoor Mesocosms. Environ. Toxicol. Chem. 2009, 28, 836–845. [Google Scholar] [CrossRef]
  47. Zimba, P.V.; Tucker, C.S.; Mischke, C.C.; Grimm, C.C. Short-Term Effect of Diuron on Catfish Pond Ecology. N. Am. J. Aquac. 2002, 64, 16–23. [Google Scholar] [CrossRef]
  48. Litchman, E.; Klausmeier, C.A. Trait-Based Community Ecology of Phytoplankton. Annu. Rev. Ecol. Ecol. Syst. 2008, 39, 615–639. [Google Scholar] [CrossRef] [Green Version]
Figure 1. Phytoplankton taxa distribution in the water phase microcosm study. Absolute and relative values are given with respect to the counted numbers of organisms and the estimated biovolumes.
Water 12 03120 g001
Figure 2. Phytoplankton cluster (a) and DCA (b) tests for water phase microcosm study: (1) with respect to the counted numbers of organisms mL−1, and (2) with respect to the estimated biovolumes.
Water 12 03120 g002
Figure 3. Phytoplankton taxa distribution in the sediment microcosm study. Absolute and relative values are given with respect to the counted numbers of organisms and the estimated biovolumes.
Water 12 03120 g003
Figure 4. Phytoplankton taxa distribution in the in situ mesocosm study. Absolute and relative values are given for the counted numbers of organisms and the estimated biovolumes.
Water 12 03120 g004
Publisher’s Note: MDPI stays neutral with regard to jurisdictional claims in published maps and institutional affiliations.

