Article

Lumped Approach for Reactive Transport of Organic Compound Mixtures through Simulated Aquifer Sands in Lab-Scale Column Tests

1
Department of Civil and Environmental Engineering, Hanbat National University, Daejeon 34158, Korea
2
Groundwater Research Center, Geologic Environment Division, Korea Institute of Geoscience and Mineral Resources (KIGAM), Daejeon 34132, Korea
3
Department of Mineral and Groundwater Resources, Korea University of Science and Technology, Daejeon 34113, Korea
4
Department of Land, Water and Environment Research, Korea Institute of Civil Engineering and Building Technology, Goyang 10223, Korea
*
Author to whom correspondence should be addressed.
Water 2020, 12(11), 3103; https://doi.org/10.3390/w12113103
Submission received: 6 October 2020 / Revised: 30 October 2020 / Accepted: 2 November 2020 / Published: 4 November 2020

Abstract

:
The feasibility of the lumped approach for reactive transport of 12 organic compounds in mixtures through simulated aquifer sands with different organic carbon content (foc) within soil columns was evaluated. From direct measurements of effluent samples and temporal and spatial pore-water concentration profiles within soil columns, 12 organic compounds in mixtures were sorbed to different extents due to the different dependence of sorption on foc. Considering the tradeoff between accuracy and simplicity, four, five, and six pseudocompounds were determined for simulated aquifer sands with foc of 0.006%, 0.051%, and 0.221%, respectively, to approximate the reactive transport of 12 organic compounds in mixtures. Each pseudocompound presented obviously different reactive transport behavior in terms of both sorption capacity and nonlinearity, indicating that each pseudocompound contained components with relatively similar sorption capacities and nonlinearity. Similar to the results from batch equilibrium sorption tests, log Koc can be used as the a priori grouping criterion, although the relative contributions of different forces to the overall sorption may differ for different composition of organic mixtures and foc values of aquifer sands. Finally, the assignment of the Freundlich sorption parameters of pseudocompounds using averages of Freundlich sorption parameters of their components led to reasonable prediction for reactive transport of organic compounds in mixtures through the soil columns. Further study is warranted to evaluate the effective coupling between lumped approach and reactive transport model using complex multicomponent mixtures within heterogeneous subsurface systems.

1. Introduction

Although most studies have involved individual systems to understand the reactive transport of each compound and to reconcile models for heterogeneous geosorbents, environmental contamination usually results in the presence of mixtures of compounds (e.g., gasoline, fuel hydrocarbon/chlorinated solvents, pesticides, landfill leachates, and pharmaceuticals) in the subsurface [1,2,3,4,5,6,7]. Whereas the reactive transport of individual compounds in the subsurface has been studied extensively in both saturated and unsaturated porous media [4], much less is known about the reactive transport of mixtures [1,2,3,6,7]. Additionally, models describing the reactive transport of compounds in complex mixtures routinely ignore mixture effects, such as competitive or synergistic sorption [1,2,3]. Although the entire system of differential equations with interaction parameters describing the reactive transport of compounds in mixtures can be solved simultaneously in space and time, this detailed approach (i.e., one equation per each compound with interaction parameters) can become gradually more complex and less computationally efficient as the number of compounds in mixtures increases, restraining the practical usefulness of this detail approach [1,2,3].
An alternative to this detailed approach is the so-called “lumped approach”. The lumped approach has been used by (1) grouping the list of species by removing inessential components and/or lumping some species [1,3], (2) grouping the list of reactions by removing inessential side reactions and/or assuming quasi-equilibrium for some reaction steps [8], or (3) decomposing the kinetics into fast and slow parts and applying the quasi-steady-state-approximation to reduce its dimensionality [9]. Such a lumped approach has been extensively applied in providing tractable approximations to the kinetics of complex hydrocarbon mixtures [9,10], in describing multicomponent sorption to simulated aquifer sands [1,3] and to humic substances [11], and in globalizing chemical lumping of species and reactions in wastewater treatment [12,13], secondary organic aerosol mixtures [14], toxicology of compound mixtures [15,16], and reactive transport of compound mixtures in the unsaturated zone [17].
On the basis of the successful applications of this lumped approach to various complex systems, the use of a lumped approach to describe the sorption of organic compounds in mixtures in terms of the sorption of a fewer number of pseudocompounds (groups of compounds) with similar sorption affinities was also validated from batch equilibrium sorption tests in previous study [1,3]. The lumped approach for sorption to simulated aquifer sands was guided by cluster analysis from statistics, and both feasibility and accuracy of the lumped approach using both base case and random mixtures of organic compounds in terms of different type of mineral surfaces and humic acid (HA)-coated sands with different organic carbon content (foc) were confirmed by the relatively consistent lumping schemes for each sorbent and the acceptable estimation of sorption behavior of organic compounds in mixtures [1,3]. Finally, the assignment of the Freundlich sorption parameters of pseudocompounds using single-sorbate Freundlich sorption parameters of their components led to relatively reasonable accuracy of sorption prediction in complex mixtures [1,3].
In this study, the lumped approach was evaluated for use in determining temporal and spatial effluents and concentration profiles of organic compound mixtures in saturated groundwater aquifer through columns packed with simulated aquifer sands with different fractions of organic carbon (foc). Then, the reactive transport of organic compound mixtures was simulated numerically using the finite-difference groundwater flow model, MODFLOW [18], and the associated multispecies reactive transport code, RT3D [19] coupling with the lumped approach. Since numerous predefined reactions and user-defined reactions are available in RT3D [20], RT3D coupled with the lumping scheme is well suited to simulate complex reactive transport of organic compound mixtures in groundwater. This coupling between the lumped approach and reactive transport model may provide a potentially more accessible tool for prediction of reactive transport of complex multicomponent mixtures within randomly heterogeneous subsurface systems.
Thus, the reactive transport of 12 organic compounds with various physicochemical properties in mixtures was evaluated using column tests packed with simulated aquifer sands under abiotic conditions. Both feasibility and accuracy of the lumped approach using organic compound mixtures in terms of simulated aquifer sands with different foc values were assessed by the relatively similar reactive transport behavior of organic compounds in mixtures. The specific objectives of this study were to (1) evaluate the feasibility of the lumped approach for reactive transport of organic compound mixtures through simulated aquifer sands with different foc values within soil columns, (2) develop both experimental lumping schemes and grouping criteria for reactive transport of organic compound mixtures through simulated aquifer sands with different foc values, and (3) validate the effectiveness of assignment for the Freundlich sorption parameters of pseudocompounds using averages of Freundlich sorption parameters of their components. These results from this study provide insight into effective coupling between the lumped approach and reactive transport model of complex multicomponent mixtures within heterogeneous subsurface systems.

2. Materials and Methods

2.1. Simulated Aquifer Sands

Since the real aquifer sands in subsurface systems are heterogeneous and complex in terms of the composition and structure of the inorganic and organic components, the specific sorption mechanisms and contributions of each component to overall sorption should be distinguished through manipulating both type and composition of model sorbents. In this study, three different types of simulated aquifer sands were used in this study, i.e., (1) uncoated sand and (2) HA-coated sands with different foc values (0.051% and 0.221%). Both the detailed preparation procedures and the characterization of simulated aquifer sands are described elsewhere [1,2,3]. The physicochemical properties of both uncoated and HA-coated sands were summarized in previous studies [1,2,3].

2.2. Mixtures of Organic Compounds

Mixtures of organic compounds comprised 12 compounds, six of which are considered to be polar (hydrophilic) with polar functional groups (i.e., oxygen atom) and six of which are considered to be nonpolar (hydrophobic) without any polar functional groups. The six polar compounds were acetone (ACE), 2-butanone (2-BUT), 2-hexanone (2-HEX), phenol (PHE), p-cresol (p-CRE), and 2,4-dimethyl phenol (2,4-DMP). The six nonpolar compounds were benzene (BZ), toluene (TOL), m-xylene (m-XYL), chlorobenzene (CB), 1,4-dichlorobenzene (1,4-DCB), and 1,2,4-trichlorobenzene (1,2,4-TCB). Selected physicochemical properties of 12 organic compounds were summarized in a previous study [1,2,3].

2.3. Analytical Method
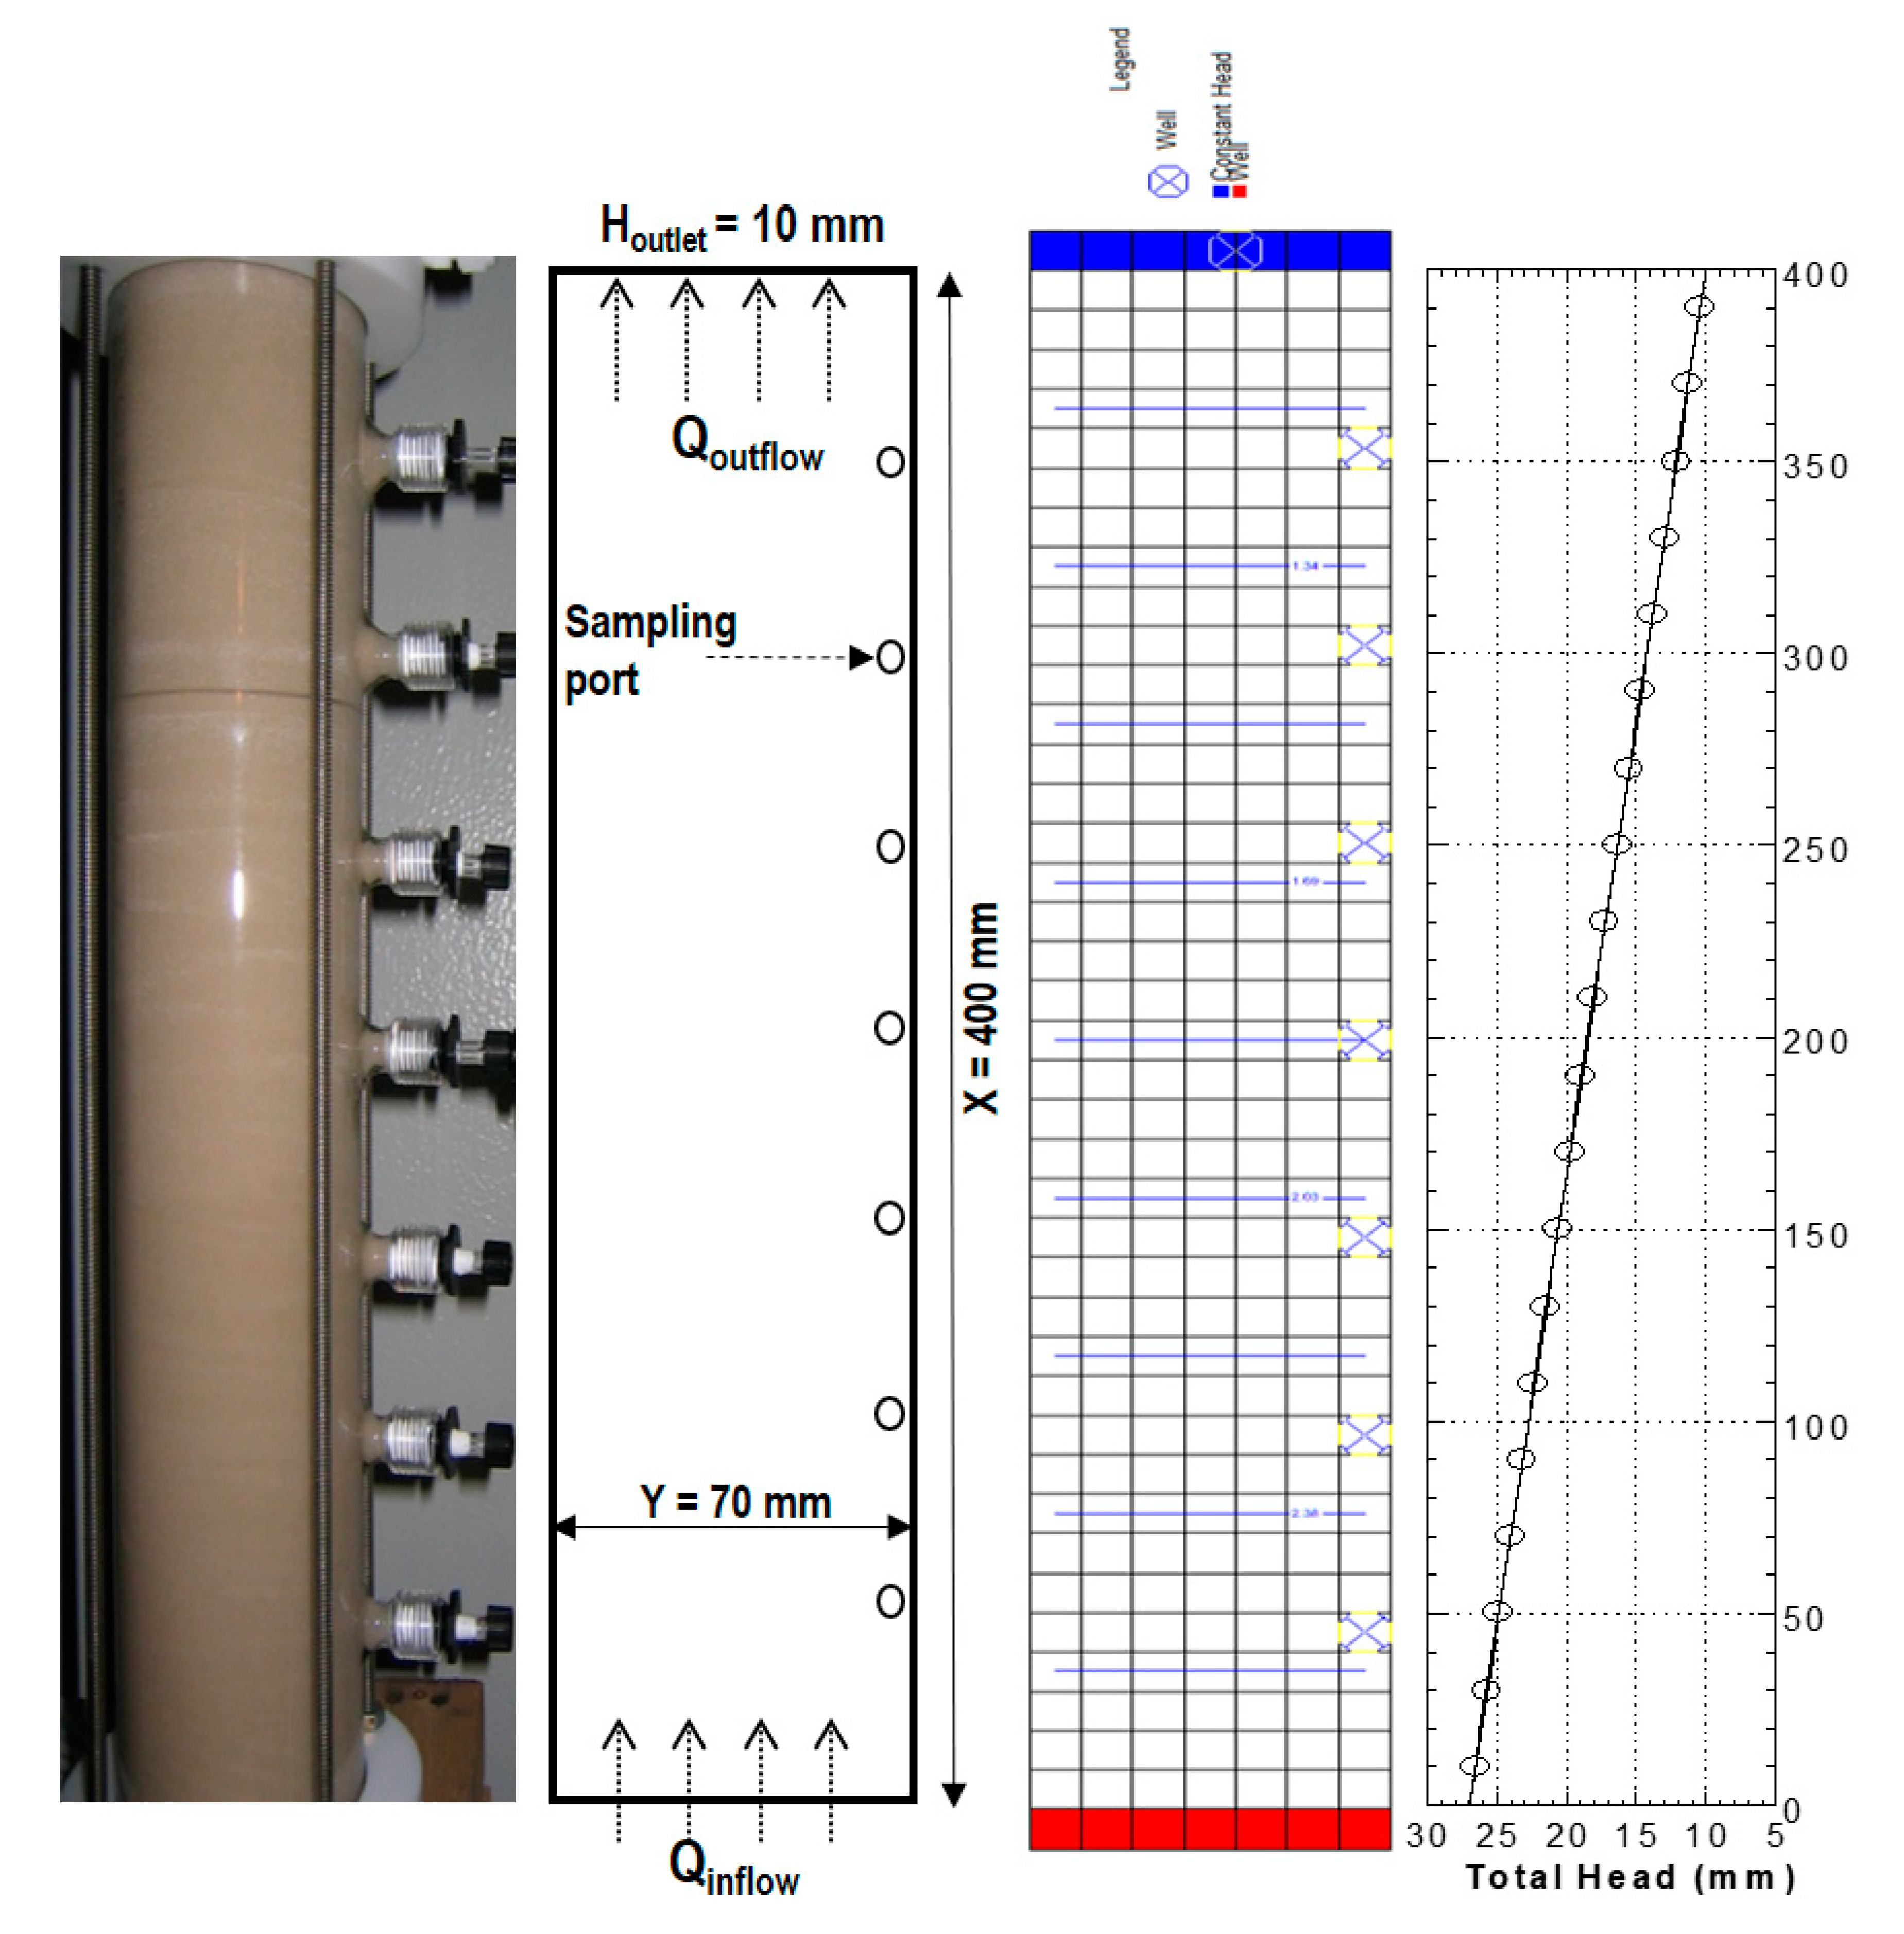
The concentration of each organic compound in mixtures was measured using gas chromatography (GC) (HP 6890, Hewlett-Packard Co., Inc, Palo Alto, CA, USA) with a mass-selective detector (MSD) and a flame ionization detector (FID). Both qualitative identifications and quantitative determination of each organic compound in mixtures were described in a previous study [1,2,3].

2.4. Column Tests

A total of three column tests were performed, one for each simulated aquifer sand without replicates, and column tests were performed sequentially using the same column testing apparatus. As illustrated in Figure 1, the column testing apparatus comprised a heavy-wall glass tube with an inner diameter of 70 mm and a length of 400 mm, seven sampling ports to collect the pore-water samples, and an outlet port to collect the effluent samples. The simulated aquifer sands were sieved (−60/+80 mesh sizes) by using the standard dry sieve technique, packed into the glass column, and compressed with a plunger to minimize side-wall flow. After dry packing, the column was flushed with CO2 gas, and a minimum of five pore volumes of organic-free nanopure water was displaced through the column prior to the column tests. The column was initially permeated with organic-free nanopure water, and then the aqueous organic mixtures at an initial concentration, C0, of 10 mg·L−1 each, was permeated through the column at a constant flow rate of approximately 243.4–252.0 mL·day−1 using the peristaltic pump. After collecting the effluent samples with the elapsed time, the effluent was allowed to accumulate in a Teflon bag (FlexFoil, SKC Inc., Eighty Four, PA, USA) at the column outlet, and 3.0 mL pore-water samples in all sampling ports were collected simultaneously for subsequent analysis of the concentrations of organic compounds in mixtures. Detailed column specifications and estimated hydrodynamic dispersion coefficients (Dh) using salt as a tracer are summarized in Table 1.

2.5. Numerical Modeling

In this study, the reactive transport of each organic compound and pseudocompounds was simulated numerically using the finite-difference groundwater flow model, MODFLOW [18], and the associated reactive transport code, RT3D [19]. In column tests, the numerical model assumed saturated flow through homogeneous and isotropic simulated aquifer sands, and the specific MODFLOW model considered a rectangular two-dimensional confined flow system with length of 400 mm by width of 70 mm in the Cartesian x- and y-directions, respectively. The numerical grid was based on nodal spacings of Δx = 10 mm, Δy = 10 mm, and Δz = 72 mm. Since biological degradation was not considered due to the addition of the biocide (200 mg·L−1 NaN3) to the permeant liquids, advection, dispersion, and equilibrium sorption to simulated aquifer sands were considered as the processes governing the reactive transport of the organic compounds in mixtures. Thus, the governing equation for one-dimensional transport of the organic compounds in mixtures through simulated aquifer sands can be written as follows:
C ( x , t ) t = D h 2 C ( x , t ) x 2 v S C ( x , t ) x ρ b n S ( x , t ) t ,
where C and S are the concentration of an organic compound in the aqueous phase (mg·L−1) and the solid phase (mg·kg−1), respectively, x is the longitudinal distance of transport (mm), t is the elapsed time (d), Dh is the hydrodynamic dispersion coefficient obtained from the results of the salt tracer (KCl) (mm2·day−1), vs is the average linear seepage velocity (mm·day−1), ρb is the bulk (dry) density (g·mL−1), and n is the total porosity. According to these considerations and Figure 1, the column was assumed to be initially free of any organic compound (C(x,0) = 0), a constant source concentration using injection wells was assumed for the upper boundary condition (C(0,t) = C0), and a zero concentration gradient using constant head was assumed for the lower boundary condition (∂C(L,t)/∂x = 0).
According to the results of a previous study evaluating the equilibrium sorption of the same organic compounds to the identical simulated aquifer sands [1,2,3], the sorption of the organic compounds in mixtures to simulated aquifer sands was assumed to follow the Freundlich sorption isotherm equation as follows:
S = K f C N ,
where Kf ((mg·kg−1)/(mg·L−1)N) is the Freundlich unit sorption capacity, and N (dimensionless) is the joint measure of the relative magnitude and diversity of energies [1].
Since the root-mean-square error (RMSE) is more appropriate to represent model performance than the mean absolute error (MAE) when the error distribution is expected to be Gaussian [21], the agreement between the experimentally measured concentrations according to the effluent/pore-water samples and the fitted (or predicted) concentrations estimated from MODFLOW-RT3D was evaluated in terms of the root-mean-square error (RMSE) defined as follows:
R M S E = i = 1 p ( X i , f i t X i , m e s ) 2 p ,
where Xi,mes and Xi,fit are the measured and fitted (or predicted) values for C(x,t), respectively, and p is the sample size.
This error function attempts to minimize the fractional error distribution across the entire concentration ranges from the comparison of measured values with the corresponding fitted (or predicted) values. Once the minimum of the error function was achieved, the values for the Freundlich sorption parameters (Kf and N) were obtained. The values for the Freundlich sorption parameters obtained from the column tests were estimated using the overall effluent data, and the resulting predicted concentration profiles within a column were compared to the measured concentration profiles to validate the effectiveness of lumped approach.

2.6. Lumped Approach

To assess the similarity among organic compounds in terms of reactive transport behavior, standardized sorption parameters for each organic compound in mixtures were plotted on the basis of two clustering variables (i.e., Kf and N). Then, the similarity of reactive transport among organic compounds was measured according to the Euclidean distance between each pair of organic compounds, and the distance between organic compounds was determined. Finally, the most appropriate clustering algorithm to maximize the differences between clusters relative to the variation within the clusters was determined. In this study, Ward’s method was performed by specifying METHOD = WARD in PROC CLUSTER (SAS® 9.1, SAS Institute Inc. Cary, NC, USA). After evaluating all possible clusters, the best number of clusters and cluster components was determined according to both statistical criteria and reactive transport behavior. Consistent with this study, cluster analysis was applied to the lumped approach for grouping the list of species and reactions [1,3,8,11] since cluster analysis provides a rational way to lump large quantities of empirical data into fewer groups [22].

3. Results and Discussion

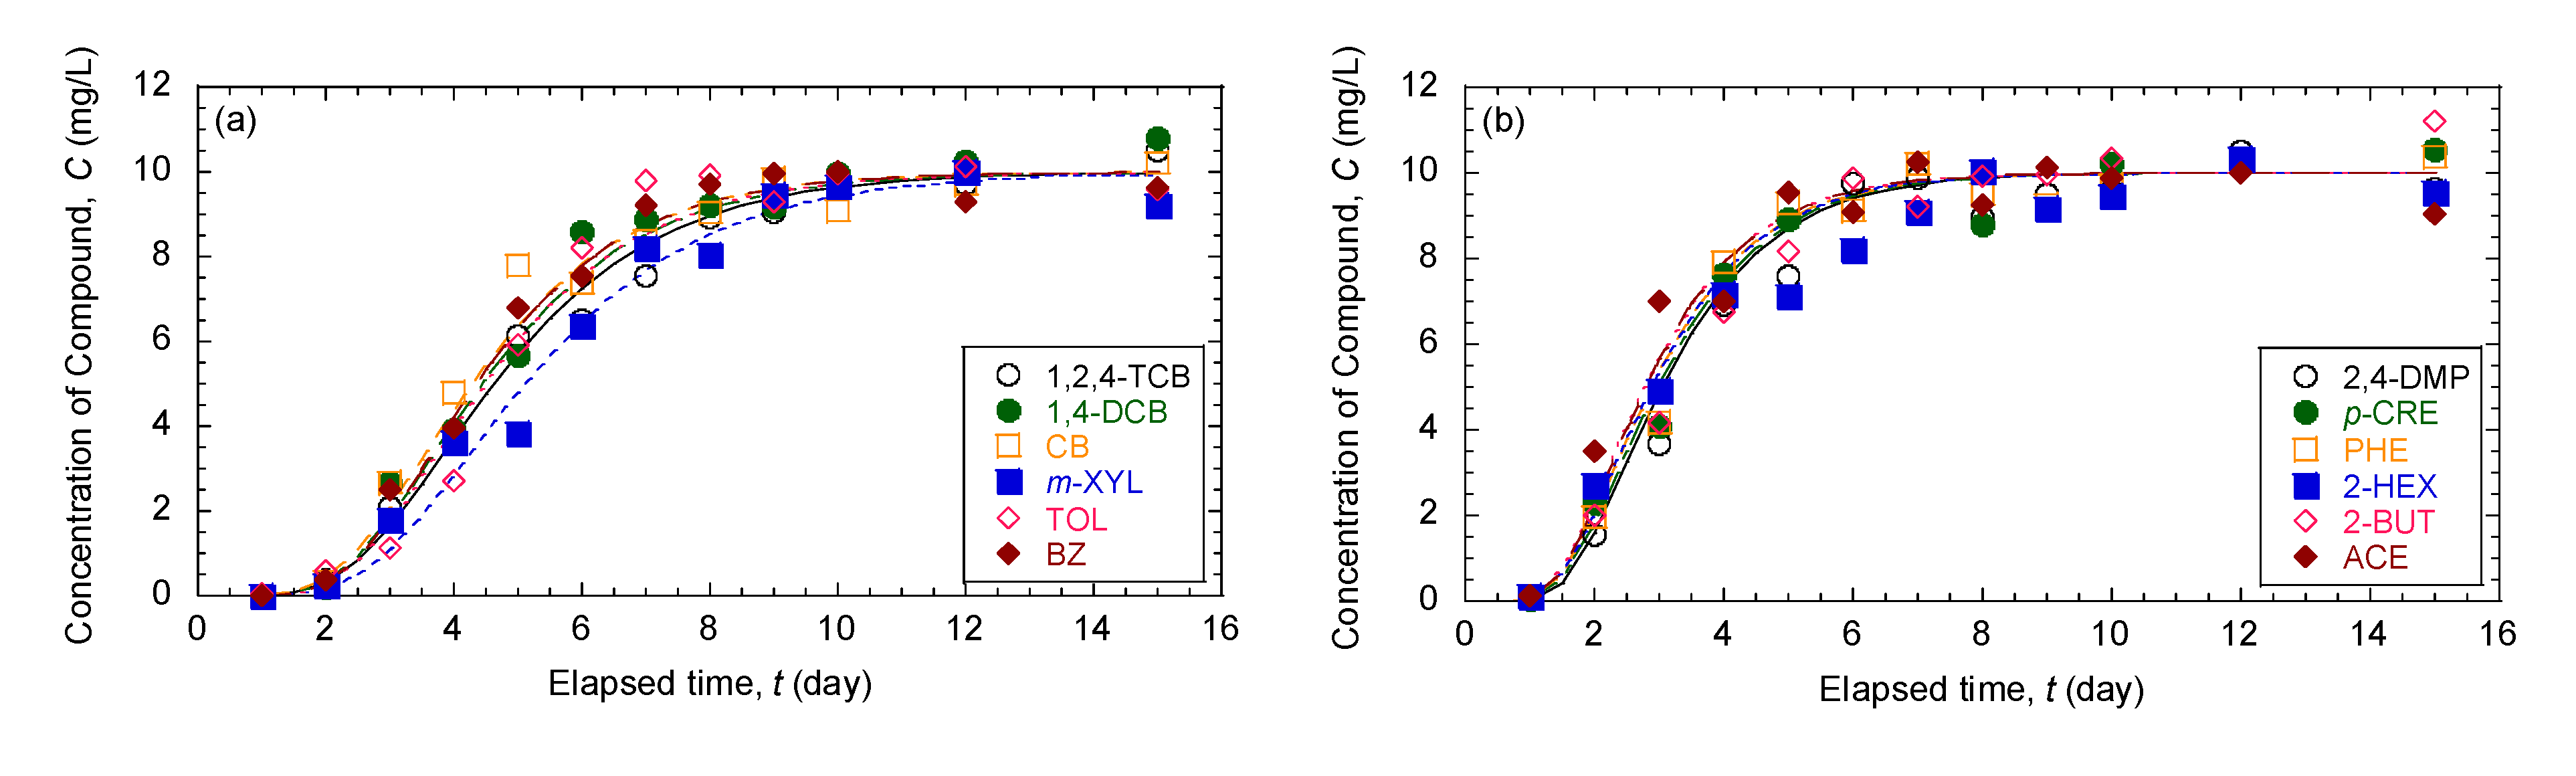
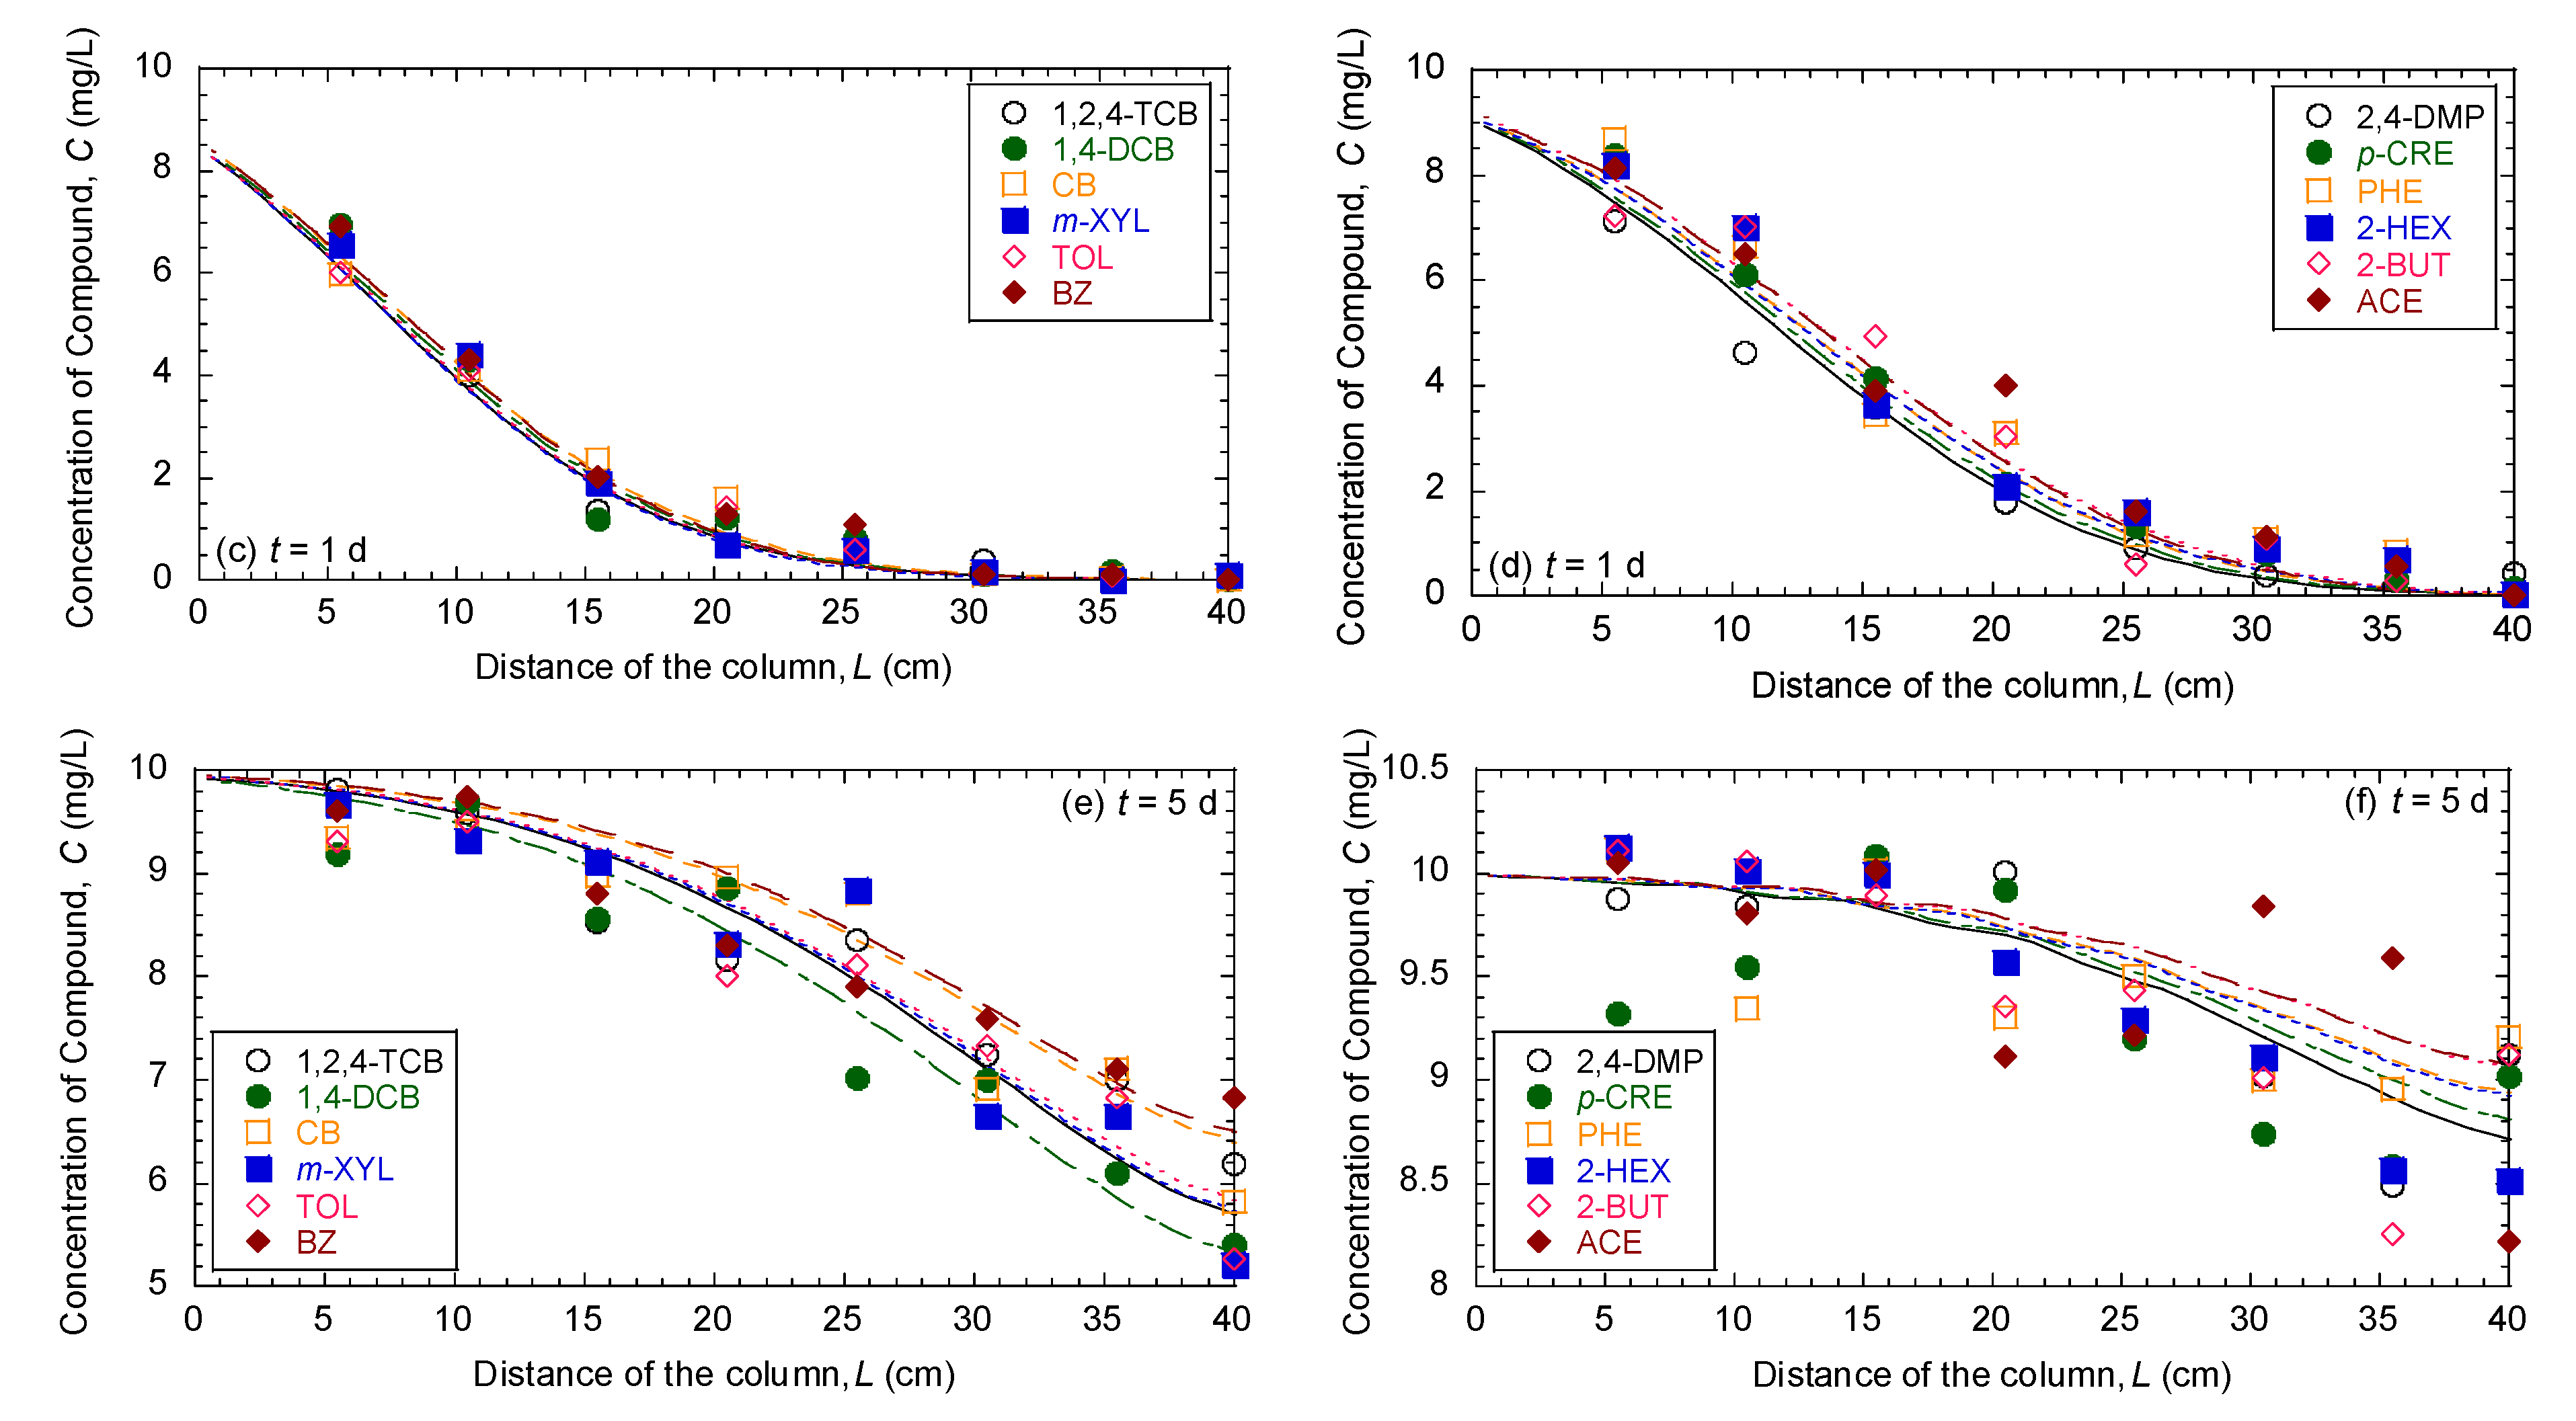
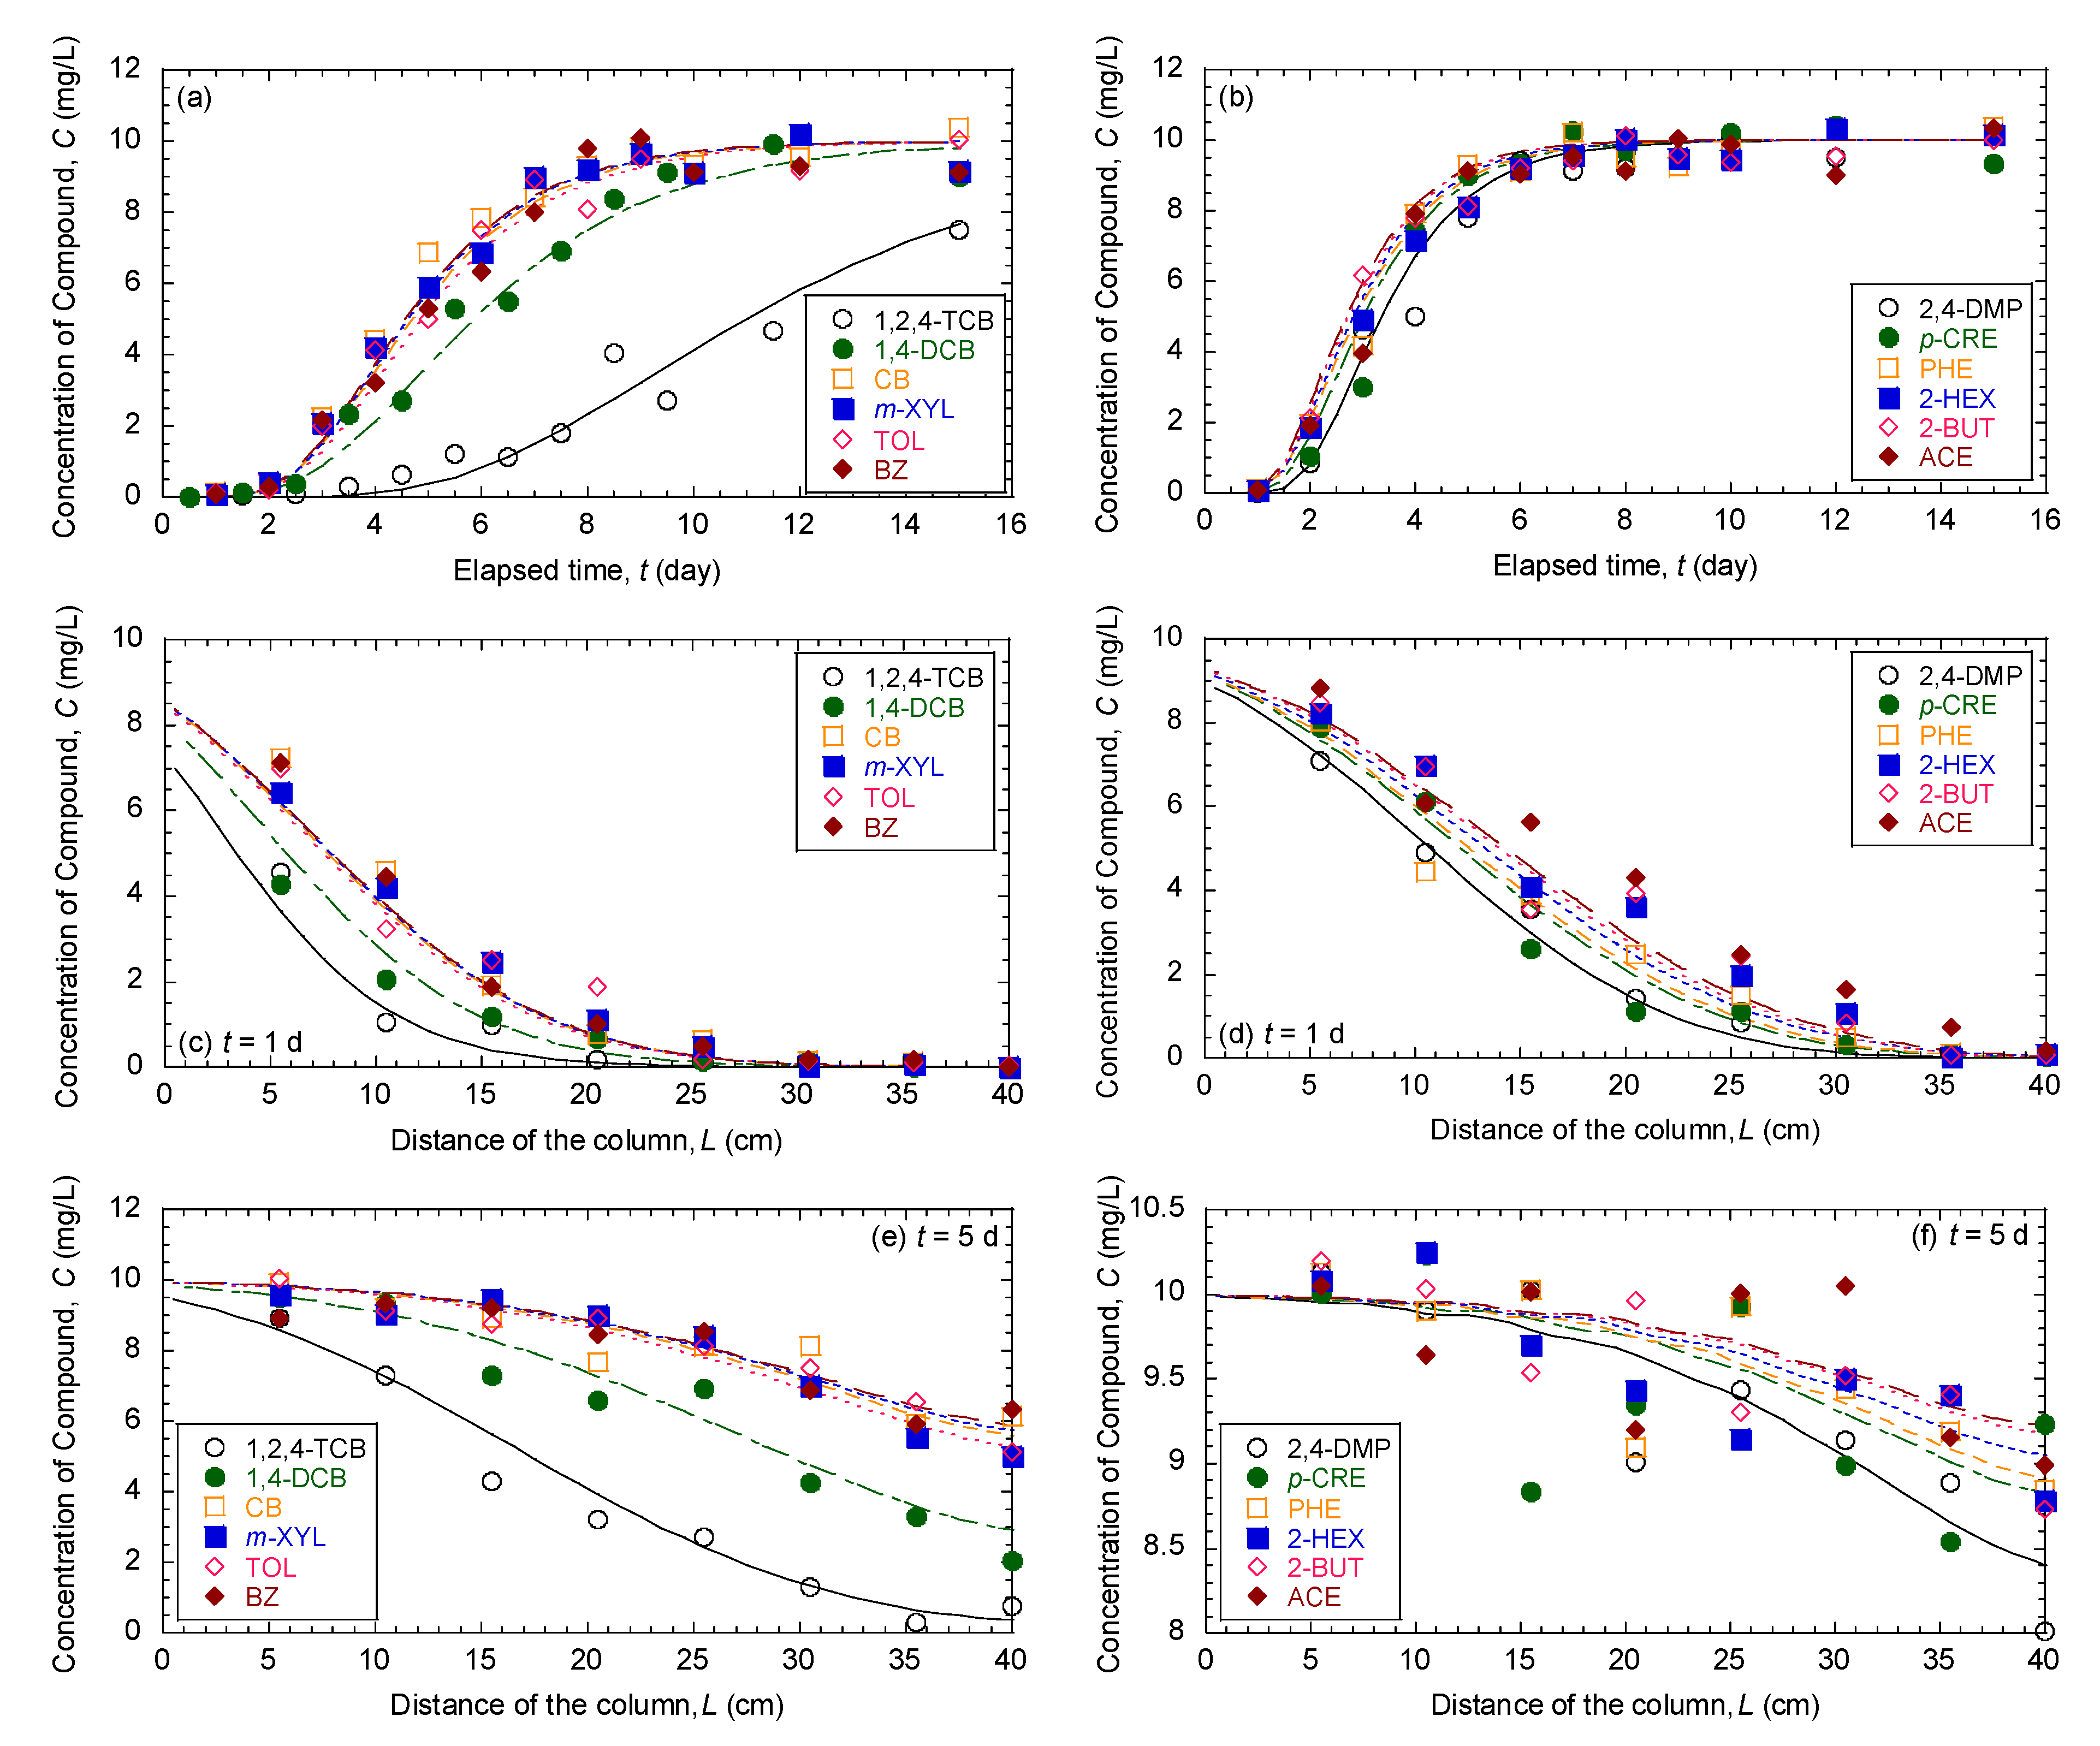
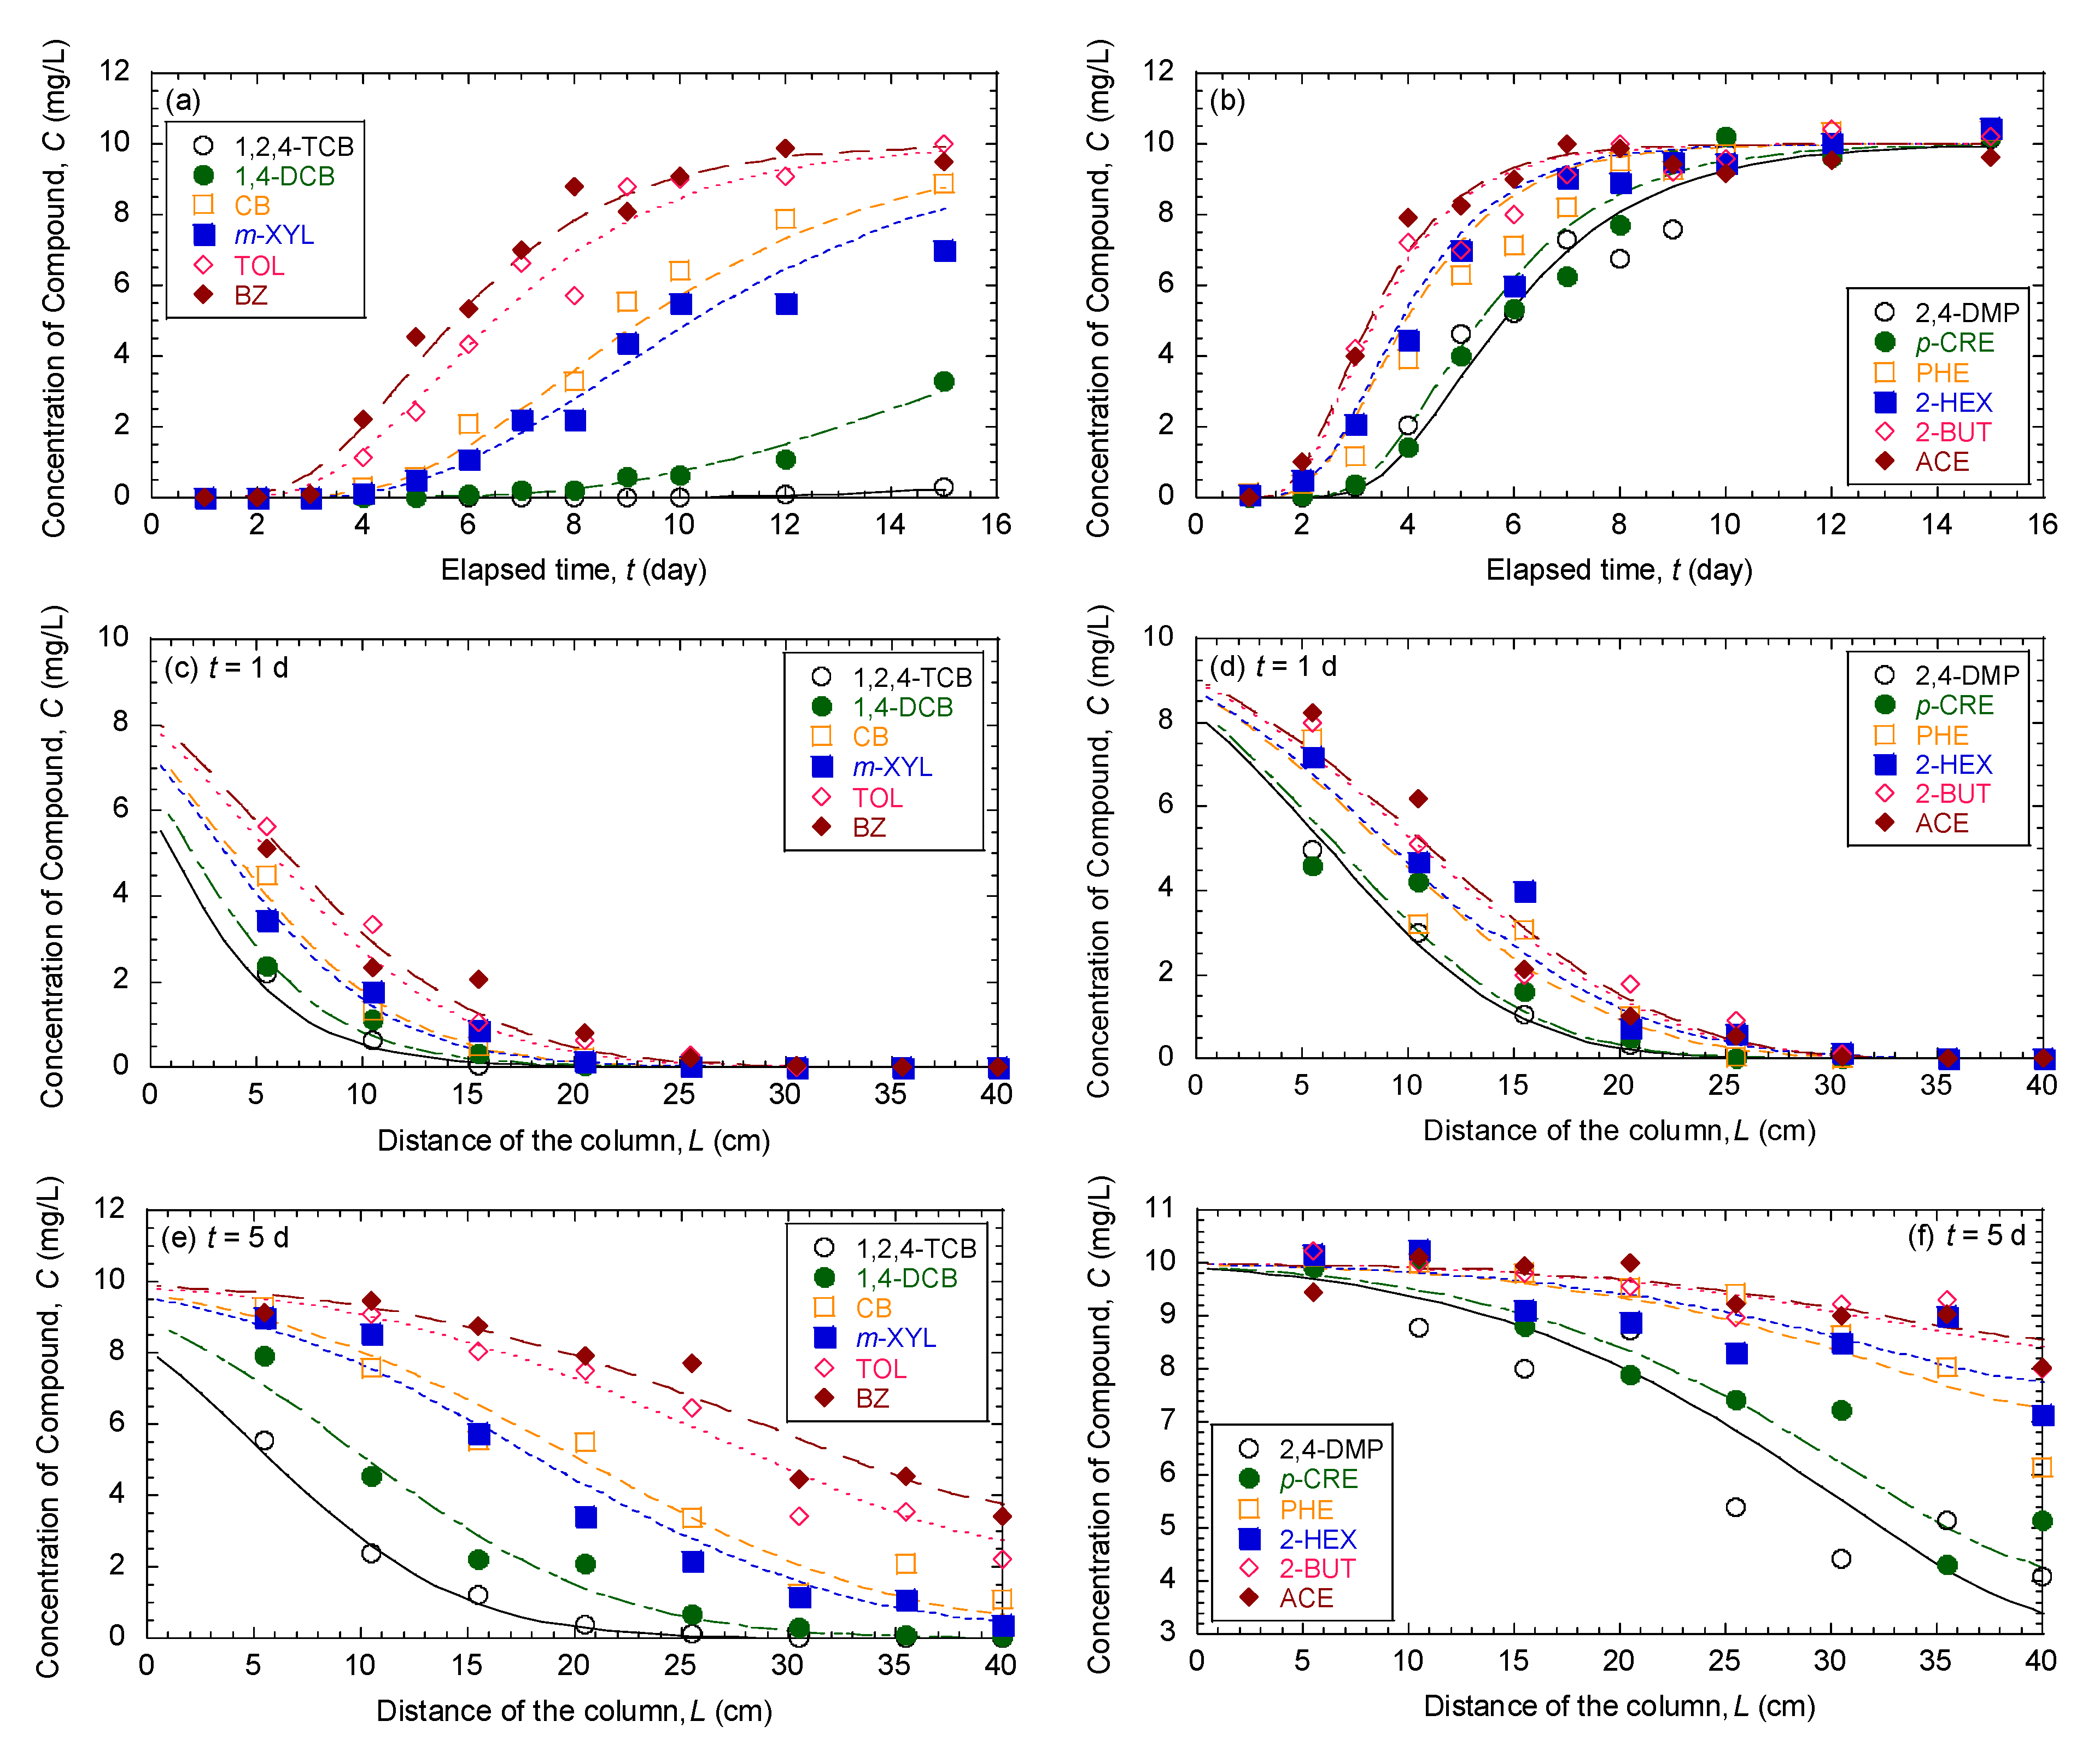
3.1. Comparison of Breakthrough Curves and Concentration Profiles of 12 Organic Compounds in Mixture

Comparisons between the measured versus fitted breakthrough curves (i.e., effluent samples) and predicted concentration profiles (i.e., pore-water samples at t = 1 and 5 days) according to the column tests are shown in Figure 2, Figure 3 and Figure 4 for simulated aquifer sands with foc of 0.006%, 0.051%, and 0.221%, respectively. On the basis of both breakthrough curves and concentration profiles displayed in Figure 2, Figure 3 and Figure 4, the organic compounds in mixtures were sorbed to different extents, and sorption to simulated aquifer sands generally decreased with the increase in polarity of organic compounds. The relatively slow migration of nonpolar organic compounds suggests that substantial amounts of molecules were transferred from the water matrix to the humic acid (HA) coated on the surface of simulated aquifer sands. In contrast, the sorption of the polar organic compounds did not expressively change with the increase in foc values. These results are consistent with the results from batch equilibrium sorption tests, indicating that sorption of organic compounds to simulated aquifer sands mainly results from sorption to HA when foc is greater than the threshold value (i.e., 0.1%), and more hydrophobic organic compounds were sorbed due to the different dependence of sorption on foc values of simulated aquifer sands [1,2,3]. Although the single column test for each simulated aquifer sand was performed without replicates, reasonably measured breakthrough curves and concentration profiles from both preliminary tracer tests and column tests were obtained in this study.
The Freundlich sorption parameters estimated from the model fitting to the effluent samples are also summarized in Table 2, Table 3 and Table 4 for simulated aquifer sands with foc of 0.006%, 0.051%, and 0.221%, respectively. Since all resulting RMSE values of organic compounds in mixtures in Table 2, Table 3 and Table 4 are less than half of the standard deviation of measured data (i.e., ≤0.797), the model fitting to measured effluent concentrations can be deemed to be appropriate [23]. However, the differences between the predicted and measured concentration of the effluents were soberly greater for 2-HEX, 2-BUT, and ACE according to the greater RMSE values. These differences can be attributed mainly to the relatively low amounts of sorption to simulated aquifer sands and low extraction efficiencies of polar organic compounds from the water matrix to methyl tert-butyl ether extractant. Considering that the resulting RMSE values for 2-HEX, 2-BUT, and ACE were still less than half of the standard deviation of measured data, both analytical methods and model fitting to the effluent concentrations of polar organic compounds were still appropriate. Although the model fitting to measured effluent concentrations can be deemed appropriate, the differences between the predicted and measured pore-water concentration profiles (especially at t = 5 days) inside the soil columns were greater for polar organic compounds, and these results are consistent with greater RMSE values between the predicted and measured concentration of the effluents for polar organic compounds.
Although the estimated Freundlich sorption parameters are supposed to be basically constant with space and time, the spatially variable reaction capacity and accessibility caused by combined hydraulic and chemical heterogeneities inside soil columns could occur for reactive transport of polar organic compounds. However, according to the concentration profiles, the organic compounds in mixtures were also proven to sorb to different extents, and the relatively fast migration of polar organic compounds was observed. Consequently, the organic compounds in mixtures were sorbed to different extents due to the different dependence of sorption on foc, and these results were confirmed from direct measurements of effluent samples and temporal and spatial pore-water concentration profiles through simulated aquifer sands in soil columns.

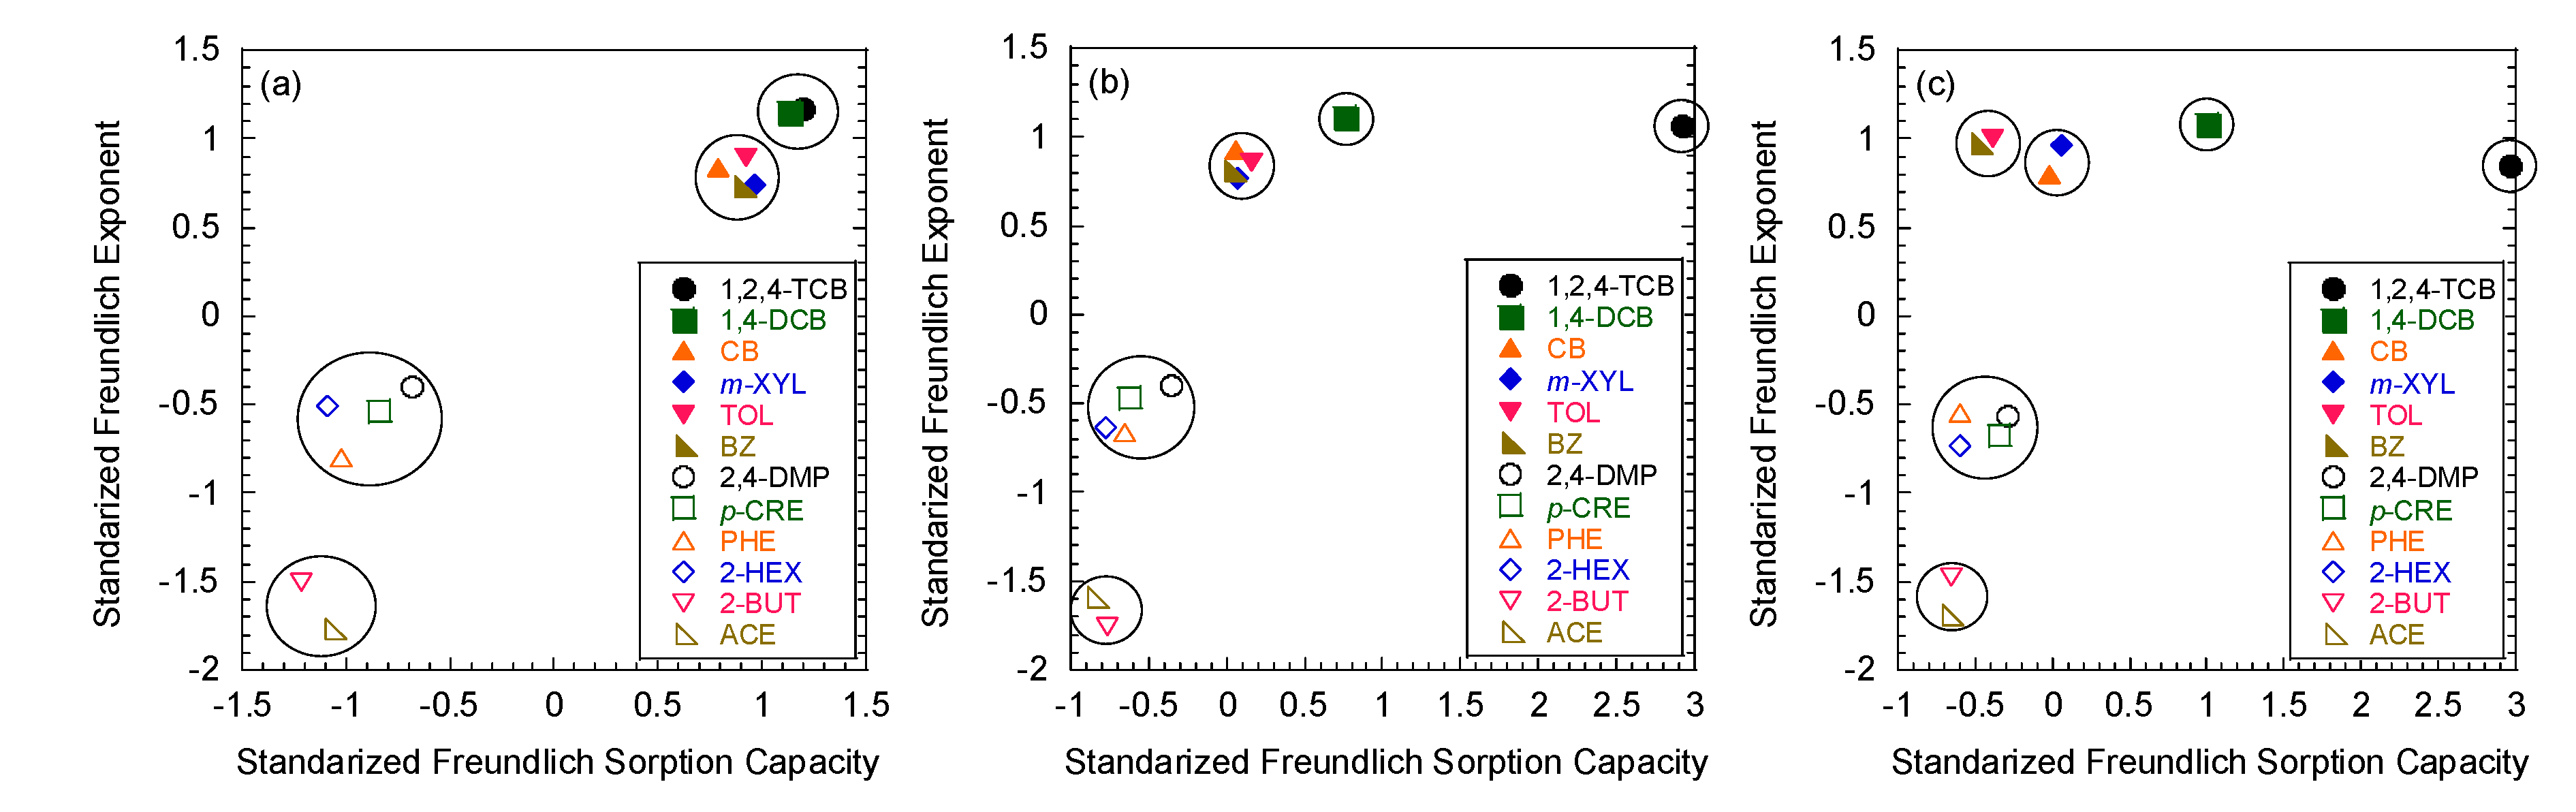
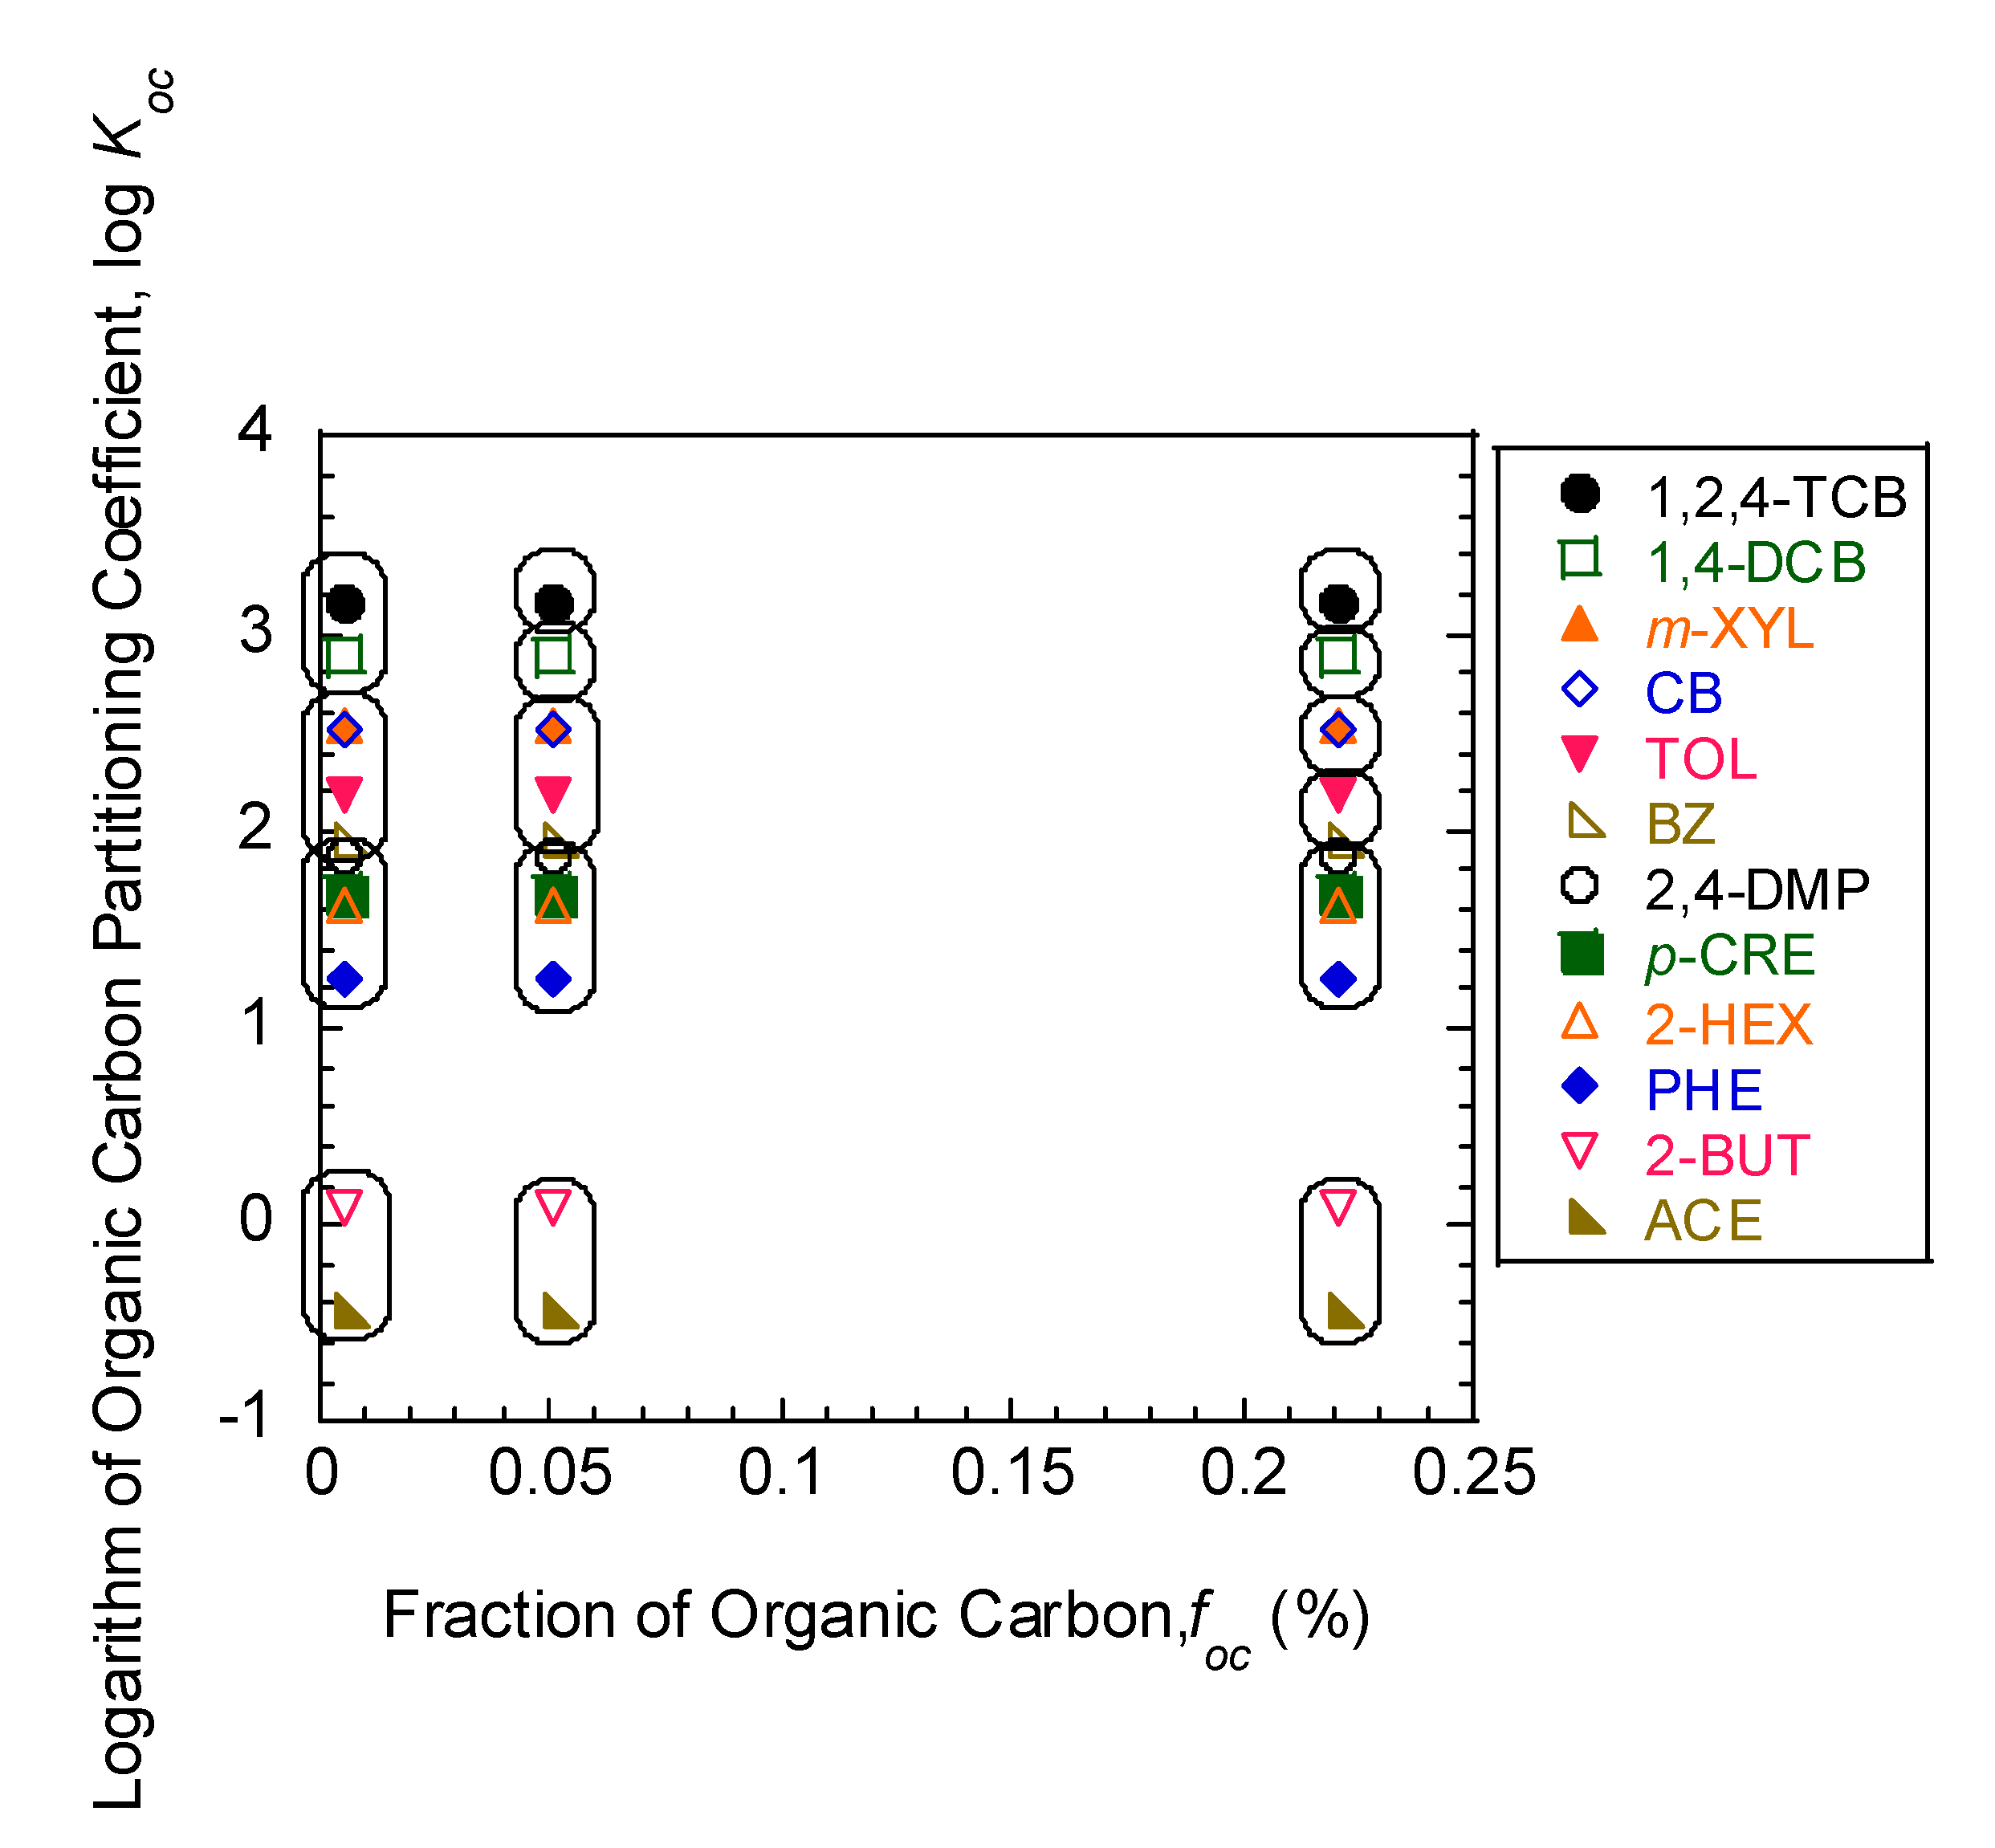
3.2. Comparison of Freundlich Sorption Parameters

As summarized in Table 2, Table 3 and Table 4 for simulated aquifer sands with foc of 0.006%, 0.051%, and 0.221%, respectively, the Freundlich sorption parameters (i.e., Kf and N) according to the effluent samples resulted in relatively various RMSE values. Consistent with previous results from batch equilibrium sorption tests with identical simulated aquifer sands [1,2,3], the sorption of nonpolar organic compounds to simulated aquifer sands is relatively linear (0.939 ≤ N ≤ 0.989), whereas the sorption of polar organic compounds to simulated aquifer sands is relatively nonlinear (0.650 ≤ N ≤ 0.808). Whereas the linear sorption of nonpolar compounds is attributed to the dominance of the amorphous fraction of HA or to the suppressed adsorption onto hydrophilic mineral surfaces by strongly chemisorbed water molecules, the nonlinear sorption of polar organic compounds is attributed to the specific interactions between the energetic sites of HA and polar organic compounds. Moreover, the nonlinearity is a complex function of the polarity of polar organic compounds and the nature of the hydrophilic specific interactions [1,2,3]. Furthermore, sorption of polar organic compounds became progressively nonlinear with increasing polarity of polar organic compounds, indicating that the sorption nonlinearity of polar organic compounds is a complex function of both the polarity and the H-bonding of polar organic compounds with HA and mineral surfaces.
Sorption capacity (Kf) for nonpolar organic compounds noticeably increased with increasing foc, indicating that mineral-bound HA significantly contributes to the sorption of nonpolar organic compounds. However, Kf values for polar organic compounds did not increase meaningfully with increasing foc, and such a nonlinear and low amount of sorption for polar organic compounds to simulated aquifer sands can be attributed to the site-specific hydrophilic specific interactions, such as H-bonding with the functional groups of HA and surface hydroxyls of mineral surfaces [1,2,3]. However, sorption capacity (Kf) for polar organic compounds still increased with increasing foc, indicating that mineral-bound HA also contributes to the sorption of polar organic compounds. Thus, the collective reactions between polar organic compounds and simulated aquifer sands cannot be ignored if the competitive adsorption of polar organic compounds to domains of HA is significant.

3.3. Hierarchical Cluster Analysis

Two-dimensional configuration and cluster analysis of the Freundlich sorption parameters (Kf and N) of 12 organic compounds in mixtures sorbed to simulated aquifer sands with foc of 0.006%, 0.051%, and 0.221% are displayed in Figure 5. From the cluster analysis using consensus between the two statistics (i.e., local peaks of the pseudo F combined with a small value of pseudo t2), 12 organic compounds in mixtures can be lumped into four, five, and six pseudocompounds, as proven in Figure 5a–c for simulated aquifer sands with foc of 0.006%, 0.051%, and 0.221%, respectively.
Consistent with the cluster analysis results from batch equilibrium sorption tests [1,3], a strong consensus between two statistics as to an suitable number of clusters indicated that four, five, or six pseudocompounds were suitable for reactive transport of 12 organic compounds in mixtures to simulated aquifer sands with foc of 0.006%, 0.051%, and 0.221%, respectively. Although higher numbers of pseudocompounds can describe the reactive transport behavior of 12 organic compounds in mixtures more accurately, fewer number of pseudocompounds was desired for simplicity. Considering the tradeoff between accuracy and simplicity, four, five, and six pseudocompounds were determined for simulated aquifer sands with foc of 0.006%, 0.051%, and 0.221%, respectively, to approximate the reactive transport behavior of 12 organic compounds in mixtures.
As the foc of simulated aquifer sands increased, the organic compounds with higher Koc (i.e., 1,2,4-TCB and 1,4-DCB) were split from nonpolar pseudocompounds due to the greater dependence of sorption on foc, whereas the organic compounds with lower Koc were not split significantly due to the lower dependence of sorption on foc. Moreover, each pseudocompound showed clearly different reactive transport behavior in terms of both sorption capacity and nonlinearity, indicating that each pseudocompound contained components with relatively similar sorption capacities and nonlinearity. None of polar organic compounds in mixtures were assigned with nonpolar organic compounds in the same pseudocompound, and polar organic compounds in mixtures were assigned in the same pseudocompound in terms of mixture compositions and foc of simulated aquifer sands. These results from column tests are similar to the previous study [1,3] reported from batch equilibrium sorption tests, and an identical number of pseudocompounds could approximate the reactive transport of 12 organic compounds in mixtures in column tests, signifying that the consistent lumping schemes for the reactive transport of organic compounds in mixtures to simulated aquifer sands is obtained regardless of flow conditions.

3.4. Development of A Priori Grouping Criteria from Column Tests

Although the reactive transport of organic compounds in mixtures to simulated aquifer sands can be promoted by the several mechanisms at different flow conditions, including both absorption (partitioning) and adsorption to HA domains and adsorption onto hydrophilic mineral surfaces, partitioning of organic compounds in mixtures to HA domains is an increasingly dominating contribution to overall sorption [1,2,3]. Additionally, linear partitioning of organic compounds to HA domains, whereby the distribution coefficient (Kd) is equal to the product of the fraction of organic carbon (foc) and the organic carbon partitioning coefficient (Koc) (i.e., Kd = foc Koc), has been shown to be a major component of sorption for sorbents with foc > 0.1% [1,2,3].
Accordingly, components for pseudocompounds in terms of simulated aquifer sands with different foc values are plotted versus log Koc for the organic compounds in mixtures in Figure 6. As shown in Figure 6, the reactive transport behavior of 12 organic compounds in mixtures to simulated aquifer sands with different foc can be lumped on the basis of log Koc. As the foc of simulated aquifer sands increased, the organic compounds with higher Koc (i.e., 1,2,4-TCB and 1,4-DCB) were split from nonpolar pseudocompounds due to the greater dependence of sorption on foc. In contrast, the organic compounds with lower Koc were not split noticeably due to the lower dependence of sorption on foc. Similar to the results from sorption to simulated aquifer sands in batch equilibrium sorption tests [1], log Koc can be used as the possible a priori grouping criterion for reactive transport of organic compounds in mixtures to simulated aquifer sands with different foc although the relative contributions of different forces (i.e., absorption vs. adsorption to HA domains, and adsorption onto hydrophilic mineral surfaces) to the overall sorption may differ for different mixture compositions and foc values during reactive transport through the soil column.

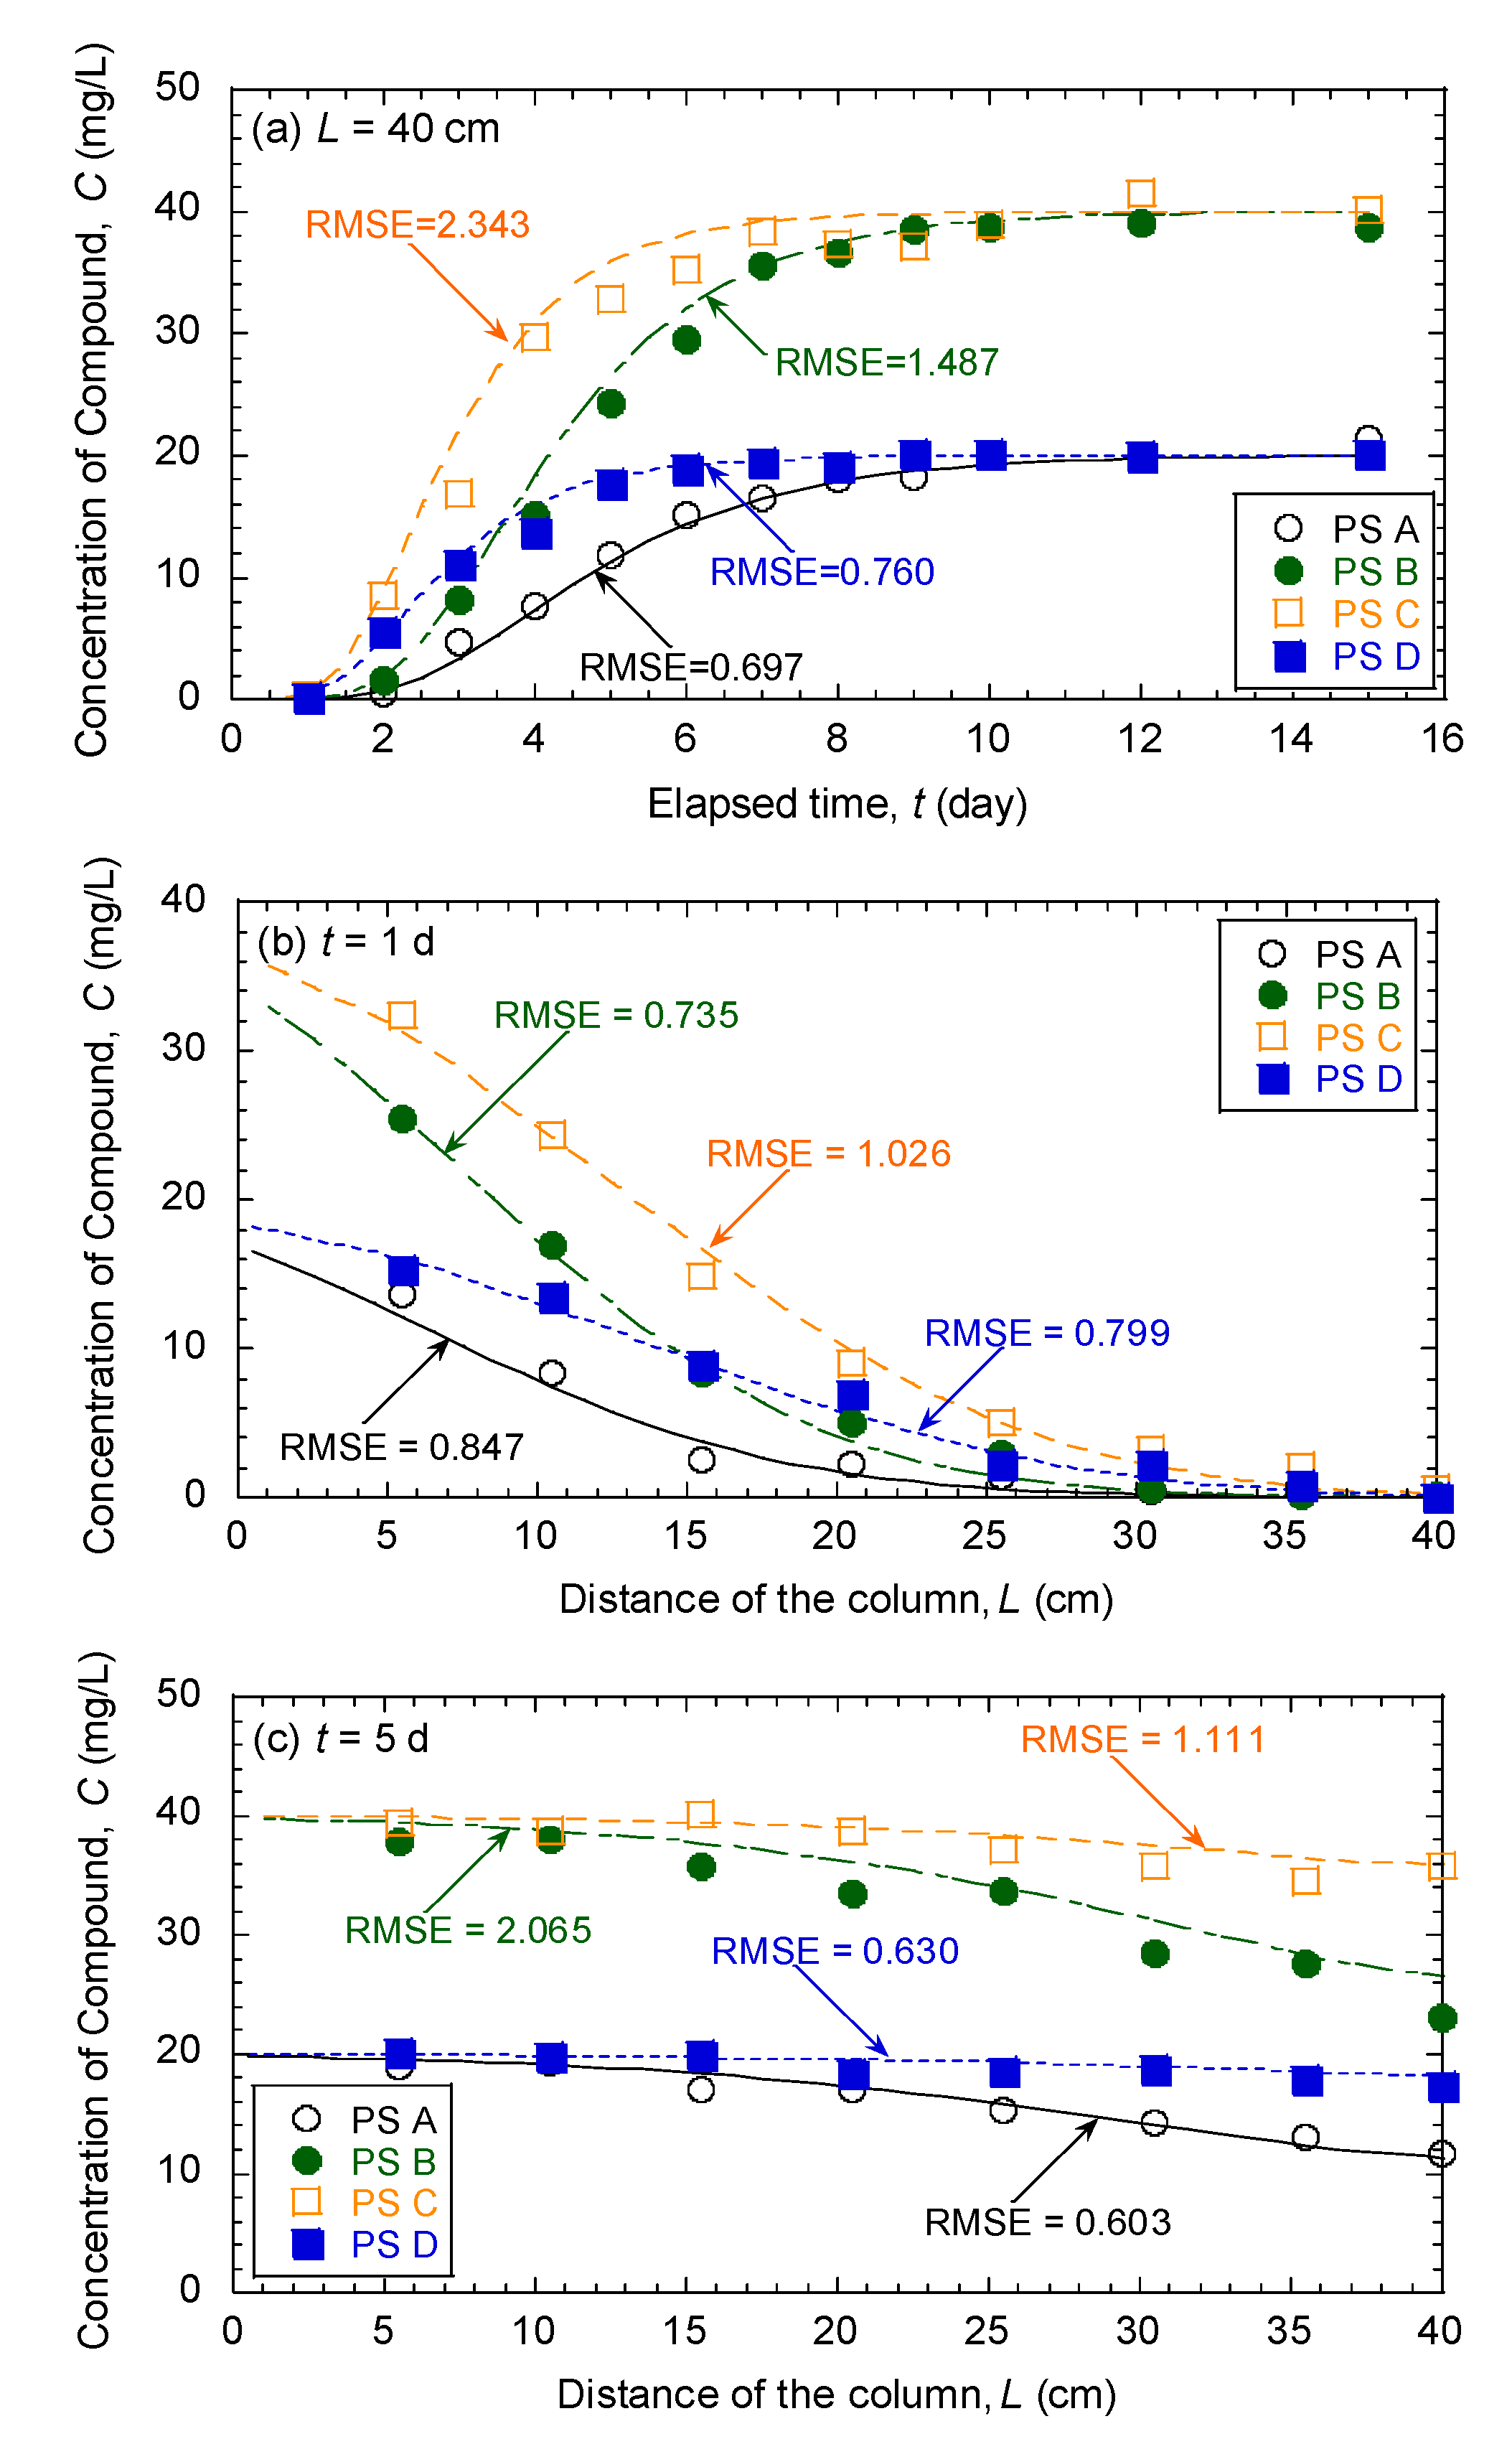
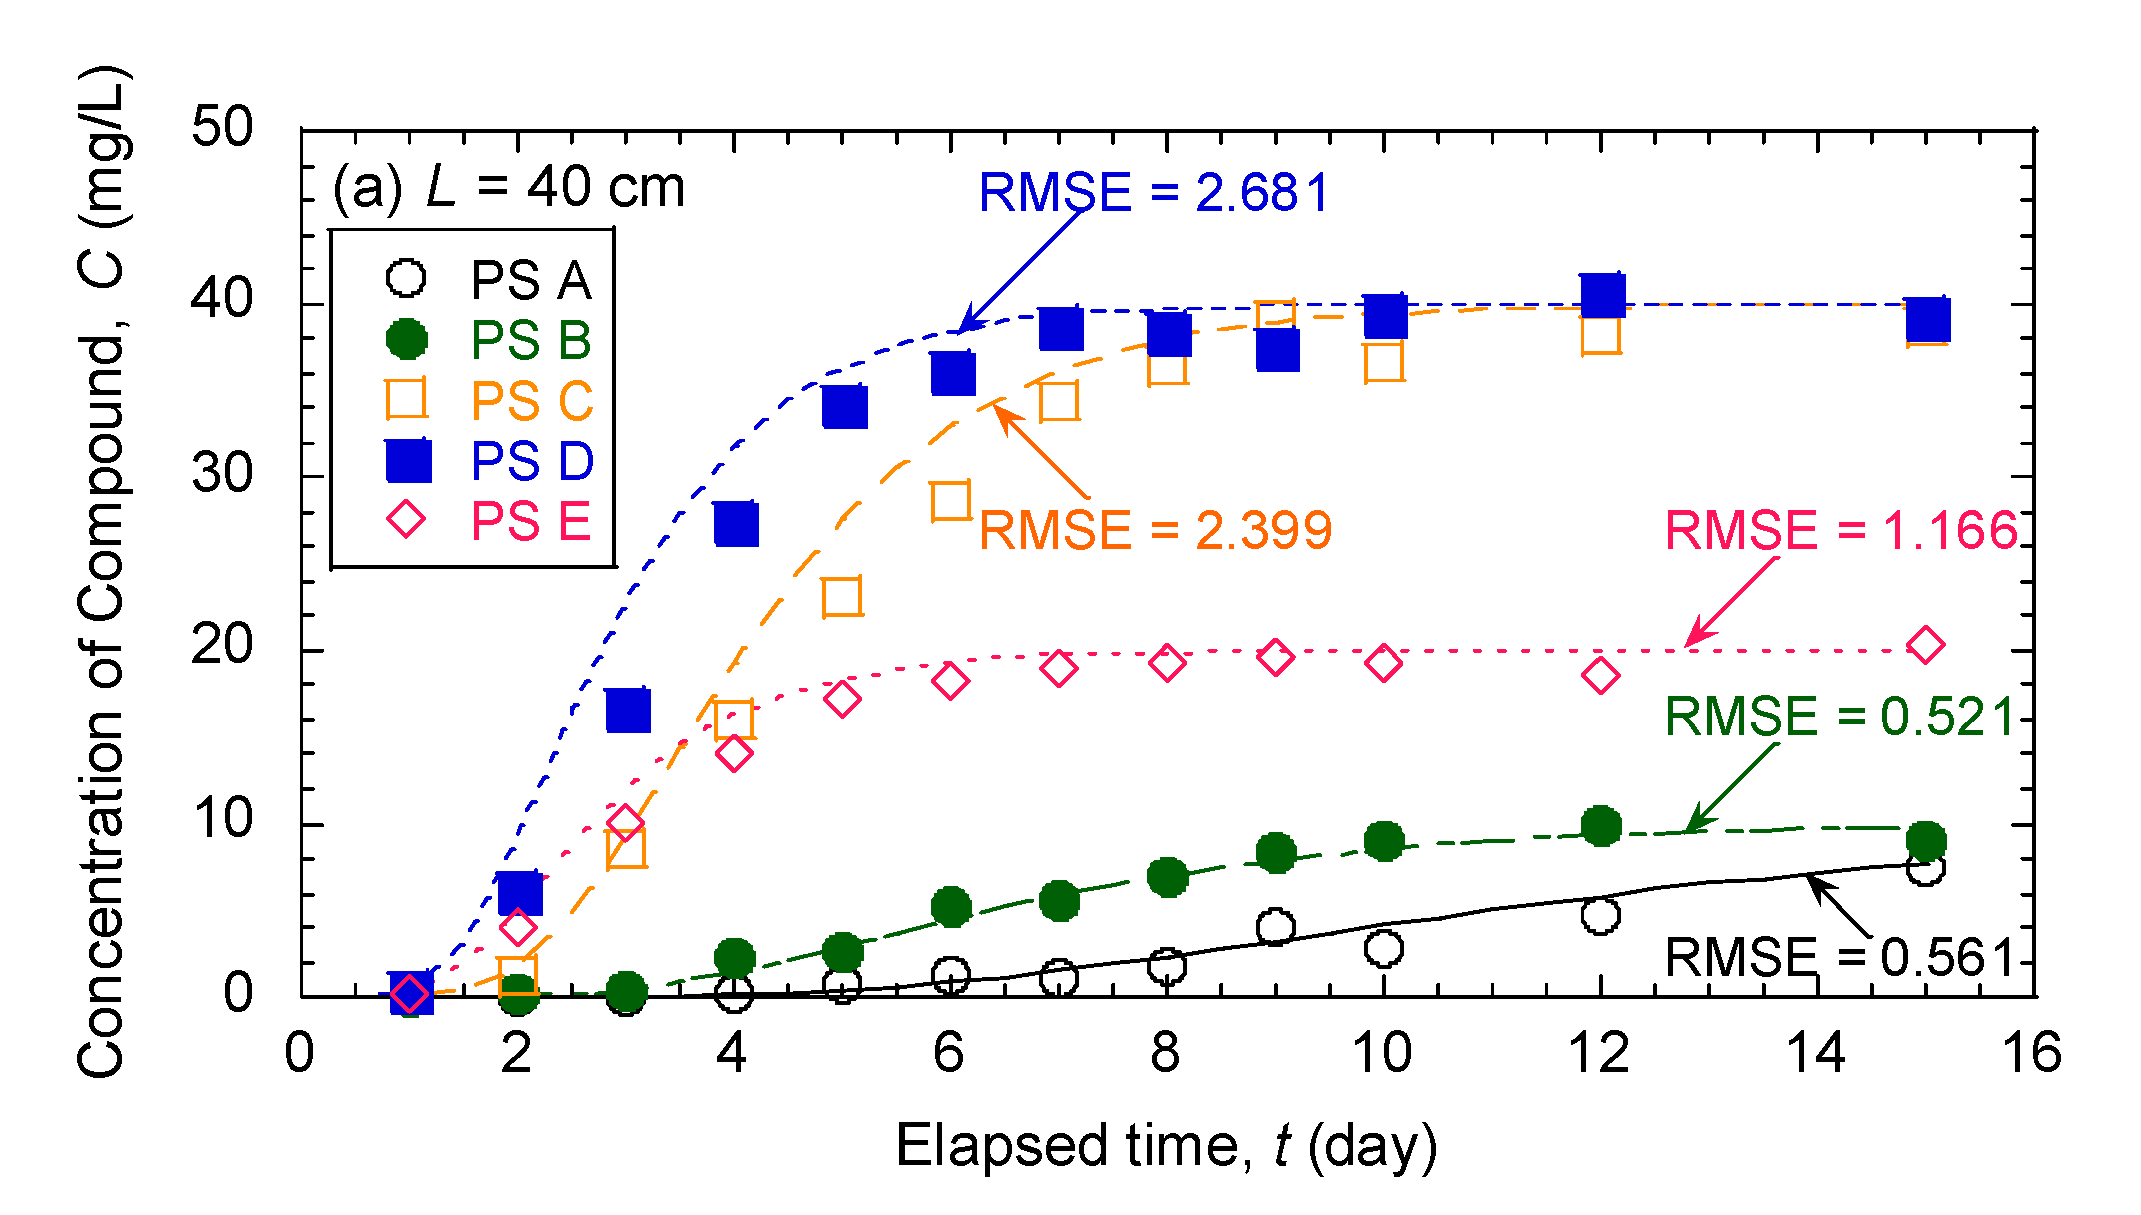
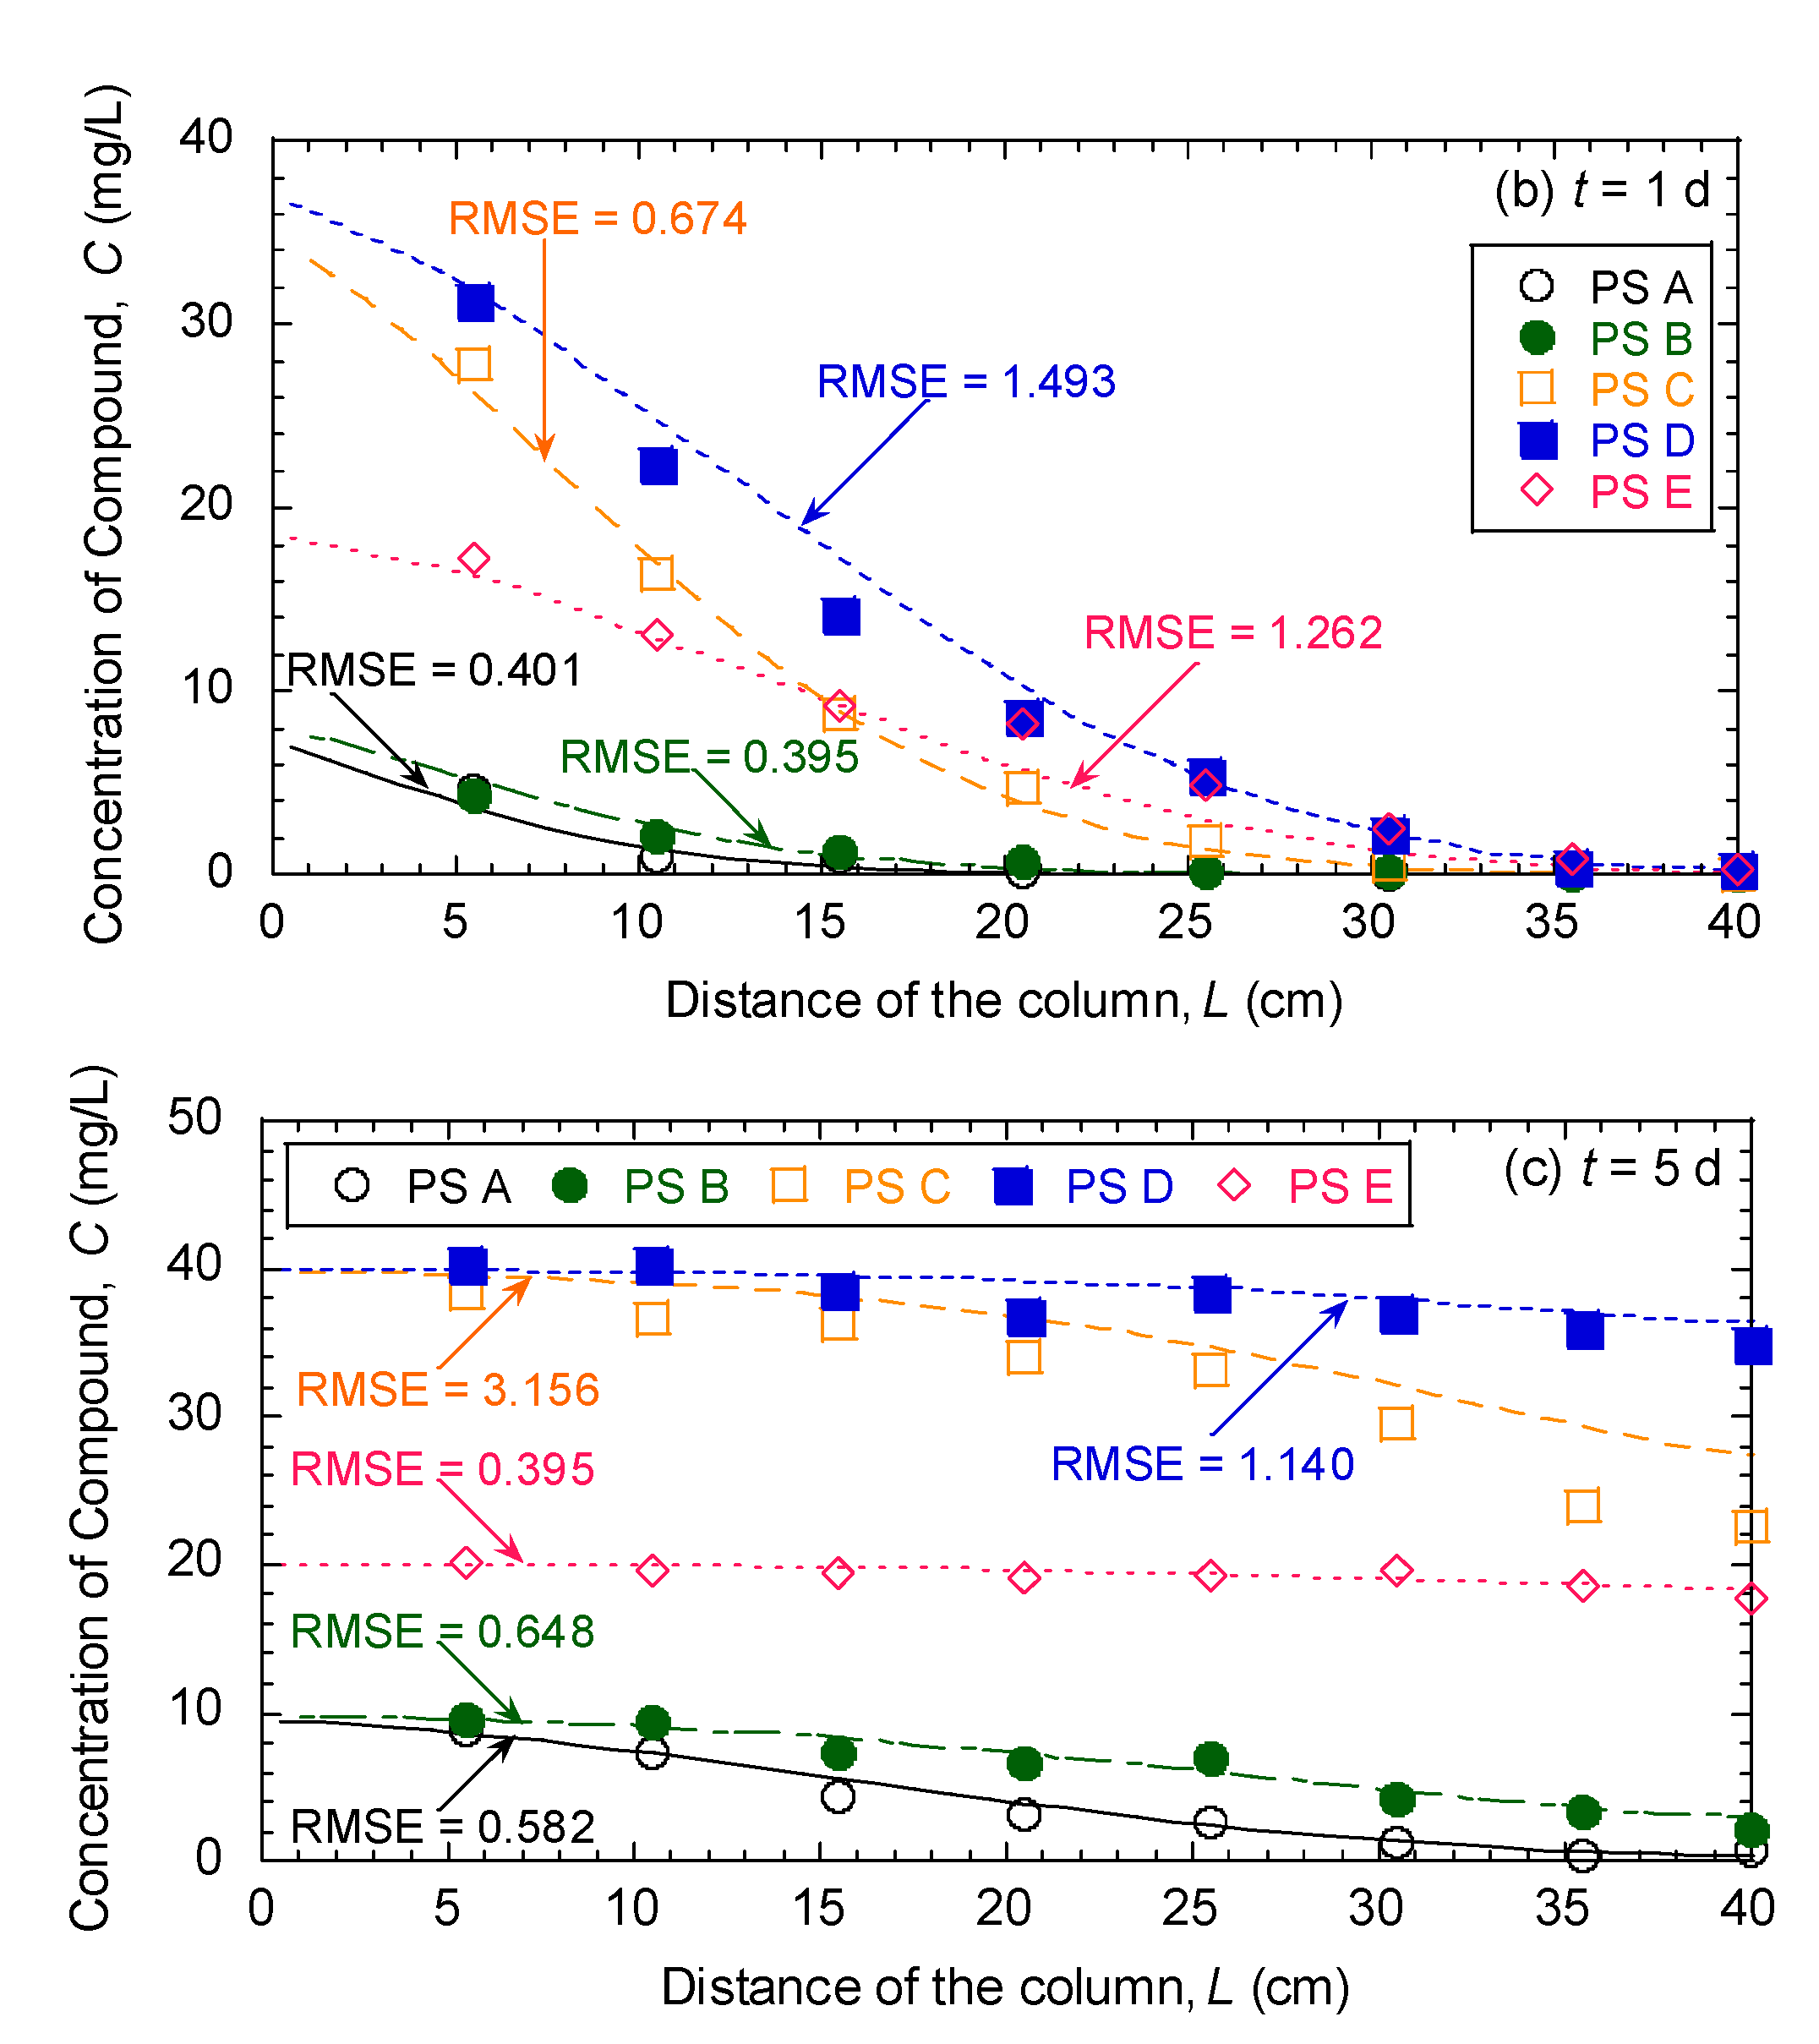
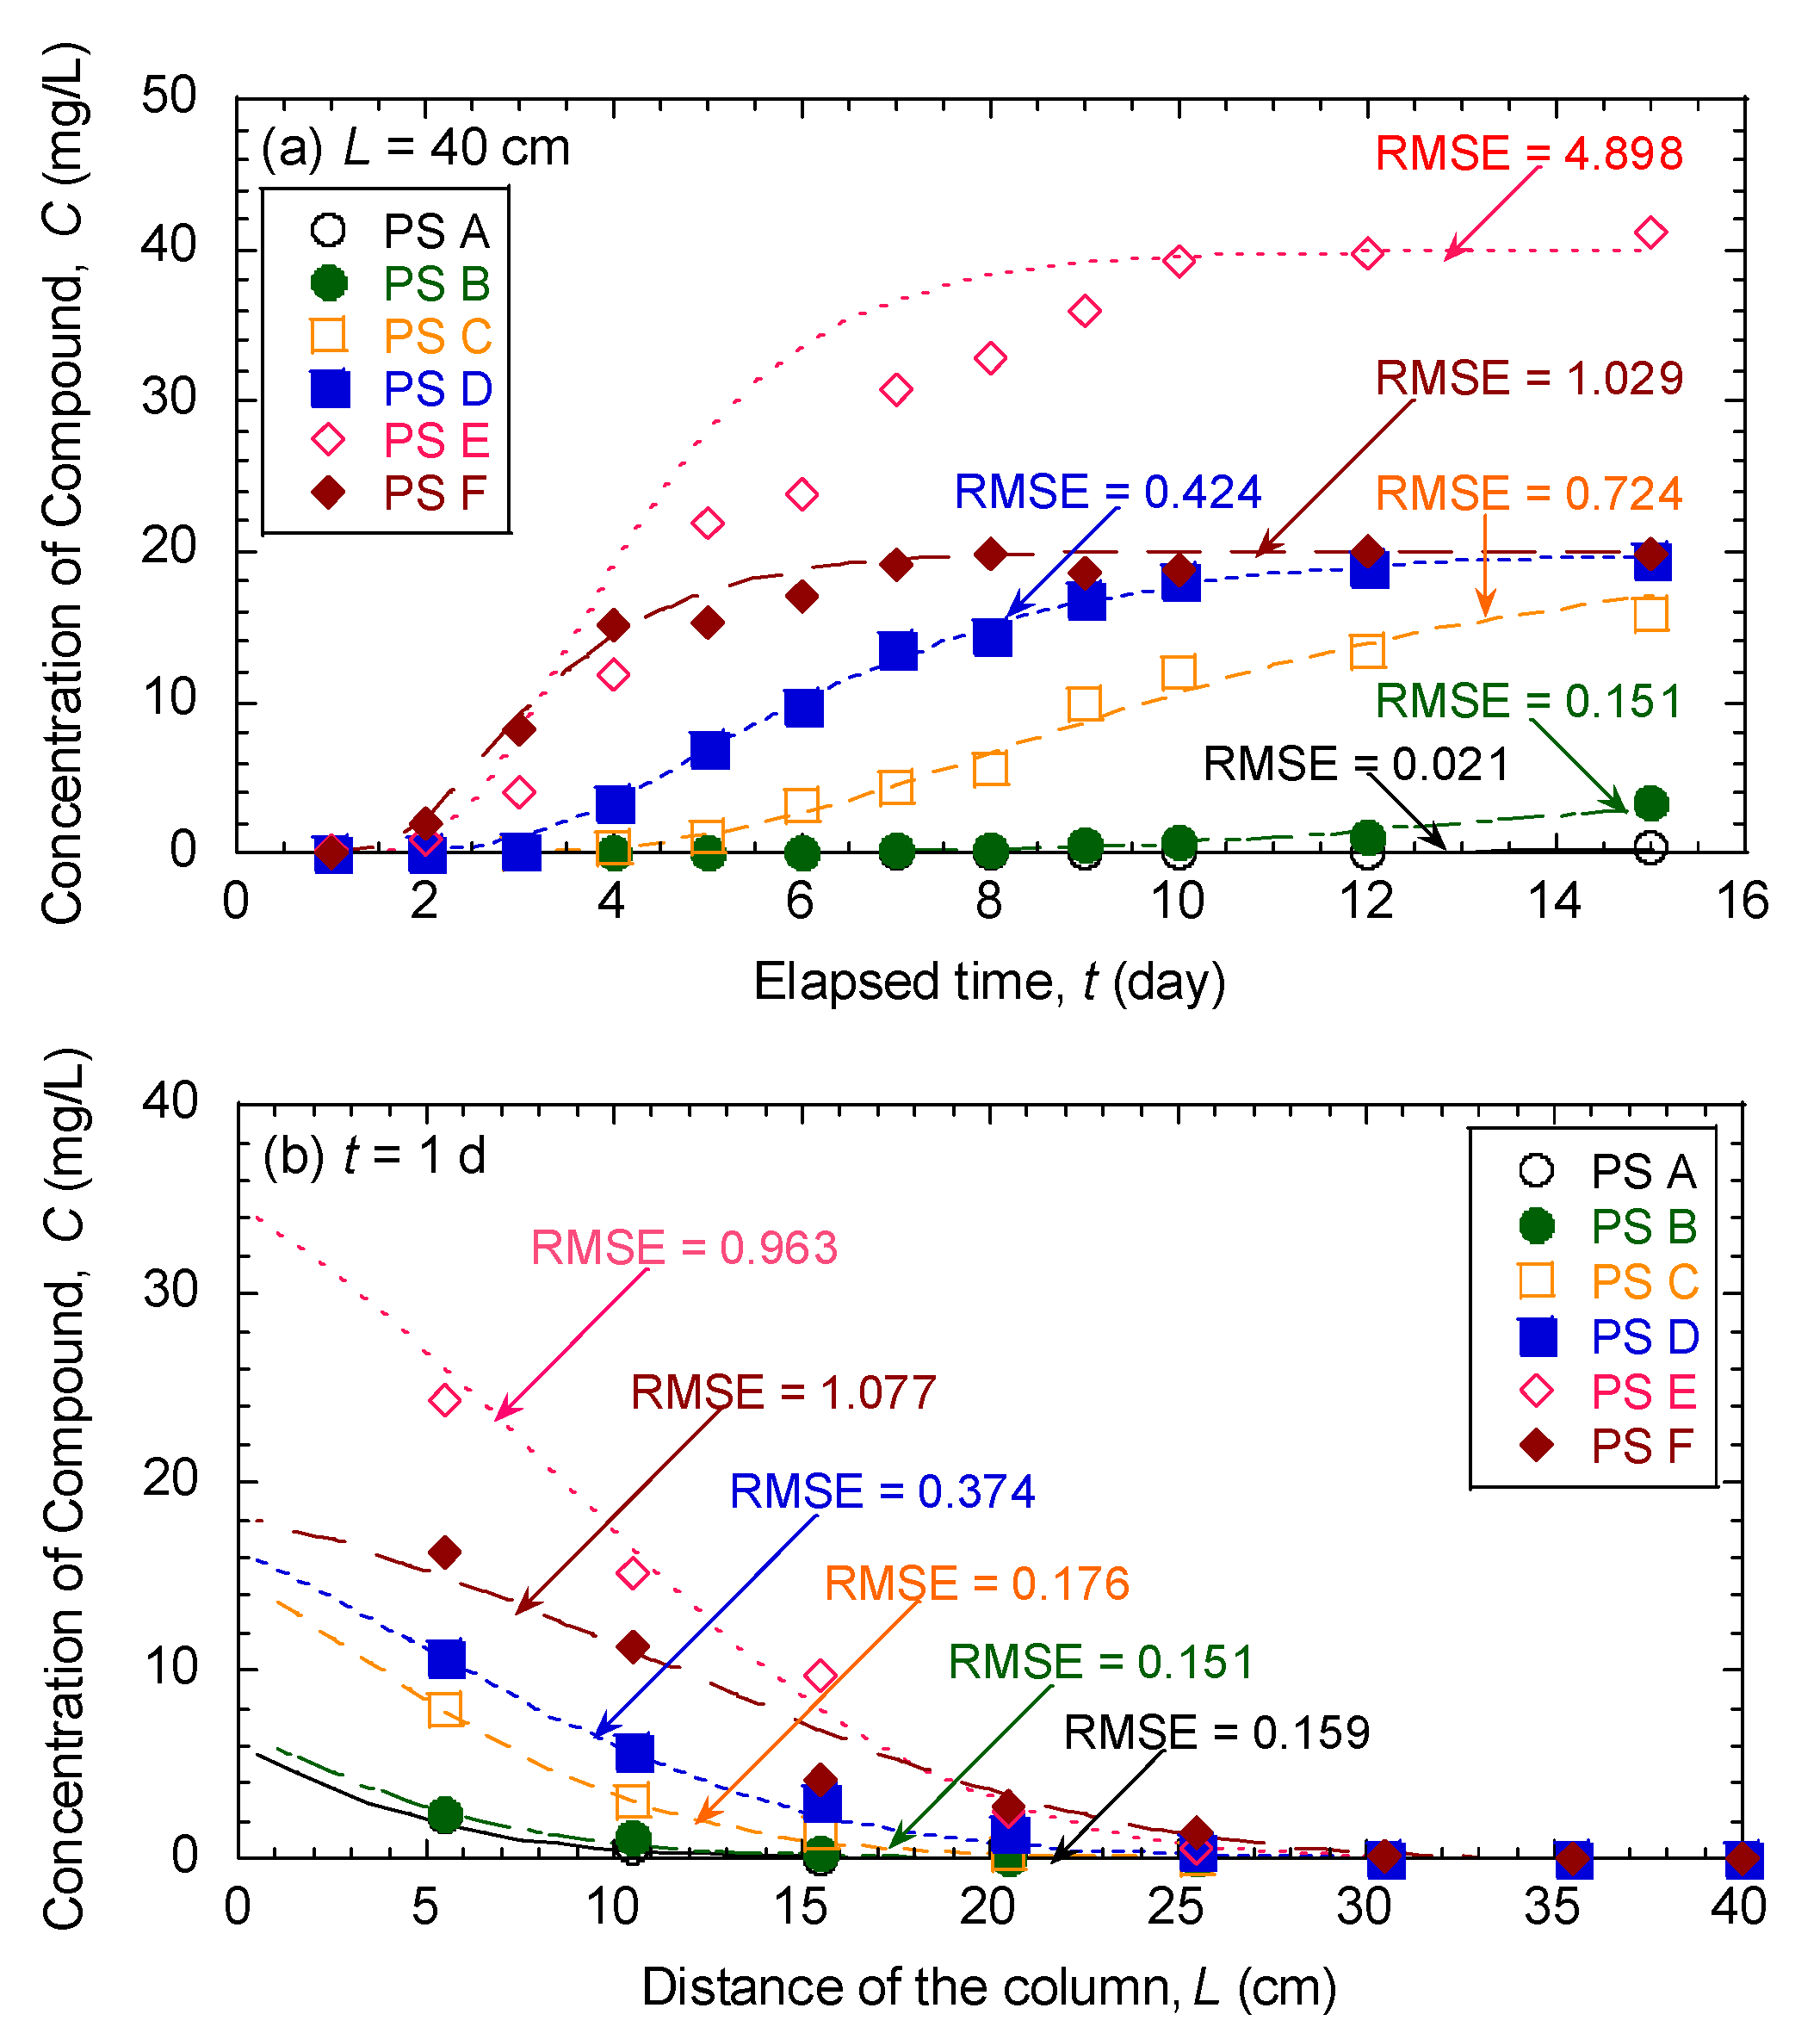
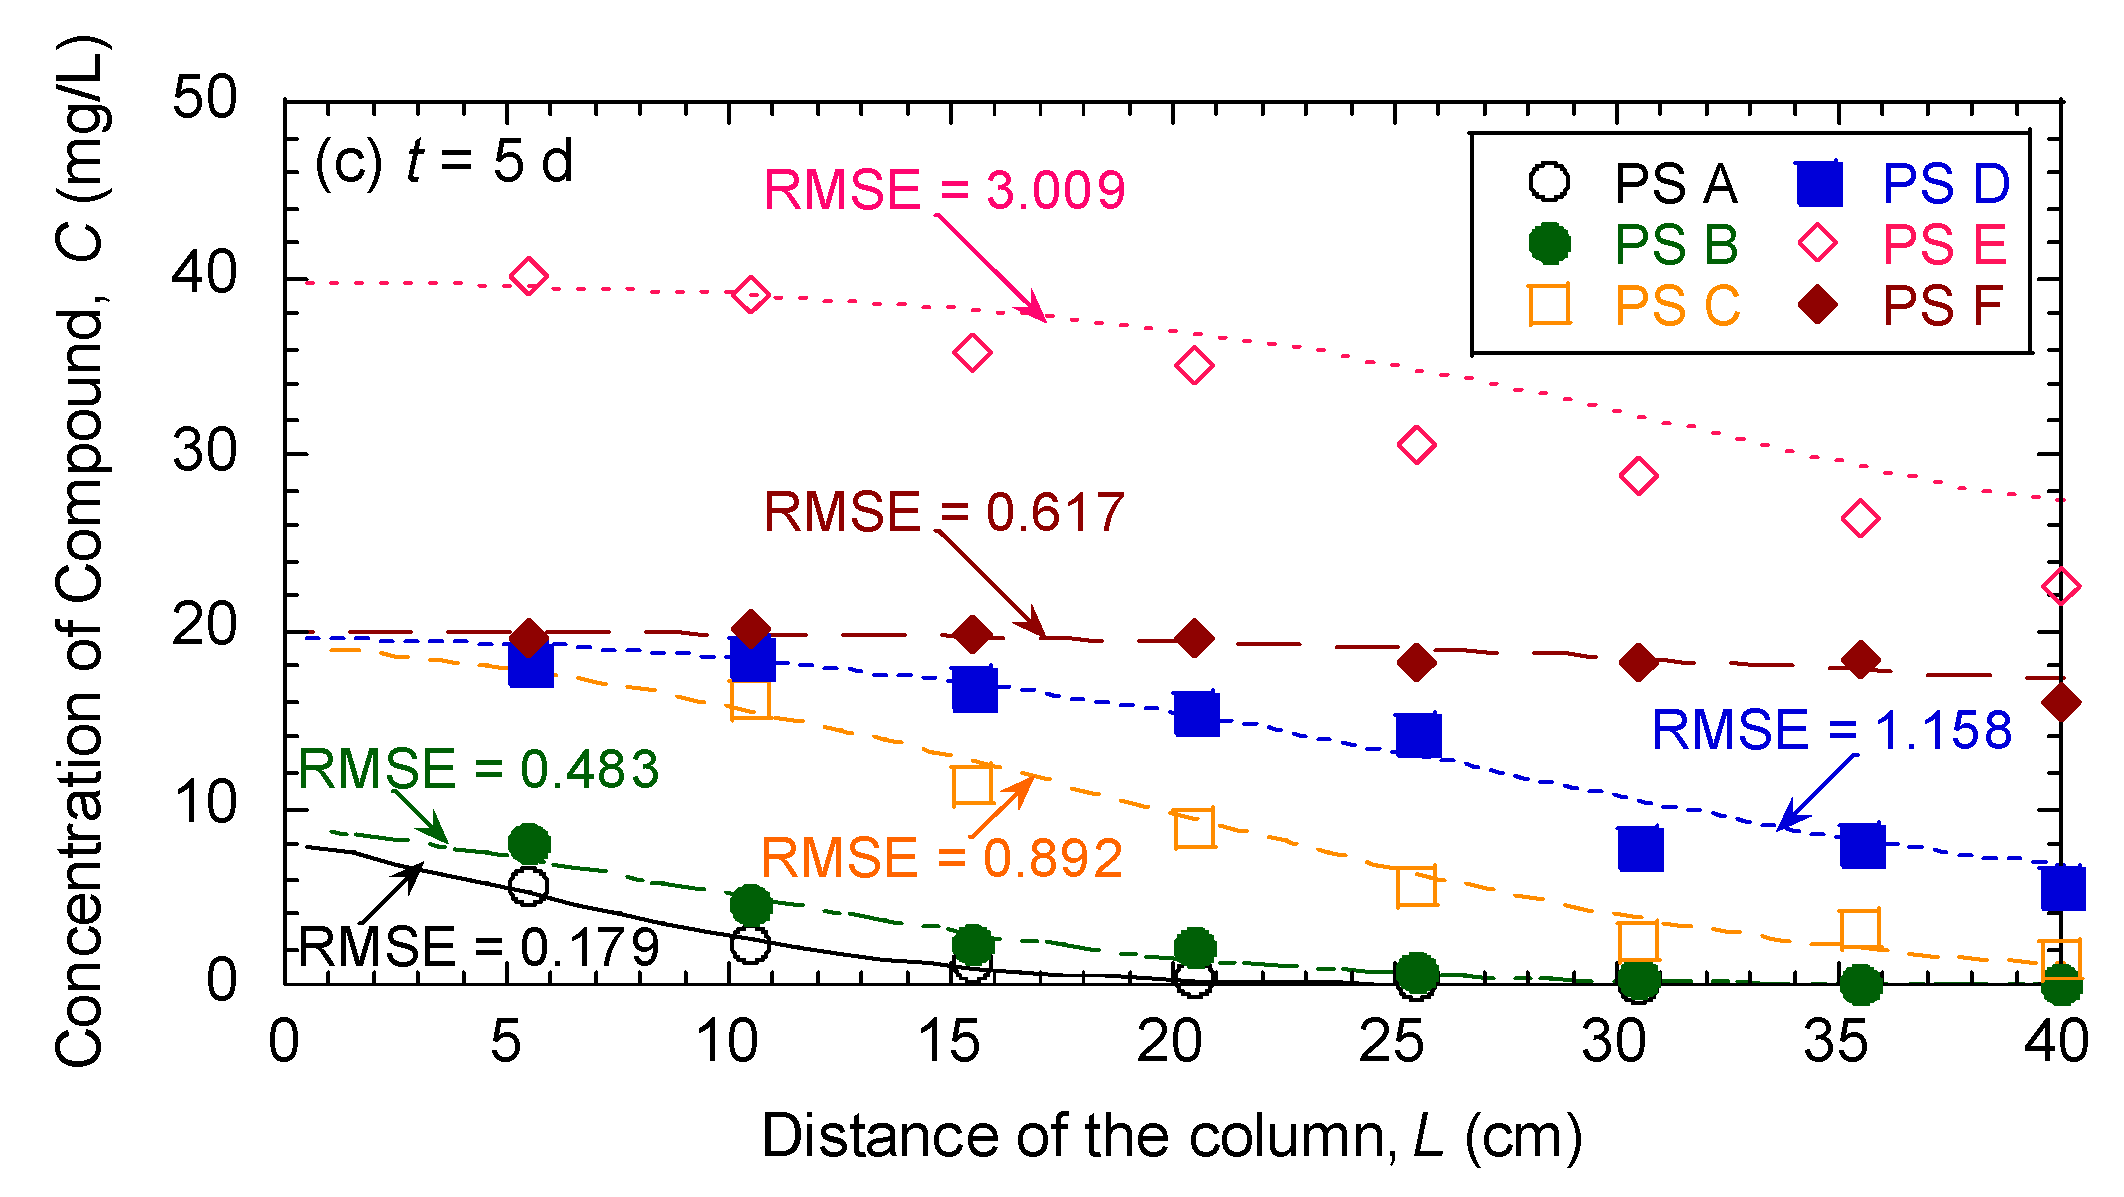
3.5. Evaluation of Effectiveness of Pseudocompounds to Simulated Aquifer Sands

After the lumping schemes were guided by cluster analysis, the aqueous- and solid-phase concentrations of each pseudocompound were calculated by summation of the aqueous- and solid-phase concentrations of components, respectively, at each elapsed time. Then, the agreement between the experimentally measured concentrations from the effluent samples and the predicted concentrations estimated from MODFLOW-RT3D was evaluated, as illustrated in Figure 7, Figure 8 and Figure 9 for simulated aquifer sands with foc of 0.006%, 0.051%, and 0.221%, respectively. As also summarized in Table 2, Table 3 and Table 4 for simulated aquifer sands with foc of 0.006%, 0.051%, and 0.221%, respectively, the predicted concentrations of pseudocompounds consisting of nonpolar organic compounds generally described the reactive transport behaviors of components better than those of pseudocompounds consisting of polar organic compounds.
The calculated concentrations of each pseudocompound were predicted reasonably well by the Freundlich sorption model over the concentration ranges tested. Furthermore, each pseudocompound showed substantially different reactive transport behavior in terms of both sorption capacity and nonlinearity. For example, pseudocompounds consisting of nonpolar organic compounds showed greater sorption capacity and more linearity (i.e., 0.944 ≤ N ≤ 0.992), whereas pseudocompounds consisting of polar organic compounds showed lower sorption capacity and more nonlinearity (i.e., 0.668 ≤ N ≤ 0.811). These results indicate that each pseudocompound contained components with relatively similar sorption capacities and nonlinearity during reactive transport through soil columns.
Consistent with the results from batch equilibrium sorption tests [1,2,3], the near-linear sorption of nonpolar pseudocompounds can be attributed to both absorptive partitioning into HA and the suppression of adsorption onto mineral surface by vicinal water region, and it is thermodynamically expected for partitioning into highly amorphous, gel-like HA, as well as for sorption to the energetically homogeneous vicinal water region on the hydrophilic mineral surfaces. For the HA used in this study, substantial condensed domains of HA likely do not exist according to the high oxygen/carbon ratio (≥0.641) for the HA and the low surface areas (≤2.14 m2/g) of simulated aquifer sands. Thus, molecules of nonpolar organic compounds mainly partition into loosely knit macromolecules of HA, relegating the role of adsorption onto HA as insignificant even at low concentration ranges (i.e., ≤10 mg/L). As a result, strong adsorption was not likely, such that linear sorption behavior of nonpolar pseudocompounds in mixtures to HA-coated sands with low foc was expected.
On the contrary, the nonlinear sorption of pseudocompounds consisting of polar organic compounds can be attributed to the energetic and site-specific hydrophilic specific interactions, such as H-bonding with the functional groups of HA and surface hydroxyls of mineral surfaces [1,2,3]. Thus, sorption of pseudocompounds consisting of polar organic compounds to simulated aquifer sands became gradually nonlinear with increasing polarity of organic compounds, suggesting that the sorption nonlinearity of pseudocompounds consisting of polar organic compounds is a complex function of both the polarity and the H-bonding ability of the polar organic compounds with HA and mineral surfaces. As expected, the sorption of both nonpolar and polar pseudocompounds to simulated aquifer sands increased with increasing with foc. Although both temporal and spatial variations between predicted and measured concentrations of pseudocompounds were not observed to be a function of both foc of simulated aquifer sands and polarity of pseudocompounds, more hydrophobic pseudocompounds were sorbed to a great extent than less hydrophobic pseudocompounds due to the different dependence of sorption on foc.

3.6. Estimation of Sorption Parameters for Pseudocompounds from Average Sorption Parameters for Components

The comparison of Freundlich sorption parameters was summarized in Table 2, Table 3 and Table 4 for simulated aquifer sands with foc of 0.006%, 0.051%, and 0.221%, respectively. Whereas nonlinearity (i.e., joint measure of the relative magnitude and diversity of energies) for pseudocompounds was estimated from averages Freundlich sorption parameters of individual components with less than 2.0% error, the Freundlich sorption capacity for pseudocompounds was estimated from average Freundlich sorption parameters of individual components with less than 10% error. In other words, the Freundlich sorption capacity of pseudocompounds was not perfectly represented by using averages of Freundlich sorption capacity of components, whereas the nonlinearity of pseudocompounds was reasonably represented by using averages of nonlinearity of components. As a result, the assignment of the Freundlich sorption parameters of pseudocompounds using averages of Freundlich sorption parameters of components led to reasonable accuracy of prediction for reactive transport of organic compounds in mixtures through the soil columns. Further study is warranted to evaluate both feasibility and accuracy of the lumped approach as a potentially more generally accessible and flexible tool for quantification of extensive multicomponent reaction systems within randomly heterogeneous subsurface systems.

4. Conclusions

The lumped approach was evaluated for use in determining temporal and spatial effluents and concentration profiles of organic compounds in the saturated groundwater aquifer through columns packed with simulated aquifer sands with different fractions of organic carbon (foc). Then, the reactive transport of aqueous miscible organic compounds was simulated numerically using the finite-difference groundwater flow model, MODFLOW, and the associated reactive transport code, RT3D coupling with the lumped approach. According to both breakthrough curves and concentration profiles, the organic compounds in mixtures were sorbed to different extents, and sorption to simulated aquifer sands generally decreased with the increase in polarity of organic compounds. Considering the tradeoff between accuracy and simplicity, four, five, and six pseudocompounds were determined for simulated aquifer sands with foc of 0.006%, 0.051%, and 0.221%, respectively, to approximate the reactive transport of 12 organic compounds in mixtures. Each pseudocompound showed obviously different sorption behavior in terms of both sorption capacity and nonlinearity, indicating that each pseudocompound contained components with relatively similar sorption capacities and nonlinearity. Similar to results from batch equilibrium sorption tests, an identical number of pseudocompounds can approximate the reactive transport of organic compounds in mixtures, and log Koc can be used as the possible a priori grouping criterion for the reactive transport of organic compounds in mixtures to simulated aquifer sands with different foc through the soil column, although the relative contributions of different forces (i.e., absorption vs. adsorption to HA domains, and adsorption onto hydrophilic mineral surfaces) to the overall sorption may differ for different mixture compositions and foc values. Finally, the Freundlich sorption capacity of pseudocompounds was not perfectly represented by using averages of Freundlich sorption capacity of components, whereas the nonlinearity of pseudocompounds was reasonably represented by using averages of nonlinearity of components. As a result, the assignment of the Freundlich sorption parameters of pseudocompounds using averages of Freundlich sorption parameters of components led to reasonable prediction for reactive transport of organic compounds in mixtures through the soil columns. Further study is warranted to evaluate the feasible coupling between lumped approach and reactive transport model for quantification of extensive multicomponent reaction systems within randomly heterogeneous subsurface systems.

Author Contributions

Methodology, data curation, investigation, and writing—original draft preparation, J.C.J.; validation, funding acquisition, and writing—review and editing, H.S.M.; writing—review and editing, S.W.C. All authors read and agreed to the published version of the manuscript.

Funding

This work was supported by the Korea Environment Industry and Technology Institute (KEITI) through the SEM (Subsurface Environment Management) project, funded by the Korea Ministry of Environment (MOE) (201800245004).

Conflicts of Interest

The authors declare no conflict of interest.

References

  1. Joo, J.C.; Shackelford, C.D.; Reardon, K.F. Lumping analysis for sorption of neutral organic compounds in mixtures to simulated aquifer sorbents. J. Environ. Engrg. 2011, 138, 552–561. [Google Scholar] [CrossRef]
  2. Joo, J.C.; Shackelford, C.D.; Reardon, K.F. Sorption of neutral organic compounds in mixtures to mineral surfaces and humic acid-mineral complexes. J. Hazard. Toxic Radioact. Waste 2012, 15, 188–198. [Google Scholar] [CrossRef] [Green Version]
  3. Joo, J.C.; Shackelford, C.D.; Reardon, K.F. Modeling sorption of neutral organic compound mixtures to simulated aquifer sorbents with pseudocompounds. J. Environ. Qual. 2013, 42, 852–860. [Google Scholar] [CrossRef] [PubMed] [Green Version]
  4. Essaid, H.; Bekins, B.A.; Cozzarelli, I.A. Organic contaminant transport and fate in the subsurface: Evolution of knowledge and understanding. Water Resour. Res. 2015, 51, 4861–4902. [Google Scholar] [CrossRef]
  5. Barbagli, A.; Jensen, B.N.; Raza, M.; Schueth, C.; Rossetto, R. Assessment of soil buffer capacity on nutrients and pharmaceuticals in nature-based solution applications. Environ. Sci. Pollut. Res. 2019, 26, 759–774. [Google Scholar] [CrossRef] [PubMed]
  6. Leharne, S. Transfer phenomena and interactions of non-aqueous phase liquids in soil and groundwater. ChemTexts 2019, 5, 5–25. [Google Scholar] [CrossRef] [Green Version]
  7. Ossai, I.C.; Ahmed, A.; Hassan, A.; Hamid, F.S. Remediation of soil and water contaminated with petroleum hydrocarbon: A review. Environ. Technol. Innov. 2020, 17, 100526. [Google Scholar] [CrossRef]
  8. De Oliveira, L.P.; Hudebine, D.; Guillaume, D.; Verstraete, J.J. A review of kinetic modeling methodologies for complex processes. Oil Gas Sci. Technol. 2016, 71, 45–93. [Google Scholar] [CrossRef] [Green Version]
  9. Nguyen TT, H.; Teratani, S.; Tanaka, R.; Endo, A.; Hirao, M. Development of a structure-based lumping kinetic model for light gas oil hydrodesulfurization. Energy Fuels 2017, 31, 5673–5681. [Google Scholar] [CrossRef]
  10. Jaffe, S.B.; Freund, H.; Olmstead, W.N. Extension of structure-oriented lumping to vaccum residua. Ind. Eng. Chem. Res. 2005, 44, 9840–9852. [Google Scholar] [CrossRef]
  11. Yu, Y.S.; Bailey, G.W.; Xianchan, J. Heavy metals in the environment. J. Environ. Qual. 1996, 25, 552–561. [Google Scholar] [CrossRef]
  12. Li, L.; Crain, N.; Gloyna, E.F. Kinetic lumping applied to wastewater treatment. Water Environ. Res. 1996, 68, 841–854. [Google Scholar] [CrossRef]
  13. Martins, R.C.; Lopes RJ, G.; Quinta-Ferreira, R.M. Lumped kinetic models for single ozonation of phenolic effluents. Chem. Eng. J. 2010, 165, 678–685. [Google Scholar] [CrossRef]
  14. Bian, F.; Bowman, F.M. A lumped model for composition- and temperature-dependent partitioning of secondary organic aerosols. Atmos. Environ. 2005, 39, 1263–1274. [Google Scholar] [CrossRef]
  15. Dennison, J.E.; Andersen, M.E.; Clewell, H.J.; Yang RS, H. Development of a physiologically based pharmacokinetic model for volatile fractions of gasoline using chemical lumping analysis. Environ. Sci. Technol. 2004, 38, 5674–5681. [Google Scholar] [CrossRef] [PubMed]
  16. Desalegn, A.; Bopp, S.; Asturiol, D.; Lamon, L.; Worth, A.; Paini, A. Role of physiologically based kinetic modelling in addressing environmental chemical mixtures—A review. Comput. Toxicol. 2019, 10, 158–168. [Google Scholar] [CrossRef] [PubMed]
  17. Zhang, F.; Yeh, G.-T.; Parker, J.C.; Brooks, S.C.; Pace, M.N.; Kim, Y.-J.; Jardine, P.M.; Wastson, D.B. A reaction-based paradigm to model reactive chemical transport in groundwater with general kinetic and equilibrium reactions. J. Contam. Hydrol. 2007, 92, 10–32. [Google Scholar] [CrossRef] [PubMed]
  18. McDonald, M.G.; Harbaugh, A.W. A.W. A Modular Three-Dimensional Finite-Difference Ground-Water Flow Model. In Techniques of Water-Resources Investigations; U.S. Geological Survey Publications: Denver, CO, USA, 1988; Chapter A1; p. 586. [Google Scholar]
  19. Clement, T.P. RT3D-A Modular Computer Code for Simulating Reactive Multi-Species Transport in 3-Dimensional Groundwater Aquifers. Draft Report. PNNL-SA-28967; Pacific Northwest National Laboratory: Richland, WA, USA, 1997. [Google Scholar]
  20. Clement, T.P.; Sun, Y.; Hooker, B.S.; Petersen, J.N. Modeling multi-species reactive transport in groundwater aquifers. Groundw. Monit. Remediat. 2007, 18, 79–92. [Google Scholar] [CrossRef]
  21. Chai, T.; Draxler, R.R. Root mean square error (RMSE) or mean absolute error (MAE)?-Arguments against avoiding RMSE in the literature. Geosci. Model Dev. 2014, 7, 1247–1250. [Google Scholar] [CrossRef] [Green Version]
  22. Coxson, P.G.; Bischoff, K.B. Lumping strategy. 1. Introductory techniques and applications of cluster analysis. Ind. Eng. Chem. Res. 1987, 26, 1239–1248. [Google Scholar] [CrossRef]
  23. Singh, J.; Knapp, H.V.; Demissie, M. Hydrologic Modeling of the Iroquois River Watershed Using HSPF and SWAT; ISWS CR 2004-08; Illinois State Water Survey: Champaign, IL, USA, 2004. [Google Scholar]
Figure 1. Illustration of the flow simulation through the column evaluated in this study: pictorial view, conceptual and model grid, equipotential lines, and total head profiles.
Water 12 03103 g001
Figure 2. Comparison of the measured data versus fitted breakthrough curves and predicted concentration profiles of 12 organic compounds in mixture for simulated aquifer sands with foc of 0.006%: (a,b) are breakthrough curves, whereas (c,d) and (e,f) are concentration profiles at elapsed times of 1 day and 5 days, respectively.
Water 12 03103 g002aWater 12 03103 g002b
Figure 3. Comparison of the measured data versus fitted breakthrough curves and predicted concentration profiles of 12 organic compounds in mixture for simulated aquifer sands with foc of 0.051%: (a,b) are breakthrough curves, whereas (c,d) and (e,f) are concentration profiles at elapsed times of 1 day and 5 days, respectively.
Water 12 03103 g003
Figure 4. Comparison of the measured data versus fitted breakthrough curves and predicted concentration profiles of 12 organic compounds in mixture for simulated aquifer sands with foc of 0.221%: (a,b) are breakthrough curves, whereas (c,d) and (e,f) are concentration profiles at elapsed time of 1 day and 5 days, respectively.
Water 12 03103 g004
Figure 5. Two-dimensional configuration and cluster analysis of Freundlich sorption parameters of 12 organic compounds in mixture for simulated aquifer sands with different foc values: (a) untreated sand (foc = 0.006%), (b) HA-coated sand (foc = 0.051%), and (c) HA-coated sand (foc = 0.221%).
Water 12 03103 g005
Figure 6. Effect of the fraction of organic carbon for simulated aquifer sands on pseudocompounds and their components.
Water 12 03103 g006
Figure 7. Comparison of the predicted breakthrough curve and concentration profiles versus the measured data of pseudocompounds in mixture for simulated aquifer sands with foc of 0.006%: (a) is a breakthrough curve, whereas (b) and (c) are concentration profiles at elapsed times of 1 day and 5 days, respectively.
Water 12 03103 g007
Figure 8. Comparison of the predicted breakthrough curve and concentration profiles versus the measured data of pseudocompounds in mixture for simulated aquifer sands with foc of 0.051%: (a) is a breakthrough curve, whereas (b) and (c) are concentration profiles at elapsed times of 1 day and 5 days, respectively.
Water 12 03103 g008aWater 12 03103 g008b
Figure 9. Comparison of the predicted breakthrough curve and concentration profiles versus the measured data of pseudocompounds in mixture for simulated aquifer sands with foc of 0.221%: (a) is a breakthrough curve, whereas (b) and (c) are concentration profiles at elapsed times of 1 day and 5 days, respectively.
Water 12 03103 g009aWater 12 03103 g009b
Table 1. Detailed specifications and model parameters for the column tests.
Model ParametersTest No.
Column 1Column 2Column 3
Organic carbon content, foc (%)0.0060.0510.221
Hydraulic conductivity, Kh (m/day)1.4891.5231.471
Volumetric flow rate, Q (mL/day)246.6252.0243.4
Liquid flux, q (m/day)0.06410.06550.0632
Seepage velocity, vs (m/day)0.1860.2000.181
Porosity, n0.340.330.35
Pore volume, PV (mL)562.5532.8570.2
Bulk (dry) density, ρb (mg/m3)1.741.781.72
Residence time, RT (days)2.282.112.34
Hydrodynamic dispersion coefficient,
Dh (× 10−3 m2/day), from KCl tracer tests
7.067.216.59
Table 2. Comparison of Freundlich sorption parameters between organic compounds in mixture and pseudocompounds for uncoated sands (foc = 0.006%) (initial concentrations for each = 10 mg/L).
PseudocompoundComponentsMixturePseudocompoundComparison of Parameters
Kf_mixNmixRMSEKf,PSNPSRMSEKf,mix/Kf,PSNmix/NPS
A1,2,4-TCB0.2630.9890.4110.2550.9920.6971.020.996
1,4-DCB0.2580.9870.506
Average0.2610.9880.459
BCB0.2320.9510.5460.2490.9381.480.9631.01
m-XYL0.2450.9400.521
TOL0.2420.9580.639
BZ0.2410.9390.399
Average0.2400.9470.526
C2,4-DMP0.1210.8080.6230.1110.7792.340.9371.02
p-CRE0.1090.7920.686
PHE0.0950.7620.502
2-HEX0.0900.7960.784
Average0.1040.7890.649
D2-BUT0.0810.6810.7430.0790.6620.7601.101.01
ACE0.0920.6500.718
Average0.0870.6650.731
Table 3. Comparison of Freundlich sorption parameters between organic compounds in mixture and pseudocompounds for humic acid (HA)-coated sands (foc = 0.051%) (initial concentrations for each = 10 mg/L).
PseudocompoundComponentsMixturePseudocompoundComparison of Parameters
Kf_mixNmixRMSEKf,PSNPSRMSEKf,mix/Kf,PSNmix/NPS
A1,2,4-TCB0.9330.9850.5610.9330.9850.5611.001.00
B1,4-DCB0.4380.9910.5210.4380.9910.5211.001.00
CCB0.2770.9690.5830.2780.9522.391.021.01
m-XYL0.2810.9500.451
TOL0.3010.9610.553
BZ0.2720.9550.619
Average0.2830.9590.552
C2,4-DMP0.1850.8110.6790.1120.7812.681.141.02
p-CRE0.1240.8020.669
PHE0.1150.7790.503
2-HEX0.0880.7830.663
Average0.1280.7940.629
D2-BUT0.0890.6490.7030.0910.6481.170.891.02
ACE0.0730.6680.758
Average0.0810.6590.731
Table 4. Comparison of Freundlich sorption parameters between organic compounds in mixture and pseudocompounds for HA-coated sands (foc = 0.221%) (initial concentration for each = 10 mg/L).
PseudocompoundComponentsMixturePseudocompoundComparison of Parameters
Kf_mixNmixRMSEKf, PSNPSRMSEKf,mix/Kf,PSNmix/NPS
A1,2,4-TCB3.570.9590.0213.570.9590.0211.001.00
B1,4-DCB1.750.9830.1511.750.9830.1511.001.00
CCB0.7990.9540.4160.8270.9690.7231.010.992
m-XYL0.8740.9710.552
Average0.8360.9620.484
DTOL0.4580.9750.5630.4280.9710.4240.9781.01
BZ0.3790.9720.452
Average0.4190.9740.508
E2,4-DMP0.5520.8140.6780.3800.8111.891.030.995
p-CRE0.4960.8030.626
PHE0.2650.8160.502
2-HEX0.2590.7970.476
Average0.3930.8070.571
F2-BUT0.2110.7210.6690.2100.7050.9940.9761.01
ACE0.1990.6990.785
Average0.2050.7100.727
Publisher’s Note: MDPI stays neutral with regard to jurisdictional claims in published maps and institutional affiliations.

