Abstract
UV-disinfection reactors may appear in a variety of forms, but it is useful for all types to identify the inflow and outflow zones (those in which the fluid approaches or, respectively, recedes from the radiation source) and the direct radiation zone (in which the flow occurs along the UV lamp). Due to the spatial variability of the velocity field and the radiation intensity, the radiation doses received in different zones of a reactor differ. In this work, theoretical considerations regarding functions describing the variability of UV radiation doses in flow reactors are presented. The most basic parameter of a UV-disinfection reactor is the minimal time required by the fluid to pass through the reactor. Such time depends on the maximum fluid velocity in the reactor. Based on the theoretical analysis of this phenomenon, the doses in different zones of the reactor have been compared for laminar and turbulent flows. The result of the analysis states that UV-disinfection reactors should be designed in such a way to deliver the required amount of radiation to the point at which the fluid velocity is the highest. The other main conclusion resulting from this comparison yields that the most effective in terms of disinfection is the direct radiation zone, whereas the influence of the inflow and outflow zones is negligible.
1. Introduction
The possibility of using UV technology for water disinfection purposes was noticed in the late 1870s. It was an attractive alternative to chemical methods since it allowed us to avoid the by-products formed during chlorination. The first drinking water disinfection system was opened in Marseilles, France in 1910, while in wastewater sector, the first full-scale UV installation was launched in 1978 in Northwest Bergan (Waldwick, New Jersey) [1]. One of the oldest installations, which has been in continuous operation since 1991, is the wastewater treatment plant in the city of Altoona (Pennsylvania, USA) [2]. Currently, due to the water scarcity and reduction of process costs, the number of water and wastewater treatment plants using UV technology is increasing mainly in the USA, China, Russia, Germany, and France. The world’s largest UV disinfection installation is located in Moscow in the Luberetskaya wastewater treatment plant with capacity to treat over 6 million m3 of urban wastewater per day [3]. In the European Union, the largest UV installation was implemented in 2005 in Munich in the Gut Marienhof wastewater treatment plant.
UV disinfection has been gaining increased interest since it is based on electromagnetic energy and, in general, does not alter water quality. Its effectiveness in the inactivation of waterborne pathogens is connected with the disruption of the DNA or RNA of living cells (bacteria, viruses, and protozoa). The UV radiation, which passes through the cell body reacts with DNA/RNA nucleotides and, as a result, thymine dimers are produced (other dimers are less probable). The formation of thymine dimers in vital areas of the DNA prevents replication. UV radiation, which is responsible for DNA/RNA damage, ranges from 230 to 290 nm (optimum between 260–265 nm) and the degree of cell inactivation is directly related to the UV dose. Thus, it is critical to provide the optimum UV dose during the disinfection process and to obtain the complete inhibition of cell replication.
The UV dose (UVD) depends on the radiation intensity (irradiance) and the exposure time. It is expressed as [4]:
where the UVD (J/m2) is the delivered energy per unit area, I (W/m2) denotes the irradiance (power delivered by the UV source), and tR (s) is the exposure time.
The minimal effective dose of the radiation (UVDE), which provides the required level of deactivation of the considered microorganisms, can be determined quite easily when batch reactors are used. The reason for this is that the whole content of such a reactor can be held for an arbitrarily long time within a radiation range with known intensity [5,6].
In the case of flow reactors, the problem becomes complex as fluid flows through the reactor. Currently, computational fluid dynamics (CFD) is advanced enough to perform a numerical simulation of such a process and estimate its parameters [6,7]. However, such an approach delivers only a solution for a particular problem such as the selection of the reactor configuration or the UV lamps, which will deliver the required dose of radiation to the fluid. In practice, however, CFD methodology can hardly be considered as a typical toolset for exploiters of water and wastewater systems. It requires specific knowledge and experience in the areas of domain discretization, solutions of systems of partial differential equations, and visualization. All the above make such a methodology costly and time-consuming, and, overall, not flexible since, each time, it is tailored for an exact case only. Additionally, the accuracy of such computations can be problematic, especially in the case of turbulent flows. Usually CFD methodology is used by research and development specialists or for the purpose of scientific investigations.
Possibly for this reason in UV disinfection guidelines (e.g., [6]) dose-monitoring equations developed by theoretical means (mostly based on CFD computations) are treated as auxiliary relations. According to the regulations, the selection of the UV radiation dose is often based only on empirical radiation testing. However, such an approach is strictly technical and has very limited advantages from the scientific viewpoint. Additionally, it does not provide the general rules for practical design of UV-disinfection flow systems.
It, therefore, seems reasonable to seek such theoretical models of this phenomenon, which will have a low level of formal complexity and will provide a proper level of compatibility with physical observations. Such models could be used as an aiding tool for using CFD methods (for example, to estimate the starting values for iterative processes). Additionally, they could be used as part of a simplified computational method in the process of the design of flow reactors.
The building of a mathematical model of such a process requires recognition of the hydraulic structure of the considered object type. According to Equation (1), in the case of flow reactors used for UV disinfection, two factors have to be considered:
- Variability of the fluid flow velocity field, which influences the time spent by different fluid elements in the UV radiation range (flow-through systems, especially these having a regular geometry, can be conveniently and willingly described by the average flow velocity). Alas, when the considered phenomena undergo the chemical and/or biological and/or physical processes, which expected effectivity can be reached after the passage of a proper period of time and in accurately determined conditions, like concentrations of reacting substances, radiation intensity, temperature etc., application of the mean velocity would be an oversimplification. In real flows, due to the momentum exchange, turbulence, and/or viscous factors, the velocity field is highly differentiated. Its minimal value, which is equal to zero, appears close to the immobile walls. In this case, one observes the longest detention time, whereas the maximal value of this time is observed in some distance from the wall, along the main stream. When taking into account technical and economic aspects of the considered problem, it is clear that the basic form of the flow in this case is a turbulent one. However, the laminar flow effects, because of its relatively simple mathematical description, can be easier to understand. For this reason, to make the paper more comprehensible, both laminar, with a cognitive value, and turbulent, with a practical value, flow conditions were discussed.
- Decrease of the UV radiation intensity due to the growing distance from its source, i.e., UV lamp (the radiation, penetration of the material medium, and losses regarding its intensity due to the absorption). The effect of disinfection is also proportional to the detention time of the microorganism in the system and, being aware that both these factors act together, one should agree that it is purposeful to specify the reactor zones of a different fluence rate.
The analysis of the influence of these two factors on the estimated UV radiation dose (UVD) is the subject of this paper.
2. Methods
2.1. Absorption of UV Radiation by a Fluid
The intensity of UV radiation, as every form of radiation, decreases as it penetrates through a material substance, mostly due to absorption. In practice, the intensity of the radiation absorption is described by transmittance, which is defined as a measure of the fraction of incident light transmitted through the water column [6]. This quantity is usually expressed as part of the energy, which was transmitted through a material of a thickness equal to h (usually h = 10 (mm)). Another widely used quantity is absorbance, which describes the amount of the energy absorbed by the medium through which it penetrates.
In practical applications, the radiation intensity is expressed using Beer-Lambert’s law, according to which the radiation intensity can be expressed using the equation below [8].
where (m) is the distance from the source of the radiation, I(x) (W/m2) is radiation intensity at point x, (W/m2) is radiation intensity of the source, and α (m-1) is a Napierian absorption coefficient.
The value of the coefficient α can be estimated from Equation (2) if the transmittance T of the medium is known. By definition, the transmittance at the considered point is:
which gives
The description of the radiation dose distribution, given by Equation (2), has a basic character. It means that the efficiency of the microorganism elimination depends directly on the radiation intensity value I. This model does not take into account such features, like microbial inactivation kinetics, nor the wall reflection of the UV-light. Including these features of the considered process would complicate its mathematical model and would not present the outcome in an analytical form, which is one of the merits of this work.
The main goal of this paper is derivation of the respective equations in an analytical form utilizing possible simplifications. Such an approach enables us to discuss the hydraulic structure and efficiency of UV-reactors. Additionally, these simplifications create a profitable “margin of safety” (e.g., UV-wall reflection enhances the reactor efficiency [9]).
2.2. Computational Schemes for Determination of the Velocity Field and Radiation Dose
As mentioned above, the determination of the flow characteristics of reactors with complex geometries is possible only through numerical modelling using the CFD approach or through experiments.
Taking into account the huge amount of information, collected in this way, we make use of rather compact methods of the process description. Likely the most popular and useful approach is determination of the residence time distribution (RTD) [9,10]. Such specification of the flow pays respect to the internal mixing of the moving fluid [11,12] and to the configuration of the reactor including the form of the inlet and outlet [13].
The analysis of the shapes of the UV-disinfection devices provided by the manufacturers, however, allows it to be stated that UV reactors usually have simple geometries. Therefore, for further consideration, it was assumed that it is reasonable to treat disinfection devices as pipe reactors with three different zones inside (see Figure 1):
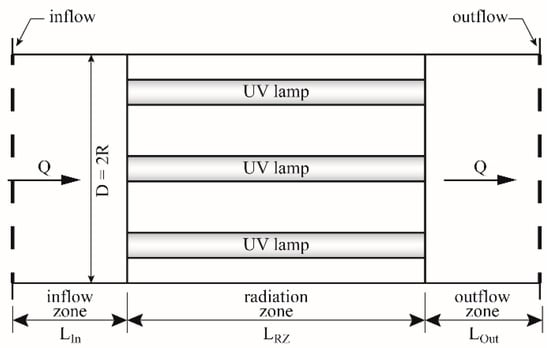
Figure 1.
Structural scheme of a typical UV flow reactor.
- inflow zone of the length LIn,
- radiation zone of the length LRZ, which contains one or more UV lamps, placed in parallel or perpendicularly to the flow direction,
- outflow zone of the length LOut.
The greatest radiation intensity occurs in the radiation zone. However, the influence of the inflow and outflow zones on the disinfection process should be taken into account as well. The results of such an analysis could potentially be useful for estimating the effectiveness of the radiation zone. Thus, a discussion of the process characteristics in the remaining zones becomes more important.
An analytical description of the hydraulic structure of the considered process is possible only for simple geometries like a pipe reactor. Taking into consideration the previously mentioned issues, the following flow schemes included in UV flow reactors will be considered:
- flow in the inflow area and the determination of the radiation dose (which come from a computational point of view that is equivalent to the outflow zone) for laminar flow,
- as above, but for turbulent flow,
- UV dose in the radiation zone (one lamp, parallel to the axis of the pipe) for laminar flow.
2.3. Inflow Zone—Laminar Flow Considerations
2.3.1. Analysis of the Flow Profile and Flow Time
The velocity profile of pressurized laminar flow in a circular pipe can be described by the Hagen-Poiseuille solution [14,15], according to which the velocity profile is given by the equation of the paraboloid (Figure 2).
where r is the actual distance from the centre of the cross-section, ux is the velocity in the direction of x, R is the radius of the considered pipe, Δp is the pressure difference forcing the flow, L is the distance at which the pressure difference Δp occurs, and μ is the dynamic viscosity coefficient. The auxiliary variable CL = Δp/(4 μL) was introduced to maintain the clarity of further rearrangements of this relation (the subscript L refers to laminar flow considerations).
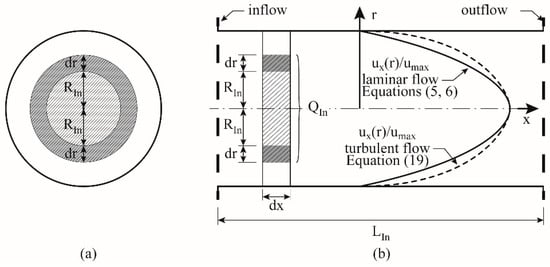
Figure 2.
Flow in the inflow area (a) cross-sectional view, and (b) longitudinal cross-section view.
In the considered case, the largest velocity occurs in the centre of the pipe’s cross-section.
Thus, the UV exposure time of the particles flowing along the pipe’s axis is the smallest, and equals:
The further the distance from the pipe’s axis, the slower fluid elements flow. Therefore, they remain longer in the radiation area when absorbing larger doses of radiation. In an extreme case (r = R), the radiation time tends to infinity (tR→∞) due to adhesion on the pipe walls (Figure 2).
The aim of these considerations is the estimation of the UV radiation dose dependent on the particle position in the cross-section. For this reason, it is convenient to introduce the “integral discharge of the liquid” quantity, denoted as QIn, whereas the Q value denotes the total discharge. We define the integral discharge QIn as the volume discharge flowing through part of the pipe’s cross-section given by the integral radius r = RIn (for RIn = 0, QIn = 0, whereas for RIn = R, QIn = Q). According to the scheme depicted in Figure 2, introducing Equation (5), the following expression can be written
If RIn = R, the integral discharge is equal to the total flow discharge QIn = Q, equal to:
For subsequent considerations, we introduce the relative integral quantities of the discharge and radius.
In such a case, Equation (8) can be expressed in the following form.
The flow time of the fluid particle distant from the pipe axis by RIn at the distance LIn by definition is equal to:
Extracting from Equation (12), RIn,R, and introducing it into Equation (11), the relation between the flow time tR and the relative integral discharge QIn,R is obtained by using the equation below.
As can be observed, for r = 0, when QIn,R = 0, the time of exposure to radiation is tR = tR,min (Equation (7)), whereas, when the total flow QIn,R = 1 (QIn = Q) is considered, then tR → ∞, which is consistent with already stated reasoning.
2.3.2. Analysis of the Received Radiation Dose (UVD)
In the considered case, the radiation intensity differs between the inflow cross-section and the radiation source in the manner expressed by Equation (2). Each liquid element flows through the elementary distance dx of the LIn distance in the elementary time dtR, which, based on Equation (13), can be expressed by the equation below.
During this time, each element of the liquid receives the elementary radiation dose:
Thus, the total radiation dose received on the distance LIn will be equal to
Substituting Equations (2) and (14) into Equation (16) and rearranging it, the following equation is obtained:
Based on Equation (17), three significant components of the considered process can be highlighted:
- the minimum required radiation dose, which can be called the “required base dose” ();
- an increase in the radiation dose along with the distance from the pipe axis (expressed by the denominator of the leftmost fraction in Equation (17)),
- the influence of the absorption of radiation by the fluid (rightmost fraction in Equation (17)).
It is convenient to use Equation (17) in cases when the UV disinfection efficiency of the fluid is considered or when information on the amount of the discharge, which received a sufficient (or insufficient) radiation dose, is required. In other cases, information about the spatial variability of the radiation dose can be important. If so, then in Equation (17), the relative integral flow discharge should be substituted with the relative integral radius RIn,R using Equation (12), which gives the following formula:
Based on Equation (18), a detailed analysis of the influence of the UV reactor’s parameters on its effectiveness can be performed. Additionally, Equation (18) can be used for the calculations performed in the design process of UV reactors. For the proper functioning of the disinfection process, the most significant is a comparison of the effective radiation dose UVDE with the minimal radiation dose UVDMin (given by Equation (17) or (18) for QIn,R = 0 or for RIn,R = 0, respectively) received by the fluid.
The minimal effective radiation dose can be easily determined experimentally for batch reactors and used in current computations. If UVDMin > UVDE, it is guaranteed that the whole fluid volume received a sufficient radiation dose. If that is not the case (UVDMin < UVDE), it means that some of the microorganisms present in the fluid will not be inactivated and, thus, even after the disinfection process, the fluid will not be safe for users.
Based on the above considerations, the clear conclusion arises that a UV reactor should be designed in such a way as to provide a sufficient radiation dose for all the volumes of the flowing fluid, that is, UVDMin = UVDE.
2.4. Outflow Zone–Laminar Flow
As a result of the formal symmetry of the model, the relations obtained previously are valid in the case of the outflow zone. It is only required to substitute LOut for LIn. This remark holds true in the case of turbulent flow as well. However, one has to notice that the real velocity field in the neighbourhood of the UV-lamp is not symmetrical, since, in the inflow zone, a wake region appears, which complicates calculations, even if numerical CFD methods are used [7].
2.5. Inflow Zone–Turbulent Flow Considerations
2.5.1. Analysis of the Flow Profile and Flow Time
In the case of turbulent flow, the flow profile differs. The velocity profile in turbulent flow can be described by the empirical “law of 1/7” [15], which results in a formula adequate for analytical rearrangements:
The relative velocity ux(r)/umax profile for turbulent (as well as laminar) flow in the pipe has been presented in Figure 2.
Based on Equation (19), the total discharge Q will be equal to:
which allows for finding the unknown value of maximum velocity in the pipe by means of the discharge Q:
Finding the integral discharge for r varying from 0 to RIn, the formula expressing the relative flow discharge corresponding to Equation (11) (including Equation (10)) for turbulent flow is obtained.
The flow time of the particle distant by r = RIn from the pipe axis on the distance of LIn is shown below.
Thus, the minimal time of exposure to radiation is (for RIn,R = 0, including Equation (20)) is shown in the following equation.
2.5.2. Analysis of the Received Radiation Dose
The radiation dose is determined analogically, as it was done in case of laminar flow. The expression for the elementary time dtR from Equation (23) for LIn = dx. After rearrangements, the equivalent of Equation (18) is obtained, but, in this case, for turbulent flow.
2.6. Radiation Zone—Turbulent Flow Considerations
2.6.1. Analysis of the Flow Profile and Flow Time
The main aim of these considerations is the analytic formulation of a model describing the hydraulic structure of the flow in UV reactors. Such a proceeding should allow a discussion of the properties of the flow in a reactor and the formulation of design guidelines for such devices.
When the radiation zone is considered, the analytical description is applicable only to such a case in which one cylindrical lamp (of the length LRZ and radius RL) is inserted into the reactor coaxially (Figure 3).
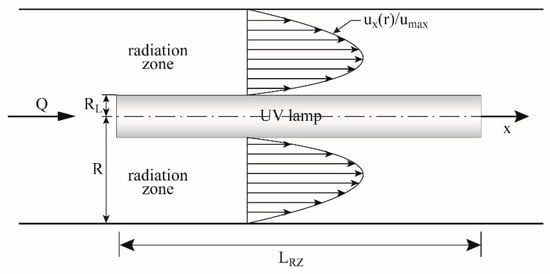
Figure 3.
The flow profile in the radiation zone (R = 0.1 (m), RL = 0.02 (m), umax = 0.07 (m·s-1), CL = 20 (m-1·s-1)).
In such a case, a general form of the Hagen-Poiseuille solution can be used [15].
where CT,1 and CT,2 are integration constants (the T subscript refers to turbulent flow). The required boundary conditions for Equation (26) would be:
It can be noticed that, in the case without the lamp, the classical Hagen-Poiseuille solution given by Equation (5) is obtained.
By including the boundary conditions in Equation (27) and inserting them into Equation (26), the constants of integration will be obtained (for constant CL, see Equation (5)).
Introducing Equations (28) and (29) into Equation (26) yields the following.
Lastly, introducing the relative integral radius RRZ,R into Equation (30) yields Equation (31).
As mentioned before, the significant parameter of the considered process is the maximum flow velocity. The line at which the flow with the maximum velocity occurs is equivalent to the part in which the exposure time to radiation is the shortest. The position of this line can be easily estimated from the following expression
which can be rearranged to obtain the relative radius at which the exposure time is the shortest.
2.6.2. Analysis of the Received Radiation Dose
An estimation of the radiation dose UVD(RRZ,R) in this case is simpler than before (Equation (15)), as the radiation intensity varies along the same direction as the velocity profile.
For the same reason, Equation (2) has to be adjusted (the independent variable is RRZ,R instead of x, and I = I0 for RRZ,R = RL/R, not for x = 0 as previously). Finally,
The exposure time is given below.
which, after the introduction of Equations (31) and (33), gives the following,
Rearranging the relationship given by Equation (37) to one analogous to Equation (17) (laminar flow, inflow zone) UVD(QRZ,R) is pointless as it becomes very complicated. However, this is not necessary to perform in the following considerations.
3. Results
3.1. Outcome Analysis - Spatial Variability of the Radiation Dose
3.1.1. Inflow and Outflow Zone
The radiation dose absorbed by the mass of the fluid elements (including microorganisms) is given by Equation (17) (which describes its variability according to an increase in the discharge measured with respect to the axis of the pipe), whereas Equation (18) describes the absorption variability along with the distance from the pipe axis.
In the case of turbulent flow, the equivalent of Equation (18) is Equation (25). The relation analogous to Equation (17) can be obtained by numerical computations, which converts RIn,R values in Equation (25) to QIn,R with Equation (22). It should be pointed out that the relation between QIn,R and RIn,R (Equations (11) and (22), Figure 4) is nonlinear.
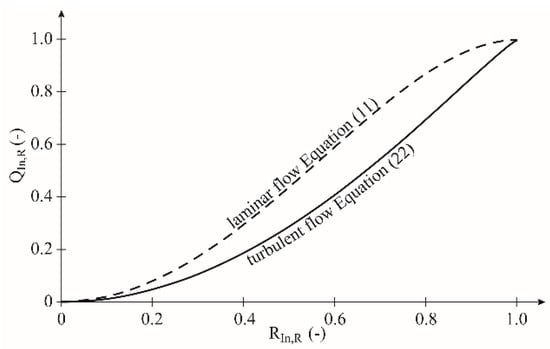
Figure 4.
The relation of the integral relative flow discharge QIn and integral relative radius RIn.
To highlight the variability of these functions with respect to the position of the fluid element in the pipe’s cross-section (RIn = 0 ÷ R, which means RIn,R = 0 ÷ 1), it has been related to the appropriate minimal required dose. The minimal dose was estimated for liquid elements with the maximum velocity, as they receive the least amount of radiation. This leads to formulas expressing the relative radiation doses.
For laminar flow with the independent variable RIn,R (Figure 5, Equation (18)):
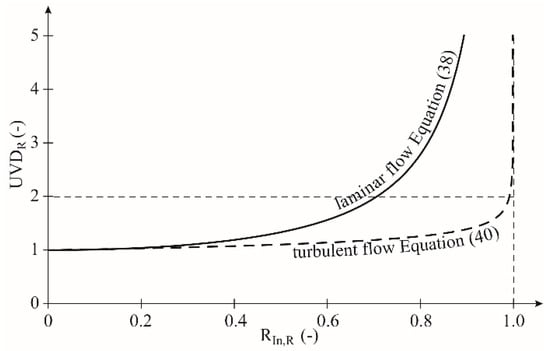
Figure 5.
The relation between the relative radiation dose and integral relative radius in the inflow and outflow zones.
For laminar flow with the independent variable QIn,R (Figure 6, Equation (17)):
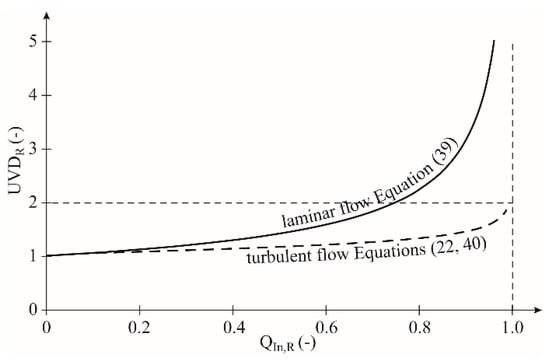
Figure 6.
The relation between the relative radiation dose and integral relative discharge in the inflow and outflow.
For turbulent flow with the independent variable RIn,R (Figure 7, Equation (25)):
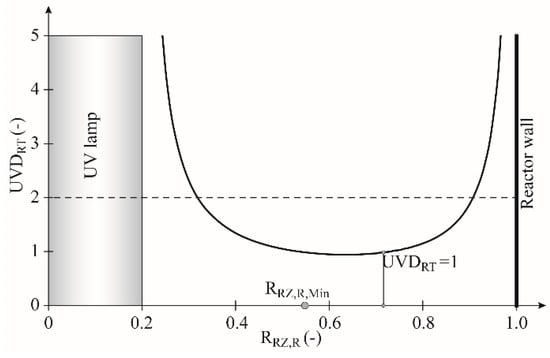
Figure 7.
The relation between the UV radiation dose and the integral radius in the radiation zone.
The values for turbulent flow with the independent variable QIn,R (Figure 6) obtained numerically are based on Equations (40) and (22)).
3.1.2. Radiation Zone
In the inflow and outflow zones, minimal radiation doses will be absorbed by the fluid elements that have the greatest flow velocity. As a result of this reasoning, the quantitative relations (Figure 5 and Figure 6) were relatively simple to obtain.
The situation in the radiation zone is more complex, as with the exception of the line of maximum velocity (Equation (33)), the radiation intensity still decreases (Equation (35)). Despite the fact that the velocity decreases, the radiation dose can decrease as well to increase as a result of the velocity decrease in the vicinity of the pipe wall (RRZ,R = 1). Unfortunately, the expression describing this behaviour (Equation (37)) is too complex to obtain the minimal dose in analytical form. The problem becomes even more complex since, in Equation (37), the technical parameters of the reactor occur, which prevents the standardization of the relative dose of radiation. This was completed for the purpose of formulating the expressions given by Equations (38)–(40).
For illustrative purposes, the example distribution of the relative dose UVDR was estimated by computations of UVD for subsequent values of RIn,R using Equation (37), and then by dividing it by the dose UVDMin calculated with Equation (37) for RIn,R,Min as in Equation (33). The obtained plot of the function has been displayed in Figure 8. The same set of data as used for plotting Figure 4 was used. As expected, the minimal value of UVDR takes place for RIn,R = 0.6 > RIn,R,Max = 0.55. However, it is only slightly lower than the dose absorbed by the fluid elements with the maximum velocity umax (about 1% lower).
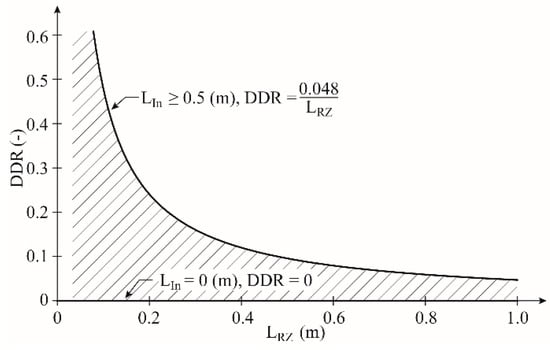
Figure 8.
Comparison of the efficacies of the inflow and radiation zones.
4. Discussion
Looking at Figure 5 and Figure 6, it can be noticed that the functions depicted there increase their values relatively slowly from minimal values up to the boundaries. The growth of UVDR becomes more intensive close to the wall, and this value increases toward infinity. It is a formal consequence of the fact that the flow velocity becomes zero due to adhesion at the pipe wall. This theoretically denotes the infinitely long time of the exposure to UV radiation. In other words, in most of the device area, the fluid receives a radiation dose slightly greater than the minimal one (see Figure 5, Figure 6 and Figure 7). The example level of the doubled minimal radiation dose was marked with dashed lines. As can be seen in the inflow zone, this concerns 70% of the area for laminar flow and 90% of the area for turbulent flow (Figure 5). A similar situation occurs in the radiation zone with laminar flow, where 75% of the fluid receives a low radiation dose (Figure 7). For turbulent flow, it was impossible to obtain the analytical formulas describing the flow profile. However, due to the similarity of the plots depicted in Figure 6, similar results can be expected in the considered case.
If the disinfection process will not reach the maximum efficacy, some of the microorganisms will remain in the flowing fluid. As a result, their consecutive development will lead to contamination of the whole volume of the fluid.
The reliable parameter for the estimation of the required radiation dose (Equation (1)) is the shortest flow time tR,Min calculated for the maximal flow velocity (Equation (6) and Equation(7)). Such an approach provides an advantage, which is a safety margin for the design of UV-disinfection devices. Additionally, the estimation of this value is simple. Let us notice that the simplest value to estimate is the flow time for averaged velocity tAV.
where S denotes the pipe’s cross-sectional area. However, this value is, by definition, smaller than the time of the flow with maximum velocity tR,Min. As can be seen, based on Equations (6), (7), (9), (20), and (21):
For laminar flow:
For turbulent flow:
The relations (43) and (44) are true for pipes with circular cross-sections. However, for technical purposes, they can be treated as a good approximation for other more complicated shapes as well.
Comparison of the Effectiveness of the Inflow and Radiation Zones
So far, the problem has been considered separately for each part of a UV reactor: the inflow zone (which is equivalent to the outflow zone) and for the radiation zone. The reason for such an approach was the assumption that the device can be designed in every possible configuration (Figure 1). However, it is important to estimate the relation between the effectiveness of each of these zones to determine if one of them provides some advantages over another. The quotient DDR of the minimal UV dose in the inflow zone: UVDIn,Min (Equations (6), (7), (18) for RIn,R = 0), divided by the minimal UV dose in the radiation zone UVDRZ,Min (Equation (37) for RIn,R = RRZ,R,Min computed according to Equation (33)) has been determined. After rearrangement, the following expression is obtained.
Expression (45) should be analysed from the viewpoint of the influence of the length of each part of a UV reactor, denoted as LIn and LRZ. The remaining geometrical and flow quantities are common for the considered reactor (Figure 1). This allows Equation (45) to be written using a shorter expression, which is convenient for further analysis.
The value of the term K results from Equation (45).
The obtained expression allows for an estimation of the range of variability of the UV radiation dose ratio in the inflow and radiation zones. If LIn = 0, then DDR is equal to zero as well. This result is clear as there is no inflow zone at all. If LIn ≠ 0, it can be observed that the exponential function in Equation (45) tends to zero very rapidly. In fact, even with LIn ≥ 0.5 (m), Equation (45) becomes the following
Both considered zones (LIn = 0 (m) and LIn = 0.5 (m)) were presented graphically in Figure 8 (for data identical as those used in Figure 3). As shown, the inflow zone radiation dose contribution is significantly smaller than the dose contributed by the radiation zone. This remains valid even with a small value of LRZ = 0.2 (m) and a much greater value of LIn = 0.5 (m) for which the dose ratio is equal only to 20%. This ratio decreases strongly when LRZ increases.
This statement leads to the general conclusion that, in UV reactors, the radiation zone should dominate, and the influence of the inflow and outflow zones is negligible. A more specific evaluation of the situation can be obtained based on Equation (45).
5. Conclusions
The disinfection of water, especially for drinking purposes, is a very important technological process. It has an attribute that differentiates it significantly from the removal of chemical contaminants when the process can be evaluated by means of the whole fluid stream in the reactor. Therefore, even different parts of the fluid volume are purified to a different degree. When the total decrease of the targeted component fulfils the required criteria, the reactor operation is considered to be proper. In the case of the disinfection process, the situation is different. If any part of the disinfected fluid volume receives a UV dose significantly smaller than the reactor’s design dose, no sufficient UV energy may reach the molecular components of a micro-organism’s DNA. As a consequence, undesirable bacterial regrowth may be observed following UV treatment. Therefore, the definitive evaluation of the reactor’s efficiency is done during validation testing. However, at the initial proceedings stage (design, prototype construction), knowledge of the internal structure and the distribution of the components’ intensity of the processes taking place in the reactor is important.
In this work, the variability of the velocity field of the fluid and the radiation intensity were analysed, which are the two most significant factors in a UV flow reactor. The flow velocity varies from zero (at the pipe wall) to a maximum value in the centre of the stream, whereas the radiation decreases along with the distance from its source due to the radiation absorption process. Next, the spatial distribution of the radiation dose absorbed by different fluid elements was estimated. The zones in which the fluid inflows or outflows to and from the UV lamp vicinity were considered separately from the radiation zone where the fluid flows along the UV lamp. The outcomes of the analyses allow the following conclusions to be formulated:
- To estimate the minimal required radiation dose of UV radiation (Equation (1)), it is appropriate to use the minimal flow time through the reactor tR,Min (Equations (7) and (24)),
- A significant amount of the fluid flowing through the reactor receives a radiation dose slightly greater than the minimal dose (computed for the tR,Min time),
- During the UV reactor design process, it should be assumed that the effective radiation dose should be equal to the minimal one,
- For practical purposes, regarding turbulent flow, it can be assumed that the minimal exposure time is equal to tR,Min = 0.82 tAV (Equation (44)). In the case of laminar flow, it becomes tR,Min = 0.5 tAV,
- The technical solutions of UV reactors can take different forms. Therefore, it is appropriate to define the structural scheme of a UV reactor as shown in Figure (1),
- The effectiveness of the radiation in the radiation zone highly outranks the radiation efficiency from the inflow and outflow zones. For this reason, it is suggested that UV reactors should be designed in such a way that they have a dominating radiation zone.
Author Contributions
Conceptualization, J.M.S., W.A and A.L. Software, W.A. Validation, W.A. Formal analysis, J.M.S. Investigation W.A. Resources, J.M.S. and A.L. Writing—original draft preparation, J.M.S., W.A. and A.L. Writing—review and editing, W.A. and A.L. Visualization, W.A. Supervision, J.M.S. and W.A. Project administration, J.M.S. and W.A. All authors have read and agreed to the published version of the manuscript.
Funding
This research received no external funding
Conflicts of Interest
The authors declare no conflict of interest.
References
- Whitby, G.E.; Scheible, O.K. The history of UV and wastewater. IUVA News 2004, 6, 15–20. [Google Scholar]
- Altoona Water Authority: Ultraviolet Disinfection of Wastewater. 2013. Available online: https://www.altoonawater.com/disinfection-wastewater (accessed on 22 November 2019).
- Khramenkov, S.; Kostyuchenko, S.; Volkov, S.; Giller, H. UV Shines Light on Russian Wastewater Problem. 2008. Available online: https://www.waterworld.com/international/desalination/article/16202382/uv-shines-light-on-russian-wastewater-problem (accessed on 22 November 2019).
- Bolton, J.R.; Linden, K. Standardization of methods for fluence (UV dose) determination in bench-scale UV experiments. J. Env. Eng. 2003, 129, 209–216. [Google Scholar] [CrossRef]
- Oguma, K.; Kita, R.; Sakai, H.; Murakami, M.; Takizawa, S. Application of UV light emitting diodes to batch and flow-through water disinfection system. Desalination 2013, 328, 24–30. [Google Scholar] [CrossRef]
- US Environmental Protection Agency Office of Water. UV Disinfection Guidance Manual. November 2006. Available online: https://nepis.epa.gov/ (accessed on 22 November 2019).
- Chen, J.; Deng, B.; Kim, C.N. Computational Fluid Dynamics (CFD) Modeling of UV disinfection in a Closed-Conduit Reactor. Chem. Eng. Sci. 2011, 66, 4983–4990. [Google Scholar] [CrossRef]
- Ingle, J.D.J.; Crouch, S.R. Spectrochemical Analysis; Prentice Hall: Upper Saddle River, NJ, USA, 1988. [Google Scholar]
- Hart, J.R.; Guymer, I.; Sonnenwald, F.; Stovin, V.R. Residence Time Distribution for Turbulent, Critical and laminar Pipe Flow. J. Hydraul. Eng. 2016, 142. [Google Scholar] [CrossRef]
- Wilson, J.M.; Venayagamoorthy, S.K. Evaluation of Hydraulic Efficiency of Disinfection Systems Based on Residence Time Distribution Curve. Environ. Sci. Technol. 2010, 44, 9377–9382. [Google Scholar] [CrossRef] [PubMed]
- French, J.A. Thorough Dispersal of Dosants in Conduits. J. Hydraul. Eng. 2015, 141. [Google Scholar] [CrossRef]
- Severin, B.F.; Suidan, M.T.; Engelbrecht, R.S. Mixing Effects in UV Disinfection. J. Water Pollut. Control. Fed. 1984, 7, 881–888. [Google Scholar]
- Friedlander, P. Resolving UV Hydraulics Issues During Facility Start-Up, Proc. Water Environ. Fed. 2009, 2009, 322–328. [Google Scholar] [CrossRef]
- Massey, B.; Ward-Smith, J. Mechanics of Fluids; Spon Press: Abingdon, VA, USA, 2012; Available online: https://www.crcpress.com/Mechanics-of-Fluids/Ward-Smith/p/book/9780415602600 (accessed on 22 November 2019).
- Prandtl, L. Führer durch die Strömungslehre; Springer: Braunschweig, Germany, 2012; Available online: https://www.springer.com/de/book/9783834823151 (accessed on 22 November 2019). [CrossRef]
© 2020 by the authors. Licensee MDPI, Basel, Switzerland. This article is an open access article distributed under the terms and conditions of the Creative Commons Attribution (CC BY) license (http://creativecommons.org/licenses/by/4.0/).