Abstract
Increasing urban water demand and water stress conditions due to population growth, combined with climate change and a non-uniform distribution of water resources in space and time, represent major concerns for water companies. As such, long-term management strategies need to improve the resilience of water supply systems and account for the sustainability of water withdrawals. In this context, metabolic modelling may provide a support to decision-making in the medium-long term, based on sustainability criteria. This approach enables mimicking a water supply network (WSN) based on a set of material and energy fluxes that interact and influence each other. By analyzing these fluxes, a suite of key performance indicators (KPIs) is evaluated in order to identify which kind of interventions may be applied to increase the sustainability of the system. Here, we apply a metabolic model, WaterMet2, to a WSN in the Reggio Emilia Province (Italy), combined with hydraulic simulations conducted with EPANET. Different alternative strategies are compared, including a reduction of water withdrawals from the main well field due to a possible future decrease in water availability. Based on KPIs, sustainable long-term strategies are evaluated in order to identify the most suitable solution for dynamic sustainable management of the water supply system.
1. Introduction
Availability of water resources, not uniformly distributed in space and time, and the increasing urban water demand, represent major concerns for water companies [1]. Population growth, climate change, and contamination of water resources are considered primary driving forces responsible for the increase of water stress conditions at the local and global scale [2,3]. These factors not only threaten areas where water needs to exceed the availability of water resources [4,5], but also in regions where a future intensive urbanization is expected [6]. In this context, the primary goal is to increase the resilience of water supply systems, in terms of infrastructure and environmental compliance, which is a critical issue in urban water management [7,8]. Therefore, investments in developed countries are devoted to the improvement of wastewater treatment and the rehabilitation and restructuring of water networks [9].
Along with a satisfactory level of service for Urban Water Systems (UWSs), sustainability targets must be ensured [10,11]. Sustainability represents a multidimensional goal, involving economic, social, environmental, infrastructural, and governance constraints, which vary over time. Its assessment is a critical part in long-term strategies of water companies [12]. During strategic planning, it is essential to identify a unified method to quantify sustainability, by analyzing the UWS in an integrated manner, where the impact of interactions between all the components is measured concurrently on the whole system [13,14].
The transition from the current to the future state of a UWS is determined by analyzing the evolution of the physical state of the system, and considering actions planned by water companies, as well as the impact of external drivers, through the definition of relevant strategies. A typical way to face this kind of analysis involves physically based models, able to mimic the behavior of the UWS, combined with stochastic approaches used to build probabilistic scenarios [15,16]. In order to evaluate the sustainability of alternative intervention strategies, specific tools are also needed; these must operate at the system level, by contemplating the entire water cycle, within a medium-long time horizon, in order to evaluate the system’s ability to achieve the desired sustainability goals.
Having identified the relevant intervention strategies, we follow a novel two-step methodology, based on the combination of a physically based model (i.e., EPANET) with a conceptually based model. Different intervention strategies are compared with respect to the actual state in terms of project feasibility, using EPANET; then a separate sustainability analysis is conducted. The latter is performed by means of a simplified conceptual model that provides a schematization of the system processes, and is suitable for integrated large-scale spatial and temporal evaluations. Specifically, among analysis tools able to discriminate alternative intervention strategies, we resort to a metabolic model of the integrated UWS, which has been shown to be particularly flexible and able to support the decision-making process [17,18]. This answers the need for a holistic and systemic approach, which is increasingly required [19,20].
Over the last decades, it has become common practice to tackle the sustainability of cities through the study of its “metabolism”, by adopting an analysis approach, borrowed from ecological sciences, which considers the city as an ecosystem, whose physiology is governed by energy and material flows, and relationships with the surrounding elements [21]. By applying a metabolic model to a UWS, it is possible to deduce its performance by means of key performance indicators (KPIs) in compliance with economic, environmental and safety criteria, and to compare different management strategies with respect to the current status, i.e., business as usual (BAU) [13,22,23].
Recently developed conceptual models for urban water cycle assessments, such as Aquacycle (2000) [24], UVQ [25,26], and UWOT [27], are mainly focused on specific processes within the UWS, failing to represent a truly holistic approach. To this end, the metabolic tool is aimed at quantifying, together with water flows, also material and energy fluxes, which affect the system sustainability. Two interesting models, the Dynamic Metabolism Model (DMM) [28] and WaterMet2 (WM2) [29,30], both based on the Material Flow Analysis approach [31], were developed as a part of the “TRansitions of the Urban Water Services of Tomorrow” (TRUST) project (FP7/2007-2013, Grant Agreement No. 265122) [32].
For the purpose of this study, we select WM2, which is a dynamic model able to reproduce the performance of the UWS over a long-term time horizon. It was specifically developed for the long-term strategic analysis of the performances of UWSs, and related issues, e.g., studying the effects of implementing solutions to enhance urban drainage and reuse/recycling within the city. Here, we employ WM2 to analyze alternative management strategies against a real case study in the Reggio Emilia Province (Italy). In particular, we investigate different intervention strategies of groundwater exploitation, and compare alternative design solutions for the UWS over a 30 years time horizon [33].
2. Materials and Methods
2.1. Characterization of the Study Area
2.1.1. Groundwater Withdrawals
In this study, the Water Supply Networks (WSNs) of Roncocesi and Luzzara in the Reggio Emilia Province (Italy) are analyzed. The first is supported by water withdrawals from the Enza alluvial fan, the second by extractions from the hydrogeological unit of the Po River. The goal of the study is to identify and evaluate strategies that allow for a reduction of withdrawals from the Enza aquifer, which is the major groundwater reservoir of the Province, in view of possible future water stress conditions.
Figure 1 provides a planimetric view of the aquifers of interest, together with the location of the well fields. The hydrogeological unit of the Enza River extends from the Apennines towards the floodplains, and consists of alluvial deposits, mainly of gravel in the southern part, and an alternation of gravel and clay in the northern zone. It is the venue of the major well fields for the WSNs of the Reggio Emilia Province, namely Quercioli, Roncocesi, Caprara, and S. Ilario Nuovo. From the hydrochemical point of view, the aquifer is characterized by good water quality. Despite the intensive agricultural activity in the area, the concentration of nitrates is below 50 mg/L. Ammonia is absent, while the presence of iron and manganese is observed locally, in particular in the phreatic compartment, in the municipalities of Montecchio, Bibbiano and S. Ilario d’Enza, and in the lower confined compartment, in the hamlet of Roncocesi, near Reggio Emilia [34].
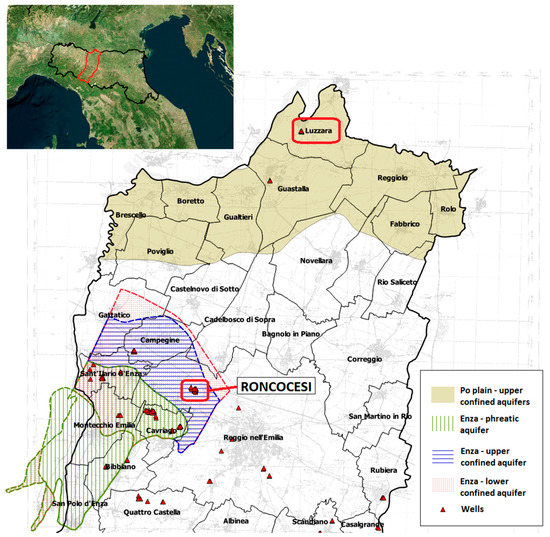
Figure 1.
Location of Reggio Emilia Province, hydrogeological units of the Enza and Po rivers, and main well fields.
On the other side, in the northern part of the Reggio Emilia Province, the aquifer of the Po River extends from Fabbrico to Poviglio, with an east-west direction. This confined unit is characterized by the presence of thick sandy banks, interspersed with clayey materials. High concentrations of iron, manganese, ammonia, hydrogen sulfide, and oxidizable organic substances are detected, threatening water quality. In particular, concentrations of iron and manganese exceed threshold values fixed by the National Regulation [35] in the upper confined compartment. In this area, groundwater shows decreasing ammonium ion concentrations towards the river, while the concentration of sulfates tends to increase. The water flow in the aquifer follows a south-east direction, and the aquifer is mainly fed by the Po River during the whole year [36].
Among WSNs supported by the Enza fan, major withdrawals are derived from the Roncocesi well field, in the northern part of Reggio Emilia. Here, an intensive extraction is achieved by means of 11 active wells, involving, in particular, the upper confined compartment of the Enza aquifer. The well field is characterized by an average nominal flow rate of 33 dm3/s, and an average depth of 71 m. These abstractions represent about 25% of the total withdrawals from the Enza fan. The Roncocesi WSN is connected with the Luzzara one, whose groundwater withdrawals are located in the sedimentary aquifer of the Po River. This well field consists of four active wells, with an average nominal flow rate of 19 dm3/s, and an average depth from ground level of 105 m.
Groundwater withdrawals from the Roncocesi well field are shown in Figure 2a at monthly scale for year 2013. Maximum monthly volumes extracted from the well field are recorded in July (588,944 m3) and September (588,790 m3). The average annual flow introduced in the WSN of Roncocesi and available for civil use is 240.8 dm3/s, considering also the contribution of 30 dm3/s from the well field of S. Ilario Nuovo. In July, the Luzzara well field also displays the maximum extracted volume (188,291.5 m3) while the average annual flow introduced in the WSN of Luzzara is 64.2 dm3/s. Figure 2b depicts the annual trend of withdrawals from the Roncocesi well field, from 2004 to 2014. The contribution from the S. Ilario Nuovo well field began in 2005, leading to a decrease of abstractions from Roncocesi.
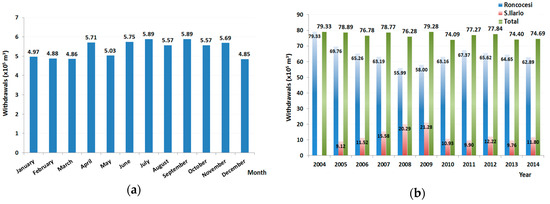
Figure 2.
(a) Monthly trend of withdrawals from the Roncocesi well field in 2013; (b) Annual volumes of groundwater extraction from the Roncocesi well field, with the contribution of S. Ilario Nuovo (2004–2015).
2.1.2. WSNs of Roncocesi and Luzzara
According to data reported in [37], the WSNs of Roncocesi and Luzzara have an extension of 1110.32 km and 23.80 km, respectively. Total length of pipelines is equal to 810.69 km in Roncocesi and 165 km in Luzzara WSNs. Two important parameters describing the efficiency of water supply and distribution networks are the mileage efficiency degree, i.e., the average number of inhabitants served per km of aqueduct, and the compactness of the network, i.e., the km of network referring to a single supply point [37]. High values of mileage efficiency degree indicate functional distribution networks that allow serving several users with few pipelines, while a high compactness index indicates the presence of well-branched networks, with few collection points.
The Roncocesi network is characterized by a mileage efficiency degree of 44.4 inhabitants/km, increasing to 130.24 inhabitants/km for Luzzara. The compactness of the network is 174.64 km for Roncocesi and 47.20 km for Luzzara. These data represent medium-functional distribution networks, whereas the WSNs are well-branched in the territory, with few water supply points. The Roncocesi WSN has several interconnections with some of the adjacent networks. It receives water from the S. Ilario Nuovo and Rubiera networks. The flow from S. Ilario Nuovo is governed by a motorized valve, which under normal conditions stands at values of 30 dm3/s up to 70 dm3/s. The aqueduct of Rubiera feeds the southern part of Correggio. Conversely, the Roncocesi aqueduct supplies water to: (i) the Luzzara network, through the partial feeding of the Reggiolo service reservoir from Bettolino branch; (ii) the Luzzara aqueduct, through the partial feeding of the Baccanello tank; and (iii) the Caprara aqueduct, through the partial feeding of the Gualtieri service reservoir. Table 1 lists the number of inhabitants served by each WSN from 2012 to 2014, while Figure 3a,b depicts the districts served by each aqueduct and the location of the main components inside the WSNs, respectively.

Table 1.
Inhabitants served by Roncocesi and Luzzara water networks from 2012 to 2014.
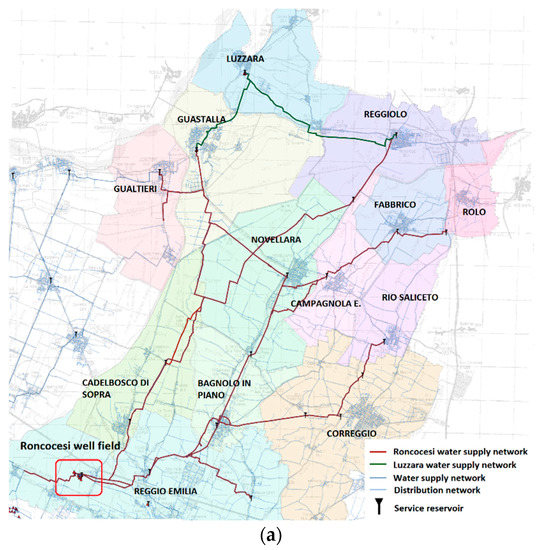
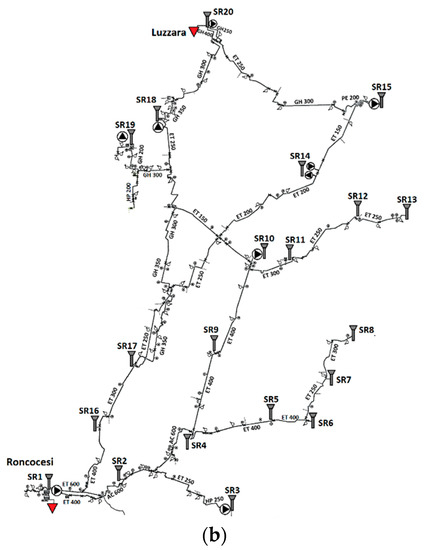
Figure 3.
(a) Districts served by Roncocesi and Luzzara networks; (b) Schematization of Roncocesi and Luzzara networks, with main components.
Water treatment plants remove iron, manganese, and ammonia, by means of biological removal. The filtration system of Roncocesi is able to treat the total annual potential of the entire aqueduct, about 250 dm3/s, and it consists of two single-stage process lines, i.e., (i) a “slow filtration” line, for water from wells characterized by a higher concentration of unwanted substances, and (ii) a “fast filtration” line for the remaining part. The potabilization plant of Luzzara consists of three parallel filtration lines, able to treat the maximum total flow rate of its aqueduct, i.e., 85 dm3/s. Water extracted from the well field is lifted towards the filtration plant, and then sent directly to the storage tank. All lines consist of a first stage of biological filtration, for the removal of iron, manganese and ammonia, and a second stage of activated carbon filtration. Water disinfection with chlorine dioxide is carried out in both plants.
Each WSNs consists of service reservoirs (SRs), directly linked to the districts (see Table 2). All reservoirs are fed by the Roncocesi aqueduct, except for SR15 and SR18 fed jointly by the Luzzara aqueduct, and SR19 partially fed by the Caprara aqueduct. The district of Correggio, linked to SR6, also receives a contribution by the Rubiera aqueduct. In particular, it is possible to estimate the percentage of water distributed by each aqueduct in the different localities, which is 80% from Roncocesi and 20% from Luzzara for the system in 2014 (20,427 m3/day and 4806 m3/day respectively).

Table 2.
Main features of the service reservoirs (SRs) belonging to the Roncocesi and Luzzara networks.
2.1.3. Alternative Water Supply Strategies
Climate change, drop in water availability, and pressures due to population growth are some of the factors forcing water companies to make long-term decisions at the planning and design levels. Water withdrawals from the Roncocesi well field (Figure 2b), are particularly intensive even if, during the last 10 years, their trend is decreasing due to both the contribution from the S. Ilario well field, and to interconnections with near aqueducts, mainly Luzzara. These networks together served about 111,000 inhabitants in 2014 (Table 1), but this value will increase according to the projections of the Italian National Statistics Institute (ISTAT) [38]. In the medium-long term, this would lead to possible water stress conditions for the Enza fan, if combined with a decrease in water availability due to climate change and/or nitrate contamination.
In the following, two different alternative strategies are considered, in which withdrawals from the Enza fan are reduced. These interventions are both based on an alternative water supply strategy, which involves the development of a new well field near Guastalla, to release the northern portion of the Roncocesi aqueduct from the Enza supply. According to this supply management, withdrawals from the new well field in Guastalla would affect the hydrogeological unit of the Po River.
The first alternative strategy, hereinafter Strategy 1 (ST1), entails the detachment of the localities of Bettolino, Reggiolo, San Rocco, Santa Vittoria, the industrial areas of Gualtieri, Gualtieri, and Guastalla from the Roncocesi aqueduct. In ST1, the percentage of water distributed by each aqueduct becomes 69% from Roncocesi, 20% from Luzzara, and 11% from Guastalla, i.e., 17,443 m3/day from Roncocesi, 4950 m3/day from Luzzara, and 2840 m3/day from Guastalla. In this strategy, the construction of a new water treatment plant is expected, and the flow enters the network through direct pumping. Under this configuration, it would be possible to decrease the total amount of withdrawals from Roncocesi by about 14%.
A greater reduction can be obtained if, in addition to the new well field and the associated water treatment plant, a new trunk main is constructed, connecting the well field directly to SR10, previously served by the Roncocesi network. According to this strategy, hereinafter Strategy 2 (ST2), it is possible to decrease the amount of water withdrawals from Roncocesi by about 26%. The new trunk main in ST2, made of cast iron, has a diameter of 300 mm and an approximate length of 11 km. For this strategy, the localities of Novellara, Bettolino, Reggiolo, San Rocco, Santa Vittoria, the industrial area of Gualtieri, and Gualtieri, are detached from the WSN of Roncocesi. In ST2, the percentage of water demand by each aqueduct is 60% from Roncocesi, 20% from Luzzara, and 20% from Guastalla, i.e., 15,033 m3/day from Roncocesi, 4950 m3/day from Luzzara, and 5250 m3/day from Guastalla.
2.2. Hydraulic Simulations
Hydraulic simulations by means of EPANET (EPA - United States Environmental Protection Agency. Link: https://www.epa.gov/water-research/epanet) [39] are used in order to understand and define water flows inside the networks. These simulations allow identifying: (i) the adequacy, in terms of pressures and velocities, of the alternative strategies, and (ii) flow directions within the network, that provide relevant input data for WM2 (Developed for the TRUST – FP7 EU Project – link: https://www.trust-i.net/). The aqueducts are imported from QGIS, allowing to transfer directly features of pipes, i.e., diameter, material, length, and type of service (adduction or distribution). In this phase, a simplification of the networks is achieved by erasing redundant nodes that could lead to numerical errors during hydraulic simulations. Since the interest is not focused on the distribution networks, only pipes with a diameter higher than 250 mm are considered.
2.2.1. Business as Usual (BAU) State
The entire Roncocesi and Luzzara networks are fed by the respective well fields, and water is transferred to the main service reservoirs, SR1 and SR20, located next to the water treatment plants. Water levels in SR1 and SR20 allow fixing the piezometric heads in the entire network, and the relative distribution of flows. All the other SRs are directly linked to the distribution network, and fed only by SR1 and SR20. The water supply system mainly work by gravity, due to the combination of topography and levels imposed by SR1 and SR20.
The Roncocesi and Luzzara well fields are schematized as reservoirs in the model, with assigned hydraulic heads, taken to be equal to the average heights of water levels inside SR1 and SR20 (87 m a.s.l. and 52 m a.s.l. respectively). The other SRs in the networks are modeled as junctions, to which the average daily flow (base demand) is associated with the relative daily variation of demand pattern. Tanks and related rules to control the pumping operation, as well as the pressure valves, are neglected. These simplifications are in line with the purpose of focusing on network flows in the context of a sustainability study. Figure 4a depicts flow trends in correspondence of SR1 and SR20, while Figure 4b shows inflow trends, coincident with the demand pattern, in some of the served localities. The flow contribution from S. Ilario Nuovo is considered in all the simulations.
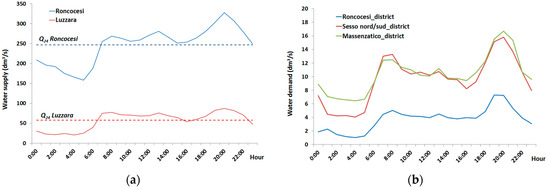
Figure 4.
(a) Average hourly water supply (dm3/s) introduced in Roncocesi and Luzzara networks by the main reservoirs; (b) Average hourly water demand (dm3/s) from Roncocesi, Sesso, and Massenzatico localities. These flows are derived over the day of highest consumption, i.e., 15 July 2013.
The hydraulic simulation is conducted with an hourly time step over the day of highest consumption in 2013 (15 July), in order to account for the most onerous condition for the UWS. Incoming flows to the districts are averaged every hour. The average daily flow rates (Q24) for each district, hereinafter Local Area (LA), and the respective multiplier coefficients are computed to define the variability of the daily flow at the hourly scale (Table 3).

Table 3.
Daily average water demand (dm3/s) from the localities served by Roncocesi and Luzzara networks over the day of higher consumption, i.e., 15 July 2013.
For the sake of simplicity, roughness is assumed to equal 0.1 mm for all pipelines, a value representative of steel material. The Darcy-Weisbach formula is adopted for the evaluation of losses. SR15 and SR18, fed by both the Roncocesi and Luzzara aqueducts, are simplified as demand points where the two incoming flows are added. A flow control valve, i.e., Flow Check Valve (FCV), is introduced before the Baccanello district, in order to limit the incoming flow from Roncocesi. This valve has been adjusted, after several calibration attempts, to the value of 3.5 dm3/s. Figure 5a,b depict flows and velocities in the networks as provided by EPANET simulations.
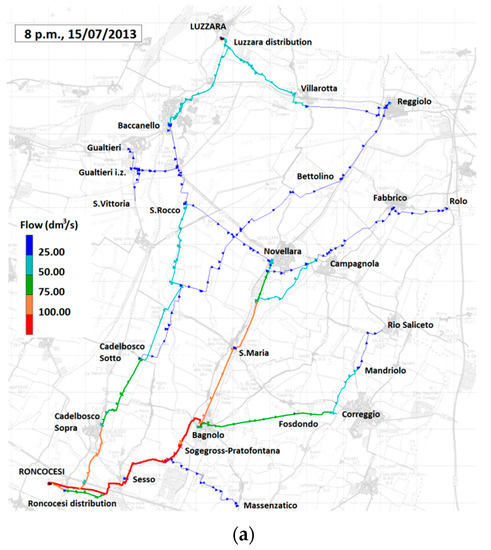
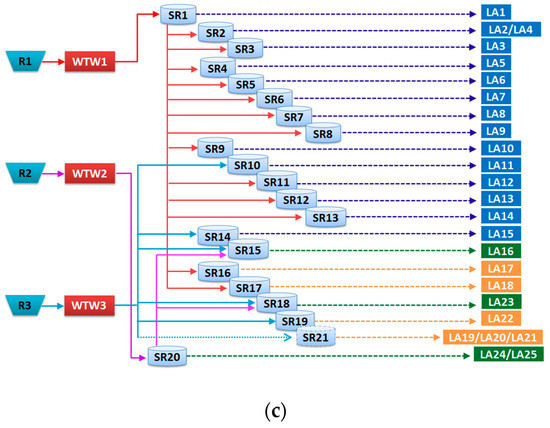
Figure 5.
Hydraulic simulations of Roncocesi and Luzzara water supply systems over the day of highest consumption, i.e., 15 July 2013 at 8 p.m. (a) Flows, and (b) velocities inside the networks.
The SR pressure values reported by the hydraulic models are verified through comparison with the total head, computed by the simulation, and the base elevation of SRs, given by the sum of elevation (as derived through a digital terrain model of the area) and the minimum height of SRs, as reported in Table 2. The total head is almost always higher than the base elevation, except for some tanks where this condition is not met during the most critical hour for consumption, i.e., between 8 and 9 p.m. In fact, the presence of the pumping units upstream of some SRs (i.e., SR3, SR10, SR14, SR15, and SR18) is ignored in the hydraulic simulations, leading to a variation of the actual total head. Figure 6 shows the total head in two different hours of the day, i.e., at 10 a.m. and 8 p.m.
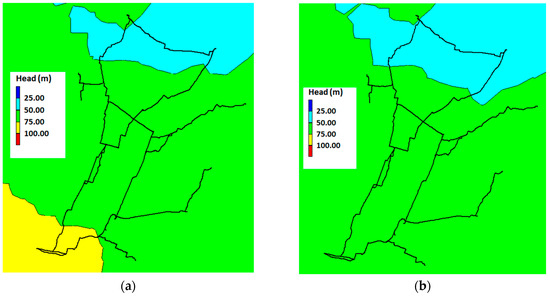
Figure 6.
Contour plots of the total head over Roncocesi and Luzzara networks. (a) Total head at 10 a.m. (b) Total head at 8 p.m.
It is possible to observe an accentuated decrease in the total head, especially in the districts served by the Luzzara aqueduct. Pressure levels enable the estimation of the approximate number of pump operating hours, i.e., pumps are assumed to operate when the total head reported by the EPANET model drops below minimum service level. Table 4 shows the resulting number of operating hours for the pumping units, located upstream the SRs.

Table 4.
Number of operating hours of the pumping units for business as usual (BAU), with total head associated with the relative SR in the networks.
2.2.2. Hydraulic Simulation of the Alternative Strategies
As mentioned above, ST1 considers the construction of a new well field near Guastalla. For the purposes of hydraulic simulation, the new well field is represented as a SR with total head of 76 m a.s.l., to account for the direct injection inside the network, and is connected to the Luzzara aqueduct. The total head of SR1 is supposed to be the same as the BAU, while SR20 is replaced with a junction with the same incoming flows, i.e., base demand and demand pattern, defined in the BAU. The same water demand levels from each LA are applied in both the SR1 and BAU scenario; hence, Q24 values are still those included in Table 3. The pipeline, connecting LA19 with SR10, is closed near SR10, to account for the new distribution. An FCV valve is added before LA19, on the incoming pipeline from Roncocesi, and is set at 0 dm3/s, so that this area is served only by the new well field. The pipe south of the crossroad of Via Della Vittoria is also closed, to release the branch to SR14 from the contribution of Roncocesi. Under this configuration, it is possible to relieve the feeding from Roncocesi up to a maximum value of 50 dm3/s, and an average flow of 40 dm3/s. The whole area north of SR10 no longer receives input from Roncocesi, but only from the new Guastalla well field and from Luzzara. In Figure 7a, the flows derived by EPANET simulation are shown. Figure 7b depicts the trend of the flows introduced respectively by the reservoirs that feed the networks, i.e., SR1, SR20, and Guastalla well field. Under this configuration, it is possible to observe a better distribution of the total head, as depicted in Figure 7c, while pipes velocities are within the standard limits, i.e., between 0.5 and 2 m/s.
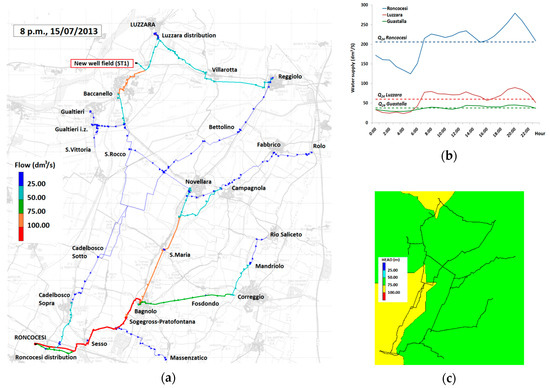
Figure 7.
Hydraulic simulations of ST1 over the day of highest consumption (15 July 2013). (a) Flows derived at 8 p.m. (b) Average hourly water supply (dm3/s) introduced in Roncocesi, Luzzara, and Guastalla networks by the main reservoirs; (c) Contour plot of the total head over the networks at 8 p.m.
ST2 provides for the realization of the new well field, north of Guastalla, with the relative water treatment plant and injection into the network through direct pumping, together with the construction of a new feeding water pipeline, connecting the Guastalla well field with the pipeline south of SR14, and the district served by SR10. The new well field is schematized as a SR with a total head of 69 m. The same assumptions are considered for SR1 and SR20 reservoir, as in ST1. Again, Q24 for each locality does not vary, and the demand pattern is the same as for the BAU. In addition to the valves inserted for ST1, the pipeline connecting SR9 with SR10, after the branch for SR13, is closed by means of a FCV valve installed south of SR10, to avoid the supply from Roncocesi aqueduct to Novellara. Under this configuration, the new well field only feeds SR10. The design intervention would allow a remission of the Roncocesi well field up to a maximum value of 90 dm3/s, and on average of 60 dm3/s. Figure 8a depicts the flows derived in ST2, during the most critical hour, 8 p.m. in the day of maximum consumption, 15 July 2013. In Figure 8b, the trend of the flows introduced respectively by the reservoirs that feed the networks is shown; here, it is possible to observe the increase of withdrawals from the new well field respect ST1. Figure 8c displays the total head on the entire network, revealing a better distribution of the pressure with respect to the BAU.
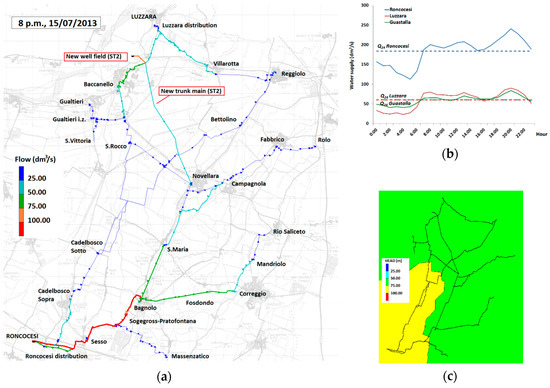
Figure 8.
Hydraulic simulations of ST2 over the day of higher consumption (15 July 2013). (a) Flows derived at 8 p.m.; (b) Average hourly water supply (dm3/s) introduced in Roncocesi, Luzzara, and Guastalla networks by main reservoirs; (c) Contour plot of the total head over the networks at 8 p.m.
By analyzing the distribution of the total head, it is possible to evaluate the number of hours with total head lower than the minimum level fixed by the tanks inside the networks. In particular, as shown in Table 5, it can be observed that the pumping units upstream SR18 and SR15 are no longer necessary with respect to the BAU. In general, this leads to a decrease of the number of hours where the pumping units should be active.

Table 5.
Number of operating hours of pumping units for ST1 and ST2, with total head associated with the relative SR in the networks.
2.3. Metabolic Model of the Networks
2.3.1. WaterMet2
The metabolic model of Roncocesi and Luzzara WSNs, for the BAU and alternative strategies, is realized by means of WaterMet2 (WM2). WM2 is an integrated conceptual mass-balance-based model, able to quantify the performance of the integrated UWS, with a focus on sustainability-related issues over a long-term time horizon [18]. This approach can be adopted for the development of risk assessment models and to help water companies in the decision-making process. The metabolic model applied to the UWS considers the flows and transformation processes of all types (materials and energy) involved in the development and operation of the system. This allows the computation of KPIs to measure the level of sustainability of the services for the current management strategy, and to select the most effective intervention strategy to improve the current and/or future level of sustainability [13].
The integrated modelling involves the simulation of key processes and components of the water service, considered as an interconnected system. Specifically, WM2 is able to consider different flows involved in the UWS; these flows can be aggregated temporally and spatially to derive the basic performance metrics [30]. Main flows involved are: (i) water flows, including potable water, storm water, grey water, green water, recycling water, and wastewater; (ii) energy fluxes, consumed by each component of the UWS for transmission, operation and on-site water treatment options; (iii) greenhouse gas (GHG) emissions [40,41]; (iv) acidification/eutrophication fluxes; (v) material fluxes, linked to the UWS assets and their characteristics, with focus on the water distribution and sewer pipelines; (vi) chemical fluxes used in the different UWS components. Consequently, a series of indicators are estimated, such as the total amount of delivered water, the electricity used within the system, the greenhouse gases (GHG) emissions, the operational and maintenance costs, the risk and intervention assessments for each component/phase or for the whole system, on a defined time horizon.
WM2 mimics the entire UWS through the definition of three major subsystems dealing with water supply, storm water and wastewater [42]. Boundaries of the analyzed system are represented by the sources and final receptors, which respectively supply and receive water. The tanks represent physical components able to store water, and where processes related to the resource can occur, while the water flows identify each physical component capable of transporting water between one tank to another [43]. Four spatial scales can be adopted to simulate the main flows and processes: (i) indoor area; (ii) Local Area (LA); (iii) sub-catchment area (SC); (iv) system area. The indoor area is the smallest spatial scale, representing a single property, without any surroundings; at this level, indoor water demand profiles are defined, based on daily average water demand per capita or detailed information on water consumption for residential appliances and fittings. Indoor areas characterized by the same per capita water demand can be grouped to form an LA; at this scale, different type of water demands, rainfall-runoff and on-site treatment options can be handled. Higher spatial levels involve the SC and system area. The first represents a group of neighboring LAs, serving as a “collection point” in both simplified water supply and a separate/combined sewer system; the system area consists of different SCs, grouped based on similar features in the urban drainage system, i.e., topology, gravity, in storm water/wastewater collection systems.
Although the model can be applied to the whole UWS, here the focus is on the WSN subsystem, where the elements required are: (i) storage components, divided in raw water resources, Water Treatment Works (WTWs), and SRs; (ii) principal flow “routes”, such as water supply pipes, trunk mains, and distribution mains; (iii) SCs, assumed to be the water consumption points. A “source to tap” approach is employed to simulate the water supply subsystem, and the simulation is carried out in two steps [44]. First, daily water demand in the modelled components (LAs or SCs) is evaluated starting from the most downstream point, and aggregated towards the most upstream point (water resources), considering leakages of the conveyance elements [25]. The daily volume of water demand for water resource i and day t (RDi,t) is given by:
where WDj,t is the water demand of WTWj at day t; CFi,j is the percentage of water demand in resource i, transferred by each water supply pipe ij feeding a single WTWj; m is the number of WTWs; CLi,j the leakage percentage pertaining to water supply conduit ij to the water demand of the pipe. The second step involves water withdrawal and conveyance to downstream elements sequentially. Here, governing equations refer to the capacity control of storage elements. The released/abstracted water is distributed among SCs and finally provided to water consumers. A mass balance relationship is applied to compute the water volume of a storage component in consecutive days:
where Si,t and Si,t+1 are the volume of component i for day t and t + 1, respectively; Ii,t is the inflow to component i for day t, and Di,t is the output for component i for day t.
RDi,t = ∑j=1 to m CFi,j × WDj,t (1 + CLi,j/100)
Si,t+1 = Si,t + Ii,t − Di,t
Finally, WM2 considers the impact of climate change by providing climate time series, properly projected over the time horizon of interest, and evaluating the decrease in water resources availability. These analyses are not developed within the model, but represent input information previously derived based on climate projections provided by the Intergovernmental Panel on Climate Change (IPCC).
2.3.2. Metabolic Model of BAU and Alternative Strategies
For the BAU, as well as for the two alternative strategies, the water demand related to each resource is assessed with WM2 through a mass balance based on average per capita water consumption data, associated with each LA, EPANET simulations and available water consumption reports [45]. The first step of modelling is the definition of the SCs in the area of interest, and in particular of the LAs, i.e., localities and districts served by the Roncocesi and Luzzara aqueducts. In this analysis, LAs, reported in Table 3, are shown in Figure 9, with different colors according to the SC. Three different SCs are identified in the area of interest. Here, a new “dummy” SR (SR21), with no energy and chemicals used, is added, in order to serve LA19, LA20, LA21. Water allocation coefficients, namely split coefficients, between the upstream and downstream components (e.g., WTW-SR or SC-SR), are necessary to define the topology of the system. In particular, these coefficients are used if two or more components (e.g., service reservoir) supply water to a downstream component (e.g., sub-catchment) [46]. Table 6 lists the split coefficients between the SCs and SRs, as derived from EPANET simulations and technical reports provided by the water company. These values do not change in all the intervention strategies.
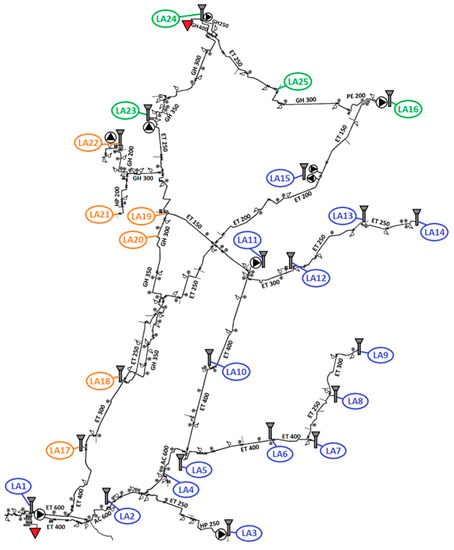
Figure 9.
Distribution of Local Areas (Las) according to the WM2 model. Here, the different colors represent their distribution among the sub-catchment areas (SCs) LA1-LA15: SC1, LA17-LA22: SC2; LA16, LA23-LA25: SC3.

Table 6.
Split coefficients between SCs and SRs, i.e., the served LAs directly linked.
The LAs in WM2 are described by the number of inhabitants and properties, which are derived from data provided by the Water Company IREN, and ISTAT [38,45]. The per capita indoor water demand is assessed for each LA, and the variation of the demand is assigned over the defined time horizon. The annual population increase rate assumed for the analysis represents a medium growth scenario, derived by ISTAT [38], as depicted in Figure 10a. Variation of the indoor water demand follows the population growth on a yearly basis, according to available predictions; in addition, monthly coefficients are applied in order to mimic seasonal variations [47].
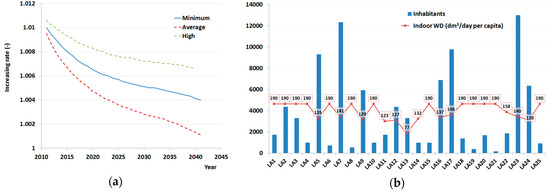
Figure 10.
(a) Annual population-increase rate derived for the Emilia-Romagna Region [32]; (b) LAs served by the UWS, correspondent inhabitants and water demand based on indoor consumption.
Per capita water consumption, leakage and other water demands, e.g., industrial and commercial, are assumed constant within the selected time horizon for all simulations. In particular, flows derived by EPANET simulations for the BAU are converted in order to obtain the total annual inflow to the WSNs for 2014, i.e., 9,210,080 m3, with 7,456,030 m3 belonging to the Roncocesi network, and 1,754,050 m3 from Luzzara. The adoption of these flow values is justified by the calibration of electricity consumptions in the networks, recorded by the Italian National Electrical Energy Agency (ENEL), and available only for 2014. In particular, annual values of 718,163 kWh and 3,210,716 kWh are recorded for the Luzzara and Roncocesi water treatment plants, respectively. Data was not available for all LAs included in this study, as such where data was missing, a water demand of 190 dm3/inhabitant/day was assumed [45]; the adoption of this value, derived via trial and error calibration, ensures that the calculated potable water use closely matches the recorded potable water supply in the network. Figure 10b shows the number of inhabitants served and the available/calibrated indoor water demand (dm3/day per capita) for each LA considered in this study.
After the calibration of the indoor water demand for some LA, the topology of the water supply system is defined. The system storage components, i.e., sources, WTWs, SRs and SCs, are connected through their respective pipelines. Therefore, appropriate connections must be defined between (i) water resources and WTWs through water supply conduits, (ii) WTWs and SRs through trunk mains, and finally (iii) SRs with SCs, and their respective LAs through distribution mains. In particular, the system is fed by two main water resources in the BAU, i.e., Roncocesi (R1) and Luzzara (R2), linked to SR1 and SR20, while the other reservoirs are directly linked to the corresponding LAs. In the alternative strategies, the system configuration changes since a new water resource, i.e., Guastalla (R3) is introduced, according to the new well field. WM2 is not able to consider interconnected SRs, hence the new water resource is connected directly to the corresponding WTW and split coefficients between WTWs and the tanks are adjusted if needed. Figure 11 depicts the conceptual models of the BAU and the alternative strategies. Here, different connections between SRs derive from the distribution of flows computed by means of EPANET simulations. Table 7 shows the split coefficients between WTWs and SRs adopted for each simulation. These values are computed by means of EPANET simulations, based on the system performance during the time of peak demand.
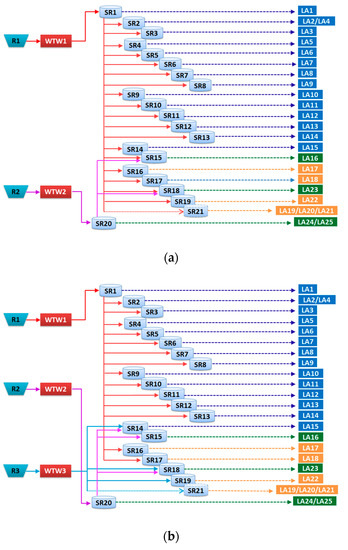
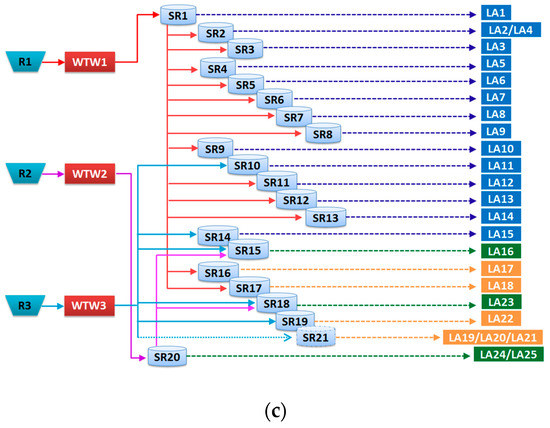
Figure 11.
Conceptual models of Water Supply Networks (WSNs) for (a) BAU, (b) ST1, and (c) ST2. Here, R1, R2 and R3 refer to the main well field, i.e., Roncocesi (R1), Luzzara (R2), and (R3) Guastalla.

Table 7.
Split coefficients between SRs and Water Treatment Works (WTWs) adopted in the BAU and analyzed strategies.
After defining the schematization of the network and distribution of flows, features of the different system components are introduced. These data are related to the volume of storage components, and to the transmissivity capacity of link components. Groundwater reservoirs are considered to have infinite capacity in the model; as a result, the outflows from the well fields are assumed equal to those entering the WTWs. The transmission capacities of the water supply conduits and treatment capacity of the WTWs are computed as the sum of flows in the trunk mains leaving the WTWs, determined on the basis of an average velocity equal to 1.8 m/s. As such, it is possible to consider the trunk mains, as well as the other components of the network, as non-limiting factors for the mass balance.
Subsequently, the volumes of the SRs in the Roncocesi and Luzzara networks are estimated. Since the physical volume of the reservoirs is a limiting factor for the model, their volume is assumed equal to the transmission capacity of the relative trunk mains; if the SR is fed by more trunk mains, the sum of the transmission capacities of the trunk mains is considered. Finally, the transmission capacities of the distribution mains are computed by means of the diameters of the pipelines and assuming an average allowable velocity of 2 m/s.
It is then necessary to include an estimate of the energy and chemical consumptions within the network. Based on the values provided by the Water Company IREN, individual energy contributions in kWh/m3 are estimated for each component of the Roncocesi and Luzzara plants. In particular, the electricity meter displays, for the year 2014, a total value of 0.43 kWh/m3 for the Roncocesi plant, and 0.41 kWh/m3 for the Luzzara one. These values are apportioned among the pumping wells, internal processes in the power plant (pressure filter system, backwashing, and aeration compressors), and pumping to the tanks inside the water treatment plant. Table 8 shows the single contributions for each WTW. In particular, the energy consumption of the water treatment plant of Guastalla, associated to the new well field, is assumed to be similar to the one of Luzzara, while the average values of total head, i.e., 55 m in ST1, and 51 m in ST2, are assumed to take into account the direct pumping in the network. The energy contributions due to pumping units to the SRs are computed from EPANET simulations, which allow estimating an average operating time of individual pumps, if present, as reported in Table 4 and Table 5. Table 9 lists the values of each energy contribution from pumping units, assuming an average efficiency of 65%.

Table 8.
Energy contribution for water treatment plants for BAU and alternative strategies.

Table 9.
Energy contribution from pumping units upstream SRs for BAU and alternatives strategies.
Finally, the chemical concentrations of the reagents needed for the WTWs and SRs are considered. In particular, 7.5% sodium chlorite and 9% hydrochloric acid are used within the plants. In Roncocesi treatment plant, the concentrations of the two reagents is 0.004 kg/m3, while the value for Luzzara is 0.01 kg/m3. Since the concentration data in the SRs are not available, an average chlorine concentration of 0.01 kg/cm3 is assumed. Table 10 reports the default coefficients, employed in the models for the computation of energy and emissions associated with chemical compounds.

Table 10.
Default coefficients, employed in WM2, for the computation of energy and emissions associated with chemical compounds.
3. Results and Discussion
A time horizon of 30 years is simulated with WM2, with a daily time step, to compare the BAU and two alternative strategies by means of proper KPIs. In this study, the most interesting indicators are those related to water, energy, and chemical consumption, which influence costs and emissions.
In the following, results of metabolic simulations are illustrated. On the simulation horizon, the water demand from the SCs is satisfied both for the BAU and for the two alternative strategies. Figure 12 depicts the daily trend of flows within the network, i.e., the delivered water demand to the districts. In particular, the total delivered water demand is obtained from the sum of the contributions of the SCs, and the demand changes according to the population growth rate, which affects only the domestic water consumption. It is possible to observe that the highest demand derives from SC1, while the other two SCs are characterized by a lower demand. The trend of this indicator does not change in the three strategies, as the water demands of the SCs do not vary as well.
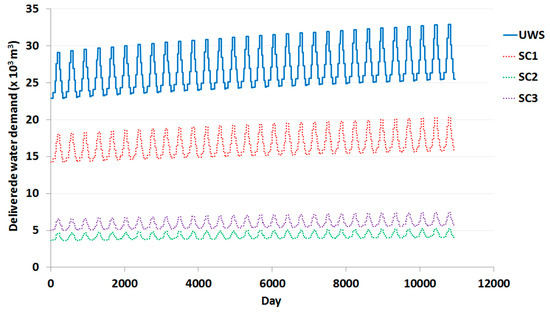
Figure 12.
Total delivered water demand in the UWS and in the different SCs.
In order to compare the different strategies analyzed, results in terms of water balance, energy consumption and chemical usage have been investigated. Figure 13a shows the delivered water demand from the Roncocesi well field, under the three intervention strategies of interest, confirming the expected reduction in water withdrawals from the Enza fan, resulting from the inclusion of the new well field. These results are depicted for the first and last year of simulation. It is possible to observe that the decrease of 14% (ST1) and 26% (ST2) is maintained over the entire simulation period. At the same time, the increment in the delivered water demand in time, assumed to equal 20% over 30 years, and corresponds to the increment in the indoor water demand that is affected by population growth, while the industrial and commercial demand is supposed to be constant over the entire simulation period. This in turns causes an increase of 12% of the total water demand in the UWS.
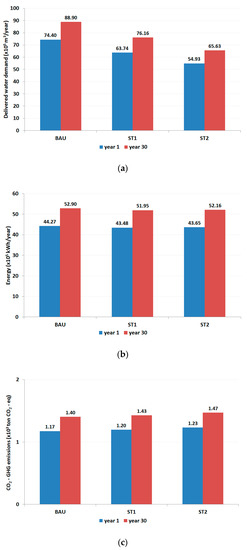
Figure 13.
(a) Delivered water demand (m3/year) from the Roncocesi well field for the first and last simulation year and for the three alternative configurations (BAU, ST1, ST2); (b) same as (a) but referred to the total energy (kWh) consumed by the UWS; (c) same as (a) but referred to CO2 emissions (ton CO2-eq) produced by the UWS.
Figure 13b depicts the total energy consumed by the UWS, including electricity and energy derived from indirect sources, such as materials and chemical compounds. Electricity is mainly consumed by pumping activities at the well fields, in water treatment plants, and by local pumping for the transmission of water to SRs inside the network. The total energy is obtained by multiplying a predefined constant (in kWh/m3) derived by EPANET simulations and technical data, by the volume of water in each component of interest. The results obtained from the simulations show that electric energy tends to decrease in both alternative strategies with respect to the BAU. In particular, the electric energy decreases 3% in ST1 and 4% in ST2; the total energy decreases of 2% in ST1, while it decreases of 1% in ST2. These variations are due to the presence of the new well field and by the relative decrease in the amount of local pumping inside the network. The embodied energy tends to increase in both alternative strategies, due to new materials associated with the new well field, in ST1 and ST2, and pipes, only in ST2.
Figure 13c shows the carbon dioxide (CO2) emissions produced by the UWS due to fossil fuel combustion and embodied in materials and chemicals in all UWS components. This indicator is determined by multiplying the amount of energy, chemicals and materials consumed by appropriate conversion coefficients. The only factors able to generate indirect emissions are the chemical compounds introduced in the water treatment plants, and in the SRs for disinfection, while materials of pipelines are not defined, hence no corresponding energy is associated. The conversion factors are expressed as kg of CO2 equivalent per consumption unit. Respect to the BAU, ST1 shows an increase of CO2 emissions of 2%, while ST2 produces an increase of 3%. As for the embodied energy, its increase is attributable to the increase in materials and chemicals associated with the alternative strategies.
4. Conclusions
A sustainability study of the WSNs of Roncocesi and Luzzara, located in the Reggio Emilia province, has been presented in this paper. The analysis focused on the comparison of alternative solutions for the reduction of water withdrawals from the major groundwater body of the Reggio Emilia Province, namely the Enza aquifer. Two WSNs were considered in this study, the Roncocesi and Luzzara networks, the first characterized by the most intensive extractions from the Enza fan of the entire Province. Three alternative intervention strategies, the BAU and the strategies ST1 and ST2, envisaging respectively the construction of a new well field interesting the aquifer of the Po River (ST1), or combined with the realization of a new pipeline (ST2), were analyzed and compared by means of the metabolic model WM2, which computes KPIs related to water balance, energy consumption, and GHG emissions. The hydraulic behavior of the system under the three different strategies was preliminarily obtained by means of EPANET simulations.
With respect to the BAU, the two alternative strategies showed a decrease in energy consumption, due to a redistribution of the total head in the new plant configurations, and an irrelevant variation in GHG emissions. The decrease in energy consumption would directly affect the operational costs of the WSNs management, but this issue was not analyzed in the present study, because this voice would be compared with capital costs, such as the construction of the new well field and WTW, or the addition of the new pipeline, and these costs are not considered in WM2. The KPIs selected in this study were limited to a number of main technical and environmental metrics, of considerable importance for water companies to manage WSNs; other criteria, such as social metrics, were not considered here, and should be taken into account in order to support the decision-making process.
The present study can be extended in several respects; the most promising is the incorporation of the results obtained via WM2 into a Multi Criteria Analysis, to improve the comparison of the impacts of the alternative strategies. The adoption of a comprehensive approach to the UWS requires, in general, simplified models based on mass balance analysis such as WM2. Here, we couple simplified physically based models, usually requiring detailed input data, with conceptual models. The hydraulic simulations (by means of EPANET) of the WSNs allow comparing possible alternative intervention strategies in terms of feasibility. This, combined with WM2, leads to the investigation of the sustainability of the selected intervention strategies, and increases the confidence in these strategies. This study focuses only on the WSN, but it can be extended to the whole UWS. A further analysis can include the impact of climate change directly in the WM2 model, by providing climate time series (properly projected over the time horizon of interest) and evaluating the decrease in water resource availability. These analyses are not developed within the model, but represent input information to be derived through preliminary studies and based on the climate projections provided by the IPCC.
This approach introduces a simplification in the schematization of the real network behavior but, at the same time, turns out to be a powerful tool for long-term strategic analysis, as alternative intervention strategies can be easily compared under multiple perspectives.
Author Contributions
G.F., I.L. and V.C. developed the WaterMet2 models. G.F. and I.L. performed the EPANET simulations. V.D.F., P.P. and V.C. analyzed the results of this work.
Funding
This research was supported by “Definizione e applicazione di criteri di sostenibilità nei sistemi idrici urbani gestiti da IREN Acqua Gas a supporto delle decisioni strategiche di lungo periodo”, a two-year research agreement between the Department of Civil, Chemical, Environmental and Materials Engineering (DICAM) of the University of Bologna, and IREN Acqua Gas.
Acknowledgments
The authors wish to acknowledge IREN Spa for providing data and supporting the realization of the work; in particular: C. Ziveri, G. Panini and F. Ferretti for their kind support and for the fruitful discussions. The authors also wish to acknowledge Kourosh Behzadian, for his kind assistance with WaterMet2 and his useful suggestions.
Conflicts of Interest
The authors declare no conflict of interest.
References
- Nair, S.; George, B.; Malano, H.M.; Arora, M.; Nawarathna, B. Water–energy–greenhouse gas nexus of urban water systems: Review of concepts, state-of-art and methods. Resour. Conserv. Recycl. 2014, 89, 1–10. [Google Scholar] [CrossRef]
- Barros, V.R.; Field, C.B.; Dokken, D.J.; Mastrandrea, M.D.; Mach, K.J.; Bilir, T.E.; Chatterjee, M.; Ebi, K.L.; Estrada, Y.O.; Genova, R.C.; et al. Climate change 2014: Impacts, adaptation, and vulnerability. Part B: Regional aspects. In Climate Change 2014: Impacts, Adaptation, and Vulnerability—Contribution of Working Group II to the Fifth Assessment Report of the Intergovernmental Panel on Climate Change; Cambridge University Press: Cambridge, UK; New York, NY, USA, 2014; p. 688. [Google Scholar]
- Kanakoudis, V.; Tsitsifli, S.; Papadopoulou, A.; Cencur Curk, B.; Karleusa, B. Water resources vulnerability assessment in the Adriatic Sea region: The case of Corfu Island. Environ. Sci. Pollut. Res. Int. 2017, 24, 20173–20186. [Google Scholar] [CrossRef] [PubMed]
- Hoekstra, A.Y.; Mekonnen, M.M.; Chapagain, A.K.; Mathews, R.E.; Richter, B.D. Global monthly water scarcity: Blue water footprints versus blue water availability. PLoS ONE 2012, 7, e32688. [Google Scholar] [CrossRef] [PubMed]
- Georgi, B.; Isoard, S.; Kurnik, B.; Foltescu, V.L.; Swart, R.J.; Marinova, N.; Van Hove, B.; Jacobs, C.M.J.; Klostermann, J.E.M.; Kazmierczak, A.; et al. Urban Adaptation to Climate Change in Europe. Challenges and Opportunities for Cities together with Supportive National and European Policies; European Environmental Agency (EEA) Report: Copenhagen, Denmark, 2012. [Google Scholar]
- Van Leeuwen, C.J.; Koop, S.H.A.; Sjerps, R.M.A. City blueprints: Baseline assessments of water management and climate change in 45 cities. Environ. Dev. Sustain. 2016, 18, 1113–1128. [Google Scholar] [CrossRef]
- Fowler, H.J.; Kilsby, C.G.; O’Connell, P.E. Modeling the impacts of climatic change and variability on the reliability, resilience, and vulnerability of a water resource system. Water Resour. Res. 2003, 39, 1222–1233. [Google Scholar] [CrossRef]
- Hashimoto, T.; Stedinger, J.R.; Loucks, D.P. Reliability, resiliency, and vulnerability criteria for water resource system performance evaluation. Water Resour. Res. 1982, 18, 14–20. [Google Scholar] [CrossRef]
- OECD. Water and Cities: Ensuring Sustainable Futures; OECD Studies on Water; OECD Publishing: Paris, France, 2015. [Google Scholar]
- Behzadian, K.; Kapelan, Z.; Morley, M. Resilience-based performance assessment of water-recycling schemes in urban water systems. Procedia Eng. 2014, 89, 719–726. [Google Scholar] [CrossRef]
- Hernández-Bedolla, J.; Solera, A.; Paredes-Arquiola, J.; Pedro-Monzonís, M.; Andreu, J.; Sánchez-Quispe, S.T. The assessment of sustainability indexes and climate change impacts on integrated water resource management. Water 2017, 9, 213. [Google Scholar] [CrossRef]
- Van Leeuwen, K.; Marques, R.C. Current State of Sustainability of Urban Water Cycle Services. Towards a Baseline Assessment of the Sustainability of Urban Water Cycle Services; TRansition to Urban water Services of Tomorrow (TRUST) Technical report D11.1; TRUST (TRansitions to the Urban Water Services of Tomorrow) Project. 2012. Available online: https://www.trust-i.net/readpublicfile.php?fl=68 (accessed on 2 March 2019).
- Venkatesh, G.; Brattebø, H. Energy consumption, costs and environmental impacts for urban water cycle services: Case study of Oslo (Norway). Energy 2011, 36, 792–800. [Google Scholar] [CrossRef]
- Bonoli, A.; Di Fusco, E.; Zanni, S.; Lauriola, I.; Ciriello, V.; Di Federico, V. Green Smart Technology for Water (GST4Water): Life cycle analysis and sustainability assessment of urban water consumption. In Water; 2019; submitted for publication. [Google Scholar]
- Liserra, T.; Maglionico, M.; Ciriello, V.; Di Federico, V. Evaluation of reliability indicators for WDNs with demand-driven and pressure-driven models. Water Resour. Manag. 2014, 28, 1201–1217. [Google Scholar] [CrossRef]
- Felisa, G.; Ciriello, V.; Di Federico, V. Saltwater intrusion in coastal aquifers: A primary case study along the Adriatic coast investigated within a probabilistic framework. Water 2013, 5, 1830–1847. [Google Scholar] [CrossRef]
- Kennedy, C.; Pincetl, S.; Bunje, P. The study of urban metabolism and its applications to urban planning and design. Environ. Pollut. 2011, 159, 1965–1973. [Google Scholar] [CrossRef] [PubMed]
- Venkatesh, G.; Brattebø, H.; Sægrov, S.; Behzadian, K.; Kapelan, Z. Metabolism-modelling approaches to long-term sustainability assessment of urban water services. Urban Water J. 2015, 14, 11–22. [Google Scholar] [CrossRef]
- Savic, D.; Bicik, J.; Morley, M.; Duncan, A.; Kapelan, Z.; Djordjević, S.; Keedwell, E. Intelligent urban water infrastructure management. J. Indian Inst. Sci. 2013, 93, 319–336. [Google Scholar]
- Rathnayaka, K.; Malano, H.; Arora, M. Assessment of sustainability of urban water supply and demand management options: A comprehensive approach. Water 2016, 8, 595. [Google Scholar] [CrossRef]
- Newman, P.W.G. Sustainability and cities: Extending the metabolism model. Landsc. Urban Plan. 1999, 44, 219–226. [Google Scholar] [CrossRef]
- Kenway, S.J.; Gregory, A.; McMahon, J. Urban water mass balance analysis. J. Ind. Ecol. 2011, 15, 693–706. [Google Scholar] [CrossRef]
- Van Leeuwen, C.J.; Frijns, J.; Van Wezel, A.; Van De Ven, F.H.M. City blueprints: 24 indicators to assess the sustainability of the urban water cycle. Water Resour. Manag. 2012, 26, 2177–2197. [Google Scholar] [CrossRef]
- Mitchell, V.G.; Mein, R.G.; McMahon, T.A. Modelling the urban water cycle. Environ. Model. Softw. 2001, 16, 615–629. [Google Scholar] [CrossRef]
- Mitchell, V.; Diaper, C. UVQ: A tool for assessing the water and contaminant balance impacts of urban development scenarios. Water Sci. Technol. 2005, 52, 91–98. [Google Scholar] [CrossRef] [PubMed]
- Mitchell, V.; Diaper, C. Simulating the urban water and contaminant cycle. Environ. Model. Softw. 2006, 21, 129–134. [Google Scholar] [CrossRef]
- Makropoulos, C.K.; Natsis, K.; Liu, S.; Mittas, K.; Butler, D. Decision support for sustainable option selection in integrated urban water management. Environ. Model. Softw. 2008, 23, 1448–1460. [Google Scholar] [CrossRef]
- Venkatesh, G.; Sægrov, S.; Brattebø, H. Dynamic metabolism modelling of urban water services—Demonstrating effectiveness as a decision-support tool for Oslo, Norway. Water Res. 2014, 61, 19–33. [Google Scholar] [CrossRef] [PubMed]
- Behzadian, K.; Kapelan, Z. Advantages of integrated and sustainability based assessment for metabolism based strategic planning of urban water systems. Sci. Total Environ. 2015, 527, 220–231. [Google Scholar] [CrossRef] [PubMed]
- Behzadian, K.; Kapelan, Z.; Venkatesh, G.; Brattebø, H.; Sægrov, S.; Rozos, E.; Makropoulos, C. Quantitative UWS Performance Model: Watermet2; TRansition to Urban water Services of Tomorrow (TRUST) Technical report D33.2; TRUST (TRansitions to the Urban Water Services of Tomorrow) Project. 2014. Available online: https://www.trust-i.net (accessed on 2 March 2019).
- Hendriks, C.; Obernosterer, R.; Müller, D.; Kytzia, S.; Baccini, P.; Brunner, P.H. Material Flow Analysis: A tool to support environmental policy decision making. Case-studies on the city of Vienna and the Swiss lowlands. Local Environ. 2000, 5, 311–328. [Google Scholar] [CrossRef]
- TRansitions to the Urban Water Services of Tomorrow (TRUST). Available online: www.trust-i.net (accessed on 19 December 2018).
- Felisa, G.; Lauriola, I.; Ciriello, V.; Di Federico, V. Metabolic modelling: A strategic planning tool for water supply systems management. Proceedings 2018, 2, 585. [Google Scholar] [CrossRef]
- Regione Emilia-Romagna. Delibera di Giunta n. 1781, “Aggiornamento del quadro conoscitivo di riferimento (carichi inquinanti, bilanci idrici e stato delle acque) ai fini del riesame dei Piani di Gestione Distrettuali 2015–2021”; All. 5—Valutazione dello stato delle acque sotterranee. Available online: http://ambiente.regione.emilia-romagna.it/acque/informazioni/documenti/aggiornamento-del-quadro-conoscitivo-di-riferimento-carichi-inquinanti-bilanci-idrici-e-stato-delle-acque-ai-fini-del-riesame-dei-piani-di-gestione-distrettuali-2015-2021 (accessed on 31 May 2018).
- Decreto Legislativo 3 aprile 2006, n. 152. Norme in materia ambientale. GU n. 88, 14/04/2006; Suppl. Ordinario n. 96. Available online: http://www.gazzettaufficiale.it/atto/serie_generale/caricaDettaglioAtto/originario?atto.dataPubblicazioneGazzetta=2006-04-14&atto.codiceRedazionale=006G0171 (accessed on 19 December 2018).
- Emilia-Romagna: Servizio geologico, sismico e dei suoli. Individuazione di risorse idriche alternative: progetto pilota: guida metodologica/Regione Emilia-Romagna Servizio geologico sismico e dei suoli; Interreg 3.b Medocc, Bassins versants mediterranees; Regione Emilia-Romagna: Bologna, Italy, 2007; p. 62. [Google Scholar]
- Atersir. Deliberazione del Consiglio d’ambito n. 45 del 29 settembre 2015—Servizio Idrico Integrato. Reggio Emilia, Approvazione del Piano d’Ambito del bacino territoriale. Available online: http://www.atersir.it/atti-documenti/deliberazione-del-consiglio-dambito-n-45-del-29-settembre-2015 (accessed on 31 May 2018).
- ISTAT. Previsioni Demografiche—Anni 2011–2065-dati pre-Censimento 2011 di Fonte Anagrafica. Available online: http://dati.istat.it/Index.aspx?DataSetCode=DCIS_PREVDEM (accessed on 31 May 2018).
- Rossman, L.A. EPANET, Users Manual; National Risk Management Research Laboratory Office of Research and Development, U.S. Environmental Protection: Cincinnati, OH, USA, 2000.
- Kanakoudis, V.; Tsitsifli, S.; Papadopoulou, A. Integrating the carbon and water footprints’ costs in the water framework directive 2000/60/EC full water cost recovery concept: Basic principles towards their reliable calculation and socially just allocation. Water 2012, 4, 45–62. [Google Scholar] [CrossRef]
- Kanakoudis, V.; Papadopoulou, A. Allocating the cost of the Carbon Footprint produced along a supply chain, among the stakeholders involved. J. Water Clim. Chang. 2014, 5, 556–568. [Google Scholar] [CrossRef]
- Behzadian, K.; Kapelan, Z.; Venkatesh, G.; Brattebø, H.; Sægrov, S. WaterMet2: A tool for integrated analysis of sustainability-based performance of urban water systems. Drink Water Eng. Sci. 2014, 7, 63–72. [Google Scholar] [CrossRef]
- Behzadian, K.; Kapelan, Z. Modelling metabolism based performance of an urban water system using WaterMet2. Resour. Conserv. Recycl. 2015, 99, 84–99. [Google Scholar] [CrossRef]
- Loucks, D.P.; Van Beek, E.; Stedinger, J.R.; Dijkman, J.P.; Villars, M.T. Water Resources System Planning and Management: An Introduction to Methods, Models and Applications; UNESCO: Paris, France, 2005; p. 680. [Google Scholar] [CrossRef]
- IREN, A.G. Acquedotti: Dati Tecnici E Risultanze Analitiche Relative All’anno 2014; Internal Report; IREN Acqua Gas: Genoa, Italy, 2015. [Google Scholar]
- Behzadian, K.; Kapelan, Z.; Rozos, E.; Makropoulos, C. WaterMet2 Conceptual Model; TRansition to Urban water Services of Tomorrow (TRUST) Technical report D33.1; TRUST (TRansitions to the Urban Water Services of Tomorrow) Project. 2012. Available online: https://www.trust-i.net (accessed on 3 March 2019).
- Arredi, F. Costruzioni Idrauliche, 2nd ed.; UTET: Torino, Italy, 1988. [Google Scholar]
© 2019 by the authors. Licensee MDPI, Basel, Switzerland. This article is an open access article distributed under the terms and conditions of the Creative Commons Attribution (CC BY) license (http://creativecommons.org/licenses/by/4.0/).