Abstract
The suitability of cloud-based irrigation technologies remains questionable due to limited information on their evaluation in the field. This study focussed on the on-field assessment of a smartphone irrigation scheduling tool—Bluleaf®—with respect to traditional water application practices. Bluleaf® uses weather, crop, soil, and irrigation system data to support a farmer’s decision on the timing and amounts of irrigation. The smartphone application was tested in Bekaa Valley, Lebanon, on durum wheat, a strategic Mediterranean crop, during the 2017 and 2018 growing seasons. The simulation results on soil water balance were in “acceptable to very good” agreement with the measured soil moisture values, with a root mean square error (RMSE) between 15.1 and 26.6 mm and a modelling efficiency (NSE) that ranged from 0.77 to 0.92. The appropriateness of the adopted smartphone irrigation scheduling was confirmed also by leaf water potential measurements and the Crop Water Stress Index (CWSI). A water saving of more than 1000 m3/ha (25.7%) was observed with Bluleaf® with respect to traditional irrigation scheduling. Therefore, new technologies could bring about substantial benefits to farmers and support water saving efforts in the Mediterranean region.
1. Introduction
Sustainable irrigation management requires reliable and easy-to-use methods and tools to support real-time scheduling with respect to the availability of water, specific soil and weather conditions, a crop’s water requirements, and a crop’s response to stress. Studies, conducted in recent years in various parts of the world, have shown that the use of innovative technologies, management approaches, and modelling tools can improve irrigation scheduling, save water, enhance a farmer’s income, and reduce the environmental burden [1,2,3,4,5,6,7,8]. In this context, real-time automatized irrigation scheduling, based on reliable low-cost sensors and simple water balance models, is receiving a growing amount of attention [9].
A plethora of innovative technological solutions in the agricultural sector is emerging worldwide. However, the commercialization of these products is intricate due to difficulties in demonstrating the on-field applicability and the effectiveness of proposed innovations and in creating direct contact with potential users. Over the past decade, numerous web-based irrigation scheduling tools have been developed that integrate real-time weather data and simple water balance models for irrigation scheduling [10,11,12,13]. However, their suitability in practice has been limited due to the need to use desktop computers (or laptops) and, therefore, scarce user–tool interaction. In contrast, the smartphone applications that have been developed for a new generation of mobile phones offer continuous user–tool interaction, increase operational flexibility, and permit the update of data in real-time during field inspection activities.
In the last few years, a huge number of studies have reported advances in ICT (Internet and Communication Tools) applications in agriculture, and, in particular, in irrigation at different scales [14,15,16,17,18,19]. They include the latest cloud-based technologies for on-field data acquisition, transmission, and management, monitoring of the soil-plant-atmosphere continuum and irrigation network performance, satellite- and ground-based remote-sensing applications, soil water balance and crop growth models, and the remote control of the irrigation process.
In Florida, smart irrigation applications (apps) were developed to provide real-time irrigation scheduling for selected crops (i.e., avocado, citrus, cotton, peanut, strawberry, and vegetables). Irrigation scheduling is based on crop evapotranspiration (ETc) or a water balance methodology using real-time weather data [15]. The apps were customized for different users considering the adopted irrigation systems, water conservations options, and other management practices.
In Italy, a new smartphone application, called Bluleaf®, was developed through collaboration between research institutions and the private sector [17]. Bluleaf® is based on a Decision Support System (DSS) platform that integrates weather and soil sensors with soil water balance and irrigation scheduling models that are fully adapted to the specific conditions of irrigated plots and describe in detail the crop’s phenological stages and the characteristics of the on-farm irrigation systems. This permits the optimization of irrigation inputs and the enhancement of the irrigation application’s efficiency. Bluleaf® was tested in southern Italy, and the results confirmed the robustness of the approach and its capacity to save water and energy with respect to traditional irrigation practices [17]. However, further investigations are needed to examine its performance under different soil and weather conditions and management practices.
The application of technological advances should be investigated more in the Mediterranean region in order to provide a step toward improved agricultural water use in terms of both increased economic benefits and a reduced environmental impact [20]. This is particularly relevant for the Middle East and North Africa (MENA) region, where water resources are scarce and agriculture is primarily based on irrigation. Therefore, it is important to consider the efficiency of adopted technological innovations in the context of specific hydrological realities and agronomic constraints [21,22] and to apply adequate indicators of water use performance and productivity for the sustainable conservation of resources [23].
The Bekaa valley is considered to be the food basket of Lebanon, where winter cereals are produced under supplemental irrigation and spring/summer vegetables are cultivated under full or deficit irrigation (depending on the availability of water). The increasing water scarcity in the valley constitutes the main driver threatening farmers to use less water on food production. In the valley, traditional irrigation scheduling, based on the farmer’s knowhow, is the norm. This means that the irrigation scheduling is performed according to a time-set calendar schedule, the number of days that has elapsed since the last irrigation, visual detection of a change in crop color or wilting leaves, and/or according to how dry the soil feels. However, none of these traditional methods can provide information on ‘how much’ water to apply.
The main objective of the study was to assess the performance of the Bluleaf® smart irrigation scheduling application and to determine whether it could save water and improve yield water productivity over traditional irrigation scheduling practices in the Bekaa valley. The study focused on durum wheat, a strategic Mediterranean crop, cultivated during the 2016–2017 and 2017–2018 growing seasons.
This investigation is important at the local and regional scales to improve farmers’ irrigation practices and to disseminate the benefits of use of innovative technologies that can increase water productivity, save resources, and reduce pressure on freshwater withdrawal.
2. Materials and Methods
2.1. Description of Smartphone-Based Decision Support System for Irrigation Management
2.1.1. General Overview of the Tool
Bluleaf® is a smartphone-based Decision Support System (DSS) (developed by Sysman Progetti & Servizi, Mesagne, BR, Bari, Italy) designed to provide integrated support to farmers, including, under a common shell, weather data (historical, real-time, and forecasted) and management tools for irrigation and nutrient application and plant disease risk-alert and protection. The system integrates scientific achievements and technological innovations in the fields of irrigation, agronomy, weather and soil moisture sensors, and data acquisition, transmission, and management and the application of web and app tools in agriculture.
The irrigation component uses weather, soil, crop, and irrigation system data to estimate water balance components during the crop-growing cycle and to elaborate irrigation scheduling (Figure 1). Soil water balance is modelled on a daily basis and it is based on the weather data collected from an agro-meteorological station close to the area of interest and weather forecasting data for a period of 7 days provided by the Meteoblue forecast system. The weather forecasting data are provided on an hourly and a daily basis and are available for each specific location, which permits the computation of the expected variation of water balance components and the optimization of irrigation scheduling 7 days ahead.

Figure 1.
The Bluleaf® architecture. TAW, total available water; RAW, readily available water; NIR, net irrigation requirements; GIR, gross irrigation requirements; FI, full irrigation, DI, deficit irrigation.
Soil data requirements are limited to the knowledge of the volumetric soil water content at field capacity, the wilting point and saturation, the electrical conductivity, the organic matter, and the effective soil depth. The user can select the soil characteristics from the soil database, insert his own data, or use a specific pedo-transfer function (PTF) to create and store new data according to a site-specific soil analysis. Moreover, the system can be equipped with capacitance sensors for the real-time monitoring of soil water content and testing/update of soil water balance modeling results.
The default crop database is arranged using the indicative crop growth and development parameters (e.g., crop coefficient, duration of growing cycles, minimum and maximum root depth, optimum yield threshold) as reported in the literature [24,25,26]. A more detailed description and the update of crop development and growth parameters is possible using the user’s observations in the field during the crop-growing season.
The basic irrigation system data include the irrigation method, the application efficiency, the number of irrigation lines per row, and the distance between an emitter and the emitter’s discharge. Additional data can be obtained from remote monitoring of the water supply network (the discharge and pressure at hydrants, the groundwater level in the wells) to support on-farm operational management of irrigation through a series of actuators (i.e., electro-valves) at pumping stations, hydrants, and valves. In this context, a specific multiplot and multicrop management module can be used for optimal water allocation considering all of a farm’s irrigated plots, the water availability, and the economic parameters of cultivation.
2.1.2. Irrigation Scheduling: The Water Balance Method
The ‘core’ algorithm of Bluleaf® is designed to run simulations at the scale of a single ‘irrigated plot’, which is defined as ‘the field-unit cultivated with the same crop (also in terms of variety type, planting date, density, etc.), with relatively homogeneous soil characteristics (average depth, texture, soil water holding capacity, etc.), equipped with a specific irrigation system and receiving the same irrigation applications (in terms of timing and amount)’. The crop-soil water balance and irrigation scheduling are computed by means of a specific model that was originally written in the MS Excel® programming language and previously tested and applied for similar applications [27]. The model estimates crop evapotranspiration, irrigation water requirements, and relative yield through the standard procedure proposed by the FAO 56 Paper [24].
The reference evapotranspiration (ETo) was estimated by the FAO Penman–Monteith equation [24] as:
where Rn is the net radiation available at the crop surface (MJ/m2/d), G is the soil heat flux density (MJ/m2/d), T is the mean air temperature at 2 m height (°C), U2 is the wind speed at 2 m height (m/s), (ea − es) is the vapour pressure deficit at 2 m height (kPa), Δ is the slope of the vapour pressure curve (kPa/°C), and γ is the psychometric constant (kPa/°C). The computations of the considered parameters were performed following the formulas reported in [24].
Crop evapotranspiration (ETc) was calculated as a product of the reference evapotranspiration and the crop coefficient Kc:
Soil water balance is estimated on a daily basis, and it is expressed in terms of water depletion in the effective root zone Dr,i (mm) at the end of each day through the following equation:
where Dr,i−1 represents the root zone depletion at the end of the previous day i − 1 (mm), Pi is the effective precipitation on day i (mm), IRi is the net irrigation supply on day i (mm), ETc,i is the crop evapotranspiration (mm), and DPi is the deep percolation on the same day (mm). Surface runoff (RO) is not considered since it occurs only when the precipitation and irrigation inputs are greater than the soil infiltration rate and refers to the water amount that does not enter into the soil. Capillary rise (CR) is usually a very small value that should be taken into consideration only in the case of a shallow groundwater level. Deep percolation is considered to be the excess of water above field capacity within the root zone. Therefore, it occurs when the effective rainfall is higher than the potential water storage of the root zone or in cases of excessive irrigation water supply. The effective precipitation was assumed to be a percentage of total precipitation; a default of 80% was adopted, and it can change during the growing season. Moreover, daily precipitation lower than 2 mm was not taken into account.
Total available water (TAW) for a crop is estimated as the difference between water content at field capacity and water content at wilting point and changes during the growing season as a function of root depth (Rd). Therefore,
where Rd is given in mm. Readily available water (RAW) represents the amount of water that can be depleted from the root zone without compromising crop growth. RAW is estimated as a fraction (p) of TAW as
where p represents a threshold for maximum crop production (the optimum yield threshold). This threshold is crop-specific and can change during the growing season. It ranges between 0.3 (for water-stress-sensible crops) and 0.7 (for water-stress-tolerant crops).
TAW = (FC − WP)/100 Rd
RAW = p × TAW
Different irrigation strategies can be adopted, and they depend on the management allowable depletion (MAD), which can be lower than or equal to RAW (the optimal irrigation and maximum yield) and greater than RAW (a crop water stress and yield reduction).
When the soil water depletion in the root zone (Dr) is greater than RAW (i.e., it is below the optimal yield threshold), a dimensionless coefficient Ks (0–1) is used to account for the level of water stress. Ks is calculated by the following formula:
where Dr is the root zone’s soil water depletion, TAW is the total available water, and RAW is readily available water (a predetermined fraction of the total available water). Hence, crop evapotranspiration is adjusted for water stress using the reduction coefficient Ks as:
Yield reduction under water stress is estimated using the approach of [28] as:
where Ya is the actual yield under water stress corresponding to the adjusted crop evapotranspiration (ETc,adj), Ym is the maximum yield corresponding to the optimal water supply, and Ky is a crop-specific yield response factor that can vary during the growing season.
2.2. Description of the Testing Site and Experimental Activities
2.2.1. Description of the Testing Site
The testing of the smartphone-based DSS was carried out at Tal Amara in the Bekaa valley (Lebanon) on the experimental field of the Lebanese Agricultural Research Institute (LARI). The Bluleaf® application was tested on durum wheat (cv. Icarasha) during two growing seasons: 2016–2017 and 2017–2018. The main weather parameters, including solar radiation, air temperature and relative humidity, wind speed, and precipitation, were taken from an agro-meteorological station located 400 m away from the experimental field. Monthly weather data, from November 2016 to June 2018, are given in Table 1 together with the reference evapotranspiration (ETo) estimated by the FAO Penman–Monteith standard approach [24].

Table 1.
Monthly climate data from November 2016 to June 2018 as recorded for the Tal Amara region.
Soil samples were taken in both seasons at up to 50 cm depth at five locations within the experimental field. The soil texture was determined, and the corresponding texture class referred to the USDA (United States Department of Agriculture) classification. The basic soil hydrological properties for the two seasons were estimated in Bluleaf from the soil granulometric analysis, the organic matter, and the electrical conductivity by means of the pedo-transfer function as suggested by [29]. The results are presented in Table 2. In the first year, the soil water holding capacity was 180 mm/m, while in the second it was almost 25% lower (136 mm/m).
Table 2.
The soil hydrological properties for the 2017 and 2018 growing seasons.
The basic crop parameters were initially set according to [24,30]. However, both biometric measurements (the percentage of effective ground cover) and a phenological survey were done on a weekly basis to correct Bluleaf®’s specific crop parameters according to what was observed in the field.
2.2.2. Description of the Trial
The irrigation scheduling experiment consisted of nine plots, each 300 m2 size (15 m × 20 m). The plots were randomized in a complete block design consisting of three irrigation scheduling treatments and three replicates: I-Bluleaf, irrigated according to Bluleaf®; I-farm, irrigated according to the farmer’s knowhow; and I-rainfed.
For the I-Bluleaf treatment, irrigation was managed using the Bluleaf® smartphone application in such a way as to keep the soil moisture content above the threshold of readily available water starting from the booting until the grain-filling stage. For the I-farm treatment, irrigation was managed according to the common farmer’s practice that consisted of providing the crop with water on a 15-day basis starting from early spring.
Irrigated plots were equipped with traditional impact sprinklers (with a discharge rate of 1.5 m3/h) spaced at 12 m on a lateral line overlaid on the middle of each plot. Each treatment had its own valve and flow meter. The adopted application efficiency was 75%. Durum wheat was sown in rows that were 0.18 m apart, with a density of 200 Kg of seeds per hectare. Nitrogen was applied at a rate of 60 kg/ha; in particular, ammonium sulfate (21% of N) was applied at the beginning of tillering, while ammonium nitrate (26–27%) was applied at the beginning of stem elongation.
The starting dates and duration of the main phenological stages observed during the two growing seasons are reported in Table 3.
Table 3.
The starting dates and duration of the main phenological stages of durum wheat grown in the 2016–2017 and 2017–2018 growing seasons. In brackets are reported the days after sowing (DAS).
2.2.3. Soil Moisture Content and Leaf Water Potential Measurements
Soil moisture readings were used to test the validity of Bluleaf® by checking the differences between simulated (model) and measured (sensor) data. For this purpose, an FDR (Frequency Domain Reflectometry) (or ‘capacitance’) sensor, the PR2 profile probe (DeltaT Devices Ltd, Cambridge, UK), was used for periodic monitoring of the soil water content along the profile in access tubes placed at a depth of 1 m in each of the nine plots of the trial.
Midday leaf water potential was measured three times in each growing season, during the irrigation season, on a two leaves per plot replicate using the Scholander pressure chamber (P3000, Soil Moisture Corp., Santa Barbara, CA, USA) in both trials. In addition, canopy temperature (Tc) was monitored by using an infrared thermometer (PhotoTempTMMXSTMTD, Raytek®, Everett, WA, USA). The crop water stress index (CWSI) was estimated according to Idso’s procedure [31] using air temperature (Ta) and vapor pressure deficit (VPD) data. In fact, the canopy temperature minus air temperature (Tc − Ta) values were plotted against the corresponding air VPD values, and delimited by the estimated upper and lower baselines. The CWSI values were then calculated as the relative distance of the measured point data between the upper and lower limits. A set of I-rainfed data under high-water-stress conditions was used to draw the upper baseline (UL) parallel to the VPD axis. Meanwhile, the lower baseline (LL) was derived from a set of I-Bluleaf and I-farm data.
2.2.4. Crop Yield, Crop Quality, and Yield Water Productivity
The final aboveground biomass, at the end of each crop cycle, was measured on a 1 m2 (1 m × 1 m) surface in each plot replicate. The aboveground biomass was determined by oven drying samples at 70 °C until a constant weight was reached. In addition, at physiological maturity, the grain yield was measured by harvesting a sample area of 1 m2 at the centre of each plot. Yield water productivity (Y-WP) was calculated as the ratio of yield over the sum of precipitation and irrigation water applied.
2.3. Statistical Analysis
The validation of a soil water balance estimate with Bluleaf® was done by comparing the simulated and measured values of soil water content over the whole growing cycle in both seasons. Goodness-of-fit parameters, mainly the root mean square error (RMSE), the coefficient of variation of the RMSE (CV(RMSE)), the Mean Bias Error (MBE), the Maximum Absolute Error (MAE), the index of agreement (dIA), and the Nash–Sutcliffe coefficient (NSE), were applied to evaluate model performance against observed data.
The average difference between simulation outputs and experimental data was described by the root mean squared error (RMSE) as:
where N is the number of pairs of observed/measured (Oi) and predicted/simulated (Pi) data.
Then, the coefficient of variation of the RMSE (CV(RMSE)) was applied to normalize the RMSE to the mean of the observed/measured values (Ō) as:
The Mean Bias Error (MBE) was used to indicate the under/over estimations by the model as:
The Maximum Absolute Error (MAE) was estimated as:
The index of agreement (dIA), which represents the ratio between the mean square error and the “potential error”, was calculated according as [32]:
The dIA is a descriptive parameter that varies between 0 and 1, with the value of 1.0 indicating excellent agreement.
In addition, the Modelling Efficiency (NSE), which represents a normalized statistic that determines the relative magnitude of the residual variance compared to the measured data variance [33,34], was defined as:
According to [19], which worked on validating a smartphone application for avocado, the validity of the model performance was considered very good when the probability of fit showed an NSE = 0.9–1, good for NSE = 0.8–0.899, acceptable for NSE = 0.65–0.799, and unsatisfactory for NSE < 0.65.
All statistical analyses were carried out by using SAS v9.
3. Results and Discussion
3.1. Irrigation Water Supply and Saving
Irrigation dates and amounts of water supply considering two management approaches (Bluleaf® and the farmer’s approach) are presented in Table 4 for both seasons. In the first season (2016–2017), the Bluleaf® irrigation was scheduled three times, each with 67.5 mm of net irrigation, which accounted for a total of 202.5 mm of net irrigation supply and 270 mm of gross irrigation input. The farmer’s irrigation strategy assumed four irrigations of 67.5 mm each, with a total of 270 mm of net irrigation and 360 mm of gross irrigation. Therefore, a total water saving of 90 mm was obtained when the Bluleaf® application was used.
Table 4.
The irrigation dates and amounts of water for the two seasons’ trials.
In the second season (2017–2018), the Bluleaf® irrigation was scheduled four times with different water inputs, which accounted for 248 and 331 mm of net and gross irrigation, respectively. In the case of the farmer’s irrigation strategy, five irrigation events occurred, each with 67.5 mm, which meant 337.5 mm of net irrigation supply and 450 mm of gross irrigation input. Thus, in the second year, a water saving of 119 mm was observed with the Bluleaf® application.
Overall, I-Bluleaf received 25.7% less water than I-farm independently on the growing season. In Lebanon, the area cropped with wheat represents about 30,000 ha, of which almost 50% is being irrigated [35]. Therefore, the annual water saving could reach about 15 million m3 provided that, in all irrigated areas, a real-time irrigation scheduling tool is applied.
The difference in irrigation amounts between the two growing seasons was mainly due to the different soil characteristics of the two experimental seasons (the soil water holding capacity was about 25% greater in the first year with respect to the second year) and the distribution of precipitation throughout the growing season, which was more uniform in the first than in the second year. In fact, in the second growing season, the precipitation was higher than in the first year by about 51 mm; however, it was distributed mainly in January and February, when both the rooting depth and the crop evapotranspiration were low. Thus, in the second season, most of precipitation was lost mainly through deep percolation. The difference in net irrigation requirements estimated by Bluleaf® was about 45 mm. Nevertheless, the difference in net irrigation applications adopted by the farmer’s approach was 67 mm. This confirms the suitability of smart irrigation technologies for irrigation scheduling, which permit us to have better knowledge of the soil-plant-atmosphere continuum and a more accurate irrigation supply.
3.2. Assessment of the Soil Water Content Estimation in the Root Zone
The results of soil water balance estimated on a daily basis are given by the values of soil water depletion in the root zone in Figure 2 and Figure 3 for the three water treatments (I-Bluleaf, I-farm, and I-rainfed) in the 2016–2017 and 2017–2018 growing seasons. In both seasons, the plants were kept under optimal water conditions from the booting until the grain-filling stage. The irrigation was always applied before the root zone’s soil water content went below the allowable depletion threshold. Consequently, no apparent water stress was experienced by the crops during the irrigation period. When irrigation was stopped, at the dough stage, the soil water content dropped below the readily available water threshold. The total net irrigation amounts of I-farm were 270 mm and 338 mm in the 2016–2017 and 2017–2018 growing seasons, respectively. Irrigation was performed every 15 days according to the common farmer’s practice in the region. Accordingly, irrigation started at the early vegetative stage. For I-rainfed, water stress started at the booting stage and it was increased progressively until the ripening stage.
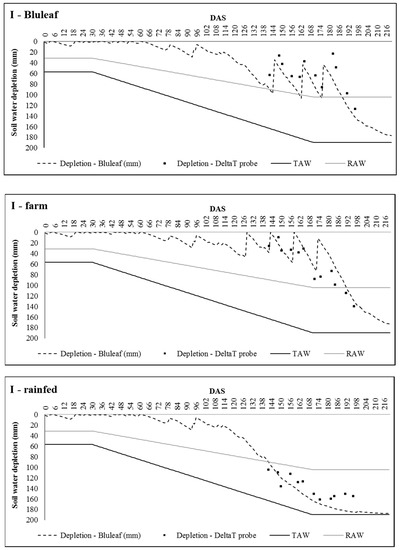
Figure 2.
Simulated soil water depletion (Bluleaf®) versus measured soil water depletion (PR2 probes) for the three different treatments in the 2016–2017 wheat growing season. (I-Bluleaf, irrigated according to Bluleaf®; I-farm, irrigated according to farmer know-how; I-rainfed, no irrigation; TAW, total available water; RAW, readily available water).
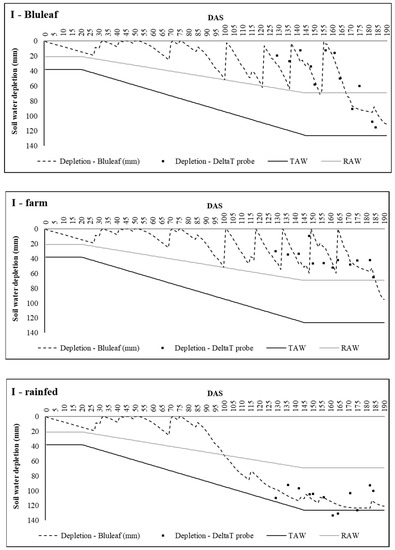
Figure 3.
Simulated soil water depletion (Bluleaf®) versus measured soil water depletion (PR2 probes) for the three different treatments in the 2017–2018 wheat growing season. (I-Bluleaf, irrigated according to Bluleaf®; I-farm, irrigated according to farmer know-how; I-rainfed, no irrigation; TAW, total available water; RAW, readily available water).
The testing of Bluleaf® to predict soil water content in the root zone demonstrated a good agreement with the measured values considering the soil water dynamics and the soil spatial variability and heterogeneity. The goodness-of-fit indicators are presented in Table 5. The RMSE ranged from 15.12 mm to 26.64 mm with a CV(RMSE) between 0.14 and 0.61 mm. The dIA ranged from 0.77 to 0.98. The NSE showed that the model can be classified from acceptable to very good [19], with values ranging from 0.77 to 0.92. The differences between the simulated and observed soil water contents could be due to the fact that the soil water balance considers a one-dimensional flow of water through the soil, while ignoring lateral and preferential flow [36,37,38]. In addition, since soil properties are generally highly heterogeneous, the simulations were accepted as an average representation of soil water variations within the root zone. Trends in soil water content dynamics and not exact values of soil water content were reproduced by the model, as was also obtained in the study for the validation of a smartphone application for avocado [19].
Table 5.
The goodness-of-fit indicators for the soil water balance simulation in the wheat trials.
3.3. Biomass, Yield, and Water Productivity
The main examined variables, particularly the final aboveground dry biomass (AGDB), the grain yield, and the yield water productivity (Y-WP), are reported in Table 6 for all treatments and both seasons. In addition, the grain yield, as affected by year (i.e., specific weather conditions) and treatment application, is presented in Figure 4.
Table 6.
Aboveground dry biomass (AGDB), yield, and yield water productivity (Y-WP) as affected by year and irrigation treatment (Tr) application.
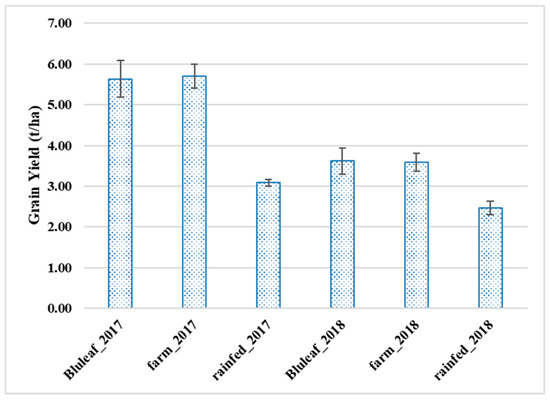
Figure 4.
The Grain Yield in 2017 and 2018, as affected by Year and treatment application. The vertical bars indicate the standard error.
Considering “year” as the source of variance, there was not a significant difference in terms of biomass production. However, the grain yield and the Y-WP were significantly different with higher mean values (4.81 t/ha and 1.01 kg/m3, respectively, in the 2016–2017 growing season) than in 2017–2018 (3.22 t/ha and 0.59 kg/m3). The reduction of yield in the second growing season could be explained by a higher air temperature during the crop development phase (an average of about 3.0 °C) in 2017–2018 than in 2016–2017, and a lack of precipitation in December (immediately after sowing) and in March. The high temperatures accelerated crop development and reduced biomass and yield in 2017–2018. Moreover, in the second season, the booting stage, which is sensitive to water stress, was anticipated in March when the precipitation was low and there was no irrigation. Thus, it could be an additional factor affecting the grain yield in that year.
Considering “water” as the source of variance, the total dry biomass of wheat was significantly influenced by the water regime. In fact, I-Bluleaf and I-farm produced 41.76% and 41.37% higher biomass than I-rainfed, respectively. In addition, yield varied significantly in relation to water practice, with the values for I-Bluleaf and I-farm respectively 67.14% and 67.50% higher than I-rainfed. It should be mentioned that I-Bluleaf and I-farm were not significantly different in terms of final biomass and yield, and the values were very close.
Concerning the Y-WP that was expressed on the basis of grain yield, the results revealed that, although not significant, I-Bluleaf had a 13.5% higher Y-WP than I-farm. In fact, despite I-Bluleaf and I-farm presenting similar values of AGDB and grain yield, it is of great importance to emphasize that I-Bluleaf received 24.8% and 26.6% less water than I-farm, respectively, in seasons 2016–2017 and 2017–2018, which lead to a greater Y-WP.
The results confirmed that the application of supplemental irrigation and a limited amount of water increased the crop yield and water productivity of durum wheat [39,40,41,42].
3.4. Stress Indicators: Leaf Water Potential (LWP) and the Crop Water Stress Index (CWSI)
The midday leaf water potential was measured as illustrated in Figure 5, and corresponding to the time interval between the booting and grain-filling stages. In season 2016–2017, for the first measurement, the midday LWP presented almost similar values, between −24.5 and −25 bar in all treatments. However, for the second and third measurement, the LWP showed lower values (more negative), between −27.67 and −32 bar for rainfed treatments, which indicated water stress. In the case of irrigated treatments, the LWP was higher (around −20 bar) for the second measurement, and it was lower (around 26.5 bar) for the third measurement. The values of LWP were slightly higher for I-Bluleaf than for I-farm treatment. In season 2017–2018, the LWP was lower for rainfed treatment (between −28.67 and −33.17 bar) than for irrigated treatments (between −19.50 and −25.33 bar). There was a clear difference of midday LWP values between rainfed and irrigated treatments. Finally, the treatments I-Bluleaf and I-farm presented the same range of midday LWP, and no clear difference was noticed between the two treatments that mainly exhibited similar trends of LWP. The results obtained in this study are in agreement with the findings of [43], who reported similar LWP values for durum wheat grown under optimal and water-stress conditions in Avignon, France. These findings are also in agreement with the study of [42], who investigated the LWP variation under different water regimes for durum wheat and barley crops. This confirmed the validity of the Bluleaf® application for the irrigation scheduling of wheat, revealing that the plants were well-watered during the irrigation season.

Figure 5.
The midday leaf water potential (LWP) for the different treatments in the two wheat growing seasons. The blue arrows correspond to irrigation events for I-Bluleaf while the red arrows correspond to irrigation events for I-farm.
In Figure 6a, the canopy temperature minus air temperature (Tc – Ta) values are plotted against the corresponding values of air vapor pressure deficit (VPD), and delimited by the estimated upper and lower baselines.
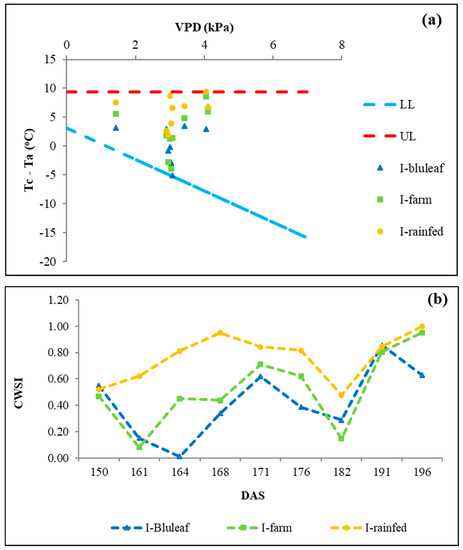
Figure 6.
(a): A plot of canopy air temperature versus air vapor pressure deficit (VPD) with the corresponding upper and lower limits. (b): The Crop Water Stress Index (CWSI) variation for the three treatments during the wheat growing season.
The variation of the empirical CWSI under the three water regimes in 2016–2017 is shown in Figure 6b. Since the irrigation supply started late in the season (April), the first measurements showed a common stress (with a CWSI between 0.4 and 0.55). Later on, the CWSI decreased as a result of irrigation in I-Bluleaf and I-farm. The irrigated treatments followed a similar trend of CWSI in agreement with the adopted irrigation strategy. The CWSI threshold for irrigation can be adopted as 0.5, which is in agreement with other studies [44]. Therefore, the results on CWSI variation confirmed the validity of the Bluleaf® irrigation app for use in the irrigation management of durum wheat.
4. Conclusions and Perspectives
Field crops, such as wheat and other cereals, are important for stabilizing food security at the national level in the most of the MENA countries. In most cases, these crops are irrigated in order to reach a satisfactory level of production. Although water authorities are trying to develop regulations to limit water abstraction (especially from groundwater), their effective application requires support to help farmers in the implementation of new water-efficient technologies. For this reason, a user-friendly smartphone application for irrigation scheduling is of great importance in rationalizing water quantities.
The application of Bluleaf®, which was tested in this study, can provide daily customized irrigation scheduling for each farm at the irrigation sector scale using local meteorological data on a real-time basis, weather forecasting, soil, and crop data, and the hydraulic characteristics of the irrigation system. The results of the test indicated a considerable water saving of at least 1000 m3/ha, which confirmed that the irrigation practices adopted by farmers are not efficient, cause a waste of water, nutrients, and energy, and trigger other environmental burdens. The assessment of Bluleaf®’s performance revealed that the presented tool could constitute a promising solution for irrigation scheduling with an “acceptable to very good” simulation of the soil water balance in the root zone.
Nowadays, there is an increasing demand for user-friendly platforms in the agricultural sector that should be able to provide relevant information for farmers by means of various types of sensors (local and remote) and modeling tools. Additionally, these applications could be used to produce reliably traceable records of farm activities and for the estimation of eco-efficiency [45], which is increasingly being demanded by the market.
The presented tool is one such platform, based on a smartphone application that allows for easy and instantaneous interaction with users. This provides additional insight into real-time irrigation management and permits more efficient water, nutrient, and energy use. Certainly, proper use of this and other similar tools depends on a concerted capacity-building effort and strong collaboration between researchers, extension service staff, and farmers. Further testing and calibration of other crop, soil, weather, and management conditions is needed.
Author Contributions
Data curation, M.T.A.S., I.J., S.S., and S.F.; Formal analysis, M.T.; Methodology, M.T.A.S.; Supervision, M.T.A.S., I.J., and M.T.; Writing (original draft), M.T.A.S.; Writing (review & editing), S.S., S.F., and M.T.
Funding
This research received no external funding.
Conflicts of Interest
The authors declare no conflict of interest.
References
- Zotarelli, L.; Dukes, M.D.; Scholberg, J.M.S.; Femminella, K.; Munoz-Carpena, R. Irrigation scheduling for green bell peppers using capacitance soil moisture sensors. J. Irrig. Drain. Eng. 2011, 137, 73–81. [Google Scholar] [CrossRef]
- Rosa, R.D.; Paredes, P.; Rodrigues, G.C.; Alves, I.; Fernando, R.M.; Pereira, L.S.; Allen, R.G. Implementing the dual crop coefficient approach in interactive software. 1. Background and computational strategy. Agric. Water Manag. 2012, 103, 8–24. [Google Scholar] [CrossRef]
- Dobbs, N.A.; Migliaccio, K.W.; Li, Y.C.; Dukes, M.D.; Morgan, K.T. Evaluating irrigation applied and nitrogen leached using different smart irrigation technologies on bahiagrass (Paspalum notatum). Irrig. Sci. 2014, 32, 193–203. [Google Scholar] [CrossRef]
- Pereira, L.S.; Paredes, P.; Rodrigues, G.C.; Neves, M. Modeling barley wateruse and evapotranspiration partitioning in two contrasting rainfall years. Assessing SIMDualKc and AquaCrop models. Agric. Water Manag. 2015, 159, 239–254. [Google Scholar] [CrossRef]
- Todorovic, M.; Mehmeti, A.; Scardigno, A. Eco-efficiency of agricultural water systems: Methodological approach and assessment at meso-level scale. J. Environ. Manag. 2016, 165, 62–71. [Google Scholar] [CrossRef] [PubMed]
- Mehmeti, A.; Todorovic, M.; Scardigno, A. Assessing the eco-efficiency improvement of Sinistra Ofanto irrigation scheme. J. Clean. Prod. 2016, 138, 208–216. [Google Scholar] [CrossRef]
- Seidel, S.J.; Werisch, S.; Barfus, K.; Wagner, M.; Schutze, N.; Laber, H. Field Evaluation of Irrigation Scheduling Strategies using a Mechanistic Crop Growth Model. Irrig. Drain. 2016, 65, 214–223. [Google Scholar] [CrossRef]
- Paredes, P.; D’Agostino, D.; Assif, M.; Todorovic, M.; Pereira, L.S. Assessing potato transpiration, yield and water productivity under various water regimes and planting dates using the FAO dual Kc approach. Agric. Water Manag. 2018, 195, 11–24. [Google Scholar] [CrossRef]
- Adeyemi, O.; Grove, I.; Peets, S.; Domun, Y.; Norton, T. Dynamic Neural Network Modelling of Soil Moisture Content for Predictive Irrigation Scheduling. Sensors 2018, 18, 3408. [Google Scholar] [CrossRef]
- Morgan, K.T.; Obreza, T.A.; Scholberg, J.M.; Parsons, L.R.; Wheaton, T.A. Citrus water uptake dynamics on a sandy Florida entisol. SSSA J. 2006, 70, 90–97. [Google Scholar] [CrossRef]
- Kelley, L.; Miller, S. Irrigation Scheduling Tools; Irrigation Fact Sheet 3; East Lansing, M., Ed.; Michigan State University Extension: East Lansing, MI, USA, 2011; Available online: http://msue.anr.msu.edu/uploads/236/43605/resources/3_Scheduling_Tools.pdf (accessed on 22 January 2019).
- Scherer, T. Web-Based Irrigation Scheduler; Fargo, N.D., Ed.; North Dakota State University: Fargo, ND, USA, 2014; Available online: www.ag.ndsu.edu/waterquality/documents/web-basedirrigation-scheduler (accessed on 22 January 2019).
- Malamos, N.; Tsirogiannis, I.L.; Christofides, A.; Anastasiadis, S.; Vanino, S. Main Features and Application of a Web-based Irrigation Management Tool for the Plain of Arta. In Proceedings of the 7th International Conference on Information and Communication Technologies in Agriculture, Food and Environment (HAICTA 2015), Kavala, Greece, 17–20 September 2015; pp. 174–185. [Google Scholar]
- Bartlett, A.C.; Andales, A.A.; Arabi, M.; Bauder, T.A. A smartphone app to extend use of a cloud-based irrigation scheduling tool. Comput. Electron. Agric. 2015, 111, 127–130. [Google Scholar] [CrossRef]
- Migliaccio, K.W.; Morgan, K.T.; Vellidis, G.; Zotarelli, L.; Fraisse, C.; Zurweller, B.A.; Andreis, J.H.; Crane, J.H.; Rowland, D.L. Smartphone APPS for irrigation scheduling. ASABE 2016, 59, 291–301. [Google Scholar]
- Vellidis, G.; Liakos, V.; Andreis, J.H.; Perry, C.D.; Porter, W.M.; Barnes, E.M.; Morgan, K.T.; Fraisse, C.; Migliaccio, K.W. Development and assessment of a smartphone application for irrigation scheduling in cotton. Comput. Electron. Agric. 2016, 127, 249–259. [Google Scholar] [CrossRef]
- Todorovic, M.; Riezzo, E.E.; Buono, V.; Zippitelli, M.; Galiano, A.; Cantore, V. Hydro-Tech: An automated smart-tech Decision Support Tool for eco-efficient irrigation management. Int. Agric. Eng. J. 2016, 25, 44–56. [Google Scholar]
- González Perea, R.; Fernández García, I.; Martin Arroyo, M.; Rodríguez Díaz, J.A.; Camacho Poyato, E.; Montesinos, P. Multiplatform application for precision irrigation scheduling in strawberries. Agric. Water Manag. 2017, 183, 194–201. [Google Scholar] [CrossRef]
- Mbabazi, D.; Migliaccio, K.W.; Crane, J.H.; Fraisse, C.; Zotarelli, L.; Morgan, K.T.; Kiggundu, N. An irrigation schedule testing model for optimization of the Smartirrigation avocado app. Agric. Water Manag. 2017, 179, 390–400. [Google Scholar] [CrossRef]
- Todorovic, M.; Mehmeti, A.; Cantore, V. Impact of different water and nitrogen inputs on the eco-efficiency of durum wheat cultivation in Mediterranean. J. Clean. Prod. 2018, 183, 1276–1288. [Google Scholar] [CrossRef]
- Perry, C.; Steduto, P.; Allen, R.G.; Burt, C.M. Increasing productivity in irrigated agriculture: Agronomic constraints and hydrological realities. Agric. Water Manag. 2009, 96, 1517–1524. [Google Scholar] [CrossRef]
- Molden, D.; Oweis, T.; Steduto, P.; Bidraban, P.; Hanjra, M.A.; Kijne, J. Improving agricultural water productivity: Between optimism and caution. Agric. Water Manag. 2010, 97, 528–535. [Google Scholar] [CrossRef]
- Pereira, L.S.; Cordery, I.; Iacovides, I. Improved indicators of water use performance and productivity for sustainable water conservation and saving. Agric. Water Manag. 2012, 108, 39–51. [Google Scholar] [CrossRef]
- Allen, R.G.; Pereira, L.S.; Raes, D.; Smith, M. Crop Evapotranspiration; Guidelines for Computing Crop Water Requirements; Irrigation and Drainage Paper 56; Food and Agriculture Organization: Rome, Italy, 1998. [Google Scholar]
- Allen, R.G.; Pereira, L.S. Estimating crop coefficients from fraction ground cover and height. Irrig. Sci. 2009, 28, 17–34. [Google Scholar] [CrossRef]
- Steduto, P.; Hsiao, T.C.; Fereres, E.; Raes, D. Crop Yield Response to Water; FAO Irrigation and Drainage Paper 66; FAO: Rome, Italy, 2012. [Google Scholar]
- Todorovic, M. An Excel-based tool for real time irrigation management at field scale. In Proceedings of the International Symposium on Water and Land Management for Sustainable Irrigated Agriculture, Adana, Turkey, 4–8 April 2006; Ҫukurova University: Adana, Turkey, 2006. [Google Scholar]
- Stewart, J.I.; Cuenca, R.H.; Pruit, W.O.; Hagan, R.M.; Tosso, J. Determination and Utilisation of Water Production Functions for Principal California Crops; W-67 California Contribution Project; University of California: Berkeley, CA, USA, 1977. [Google Scholar]
- Saxton, K.E.; Rawls, W.J. Soil water characteristic estimates by texture and organic matter for hydrologic solutions. Soil Sci. Soc. Am. J. 2006, 70, 1569–1578. [Google Scholar] [CrossRef]
- Asseng, S.; Milroy, S.; Bassu, S.; Abi Saab, M.T. Book Chapter: WHEAT. In Crop Yield Response to Water. FAO Irrigation and Drainage Paper 66; Steduto, P., Hsiao, T.C., Fereres, E., Raes, D., Eds.; Food and Agriculture Organization of UN: Rome, Italy, 2012; pp. 92–100. [Google Scholar]
- Idso, S.B.; Jackson, R.D.; Pinter, P.J., Jr.; Reginato, R.J.; Hatfield, J.L. Normalizing the stress-degree-day parameter for environmental variability. J. Agric. Meteorol. 1981, 24, 45–55. [Google Scholar] [CrossRef]
- Wilmot, C.J. Some comments on the evaluation of model performance. Bull. Am. Meteorol. Soc. 1982, 64, 1309–1313. [Google Scholar] [CrossRef]
- Nash, J.E.; Sutcliffe, J.V. River flow forecasting through conceptual models: Part 1. A discussion of principles. J. Hydrol. 1970, 10, 282–290. [Google Scholar]
- Moriasi, D.N.; Arnold, J.G.; Van Liew, M.W.; Bingner, R.L.; Harmel, R.D.; Veith, T.L. Model evaluation guidelines for systematic quantification of accuracy in watershed simulations. Trans. ASABE 2007, 50, 885–900. [Google Scholar] [CrossRef]
- MoA/FAO. Agricultural Census 2010; MoA/FAO: Rome, Italy, 2010. [Google Scholar]
- Beven, K.; Germann, P. Macropores and water flow in soils revisited. Water Resour. Res. 2013, 49, 3071–3092. [Google Scholar] [CrossRef]
- Nimmo, J.R. Theory for source-responsive and free-surface film modeling ofunsaturated flow. Vadose Zone J. 2010, 9, 295–306. [Google Scholar] [CrossRef]
- Nimmo, J.R.; Mitchell, L. Predicting vertically non sequential wetting patterns with a source-responsive model. Vadose Zone J. 2013, 12, 4. [Google Scholar] [CrossRef]
- Oweis, T.; Pala, M.; Ryan, J. Stabilizing rainfed wheat yields with supplemental irrigation and nitrogen in a Mediterranean climate. J. Agron. 1998, 90, 672–681. [Google Scholar] [CrossRef]
- Oweis, T.; Hachum, A.; Kijne, J. Water Harvesting and Supplementary Irrigation for Improved Water Use Efficiency in Dry Areas; SWIM Paper 7; Colombo, S.L., Ed.; International Water Management Institute: New Delhi, India, 1999. [Google Scholar]
- Oweis, T.; Zhang, H.; Pala, M. Water use efficiency of rainfed and irrigated bread wheat in a Mediterranean environment. J. Agron. 2000, 92, 231–238. [Google Scholar] [CrossRef]
- Albrizio, R.; Todorovic, M.; Matic, T.; Stellacci, A.M. Comparing the interactive effects of water and nitrogen on durum wheat and barley grown in a Mediterranean environment. Field Crops Res. 2010, 115, 179–190. [Google Scholar] [CrossRef]
- Brisson, N.; Casals, M.-L. Leaf dynamics and crop water status throughout the growing cycle of durum wheat crops grown in two contrasted water budget conditions. Agron. Sustain. Dev. 2005, 25, 151–158. [Google Scholar] [CrossRef]
- Zia, S.; Du, W.Y.; Spreer, W.; Spohrer, K.; He, X.K.; Müller, J. Assessing crop water stress of winter wheat by thermography under different irrigation regimes in North China Plain. Int. J. Agric. Biol. Eng. 2012, 5, 1–11. [Google Scholar]
- Todorovic, M. Regional strategies in sustainable water management for irrigation: The eco-efficiency approach. In Water Management for Sustainable Agriculture; Oweis, T., Ed.; Burleigh Dodds Science Publishing Limited: Cambridge, UK, 2018; pp. 521–543. [Google Scholar]


© 2019 by the authors. Licensee MDPI, Basel, Switzerland. This article is an open access article distributed under the terms and conditions of the Creative Commons Attribution (CC BY) license (http://creativecommons.org/licenses/by/4.0/).