Determining Discharge Characteristics and Limits of Heavy Metals and Metalloids for Wastewater Treatment Plants (WWTPs) in China Based on Statistical Methods

Abstract
:1. Introduction
2. Data Source
2.1. Data Source
2.2. Data Analysis
3. Results and Discussion
3.1. The Heavy Metal and Metalloid Discharge Concentrations Level of WWTPs
3.2. Removal Rate of Heavy Metals and Metalloids in WWTPs in China
- MDL—Method Detection Limit.
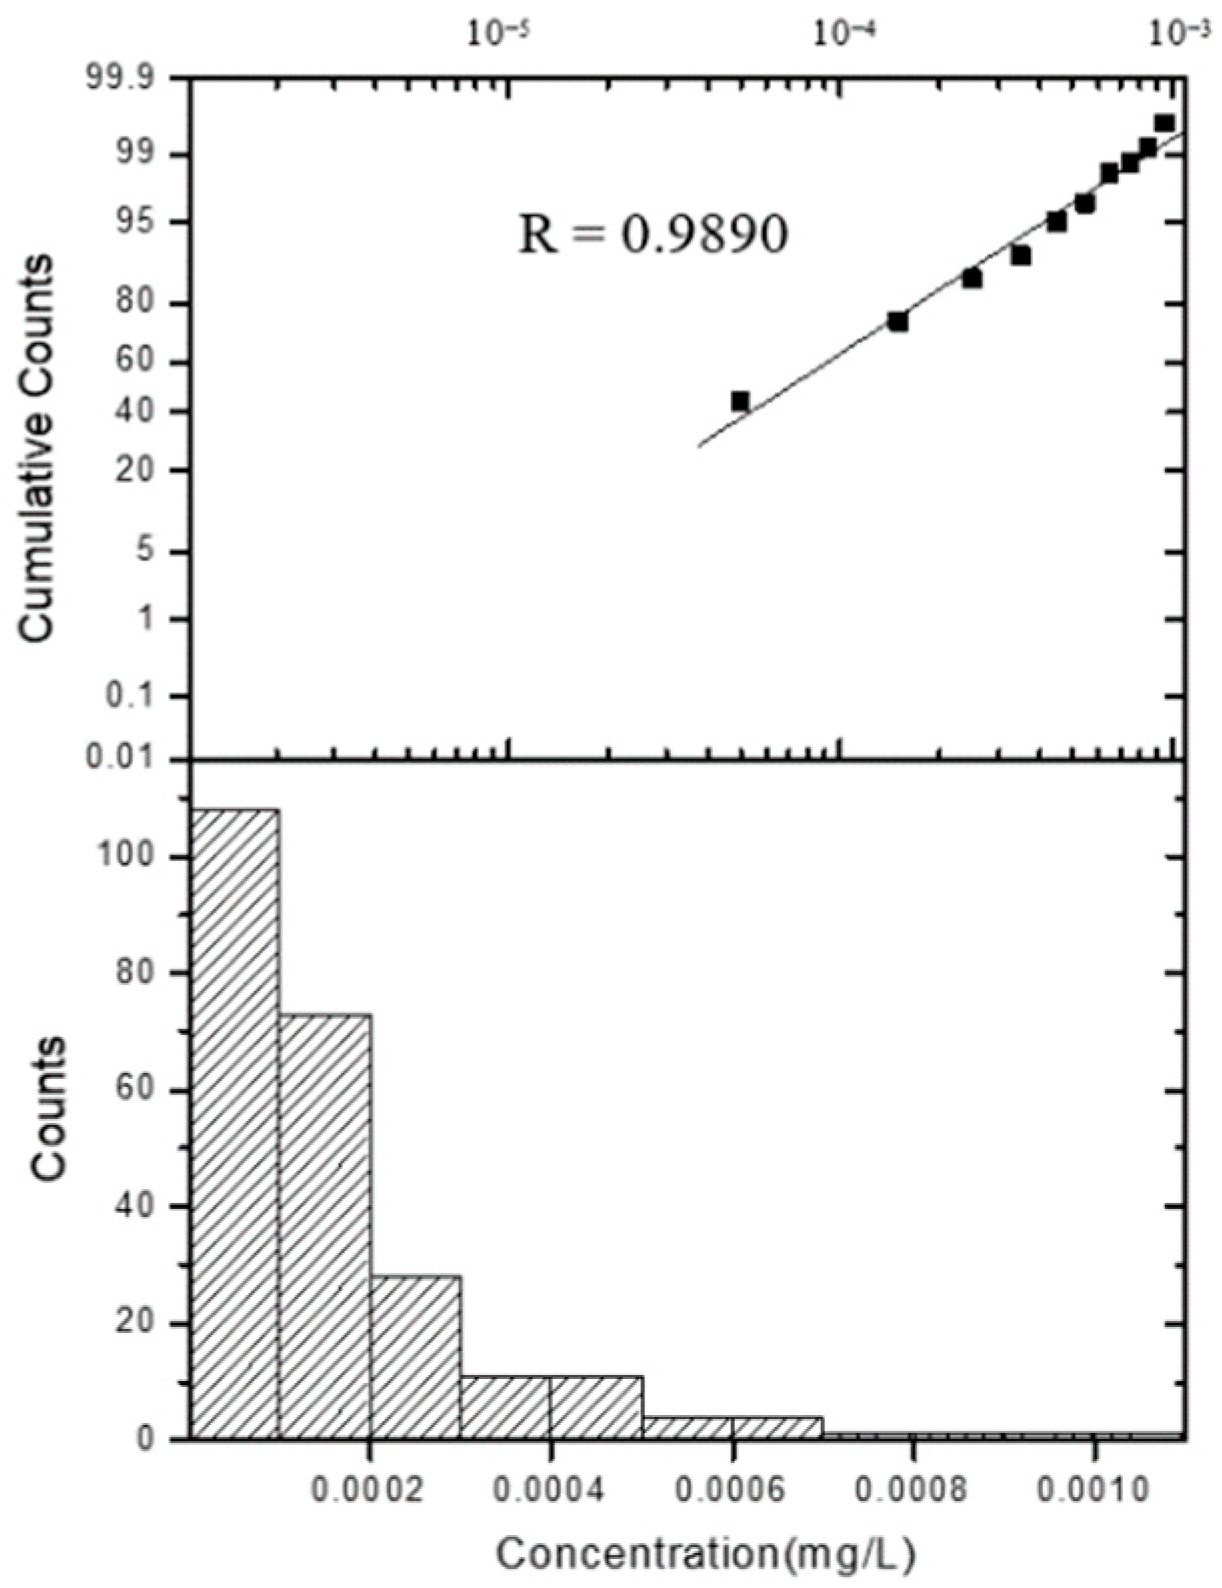
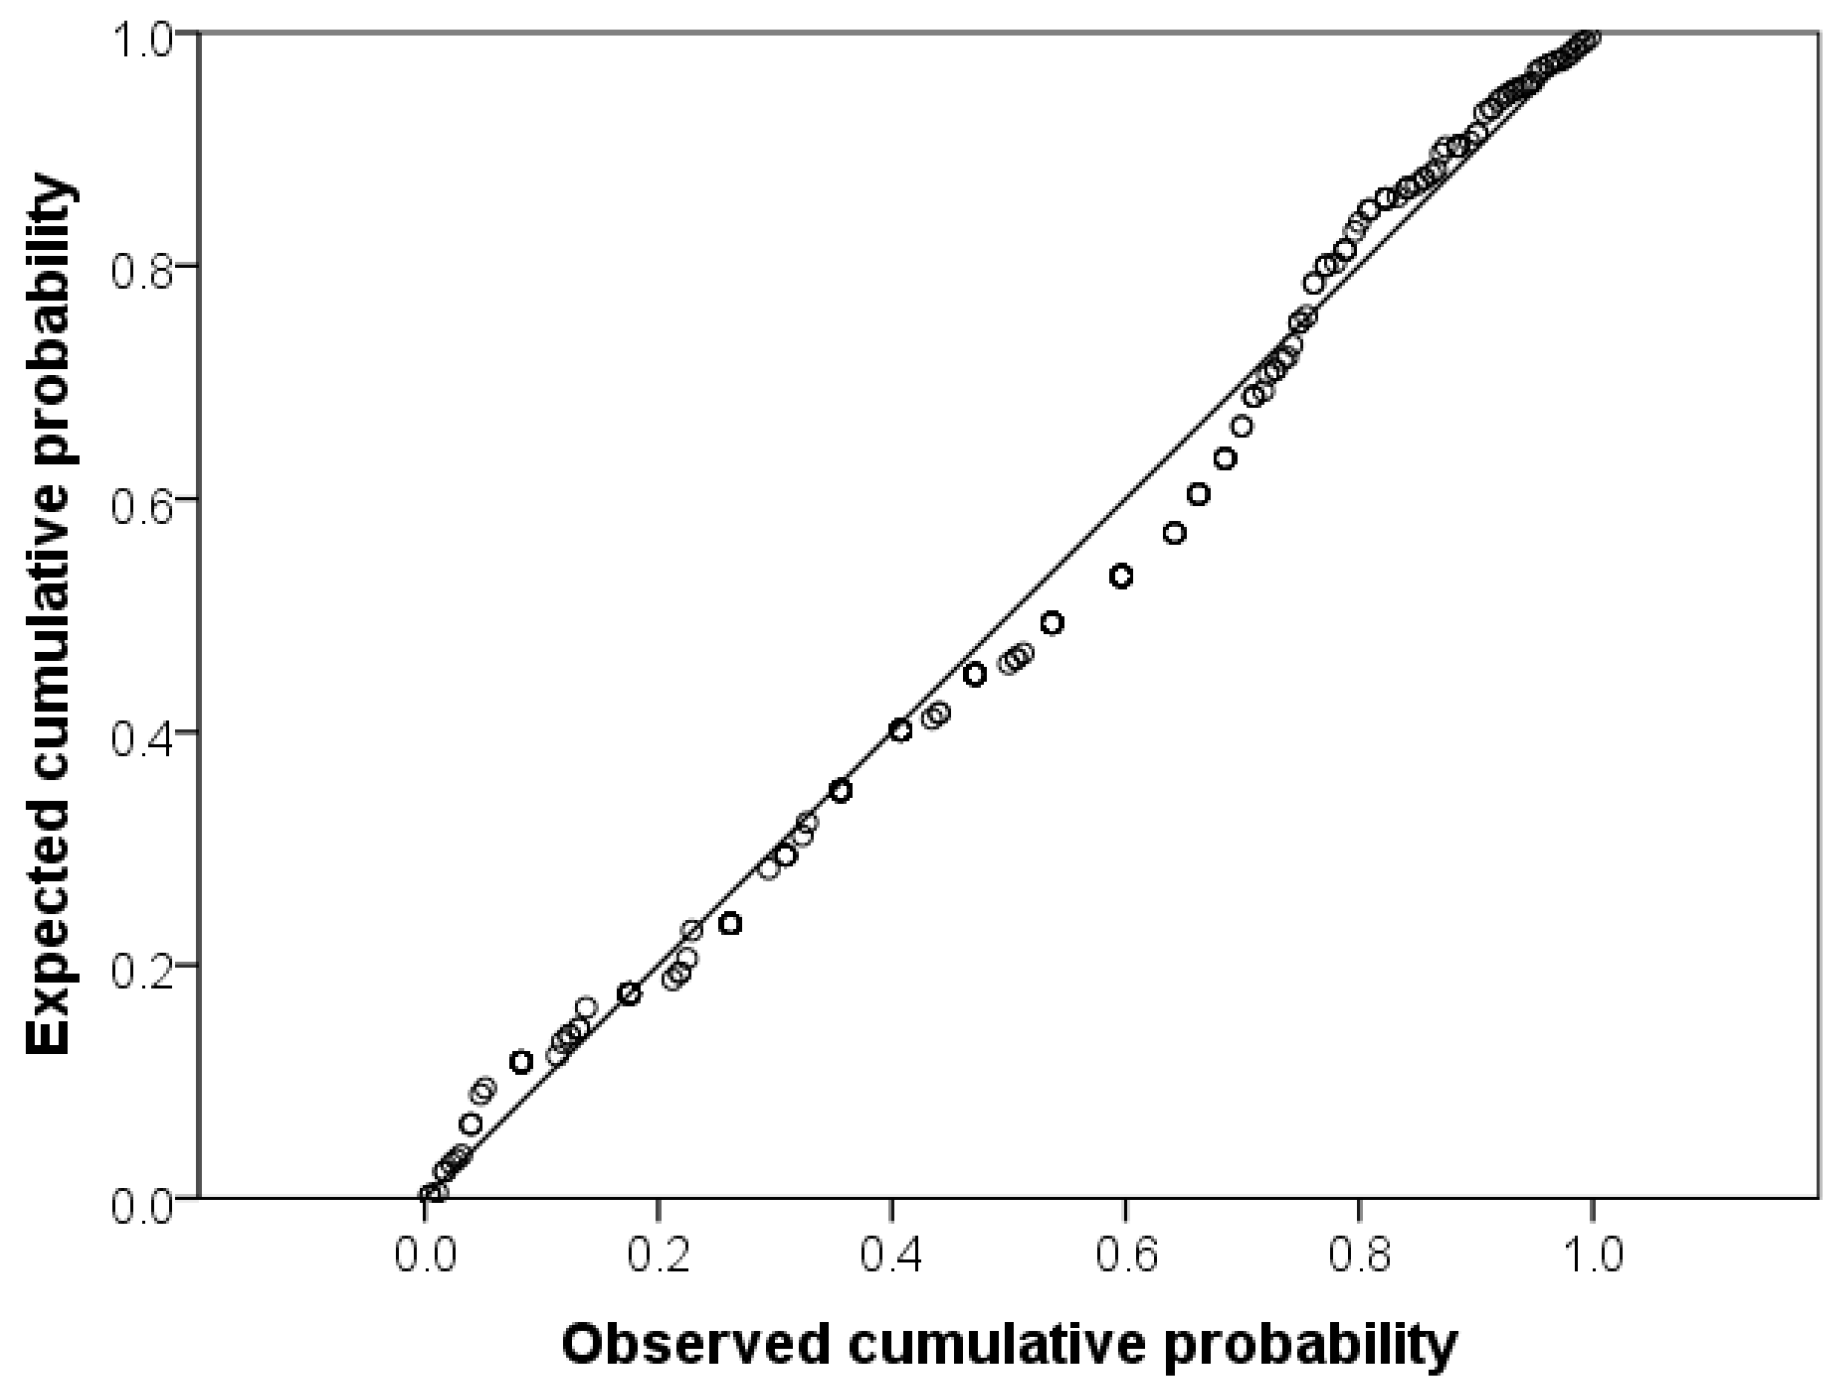
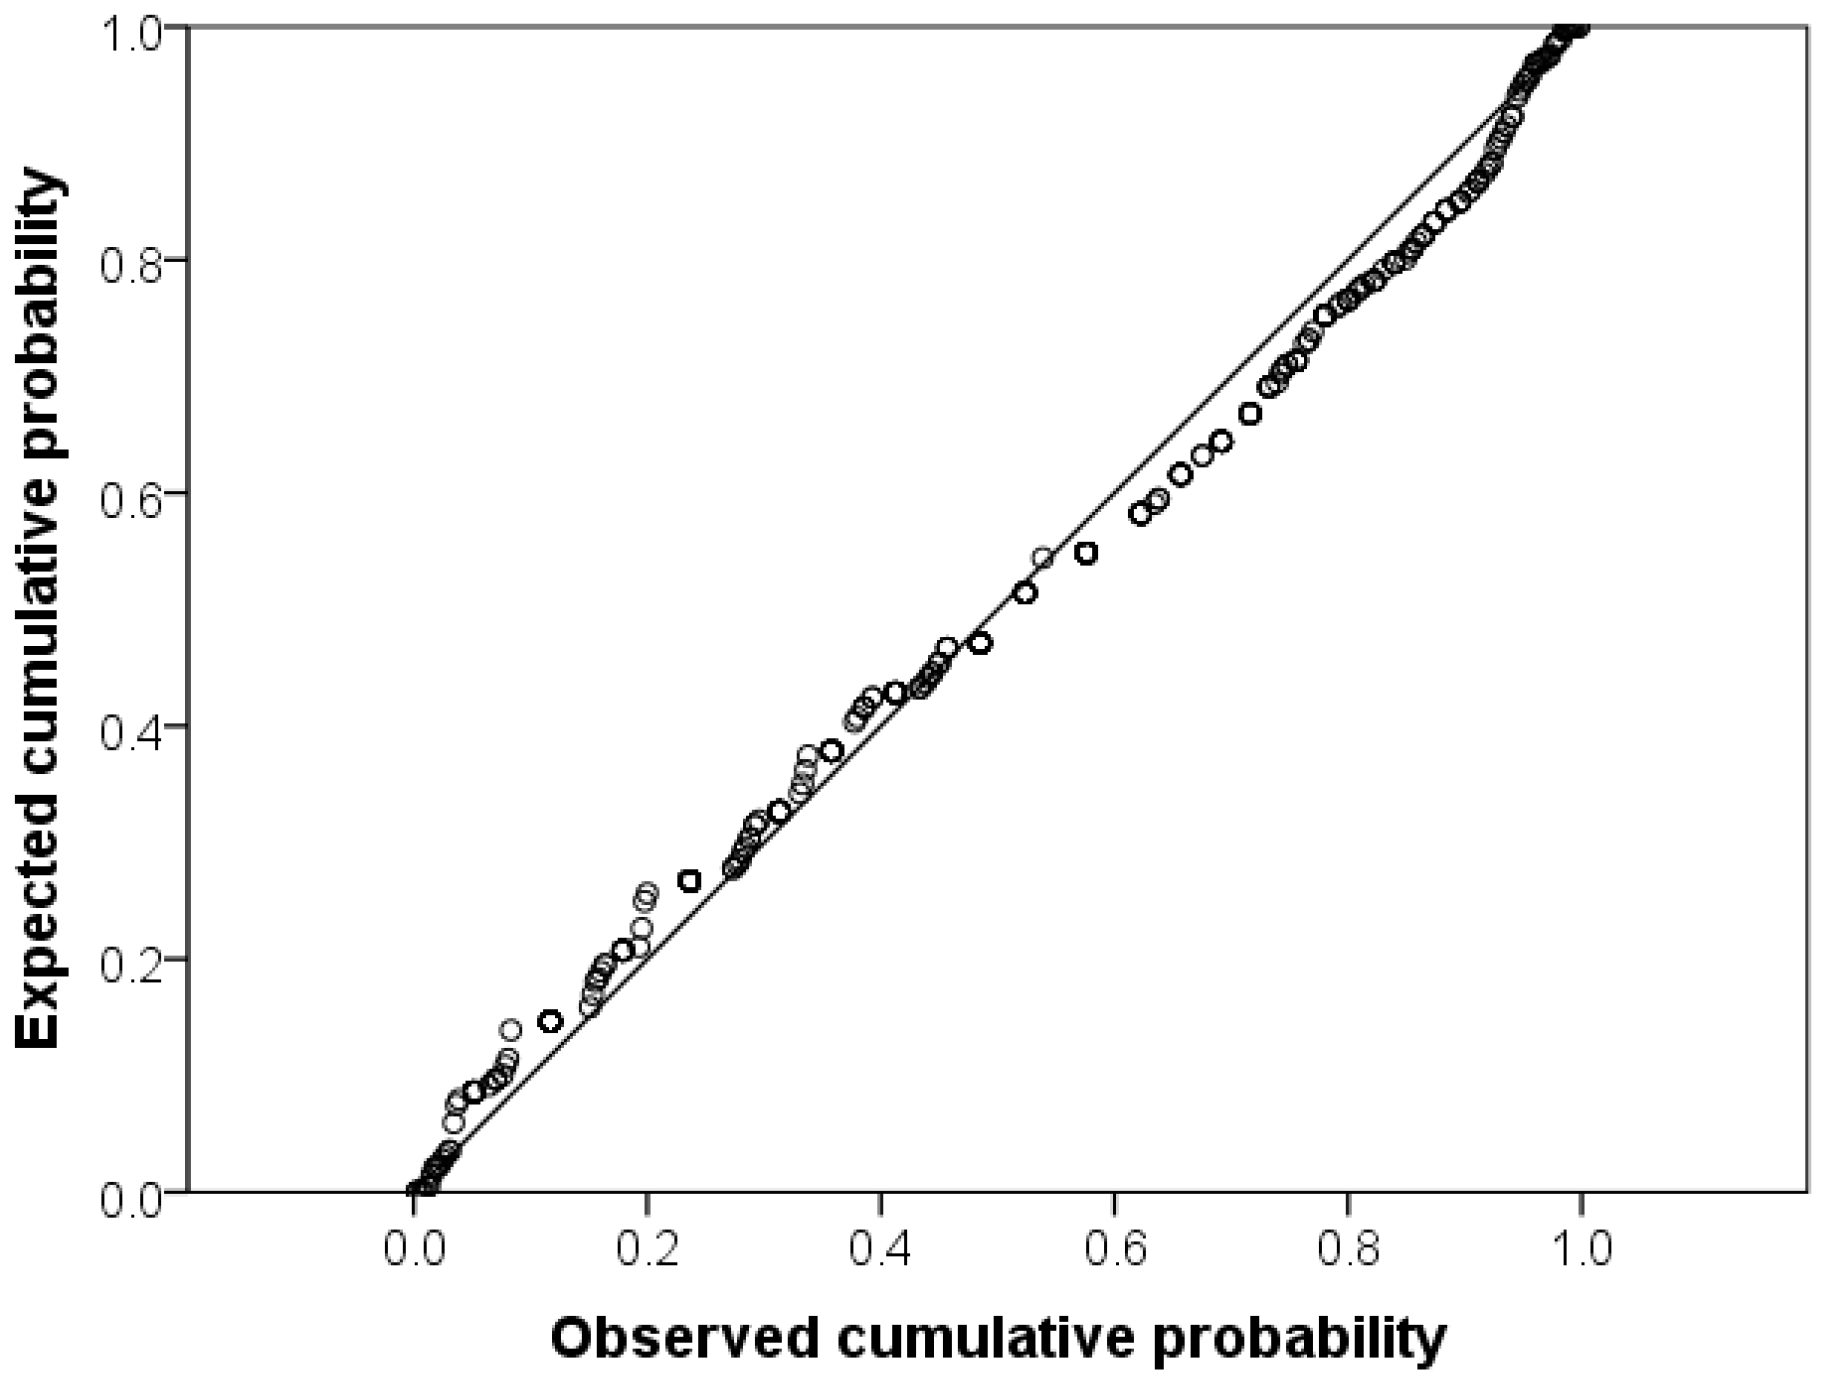
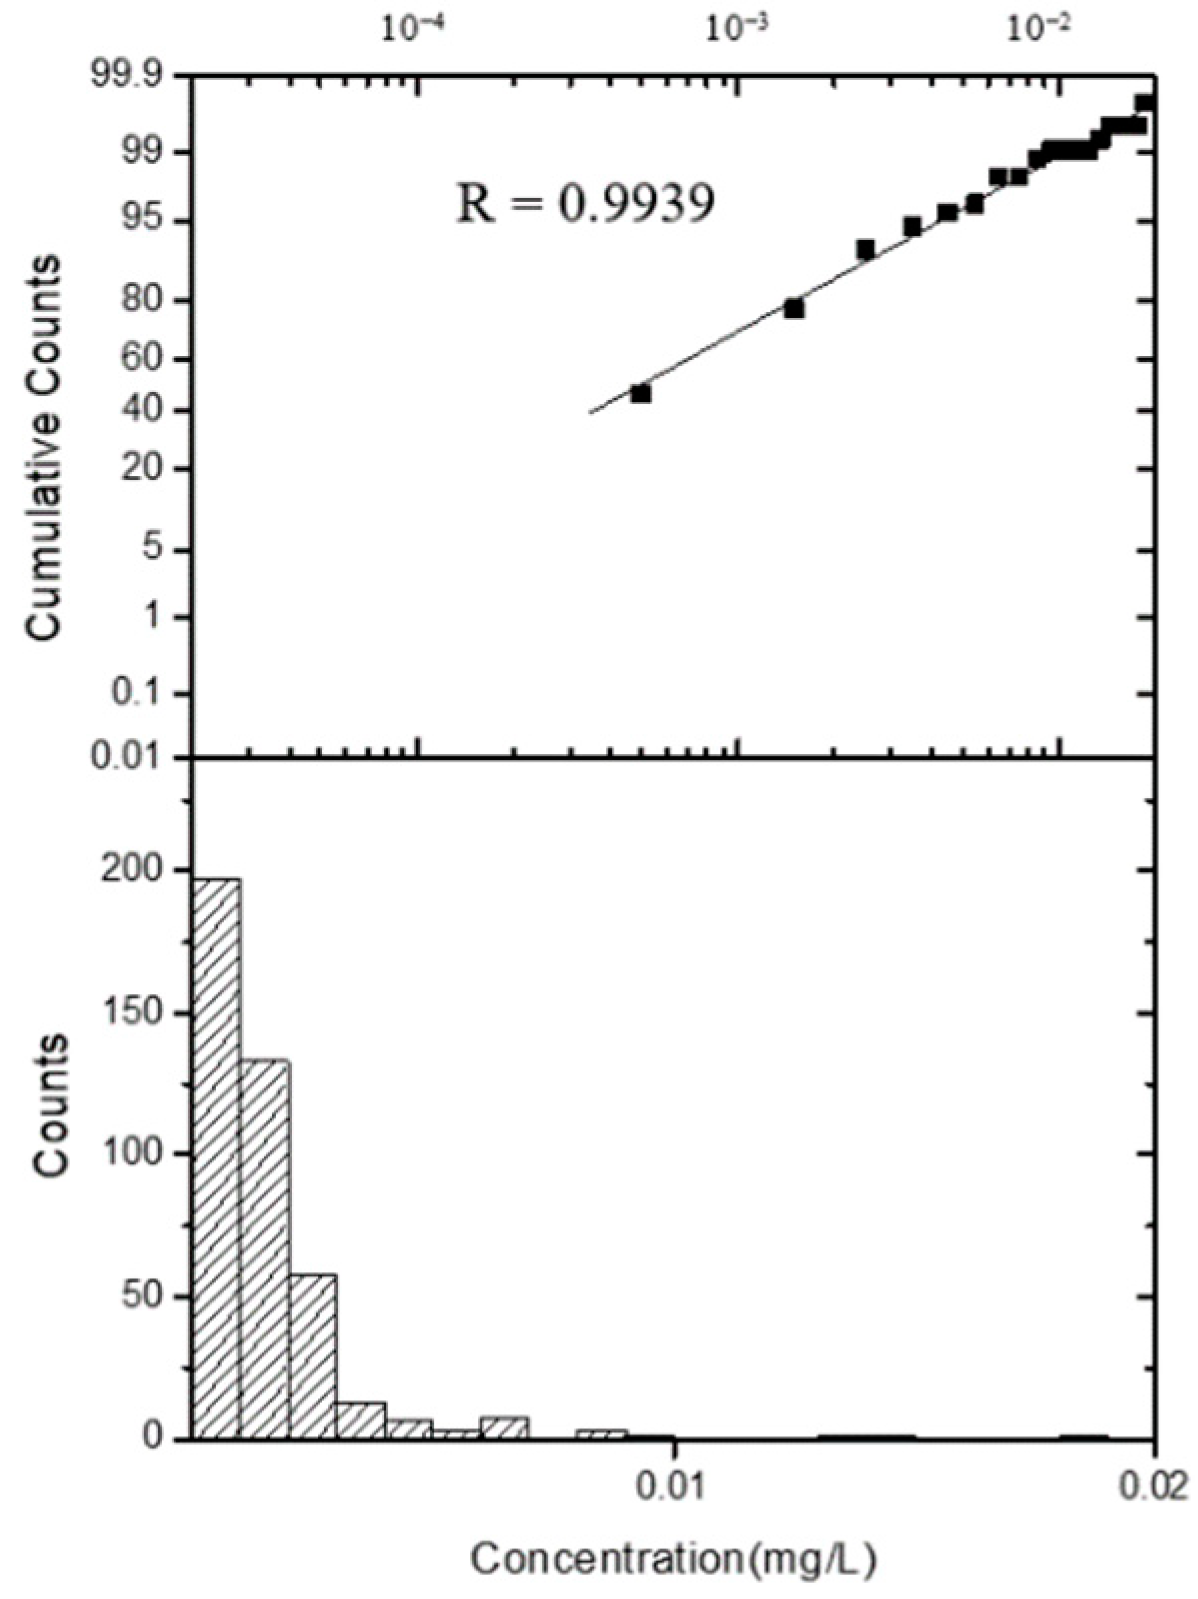
3.3. Statistical Distribution of Heavy Metal and Metalloid Discharge Concentrations
- —the ratio of non-detected, ; when , = 1, or else = 0;
- —the function of lognormal distribution.
3.4. Factors Influencing Heavy Metal and Metalloid Discharge Concentrations
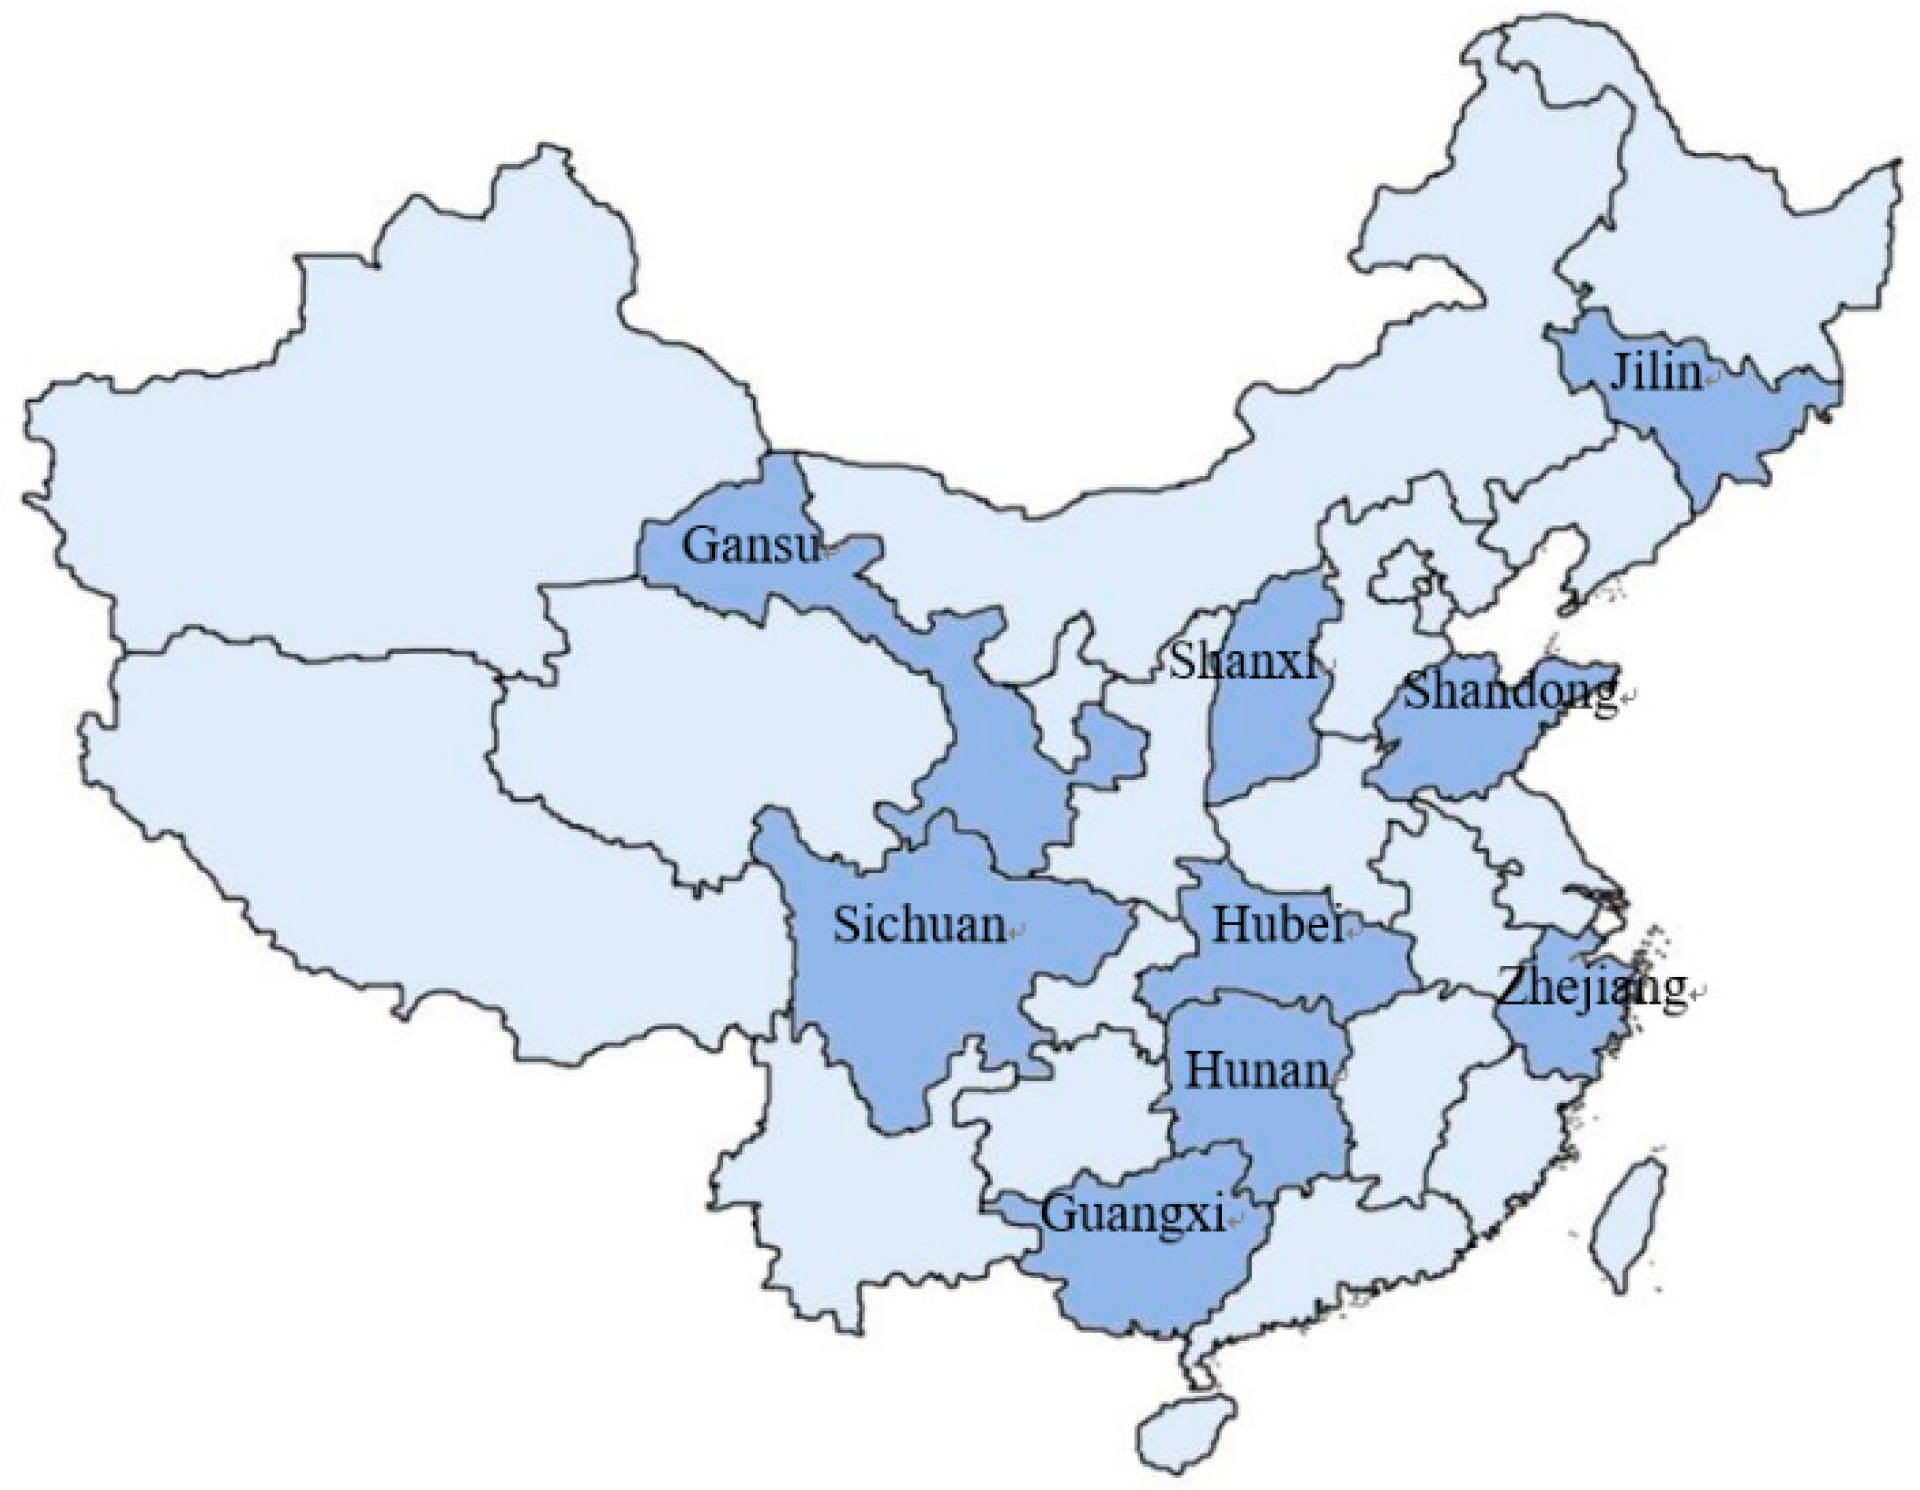
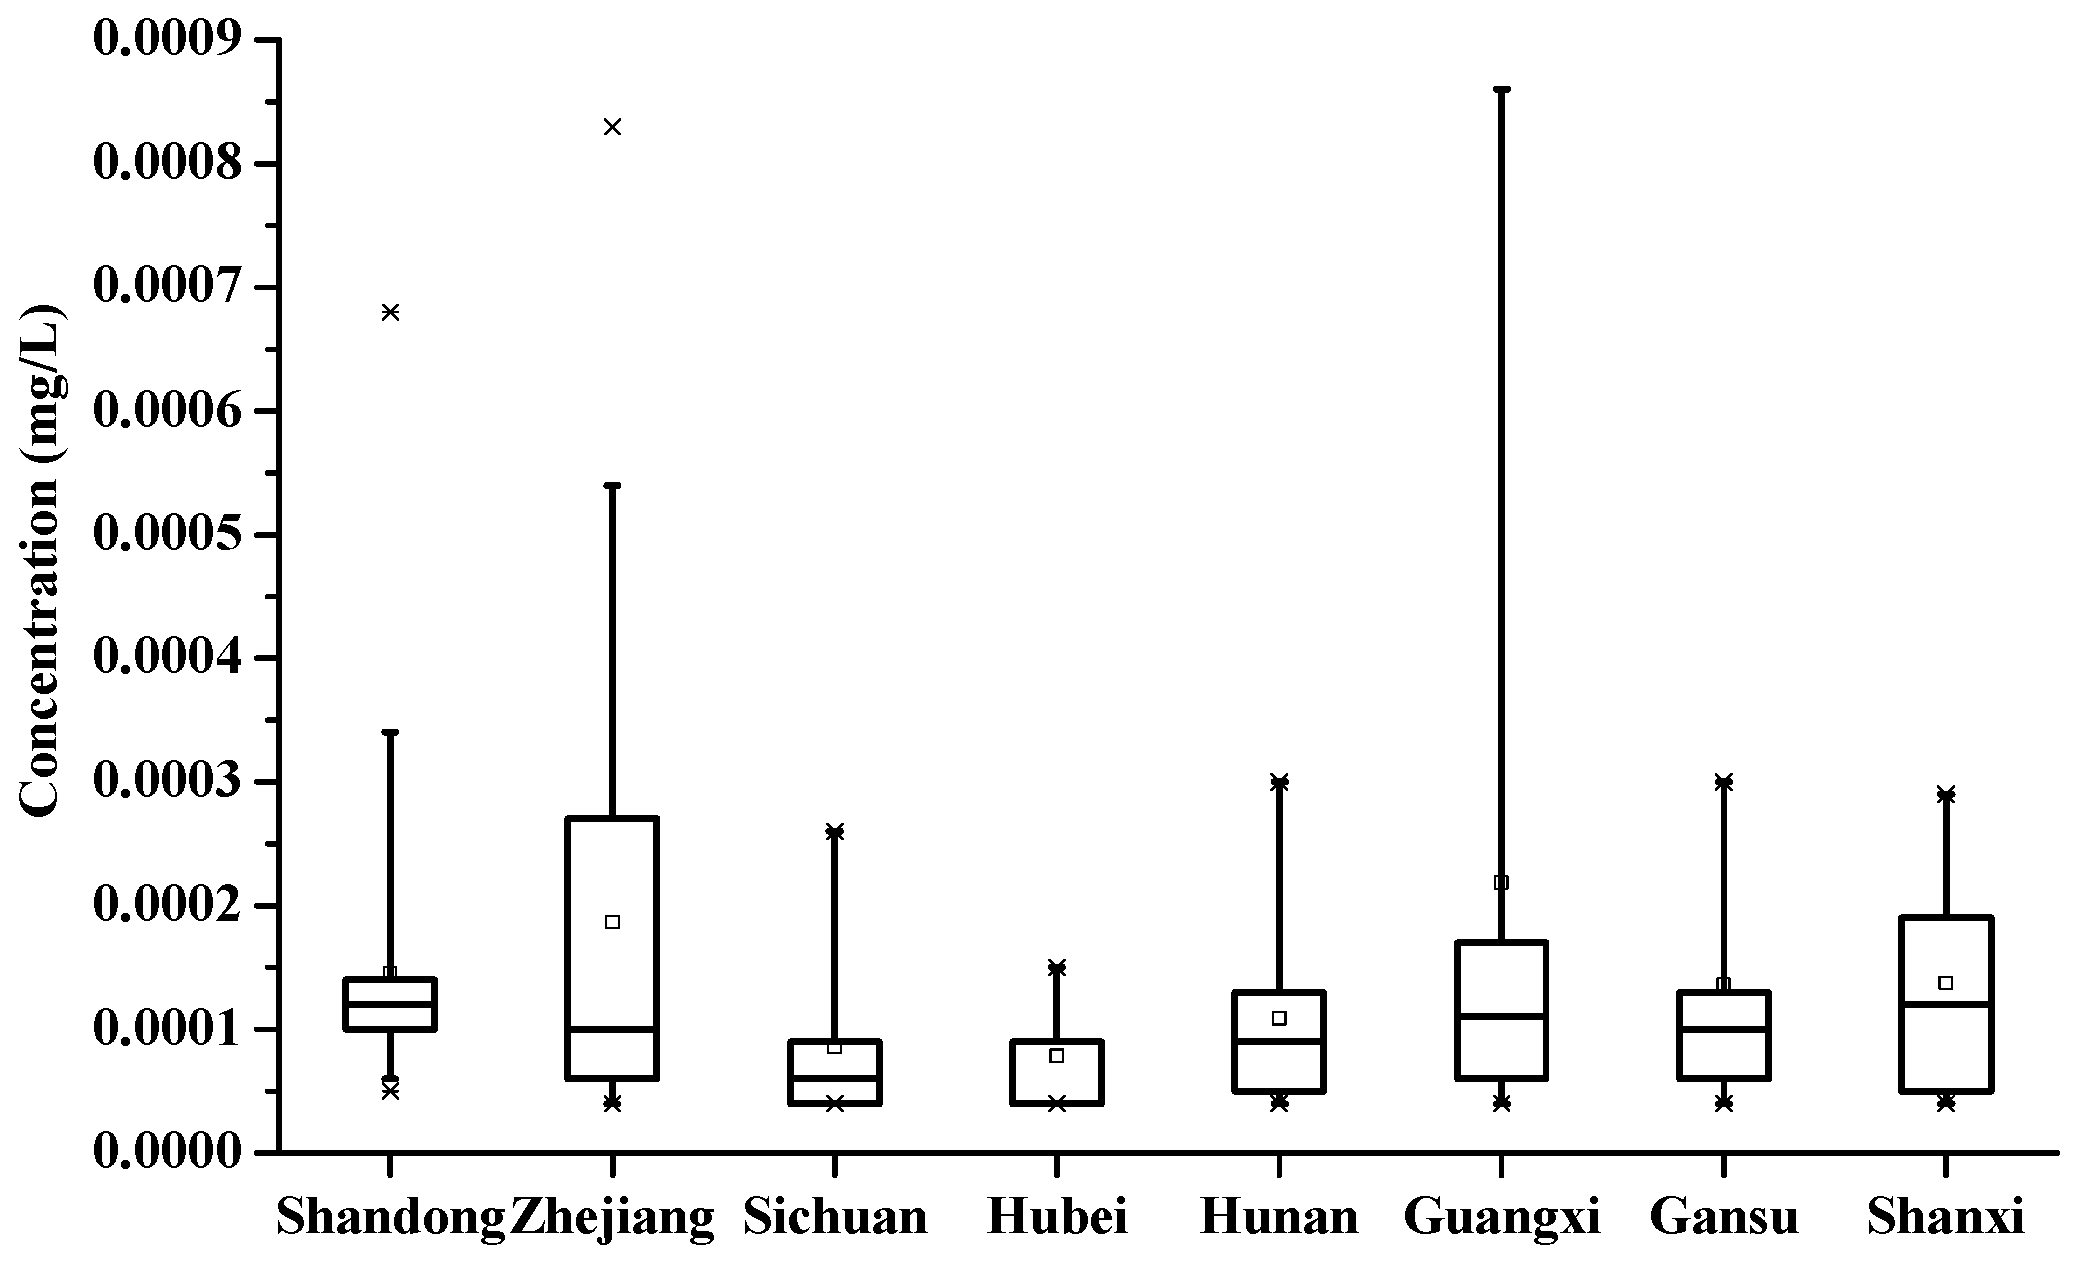
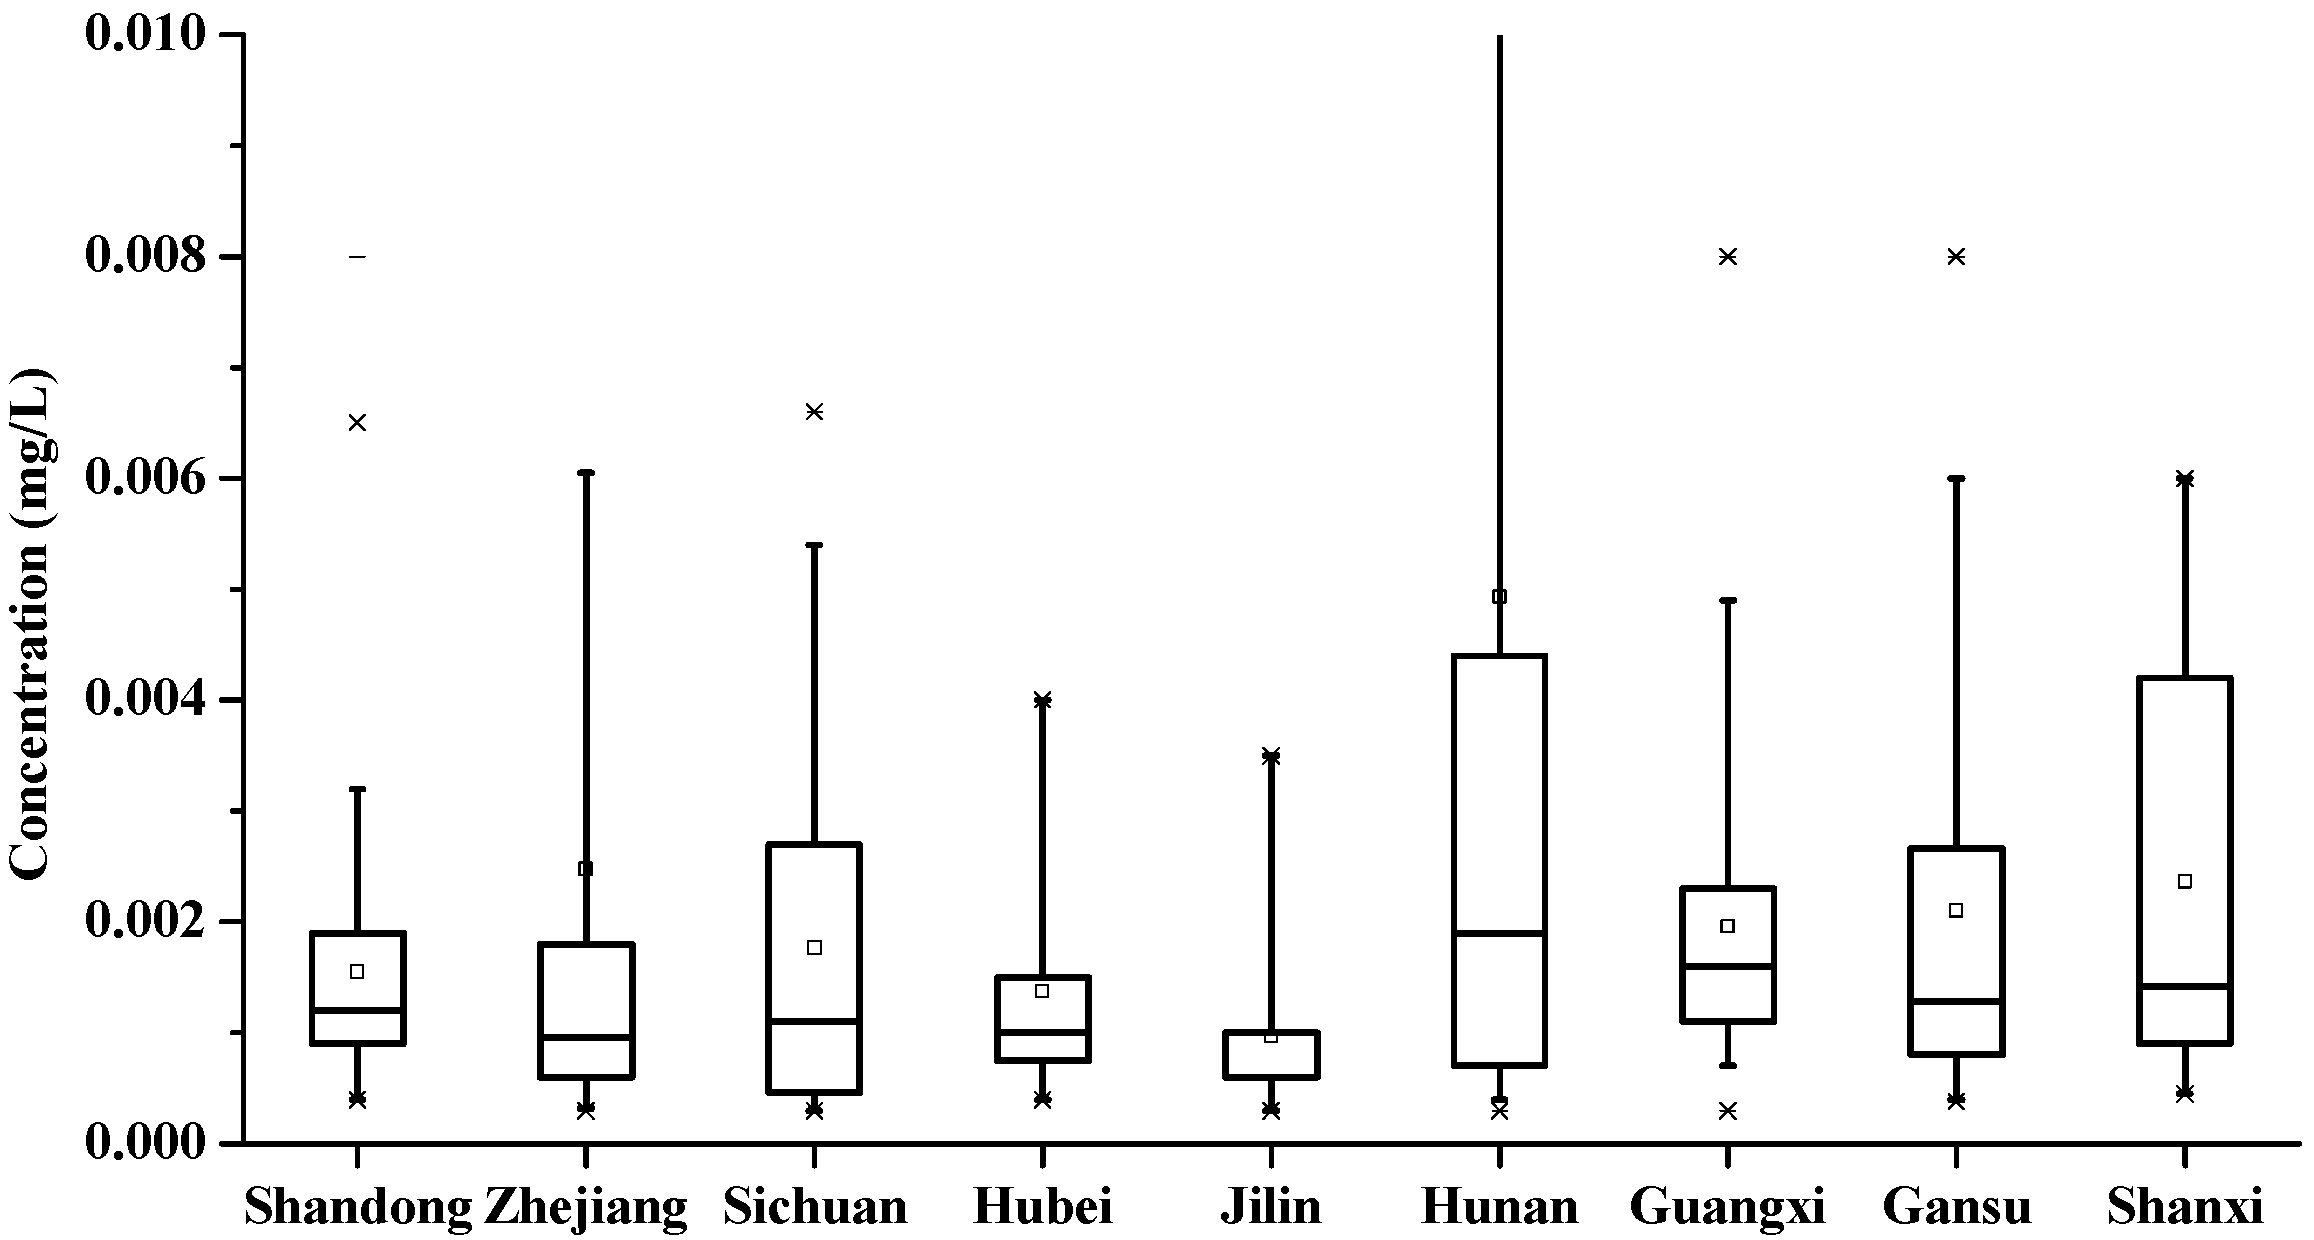
3.4.1. Regional Differences
3.4.2. Scale Differences
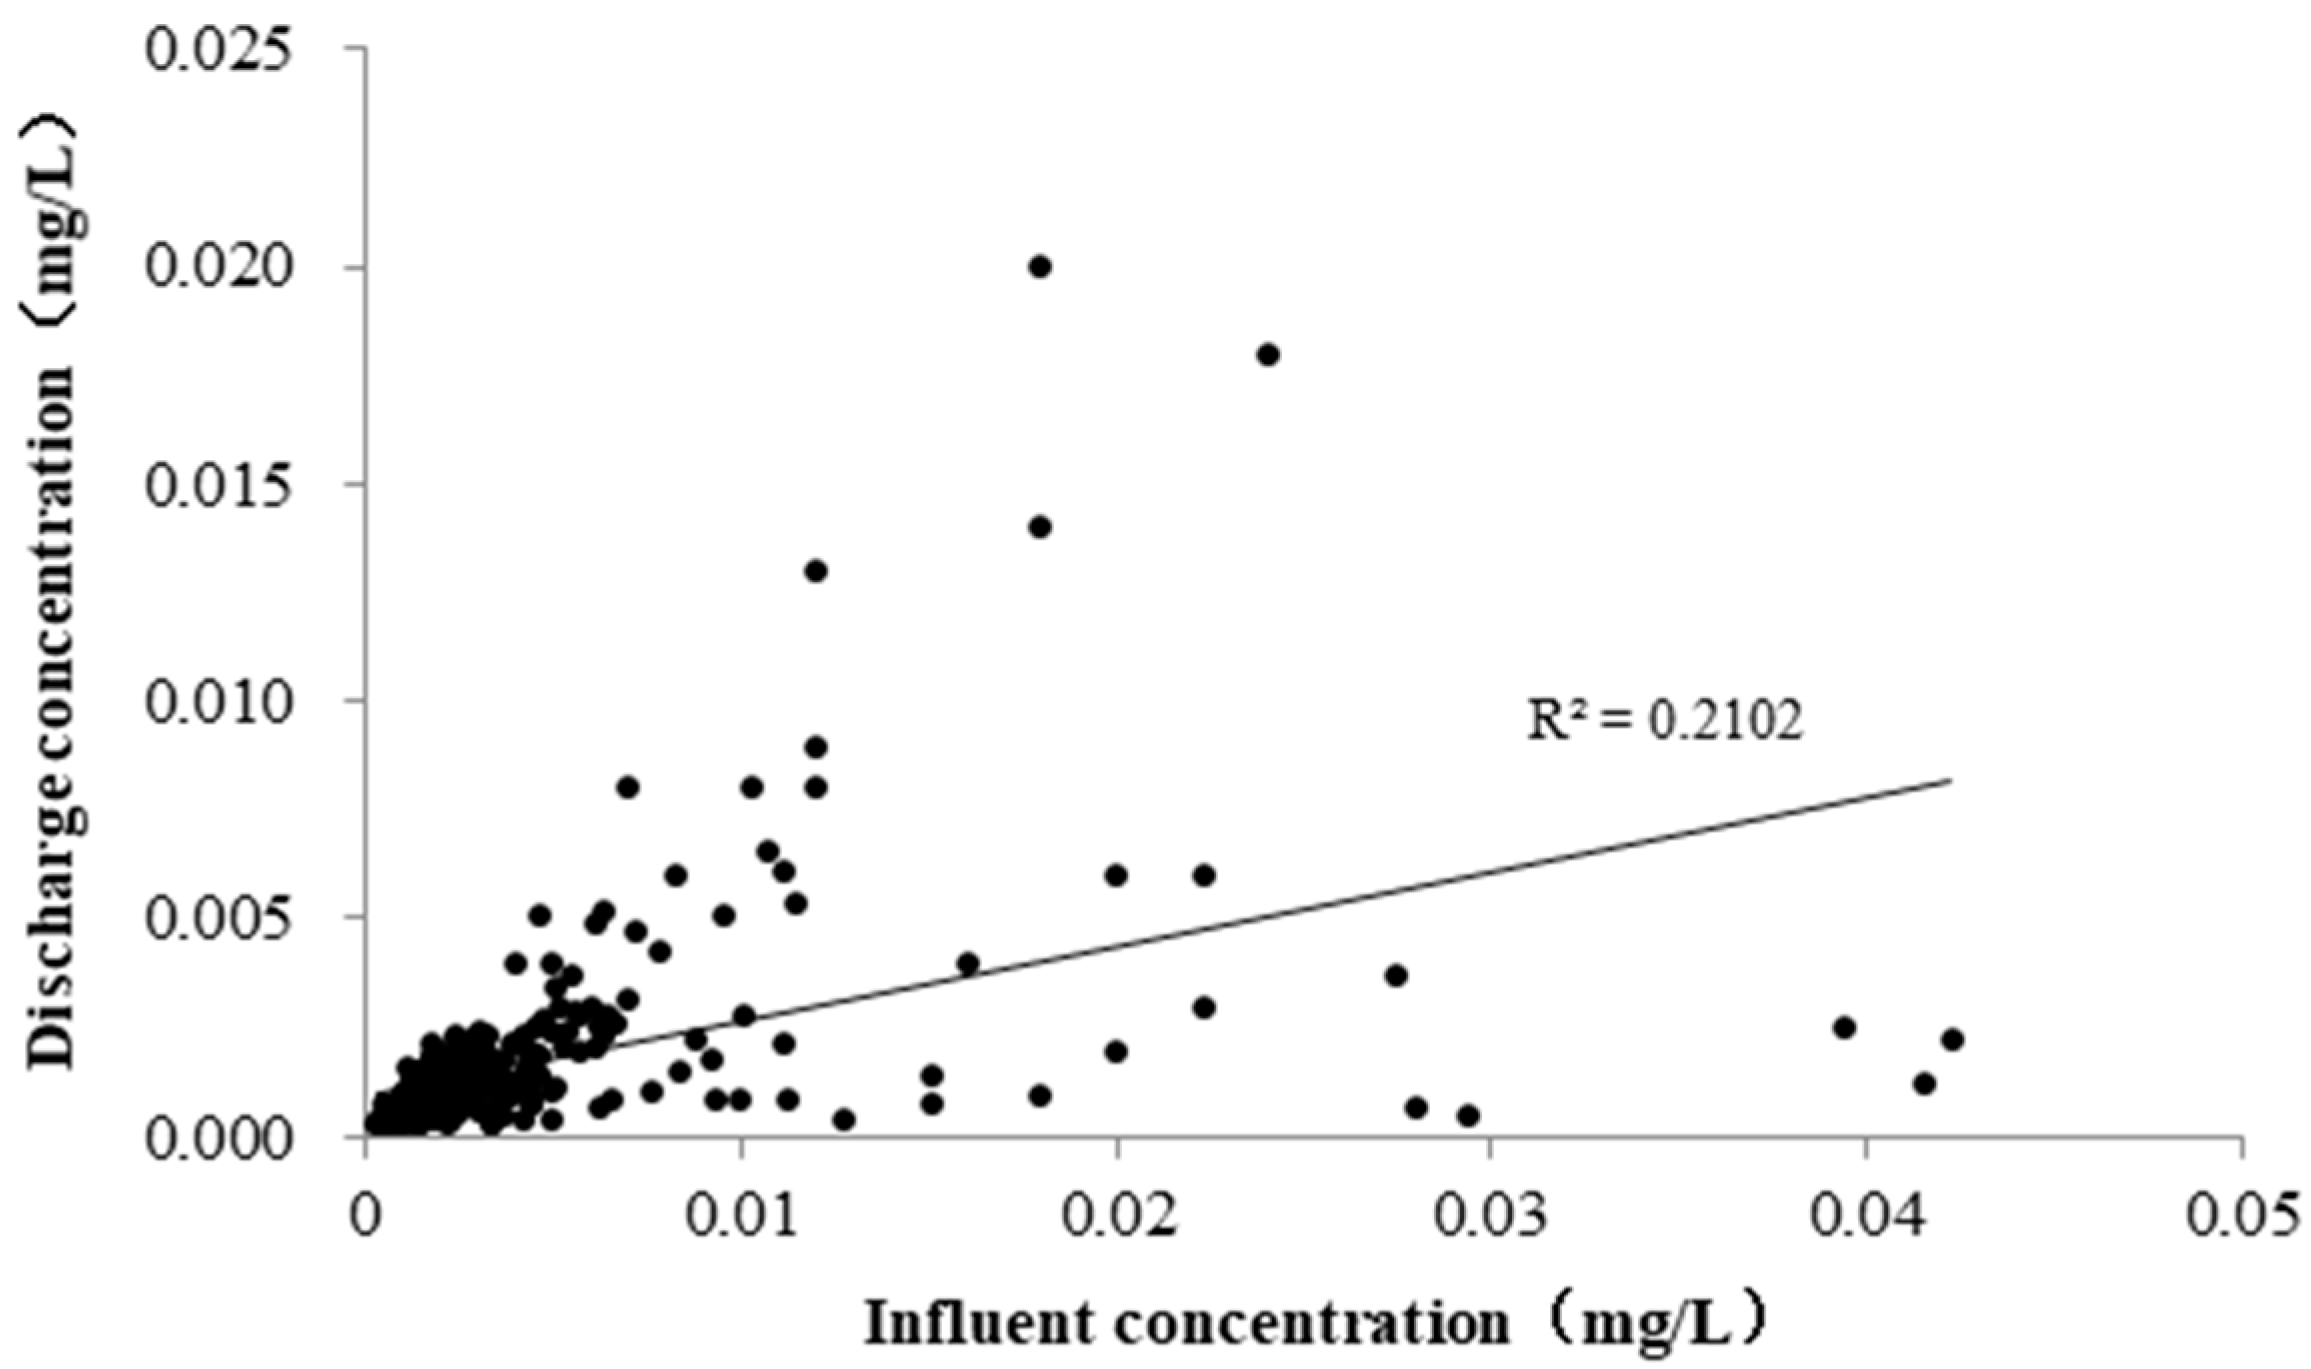
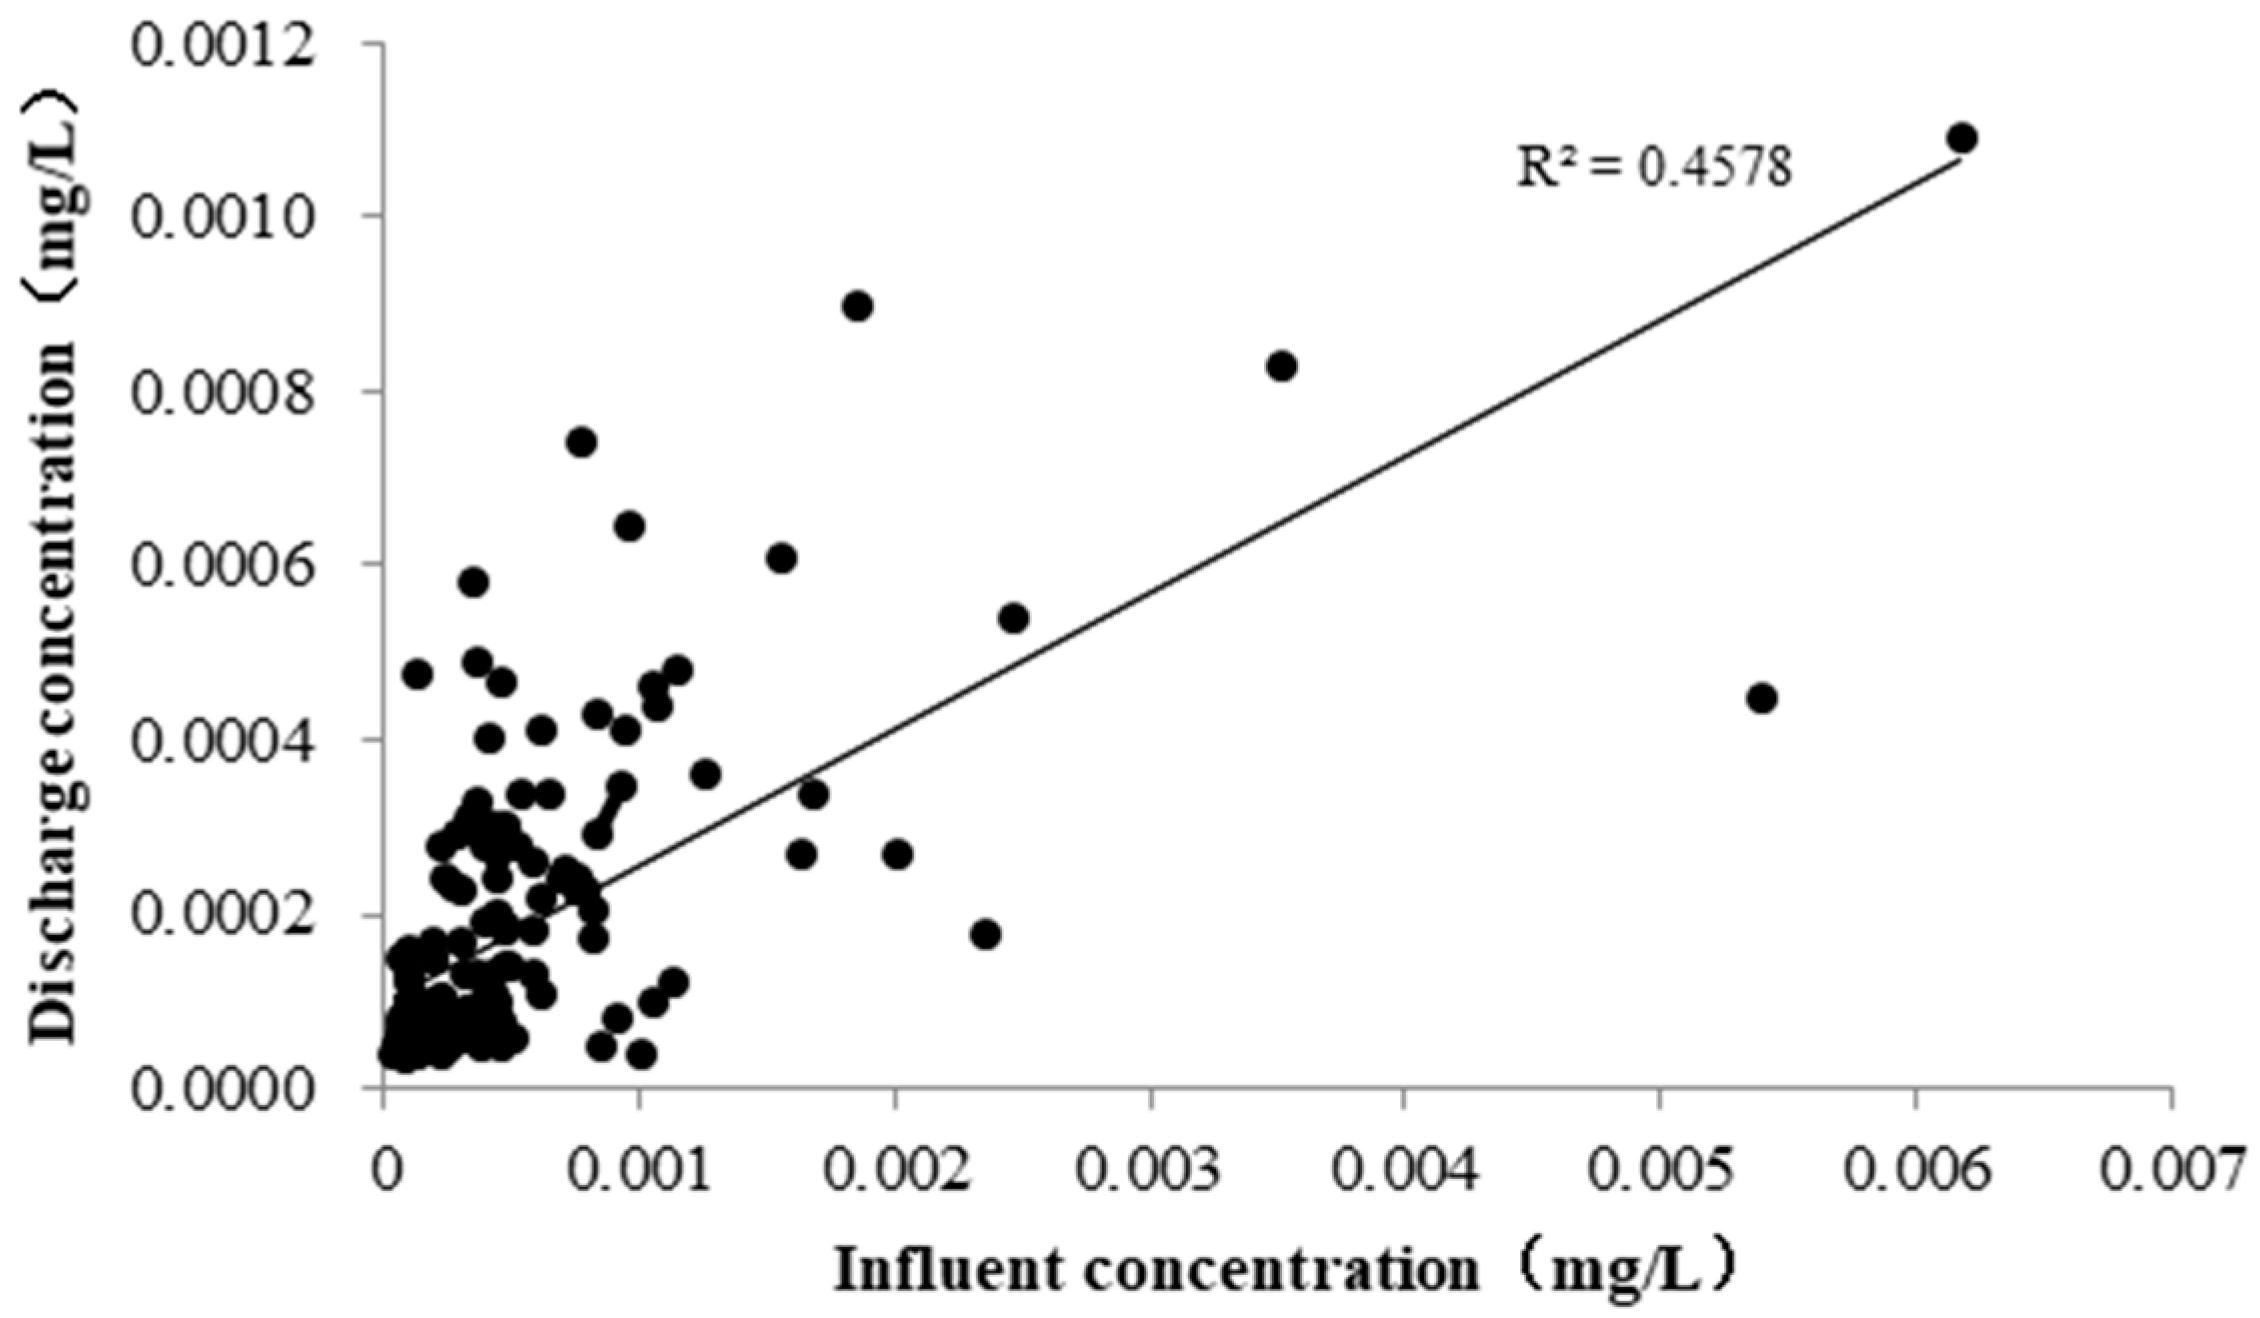
3.4.3. Relationship between the Concentrations of Influent and Effluent
3.5. Discharge Limits of Hg and As
3.5.1. Long-Time Averages
- —the long-time average of heavy metal or metalloid of ;
- —the rate of below method detection limit;
- —method detection limit;
- —the concentration higher than method detection limit;
- —the number of concentration data up the method detection limit.
3.5.2. Daily Maximum Variability Factors
- —daily maximum variable factor;
- —estimated 99th percentile of Hg or As discharge concentration at a given plant;
- —estimated expected value of Hg or As discharge concentration at a given plant;
- —natural logarithm of Hg or As discharge concentration other than ND;
- —normal cumulated distribution function value.
3.5.3. Discharge Limits
4. Conclusions
Author Contributions
Funding
Conflicts of Interest
References
- EU. Pollutants in Urban Waste Water and Sewage Sludge; European Communities: Luxembourg, 2001. [Google Scholar]
- Oliver, B.G.; Cosgrove, E.G. Metal concentrations in the sewage, effluents, and sludge of some southern Ontario wastewater treatment plants. Environ. Lett. 1975, 9, 75–90. [Google Scholar] [CrossRef] [PubMed]
- Li, P.; Fan, J.H.; Liu, R.; Yu, B.; Cheng, J.D.; Yu, S.L.; Chen, L.J.; Shan, X.L. A study on pollution characteristics and removal performance of heavy metals in a tannery and textile dyeing industrial park wastewater treatment plant. Environ. Eng. 2012, 30, 101–108. [Google Scholar]
- Ministry of Ecology and Environment of China. Integrated Wastewater Discharge Standard (GB 8978-1996); Ministry of Ecology and Environment of the People’s Republic of China: Beijing, China, 1996. Available online: http://www.mee.gov.cn (accessed on 15 May 2018).
- Ministry of Ecology and Environment of China. Discharge Standard of Pollutants for Municipal Wastewater Treatment Plant (GB 18918-2002); Ministry of Ecology and Environment of the People’s Republic of China: Beijing, China, 2002. Available online: http://www.mee.gov.cn (accessed on 15 May 2018).
- Ma, S.H.; He, X.H. The brief introduction of discharge standard of urban wastewater treatment plant (GB 18918-2002). Water Wastew. Eng. 2003, 29, 89–94. (In Chinese) [Google Scholar]
- Zhou, Y.H.; Lu, Y.N.; Zhang, Y.; Zhu, J.; Lei, J.; Shen, C.; Wu, X.F. Assessment on the COD discharge status of municipal wastewater treatment plant in a city of China. Environ. Sci. 2014, 35, 3998–4002. [Google Scholar]
- Zhou, Y.H.; Lu, Y.N.; Zhang, Y.; Ren, N.; Lei, J. Assessment on daily discharge status of regular water pollutants in urban sewage treatment plant. Ind. Water Treat. 2016, 36, 12–15. (In Chinese) [Google Scholar]
- Zhou, Y.H.; Duan, N.; Wu, X.F.; Fang, H. COD discharge limits for urban wastewater treatment plants in China based on statistical methods. Water 2018, 10, 777. [Google Scholar] [CrossRef]
- Environment Statistical Annual Report 2015; Ministry of Environment Protection of China: Beijing, China, 2015. Available online: http://www.mee.gov.cn (accessed on 15 May 2018).
- Kahn, H.D.; Rubin, M.B. Use of statistical methods in industrial water pollution control regulations in the United States. Environ. Monit. Assess. 1989, 13, 129–148. [Google Scholar] [CrossRef] [PubMed]
- Ministry of Ecology and Environment of China. Water Quality-Determination of Mercury, Arsenic, Selenium, Bismuth and Antimony-Atomic Fluorescence Spectrometry (HJ 694-2014); Ministry of Ecology and Environment of the People’s Republic of China: Beijing, China, 2014. Available online: http://www.mee.gov.cn (accessed on 31 July 2018).
- Ministry of Ecology and Environment of China. Water Quality-Determination of Alkyl Mercury-Gas Chromatography (GB/T 14204-93); Ministry of Ecology and Environment of the People’s Republic of China: Beijing, China, 1993. Available online: http://www.mee.gov.cn (accessed on 31 July 2018).
- Ministry of Ecology and Environment of China. Water Quality-Determination of Cadmium-Spectrophotometric Method with Dithlzone (GB 7471-87); Ministry of Ecology and Environment of the People’s Republic of China: Beijing, China, 1987. Available online: http://www.mee.gov.cn (accessed on 31 July 2018).
- Ministry of Ecology and Environment of China. Water Quality-Determination of Total Chromium (GB 7466-87); Ministry of Ecology and Environment of the People’s Republic of China: Beijing, China, 1987. Available online: http://www.mee.gov.cn (accessed on 31 July 2018).
- Ministry of Ecology and Environment of China. Water Quality-Determination of Chromium (VI) (GB 7467-87); Ministry of Ecology and Environment of the People’s Republic of China: Beijing, China, 1987. Available online: http://www.mee.gov.cn (accessed on 31 July 2018).
- Ministry of Ecology and Environment of China. Water Quality-Determination of Lead-Spectrophotometric Method with Dithizone (GB/T 7470-1987); Ministry of Ecology and Environment of the People’s Republic of China: Beijing, China, 1987. Available online: http://www.mee.gov.cn (accessed on 31 July 2018).
- Ministry of Ecology and Environment of China. Water Quality-Determination of Nickel-Flame Atomic Absorption Spectrometric Method (GB11912-89); Ministry of Ecology and Environment of the People’s Republic of China: Beijing, China, 1989. Available online: http://www.mee.gov.cn (accessed on 31 July 2018).
- Ministry of Ecology and Environment of China. Water Quality-Determination of Beryllium-Graphite Furnace Atomic Absorption Spectrophotometry (HJ/T59-2000); Ministry of Ecology and Environment of the People’s Republic of China: Beijing, China, 2000. Available online: http://www.mee.gov.cn (accessed on 31 July 2018).
- Ministry of Ecology and Environment of China. Water Quality-Determination of 65 Elements-Inductively Coupled Plasma-Mass Spectrometry (HJ 700-2014); Ministry of Ecology and Environment of the People’s Republic of China: Beijing, China, 2014. Available online: http://www.mee.gov.cn (accessed on 31 July 2018).
- Ministry of Ecology and Environment of China. Water Quality-Determination of Copper-Sodium Diethylthiocabamate Spectrophotometric Method (HJ 485-2009); Ministry of Ecology and Environment of the People’s Republic of China: Beijing, China, 2009. Available online: http://www.mee.gov.cn (accessed on 31 July 2018).
- Ministry of Ecology and Environment of China. Water Quality-Ditermination of Copper, Zinc, Lead and Cadmium-Atomic Absorption Spectrometry (GB 7475-87); Ministry of Ecology and Environment of the People’s Republic of China: Beijing, China, 1987. Available online: http://www.mee.gov.cn (accessed on 31 July 2018).
- Ministry of Ecology and Environment of China. Water Quality-Determination of Iron and Manganese-Flame Atomic Absorption Spectrometric Method (GB 11911-89); Ministry of Ecology and Environment of the People’s Republic of China: Beijing, China, 1989. Available online: http://www.mee.gov.cn (accessed on 31 July 2018).
- Ministry of Ecology and Environment of China. Water Quality-Determination of Selemium-Diaminonaphthalene Fluorometric Method (GB 11902-89); Ministry of Ecology and Environment of the People’s Republic of China: Beijing, China, 1989. Available online: http://www.mee.gov.cn (accessed on 31 July 2018).
- US EPA. Development Document for Effluent Limitations Guidelines and Standards for the Organic Chemicals, Plastics and Synthetic Fibers Point Source Category; United States Environmental Protection Agency: Washington, WA, USA, 1987.
- Gbondo-Tugbawa, S.S.; McAlear, J.A.; Driscoll, C.T.; Sharpe, C.W. Total and methyl mercury transformations and mass loadings within a wastewater treatment plant and the impact of the effluent discharge to an alkaline hyper eutrophic lake. Water Res. 2010, 44, 2863–2875. [Google Scholar] [CrossRef] [PubMed]
- Da Silva Oliveira, A.; Bocio, A.; Trevilato, T.M.B.; Takayanagui, A.M.M.; Domingo, J.L.; Segura-Muñoz, S.I. Heavy metals in untreated/treated urban effluent and sludge from a biological wastewater treatment plant. Environ. Sci. Pollut. Res. Int. 2007, 14, 483–489. [Google Scholar] [CrossRef]
- Busetti, F.; Badoer, S.; Cuomo, M.; Rubino, B.; Traverso, P. Occurrence and removal of potentially toxic metals and heavy metals in the wastewater treatment plant of Fusina (Venice, Italy). Ind. Eng. Chem. Res. 2005, 44, 9264–9272. [Google Scholar] [CrossRef]
- Kulbat, E.; Olanczuk, K.; Quant, B.; Geneja, M.; Haustein, E. Heavy metals removal in the mechanical-biological wastewater treatment plant “Wschód” in Gdańsk. Pol. J. Environ. Stud. 2003, 12, 635–641. [Google Scholar]
- Onchoke, K.K.; Sasu, S.A. Determination of hexavalent Chromium (Cr(VI)) concentrations via ion chromatography and UV-Vis spectrophotometry in samples collected from Nacogdoches wastewater treatment plant, East Texas (USA). Adv. Environ. Chem. 2016. [Google Scholar] [CrossRef]
- Diaz, J.P.; Navarro, M.; Lbpez, H.; Lbpez, M.C. Selenium (IV) and (VI) levels in potable, irrigation and waste waters from an industrial zone in southeastern Spain. Sci. Total Environ. 1996, 186, 231–236. [Google Scholar] [CrossRef]
- Obarska-Pempkowiak, H. Zanieczyszczenie środowiskanaturalnego metalami ciężkimi jako kryterium rolniczegowykorzystania osadów ściekowych, Zeszyty Naukowe Politechniki Gdańskiej. Budownictwo Wodne XXXV 1992, 473, 73–99. [Google Scholar]
- Kim, I.; Hong, S.-H.; Jung, J.-Y. Establishment of effluent Standards for industrial wastewaters in Korea: Current issues and suggestions for future plan. J. Water Environ. Technol. 2010, 8, 151–165. [Google Scholar] [CrossRef]
- US EPA. Development Document for Final Effluent Limitations Guidelines and Standards for the Pharmaceutical Manufacturing Point Source Category; Office of Water: Washington, WA, USA, 1998.
- Balogh, S.J.; Nollet, Y.H. Methyl mercury input to the Mississippi River from a large metropolitan wastewater treatment plant. Sci. Total Environ. 2008, 406, 145–153. [Google Scholar] [CrossRef] [PubMed]
- Li, H.; Mao, Y.X.; Li, Y.; Ma, Y.X.; Wang, X.Y.; Song, D.Y. Occurrence and mass balance of mercury at a sewage treatment plant. Part I: Total mercury. Environ. Chem. 2014, 33, 1059–1065. [Google Scholar]
- Ministry of Ecology and Environment of China. Surface Water Environmental Quality Standards (GB 3838-2002); Ministry of Ecology and Environment of the People’s Republic of China: Beijing, China, 2002. Available online: http://www.mee.gov.cn (accessed on 31 July 2018).
- Zhang, Y.H. The transformation of mercury in the sewage treatment plant and analysis of its speciation in sewage sludge. Guangzhou Chem. Ind. 2016, 44, 49–50. (In Chinese) [Google Scholar]
- Bodaly, R.A.; Rudd, W.M.; Flett, R.J. Effect of urban sewage treatment on total and methyl mercury concentrations in effluents. Biogeochemistry 1998, 40, 279–291. [Google Scholar] [CrossRef]
- Lu, J.W.; Chen, P.L.; Zhao, X.L. Study on the variation of heavy metals in the traditional municipal activated sludge wastewater treatment process. Environ. Pollut. Prev. 2008, 30, 29–32. (In Chinese) [Google Scholar]


| No. | Pollutants | Method Source | Method Detection Limits (mg/L) |
|---|---|---|---|
| 1 | Hg | HJ 694-2014 [12] | 0.00004 |
| 2 | alkyl mercury | GB/T 14204-93 [13] | 0.00001 |
| 3 | As | HJ 694-2014 [12] | 0.0003 |
| 4 | Cd | GB 7471-87 [14] | 0.001 |
| 5 | Cr | GB 7466-87 [15] | 0.004 |
| 6 | Cr6+ | GB 7467-87 [16] | 0.004 |
| 7 | Pb | GB/T 7470-1987 [17] | 0.01 |
| 8 | Ni | GB 11912-89 [18] | 0.05 |
| 9 | Be | HJ/T 59-2000 [19] | 0.00002 |
| 10 | Ag | HJ 700-2014 [20] | 0.00004 |
| 11 | Cu | HJ 485-2009 [21] | 0.01 |
| 12 | Zn | GB 7475-87 [22] | 0.05 |
| 13 | Mn | GB 11911-89 [23] | 0.01 |
| 14 | Se | GB 11902-89 [24] | 0.00025 |
| No. | Pollutant | Number of WWTPs | Number of Samples | Detection Rate | Data of Detection (mg/L) | Discharge Limits in GB 18918-2002 (mg/L) | |||
|---|---|---|---|---|---|---|---|---|---|
| Max | Min | Average | Medium | ||||||
| 1 | Hg | 872 | 1080 | 26.7% | 0.00109 | 0.00004 | 0.00017 | 0.00011 | 0.001 |
| 2 | alkyl mercury | 438 | 498 | 0% | — 1 | — 1 | — 1 | — 1 | Non-detected |
| 3 | As | 858 | 925 | 58.2% | 0.064 | 0.0003 | 0.0023 | 0.0012 | 0.1 |
| 4 | Cd | 873 | 786 | 6.0% | 0.009 | 0.001 | 0.004 | 0.004 | 0.01 |
| 5 | Cr | 864 | 761 | 31.3% | 0.44 | 0.004 | 0.026 | 0.016 | 0.1 |
| 6 | Cr6+ | 881 | 1120 | 15.9% | 0.118 | 0.004 | 0.014 | 0.009 | 0.05 |
| 7 | Pb | 873 | 877 | 6.2% | 0.11 | 0.01 | 0.04 | 0.03 | 0.1 |
| 8 | Ni | 122 | 124 | 14.5% | 0.4 | 0.06 | 0.18 | 0.14 | 0.05 |
| 9 | Be | 32 | 43 | 18.6% | 0.0001 | 0.00002 | 0.00004 | 0.00004 | 0.002 |
| 10 | Ag | 32 | 15 | 6.7% | 0.00023 | 0.00023 | 0.00023 | 0.00023 | 0.1 |
| 11 | Cu | 104 | 50 | 44.0% | 0.36 | 0.01 | 0.11 | 0.09 | 0.5 |
| 12 | Zn | 63 | 63 | 22.2% | 0.37 | 0.05 | 0.14 | 0.11 | 1.0 |
| 13 | Mn | 37 | 63 | 41.3% | 0.470 | 0.012 | 0.128 | 0.060 | 2.0 |
| 14 | Se | 24 | 43 | 41.9% | 0.02530 | 0.00025 | 0.00444 | 0.00050 | 0.1 |
| No. | Pollutants | Countries | Concentration (μg/L) | Reference | This Study (μg/L) |
|---|---|---|---|---|---|
| 1 | Hg | U.S. Brazil | 0.023 ± 0.016 0–0.24 | [26] [27] | 0.04–1.09 |
| 2 | alkyl mercury | U.S. | 0.00153 ± 0.00093 | [26] | Undetected |
| 3 | As | Italy | 0.5–9.2 | [28] | 0.3–64 |
| 4 | Cd | Italy Brazil Canada | 0.1–1.6 0.04–0.11 1–20 | [28] [27] [2] | 1–9 |
| 5 | Cr | Brazil Canada Poland | 1.68–13.53 10–710 10 ± 10 | [27] [2] [29] | 4–440 |
| 6 | Cr6+ | U.S. | 1 ± 0.6 | [30] | 4–118 |
| 7 | Pb | Brazil Canada Poland | 4.22–76.42 50–200 10 ± 10 | [27] [2] [29] | 10–110 |
| 8 | Ni | Canada Poland | 30–670 20 ± 10 | [2] [29] | 60–400 |
| 9 | Be | Canada | Undetected | [2] | 0.02–0.1 |
| 10 | Ag | Canada Poland | <10 10 | [2] [29] | 0.23 |
| 11 | Cu | Brazil Canada Poland | 2.13–19.87 20–100 10 ± 20 | [27] [2] [29] | 10–360 |
| 12 | Zn | Italy Brazil Canada Poland | 24–238 22.80–76.25 40–560 50 ± 90 | [28] [27] [2] [29] | 50–370 |
| 13 | Mn | Brazil Canada | 35.55–73.41 20–220 | [27] [2] | 12–470 |
| 14 | Se | Spain | 0.133 ± 0.085 | [31] | 0.25–25.3 |
| No. | Pollutant | Average Removal Rate |
|---|---|---|
| 1 | Hg | 57.4% |
| 2 | alkyl mercury | — 1 |
| 3 | As | 47.3% |
| 4 | Cd | 61.0% |
| 5 | Cr | 69.8% |
| 6 | Cr6+ | 64.4% |
| 7 | Pb | 66.4% |
| 8 | Ni | 50.8% |
| 9 | Be | 25.6% |
| 10 | Ag | — 1 |
| 11 | Cu | 53.1% |
| 12 | Zn | 65.5% |
| 13 | Mn | 42.8% |
| 14 | Se | 63.3% |
| Pollutant | Scale of WWTPs | Number of Detected Samples | Average Discharge Concentration(mg/L) |
|---|---|---|---|
| Hg | Large-scale | 10 | 0.00013 |
| Mid-scale | 75 | 0.00016 | |
| Small-scale | 10 | 0.00016 | |
| As | Large-scale | 18 | 0.0063 |
| Mid-scale | 148 | 0.0017 | |
| Small-scale | 21 | 0.0010 |
| Pollutants | Average of Standard Deviation (mg/L) | |
|---|---|---|
| Influent | Effluent | |
| Hg | 0.0115 | 0.0001 |
| As | 0.0115 | 0.0017 |
| No. of WWTPs | Number of Samples | Rate of Undetected | LTA (mg/L) | No. of WWTPs | Number of Samples | Rate of Undetected | LTA (mg/L) |
|---|---|---|---|---|---|---|---|
| 1 | 38 | 76.3% | 0.00007 | 51 | 18 | 66.7% | 0.00011 |
| 2 | 34 | 76.5% | 0.00010 | 51 | 18 | 44.4% | 0.00005 |
| 3 | 23 | 47.8% | 0.00041 | 51 | 7 | 42.9% | 0.00007 |
| 4 | 25 | 44.0% | 0.00008 | 51 | 18 | 77.8% | 0.00005 |
| 5 | 22 | 27.3% | 0.00008 | 51 | 18 | 72.2% | 0.00005 |
| 6 | 21 | 47.6% | 0.00012 | 51 | 17 | 23.5% | 0.00014 |
| 7 | 21 | 38.1% | 0.00007 | 51 | 15 | 40.0% | 0.00014 |
| 8 | 16 | 25.0% | 0.00005 | 51 | 15 | 60.0% | 0.00011 |
| 9 | 23 | 65.2% | 0.00007 | 51 | 10 | 70.0% | 0.00004 |
| 10 | 23 | 65.2% | 0.00008 | 51 | 15 | 46.7% | 0.00019 |
| 11 | 24 | 66.7% | 0.00009 | 51 | 15 | 53.3% | 0.00011 |
| 12 | 14 | 71.4% | 0.00008 | 51 | 14 | 42.9% | 0.00008 |
| 13 | 21 | 19.0% | 0.00027 | 51 | 11 | 0.0% | 0.00032 |
| 14 | 10 | 30.0% | 0.00008 | 51 | 13 | 69.2% | 0.00006 |
| 15 | 22 | 81.8% | 0.00005 | 51 | 13 | 0.0% | 0.00008 |
| 16 | 8 | 12.5% | 0.00033 | 51 | 12 | 41.7% | 0.00009 |
| 17 | 22 | 54.5% | 0.00006 | 51 | 12 | 58.3% | 0.00008 |
| 18 | 13 | 15.4% | 0.00010 | 51 | 12 | 75.0% | 0.00008 |
| 19 | 10 | 40.0% | 0.00011 | 51 | 10 | 40.0% | 0.00006 |
| 20 | 22 | 63.6% | 0.00005 | 51 | 10 | 20.0% | 0.00028 |
| 21 | 11 | 27.3% | 0.00009 | 51 | 10 | 20.0% | 0.00038 |
| 22 | 22 | 22.7% | 0.00008 | 51 | 10 | 40.0% | 0.00015 |
| 23 | 15 | 13.3% | 0.00045 | 51 | 8 | 50.0% | 0.00005 |
| 24 | 22 | 45.5% | 0.00008 | 51 | 9 | 0.0% | 0.00052 |
| 25 | 21 | 47.6% | 0.00006 | 51 | 9 | 11.1% | 0.00076 |
| 26 | 21 | 61.9% | 0.00007 | 51 | 9 | 0.0% | 0.00026 |
| 27 | 18 | 77.8% | 0.00005 | 51 | 9 | 22.2% | 0.00009 |
| 28 | 21 | 23.8% | 0.00007 | 51 | 9 | 0.0% | 0.00016 |
| 29 | 8 | 0.0% | 0.00008 | 51 | 7 | 0.0% | 0.00024 |
| 30 | 18 | 0.0% | 0.00025 | 51 | 9 | 0.0% | 0.00015 |
| 31 | 18 | 72.2% | 0.00005 | 51 | 9 | 0.0% | 0.00016 |
| 32 | 21 | 38.1% | 0.00011 | 51 | 9 | 66.7% | 0.00009 |
| 33 | 21 | 33.3% | 0.00010 | 51 | 9 | 0.0% | 0.00014 |
| 34 | 21 | 19.0% | 0.00011 | 51 | 9 | 11.1% | 0.00025 |
| 35 | 21 | 23.8% | 0.00007 | 51 | 9 | 22.2% | 0.00006 |
| 36 | 18 | 0.0% | 0.00025 | 51 | 8 | 25.0% | 0.00006 |
| 37 | 17 | 0.0% | 0.00022 | 51 | 8 | 0.0% | 0.00017 |
| 38 | 11 | 0.0% | 0.00034 | 51 | 7 | 0.0% | 0.00021 |
| 39 | 18 | 0.0% | 0.00027 | 51 | 9 | 22.2% | 0.00009 |
| 40 | 21 | 57.1% | 0.00008 | 51 | 8 | 50.0% | 0.00006 |
| 41 | 21 | 57.1% | 0.00011 | 51 | 8 | 0.0% | 0.00029 |
| 42 | 21 | 9.5% | 0.00019 | 51 | 9 | 22.2% | 0.00005 |
| 43 | 21 | 61.9% | 0.00005 | 51 | 9 | 11.1% | 0.00026 |
| 44 | 21 | 57.1% | 0.00005 | 51 | 9 | 33.3% | 0.00025 |
| 45 | 21 | 52.4% | 0.00018 | 51 | 9 | 55.6% | 0.00022 |
| 46 | 20 | 60.0% | 0.00006 | 51 | 8 | 50.0% | 0.00010 |
| 47 | 21 | 76.2% | 0.00006 | 51 | 7 | 28.6% | 0.00005 |
| 48 | 18 | 5.6% | 0.00018 | 51 | 8 | 62.5% | 0.00013 |
| 49 | 18 | 77.8% | 0.00006 | 51 | 7 | 28.6% | 0.00006 |
| 50 | 18 | 33.3% | 0.00081 |
| No. of WWTPs | Number of Samples | Rate of Undetected | LTA (mg/L) | No. of WWTPs | Number of Samples | Rate of Undetected | LTA (mg/L) |
|---|---|---|---|---|---|---|---|
| 1 | 38 | 18.4% | 0.0008 | 57 | 18 | 0.0% | 0.0099 |
| 2 | 36 | 8.3% | 0.0010 | 58 | 17 | 0.0% | 0.0018 |
| 3 | 30 | 13.3% | 0.0040 | 59 | 13 | 0.0% | 0.0008 |
| 4 | 25 | 64.0% | 0.0005 | 60 | 18 | 27.8% | 0.0010 |
| 5 | 24 | 70.8% | 0.0004 | 61 | 10 | 0.0% | 0.0024 |
| 6 | 23 | 13.0% | 0.0007 | 62 | 18 | 0.0% | 0.0080 |
| 7 | 24 | 70.8% | 0.0004 | 63 | 18 | 0.0% | 0.0008 |
| 8 | 23 | 26.1% | 0.0010 | 64 | 18 | 22.2% | 0.0019 |
| 9 | 23 | 0.0% | 0.0029 | 65 | 16 | 0.0% | 0.0011 |
| 10 | 24 | 58.3% | 0.0019 | 66 | 16 | 6.3% | 0.0006 |
| 11 | 24 | 58.3% | 0.0005 | 67 | 17 | 58.8% | 0.0007 |
| 12 | 23 | 4.3% | 0.0023 | 68 | 11 | 45.5% | 0.0009 |
| 13 | 23 | 52.2% | 0.0009 | 69 | 15 | 0.0% | 0.0012 |
| 14 | 23 | 4.3% | 0.0011 | 70 | 15 | 26.7% | 0.0009 |
| 15 | 22 | 0.0% | 0.0012 | 71 | 9 | 33.3% | 0.0005 |
| 16 | 22 | 36.4% | 0.0007 | 72 | 14 | 71.4% | 0.0004 |
| 17 | 11 | 0.0% | 0.0019 | 73 | 13 | 0.0% | 0.0031 |
| 18 | 22 | 9.1% | 0.0016 | 74 | 13 | 0.0% | 0.0011 |
| 19 | 22 | 22.7% | 0.0009 | 75 | 9 | 11.1% | 0.0009 |
| 20 | 17 | 0.0% | 0.0011 | 76 | 12 | 75.0% | 0.0005 |
| 21 | 22 | 4.5% | 0.0010 | 77 | 12 | 8.3% | 0.0013 |
| 22 | 22 | 68.2% | 0.0006 | 78 | 12 | 50.0% | 0.0014 |
| 23 | 22 | 0.0% | 0.0009 | 79 | 12 | 50.0% | 0.0010 |
| 24 | 22 | 63.6% | 0.0004 | 80 | 10 | 0.0% | 0.0016 |
| 25 | 22 | 72.7% | 0.0017 | 81 | 10 | 60.0% | 0.0004 |
| 26 | 20 | 0.0% | 0.0033 | 82 | 9 | 55.6% | 0.0009 |
| 27 | 22 | 0.0% | 0.0015 | 83 | 9 | 0.0% | 0.0010 |
| 28 | 16 | 6.3% | 0.0040 | 84 | 9 | 0.0% | 0.0013 |
| 29 | 22 | 72.7% | 0.0003 | 85 | 7 | 0.0% | 0.0012 |
| 30 | 22 | 4.5% | 0.0250 | 86 | 9 | 0.0% | 0.0041 |
| 31 | 22 | 9.1% | 0.0012 | 87 | 9 | 0.0% | 0.0063 |
| 32 | 15 | 0.0% | 0.0012 | 88 | 9 | 0.0% | 0.0018 |
| 33 | 18 | 0.0% | 0.0013 | 89 | 8 | 0.0% | 0.0018 |
| 34 | 21 | 9.5% | 0.0014 | 90 | 9 | 55.6% | 0.0005 |
| 35 | 15 | 80.0% | 0.0003 | 91 | 9 | 11.1% | 0.0007 |
| 36 | 11 | 9.1% | 0.0019 | 92 | 9 | 0.0% | 0.0022 |
| 37 | 21 | 23.8% | 0.0028 | 93 | 9 | 0.0% | 0.0016 |
| 38 | 21 | 71.4% | 0.0003 | 94 | 7 | 57.1% | 0.0003 |
| 39 | 20 | 0.0% | 0.0018 | 95 | 7 | 0.0% | 0.0050 |
| 40 | 21 | 0.0% | 0.0018 | 96 | 9 | 0.0% | 0.0010 |
| 41 | 21 | 47.6% | 0.0008 | 97 | 7 | 0.0% | 0.0010 |
| 42 | 20 | 85.0% | 0.0003 | 98 | 7 | 0.0% | 0.0093 |
| 43 | 21 | 9.5% | 0.0021 | 99 | 9 | 0.0% | 0.0035 |
| 44 | 21 | 0.0% | 0.0008 | 100 | 8 | 0.0% | 0.0010 |
| 45 | 21 | 0.0% | 0.0010 | 101 | 9 | 11.1% | 0.0013 |
| 46 | 15 | 20.0% | 0.0010 | 102 | 8 | 25.0% | 0.0014 |
| 47 | 21 | 0.0% | 0.0019 | 103 | 9 | 33.3% | 0.0078 |
| 48 | 21 | 0.0% | 0.0064 | 104 | 9 | 0.0% | 0.0013 |
| 49 | 21 | 0.0% | 0.0014 | 105 | 9 | 0.0% | 0.0022 |
| 50 | 13 | 0.0% | 0.0029 | 106 | 9 | 11.1% | 0.0015 |
| 51 | 20 | 5.0% | 0.0008 | 107 | 8 | 37.5% | 0.0017 |
| 52 | 18 | 5.6% | 0.0013 | 108 | 8 | 50.0% | 0.0006 |
| 53 | 14 | 0.0% | 0.0011 | 109 | 8 | 0.0% | 0.0072 |
| 54 | 15 | 0.0% | 0.0014 | 110 | 7 | 57.1% | 0.0006 |
| 55 | 10 | 10.0% | 0.0009 | 111 | 7 | 0.0% | 0.0011 |
| 56 | 19 | 0.0% | 0.0015 | 112 | 7 | 0.0% | 0.0020 |
| No. of WWTPs | VF(1) | Discharge Limit (mg/L) | No. of WWTPs | VF(1) | Discharge Limit (mg/L) |
|---|---|---|---|---|---|
| 1 | 6.09 | 0.00042 | 51 | 8.40 | 0.00096 |
| 2 | 9.00 | 0.00087 | 52 | 2.23 | 0.00012 |
| 3 | 7.78 | 0.00317 | 53 | 3.80 | 0.00027 |
| 4 | 3.72 | 0.00030 | 54 | 2.72 | 0.00013 |
| 5 | 2.67 | 0.00020 | 55 | 2.81 | 0.00014 |
| 6 | 6.42 | 0.00078 | 56 | 3.86 | 0.00054 |
| 7 | 2.92 | 0.00020 | 57 | 5.05 | 0.00069 |
| 8 | 1.75 | 0.00009 | 58 | 6.23 | 0.00066 |
| 9 | 3.88 | 0.00026 | 59 | 1.55 | 0.00007 |
| 10 | 3.82 | 0.00032 | 60 | 7.41 | 0.00138 |
| 11 | 6.51 | 0.00060 | 61 | 6.16 | 0.00066 |
| 12 | 3.52 | 0.00027 | 62 | 3.62 | 0.00028 |
| 13 | 5.92 | 0.00158 | 63 | 3.00 | 0.00096 |
| 14 | 2.62 | 0.00021 | 64 | 3.97 | 0.00022 |
| 15 | 2.84 | 0.00013 | 65 | 2.19 | 0.00016 |
| 16 | 5.42 | 0.00177 | 66 | 5.83 | 0.00055 |
| 17 | 2.77 | 0.00016 | 67 | 3.68 | 0.00030 |
| 18 | 3.57 | 0.00034 | 68 | 6.34 | 0.00051 |
| 19 | 4.02 | 0.00044 | 69 | 2.93 | 0.00017 |
| 20 | 2.25 | 0.00011 | 70 | 3.20 | 0.00088 |
| 21 | 3.02 | 0.00026 | 71 | 6.01 | 0.00228 |
| 22 | 2.46 | 0.00020 | 72 | 5.41 | 0.00082 |
| 23 | 3.49 | 0.00158 | 73 | 2.28 | 0.00012 |
| 24 | 3.58 | 0.00029 | 74 | 3.52 | 0.00182 |
| 25 | 3.02 | 0.00018 | 75 | 5.42 | 0.00411 |
| 26 | 4.25 | 0.00031 | 76 | 3.33 | 0.00087 |
| 27 | 1.82 | 0.00008 | 77 | 2.07 | 0.00019 |
| 28 | 2.29 | 0.00017 | 78 | 3.12 | 0.00050 |
| 29 | 1.52 | 0.00012 | 79 | 4.77 | 0.00114 |
| 30 | 1.81 | 0.00045 | 80 | 2.01 | 0.00029 |
| 31 | 2.28 | 0.00011 | 81 | 2.27 | 0.00036 |
| 32 | 5.22 | 0.00058 | 82 | 8.83 | 0.00082 |
| 33 | 3.44 | 0.00035 | 83 | 2.45 | 0.00033 |
| 34 | 2.70 | 0.00030 | 84 | 2.18 | 0.00054 |
| 35 | 2.10 | 0.00015 | 85 | 2.07 | 0.00012 |
| 36 | 3.81 | 0.00095 | 86 | 2.44 | 0.00014 |
| 37 | 2.67 | 0.00059 | 87 | 3.74 | 0.00065 |
| 38 | 2.43 | 0.00084 | 88 | 4.26 | 0.00090 |
| 39 | 3.97 | 0.00105 | 89 | 2.63 | 0.00024 |
| 40 | 4.42 | 0.00035 | 90 | 2.32 | 0.00013 |
| 41 | 6.23 | 0.00071 | 91 | 2.09 | 0.00060 |
| 42 | 3.27 | 0.00061 | 92 | 1.59 | 0.00008 |
| 43 | 2.42 | 0.00013 | 93 | 2.65 | 0.00070 |
| 44 | 2.48 | 0.00013 | 94 | 4.34 | 0.00109 |
| 45 | 5.09 | 0.00091 | 95 | 8.71 | 0.00194 |
| 46 | 3.22 | 0.00019 | 96 | 3.78 | 0.00036 |
| 47 | 3.95 | 0.00022 | 97 | 1.34 | 0.00007 |
| 48 | 3.52 | 0.00062 | 98 | 8.49 | 0.00108 |
| 49 | 4.68 | 0.00026 | 99 | 1.85 | 0.00010 |
| 50 | 11.07 | 0.00902 |
| No. of WWTPs | VF(1) | Discharge Limit (mg/L) | No. of WWTPs | VF(1) | Discharge Limit (mg/L) |
|---|---|---|---|---|---|
| 1 | 3.15 | 0.0024 | 57 | 2.47 | 0.0244 |
| 2 | 3.00 | 0.0029 | 58 | 3.26 | 0.0059 |
| 3 | 7.68 | 0.0310 | 59 | 1.73 | 0.0013 |
| 4 | 4.20 | 0.0020 | 60 | 4.17 | 0.0040 |
| 5 | 2.34 | 0.0008 | 61 | 3.37 | 0.0081 |
| 6 | 2.42 | 0.0017 | 62 | 8.15 | 0.0654 |
| 7 | 2.99 | 0.0013 | 63 | 1.46 | 0.0012 |
| 8 | 4.07 | 0.0039 | 64 | 5.50 | 0.0107 |
| 9 | 2.99 | 0.0086 | 65 | 1.53 | 0.0017 |
| 10 | 8.43 | 0.0163 | 66 | 3.35 | 0.0021 |
| 11 | 4.23 | 0.0022 | 67 | 5.48 | 0.0036 |
| 12 | 5.66 | 0.0129 | 68 | 7.69 | 0.0073 |
| 13 | 3.47 | 0.0030 | 69 | 1.96 | 0.0024 |
| 14 | 3.76 | 0.0043 | 70 | 3.67 | 0.0032 |
| 15 | 1.93 | 0.0023 | 71 | 2.17 | 0.0012 |
| 16 | 5.40 | 0.0037 | 72 | 2.41 | 0.0009 |
| 17 | 2.63 | 0.0050 | 73 | 2.42 | 0.0075 |
| 18 | 2.68 | 0.0043 | 74 | 3.43 | 0.0038 |
| 19 | 4.35 | 0.0041 | 75 | 2.96 | 0.0027 |
| 20 | 3.36 | 0.0038 | 76 | 3.54 | 0.0017 |
| 21 | 3.97 | 0.0038 | 77 | 4.82 | 0.0062 |
| 22 | 7.17 | 0.0042 | 78 | 4.37 | 0.0061 |
| 23 | 2.56 | 0.0023 | 79 | 6.17 | 0.0059 |
| 24 | 2.18 | 0.0008 | 80 | 4.01 | 0.0064 |
| 25 | 16.05 | 0.0266 | 81 | 1.64 | 0.0006 |
| 26 | 4.99 | 0.0163 | 82 | 5.70 | 0.0054 |
| 27 | 4.04 | 0.0062 | 83 | 2.25 | 0.0022 |
| 28 | 5.87 | 0.0233 | 84 | 3.43 | 0.0045 |
| 29 | 1.64 | 0.0005 | 85 | 2.71 | 0.0031 |
| 30 | 5.92 | 0.1482 | 86 | 6.35 | 0.0263 |
| 31 | 3.41 | 0.0040 | 87 | 4.64 | 0.0291 |
| 32 | 2.76 | 0.0033 | 88 | 2.92 | 0.0053 |
| 33 | 1.86 | 0.0025 | 89 | 2.27 | 0.0041 |
| 34 | 3.30 | 0.0047 | 90 | 3.30 | 0.0015 |
| 35 | 1.44 | 0.0005 | 91 | 2.16 | 0.0016 |
| 36 | 5.61 | 0.0108 | 92 | 5.28 | 0.0114 |
| 37 | 2.61 | 0.0073 | 93 | 2.04 | 0.0033 |
| 38 | 1.81 | 0.0006 | 94 | 1.44 | 0.0005 |
| 39 | 2.62 | 0.0046 | 95 | 3.17 | 0.0158 |
| 40 | 3.58 | 0.0064 | 96 | 2.06 | 0.0021 |
| 41 | 3.75 | 0.0029 | 97 | 2.33 | 0.0023 |
| 42 | 2.53 | 0.0008 | 98 | 5.09 | 0.0473 |
| 43 | 5.57 | 0.0118 | 99 | 5.69 | 0.0201 |
| 44 | 1.54 | 0.0012 | 100 | 2.04 | 0.0020 |
| 45 | 2.07 | 0.0021 | 101 | 3.77 | 0.0051 |
| 46 | 5.45 | 0.0054 | 102 | 4.54 | 0.0062 |
| 47 | 2.50 | 0.0048 | 103 | 10.25 | 0.0799 |
| 48 | 3.93 | 0.0252 | 104 | 3.31 | 0.0043 |
| 49 | 3.98 | 0.0056 | 105 | 3.21 | 0.0072 |
| 50 | 3.86 | 0.0112 | 106 | 4.93 | 0.0075 |
| 51 | 2.43 | 0.0019 | 107 | 2.98 | 0.0050 |
| 52 | 3.50 | 0.0046 | 108 | 4.34 | 0.0028 |
| 53 | 3.00 | 0.0032 | 109 | 5.70 | 0.0410 |
| 54 | 2.34 | 0.0033 | 110 | 3.24 | 0.0020 |
| 55 | 4.02 | 0.0037 | 111 | 2.03 | 0.0021 |
| 56 | 3.48 | 0.0053 | 112 | 1.78 | 0.0036 |
| Pollutant | Medium of LTAs (mg/L) | Average of VF(1)s | Suggested Discharge Limit (mg/L) |
|---|---|---|---|
| Hg | 0.00009 | 3.89 | 0.00035 |
| As | 0.0012 | 3.77 | 0.0045 |
© 2018 by the authors. Licensee MDPI, Basel, Switzerland. This article is an open access article distributed under the terms and conditions of the Creative Commons Attribution (CC BY) license (http://creativecommons.org/licenses/by/4.0/).
Share and Cite
Zhou, Y.; Lei, J.; Zhang, Y.; Zhu, J.; Lu, Y.; Wu, X.; Fang, H. Determining Discharge Characteristics and Limits of Heavy Metals and Metalloids for Wastewater Treatment Plants (WWTPs) in China Based on Statistical Methods. Water 2018, 10, 1248. https://doi.org/10.3390/w10091248
Zhou Y, Lei J, Zhang Y, Zhu J, Lu Y, Wu X, Fang H. Determining Discharge Characteristics and Limits of Heavy Metals and Metalloids for Wastewater Treatment Plants (WWTPs) in China Based on Statistical Methods. Water. 2018; 10(9):1248. https://doi.org/10.3390/w10091248
Chicago/Turabian StyleZhou, Yuhua, Jing Lei, Yu Zhang, Jing Zhu, Yanna Lu, Xuefang Wu, and Hao Fang. 2018. "Determining Discharge Characteristics and Limits of Heavy Metals and Metalloids for Wastewater Treatment Plants (WWTPs) in China Based on Statistical Methods" Water 10, no. 9: 1248. https://doi.org/10.3390/w10091248
APA StyleZhou, Y., Lei, J., Zhang, Y., Zhu, J., Lu, Y., Wu, X., & Fang, H. (2018). Determining Discharge Characteristics and Limits of Heavy Metals and Metalloids for Wastewater Treatment Plants (WWTPs) in China Based on Statistical Methods. Water, 10(9), 1248. https://doi.org/10.3390/w10091248