A Framework for Assessing Instream Supporting Ecosystem Services Based on Hydroecological Modelling


Abstract
1. Introduction
- Provisioning—the products obtained from ecosystems e.g., water supply;
- Regulating—the benefits from regulation of ecosystem processes e.g., flood regulation;
- Cultural—the non-material benefits from ecosystems e.g., religious enrichment; and
- Supporting—the underlying processes and services necessary for the production of all other ecosystem services. These include ecosystem processes such as soil formation, primary productivity, biogeochemistry, nutrient cycling, and habitat provision.
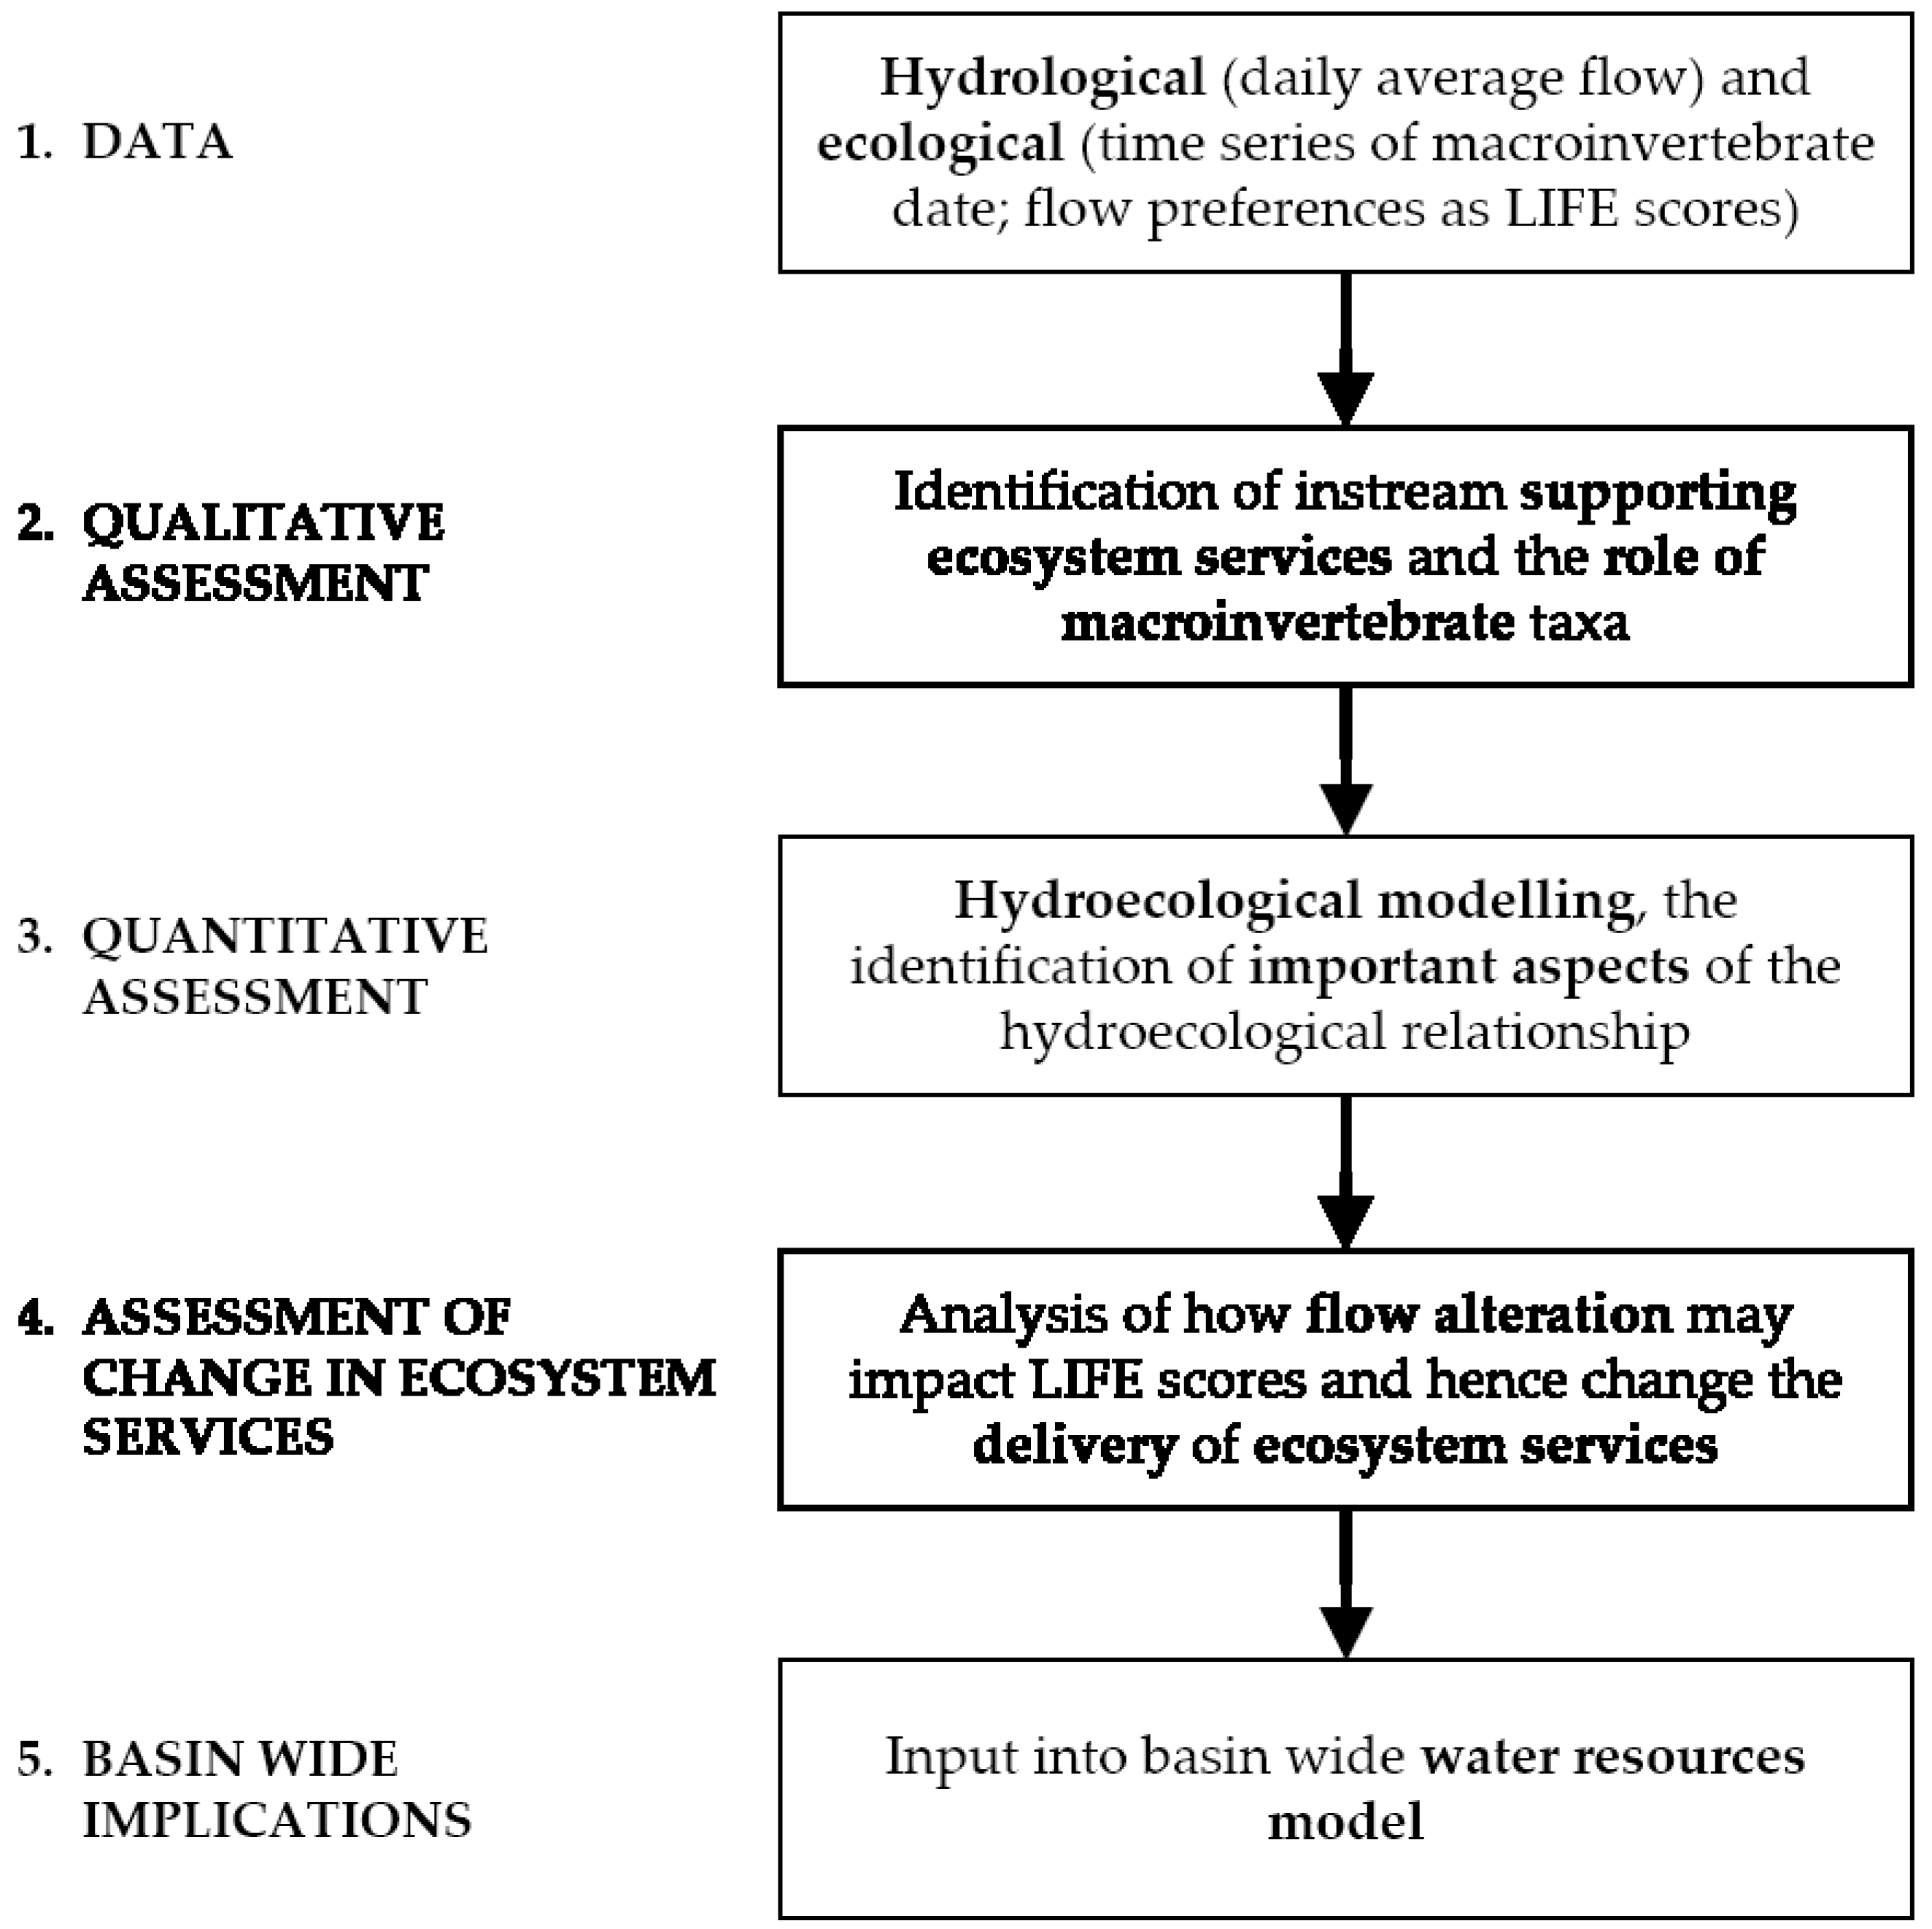
2. Proposed Framework
2.1. Stage 1—Data
2.2. Stage 2—Qualitative Assessment
2.3. Stage 3—Quantitative Assessment
2.4. Stage 4—Assessment of Change in Ecosystem Services
2.5. Stage 5—Basin-Wide Implications
3. Framework Application
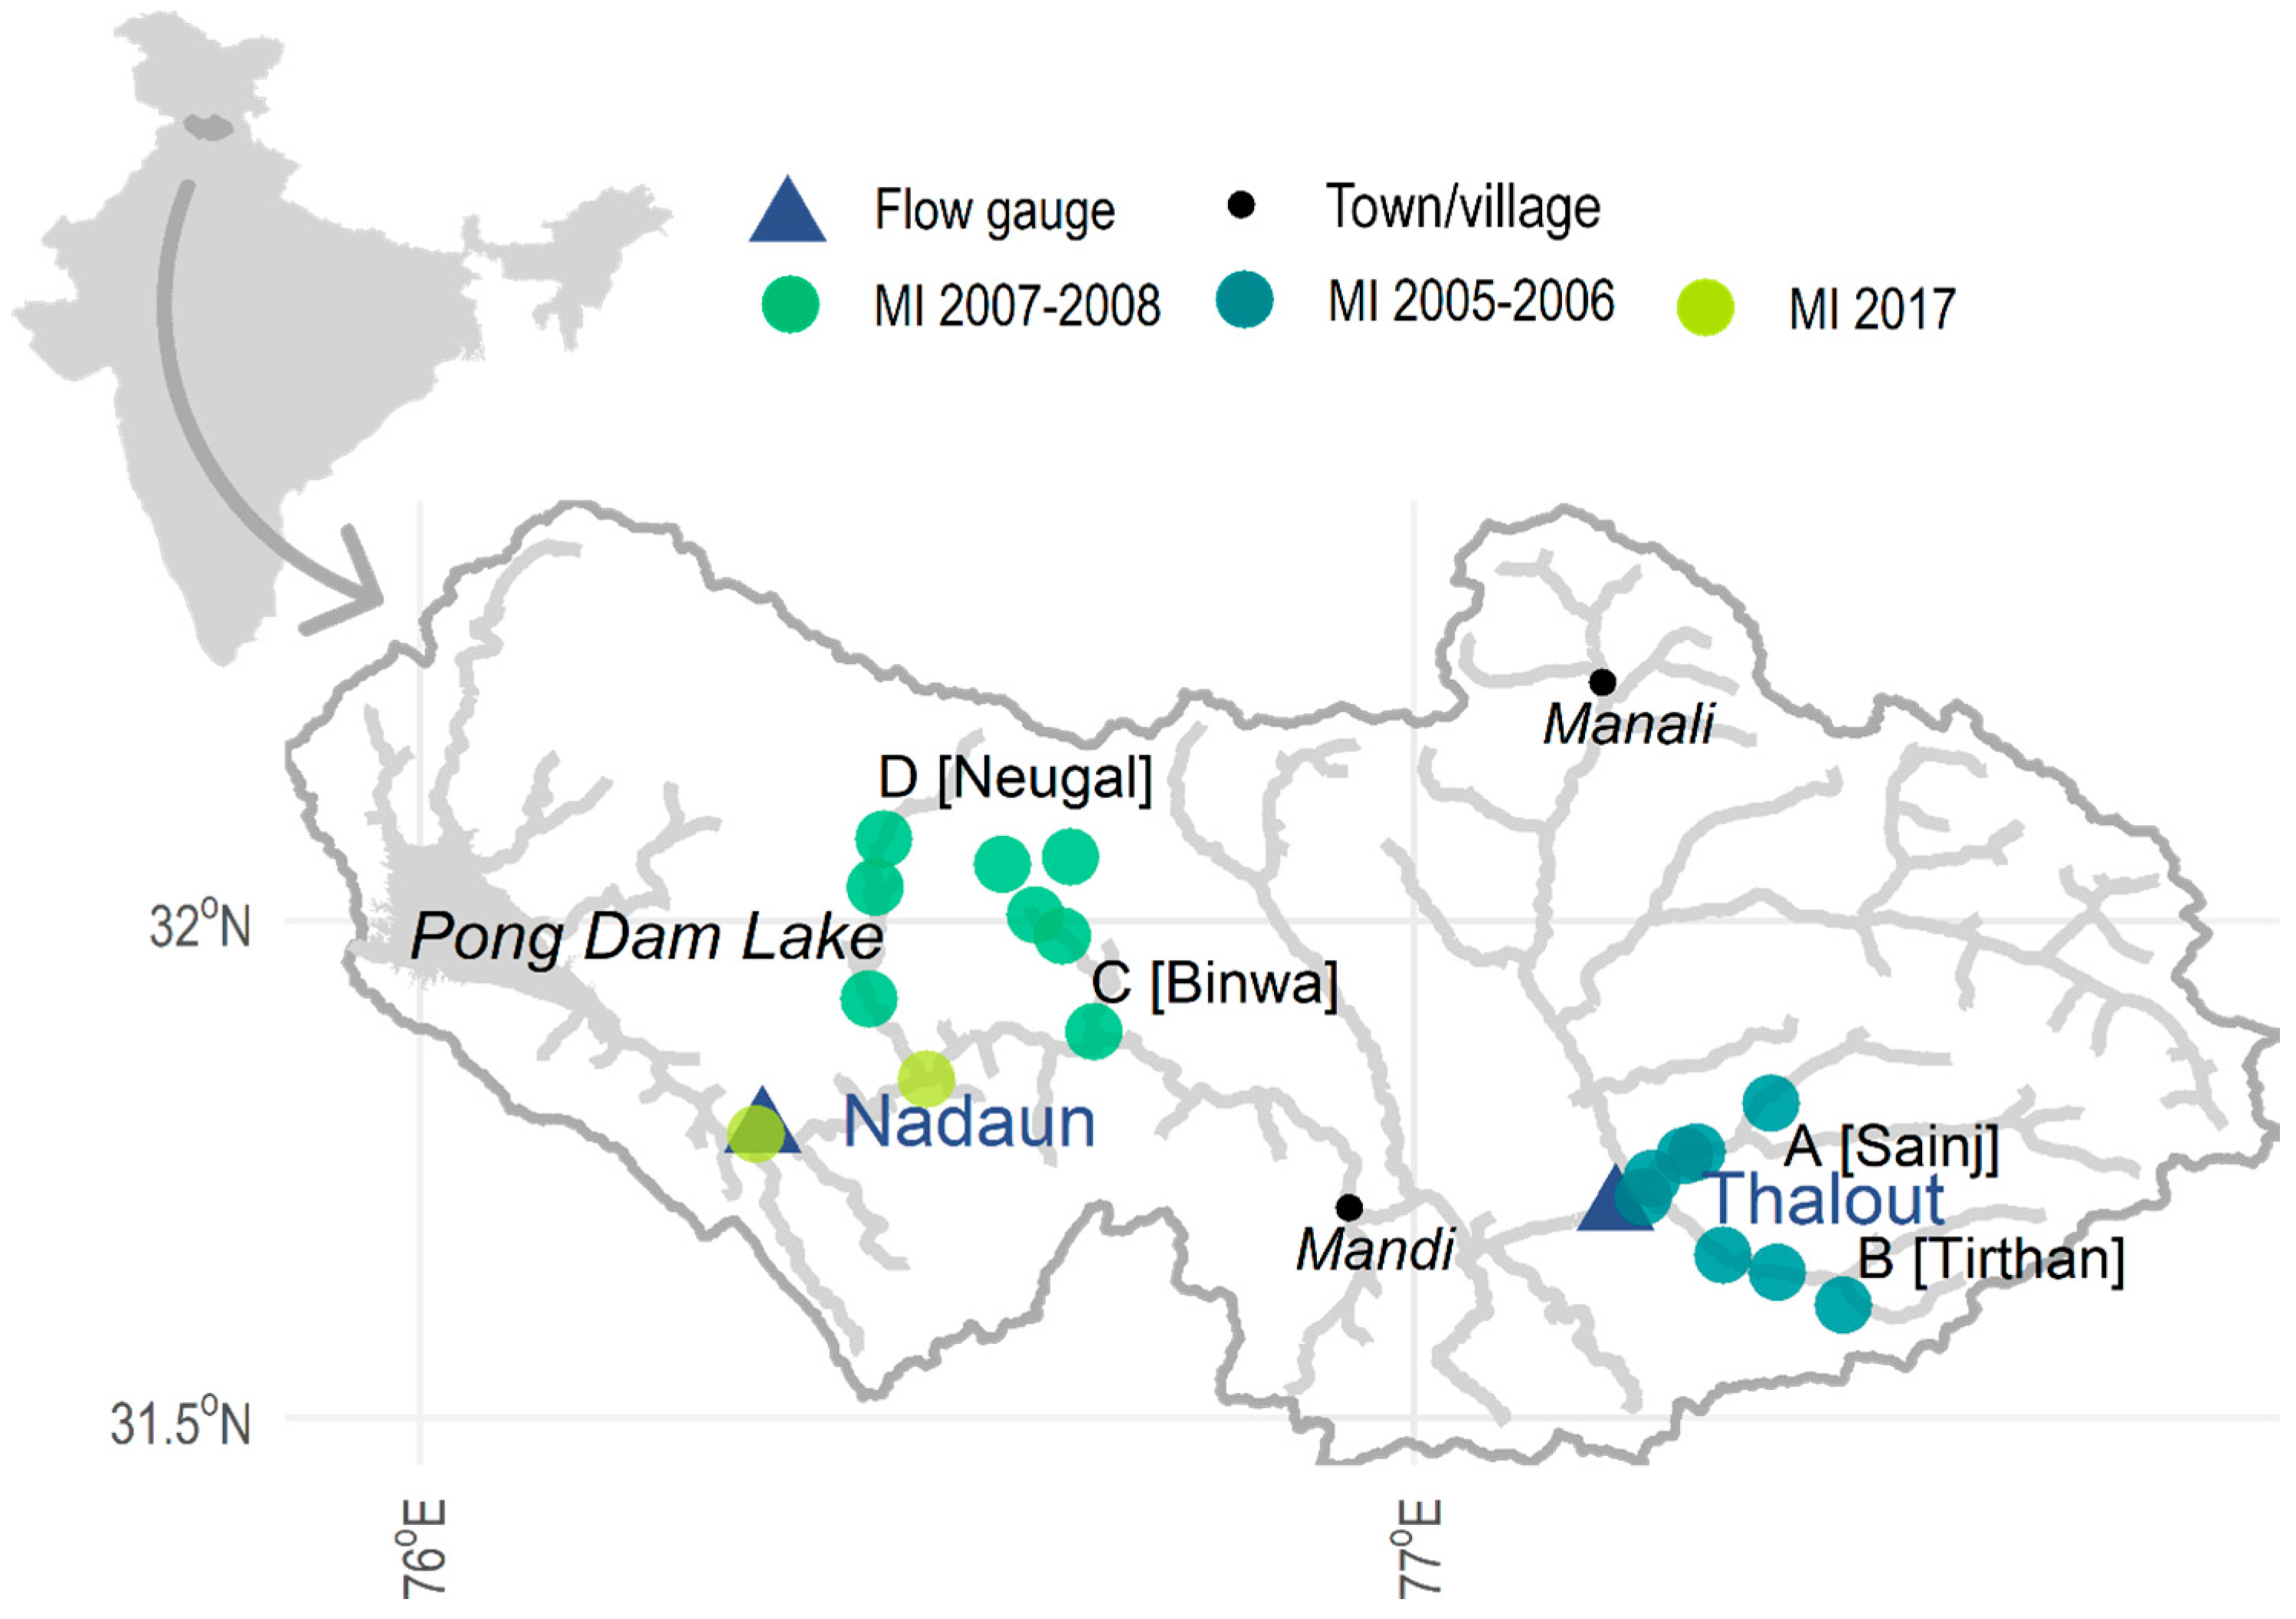
3.1. Case Study Area
3.2. Stage 1—Data
3.3. Stage 2—Qualitative Assessment
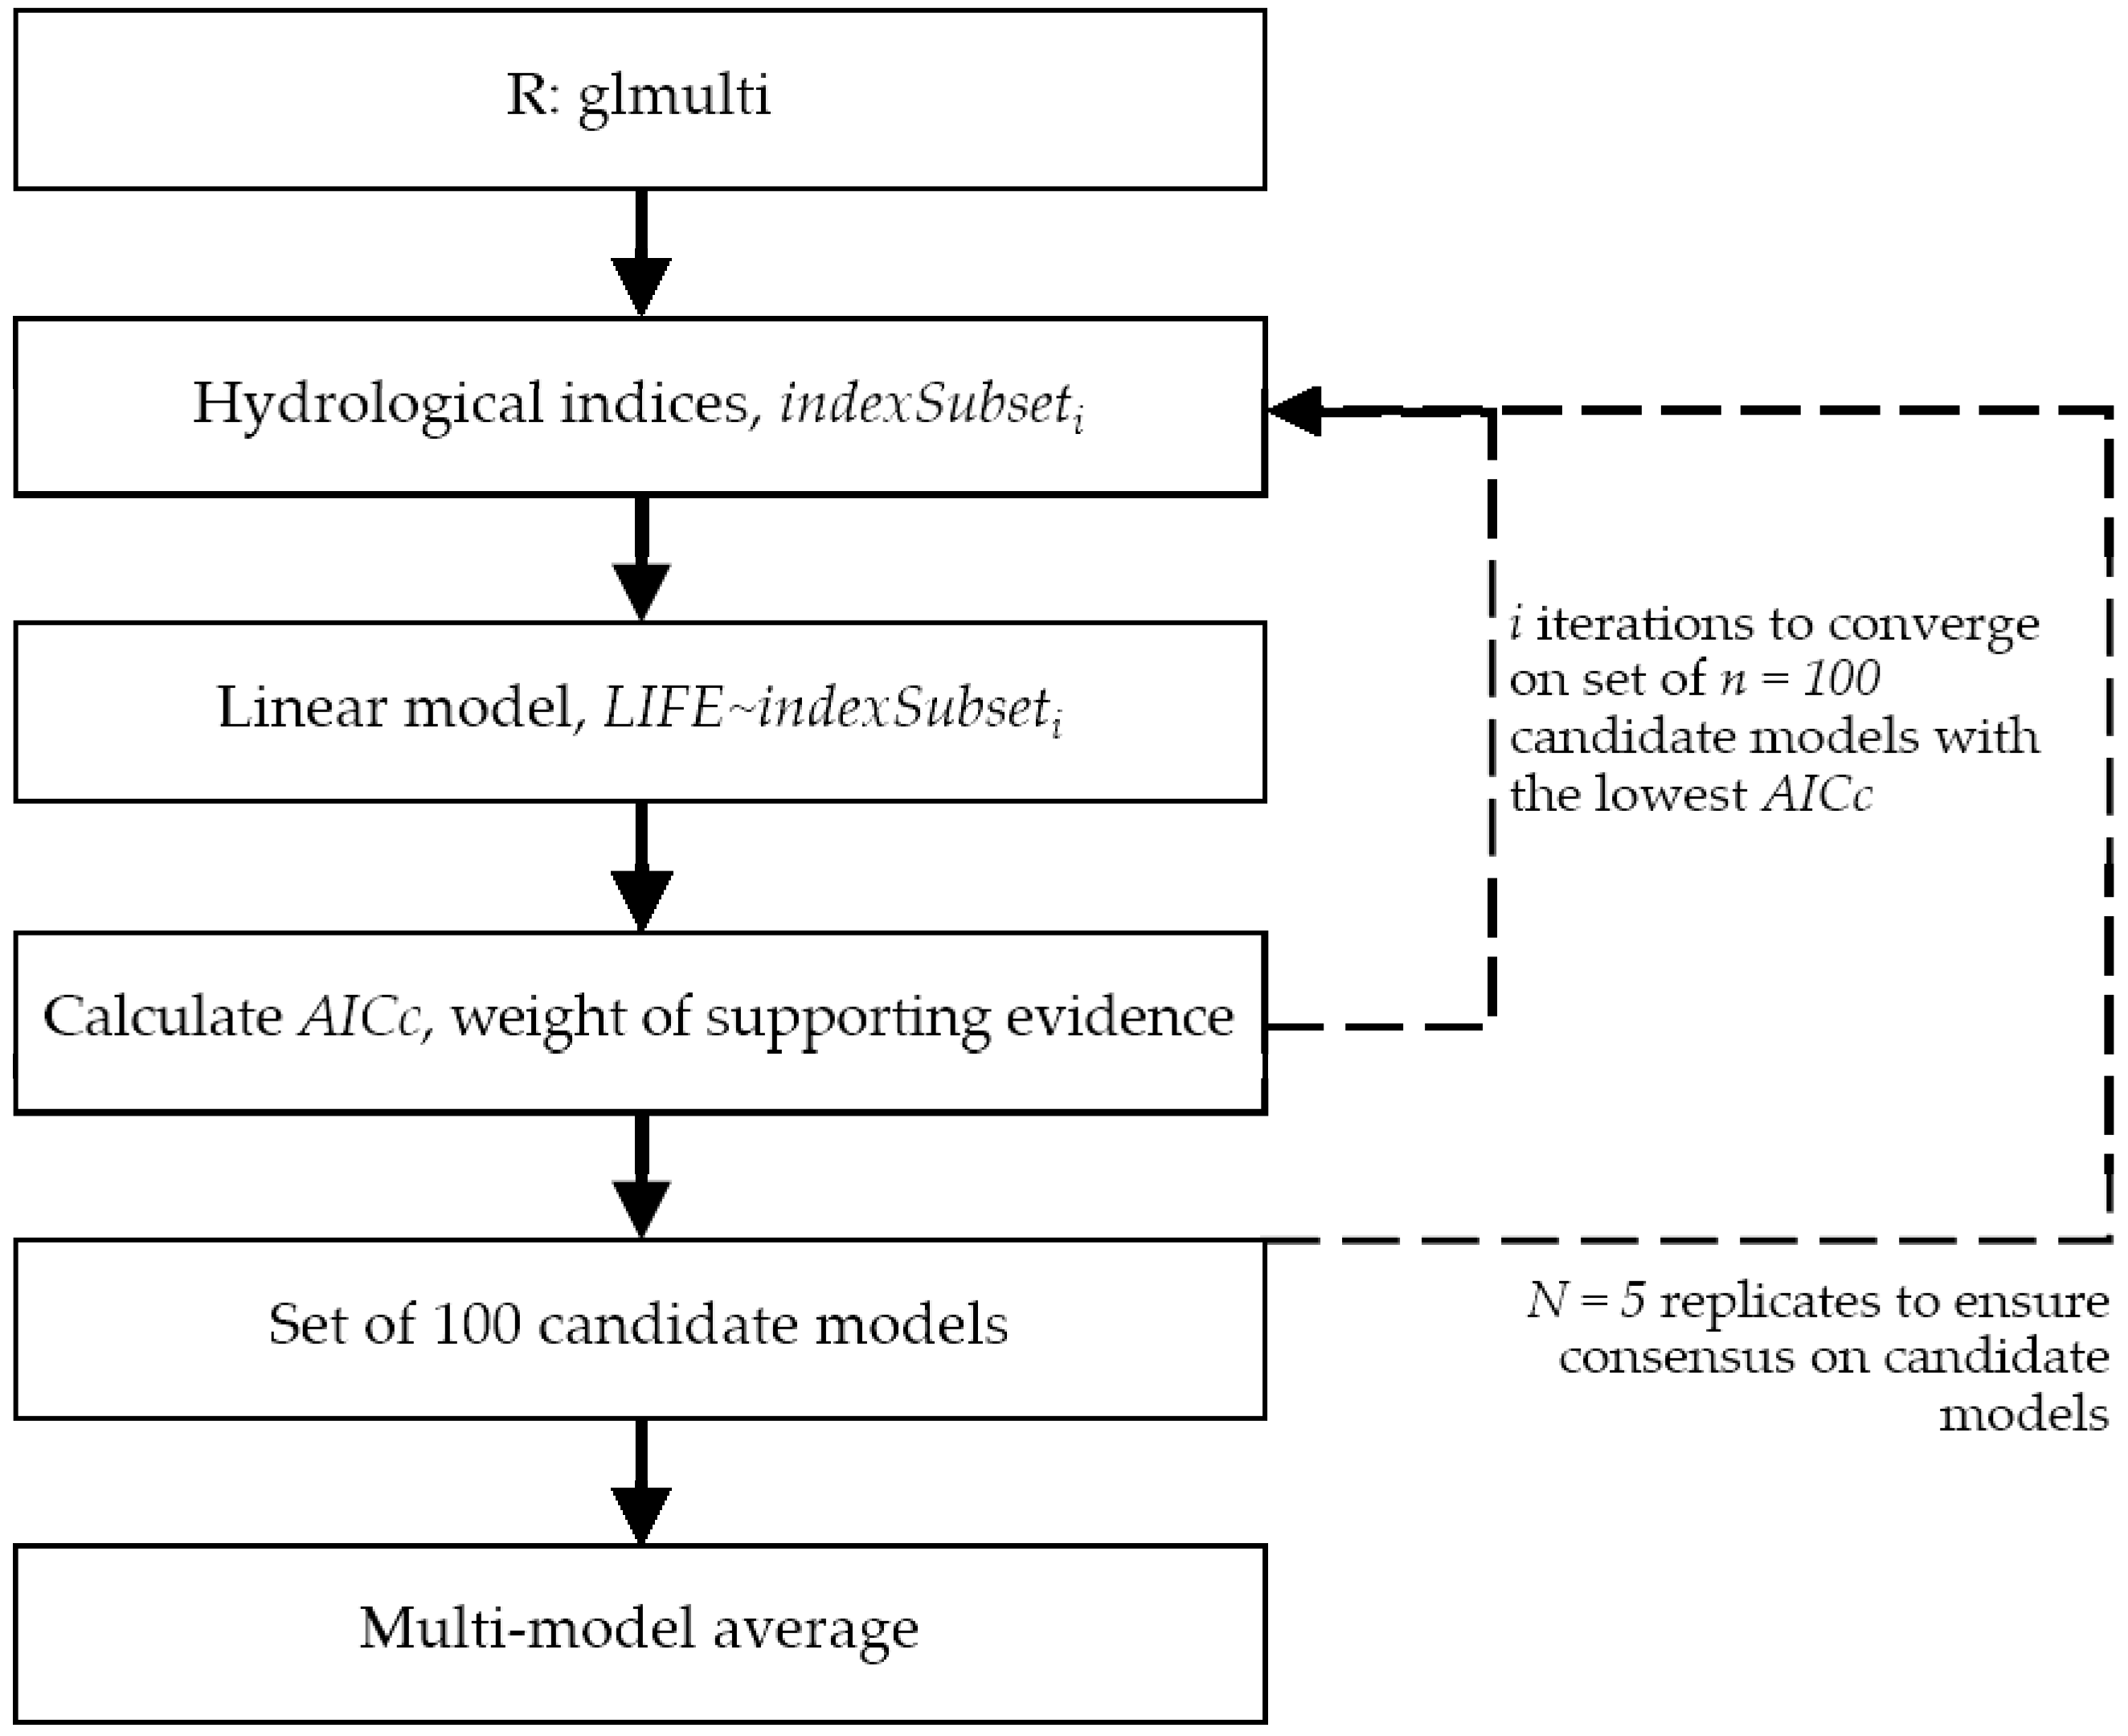
3.4. Stage 3—Quantitative Assessment
3.5. Stage 4—Assessment of Change in Ecosystem Services
4. Results and Discussion
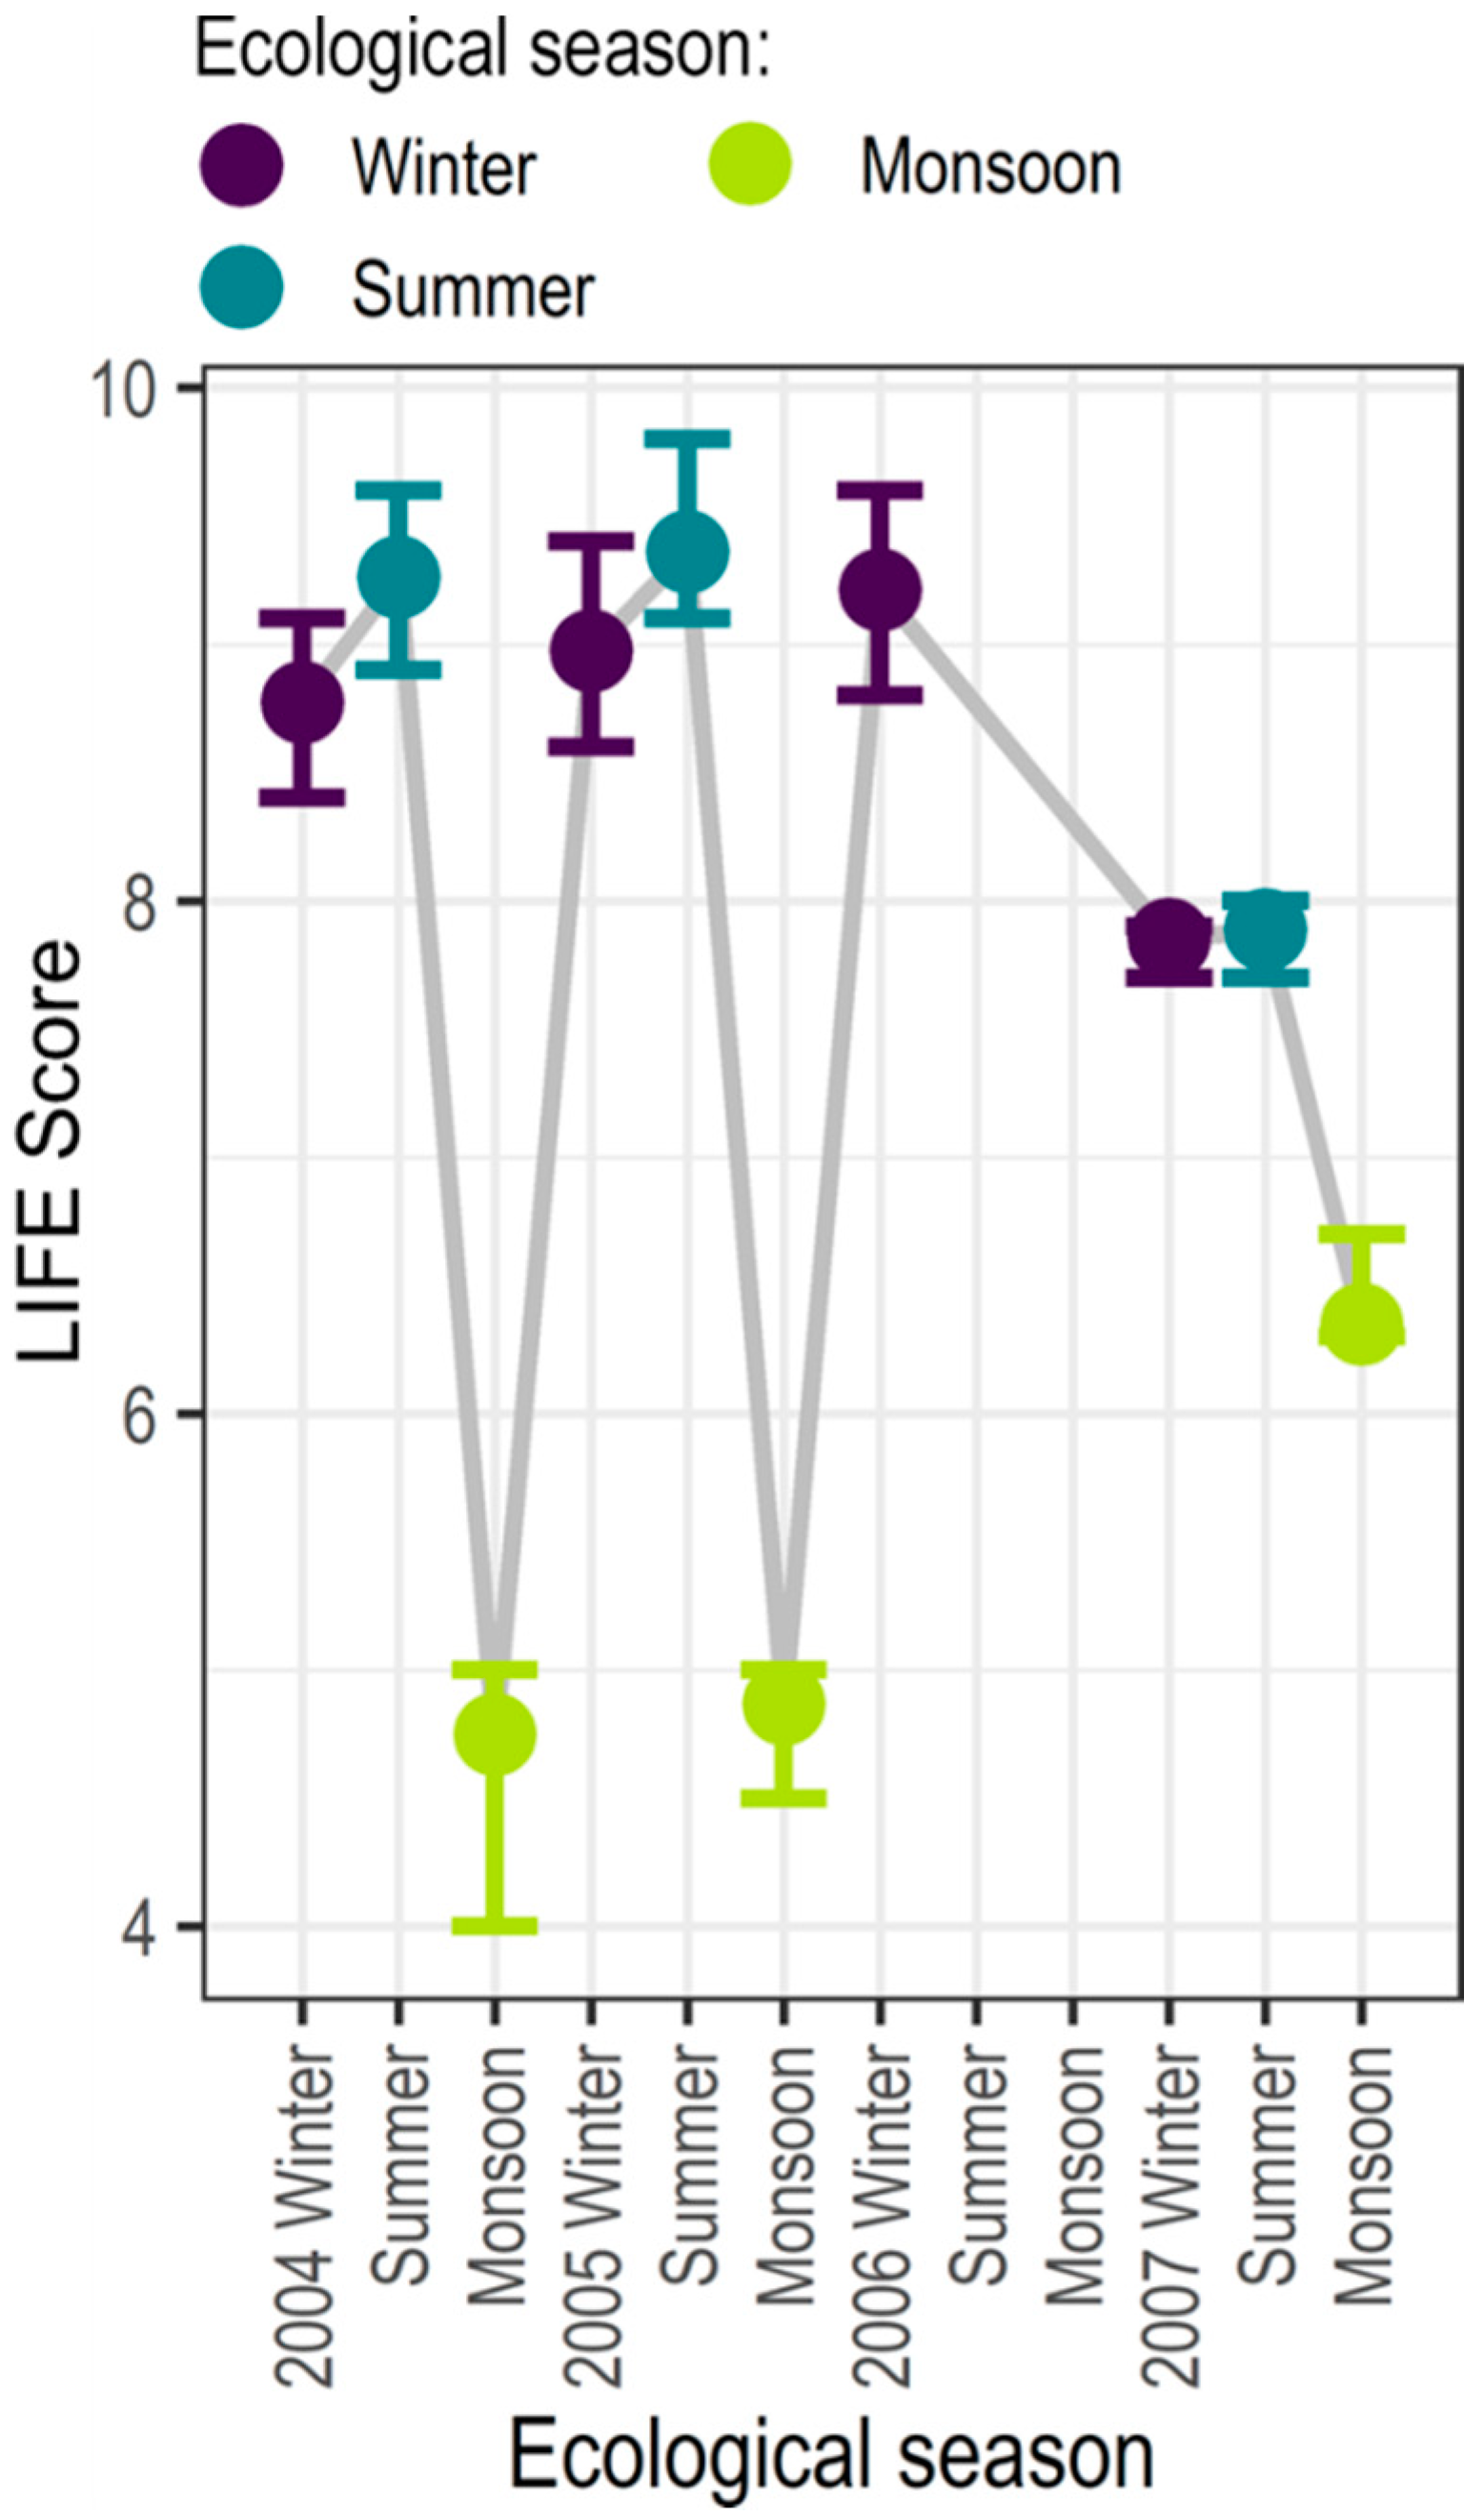
4.1. Observed Data
4.2. Catalogue
4.3. Hydroecological Relationship
4.4. Altered Flow Regime
4.5. Limitations of the Method
5. Conclusions
Author Contributions
Funding
Acknowledgments
Conflicts of Interest
Appendix A

Appendix B

| # | Facet | Aspect | Index | Units | Definition | Source Derived from |
|---|---|---|---|---|---|---|
| 1 | M | A | Mn | m3s−1 | Mean daily average flow. | [2,3,4,6,7,8,9,10] |
| 2 | M | A | Sum | m3 | Total volume of flow. | [7] |
| 3 | M | A | Rng | m3s−1 | Range; the variability in daily average flow. | [7] |
| 4 | M | A | IQR | m3s−1 | Interquartile range; the variability in daily average flows. | [19] |
| 5 | M | A | SD | - | Standard deviation; the variability in daily average flow. | [7] |
| 6 | M | A | Var | - | Coefficient of variance; the variability of daily average flow. | [2,3,4,8,10,11] |
| 7 | M | A | logQVar | - | Coefficient of variation of the log-transformed flows corresponding to the 5, 10, 15, 20, …, 80, 95, 90, 95 percentiles. | [8,12,13] |
| 8 | M | A | Sk | - | Skewness; the degree to which the mean is affected by extreme events relative to the median. | [1,2,3,4,7,8,16] |
| 9 | M | A | Sk100 | - | Skewness; the degree to which the range is affected by extreme events relative to the median. | [7,11] |
| 10 | M | A | Sk50 | - | Skewness; the degree to which the interquartile range is affected by extreme events relative to the median. | [7,11] |
| 11 | M | A | SkRel | m3s−1 | Relative skewness; the scale of the skew relative to the median. | [2,3,4,7,18] |
| 12 | M | A | 10R90 | - | Characterisation of lows and highs; ratio of the 10th and 90th percentiles in daily average flow. | [7,8,12,13] |
| 13 | M | A | 20R80 | - | Characterisation of moderate lows and highs; ratio of the 20th and 80th percentiles in daily average flow. | [7,8,12,13] |
| 14 | M | A | 25R75 | - | Characterisation of moderate lows and highs; ratio of the 25th and 75th percentiles in daily average flow. | [7,8,12,13] |
| 15 | M | A | 10R90Log | - | Characterisation of lows and highs; ratio of the 10th and 90th percentiles of log-transformed daily average flow. | [12,13] |
| 16 | M | A | 20R80Log | - | Characterisation of moderate lows and highs; ratio of the 20th and 80th percentiles of log-transformed daily average flow. | [12,13] |
| 17 | M | A | 25R75Log | - | Characterisation of moderate lows and highs; ratio of the 25th and 75th percentiles of log-transformed daily average flow. | [12,13] |
| 18 | M | A | Q01Q50 | - | Characterisation of high flows; one percent exceedance flow relative to the median. | This study. |
| 19 | M | A | Q05Q50 | - | Characterisation of high flows; five percent exceedance flow relative to the median. | This study. |
| 20 | M | A | Q10Q50 | - | Characterisation of high flows; ten percent exceedance flow relative to the median. | [2,3,4,7] |
| 21 | M | A | Q20Q50 | - | Characterisation of high flows; twenty percent exceedance flow relative to the median. | [2,3,4,7] |
| 22 | M | A | Q25Q50 | - | Characterisation of high flows; twenty five percent exceedance flow relative to the median. | [2,3,4,7] |
| 23 | M | A | Q30Q50 | - | Characterisation of moderate high flows; thirty percent exceedance flow relative to the median. | [19] |
| 24 | M | A | Q40Q50 | - | Characterisation of moderate high flows; forty percent exceedance flow relative to the median. | [19] |
| 25 | M | A | Q50 | m3s−1 | Median daily average flow. | [2,3,4,8] |
| 26 | M | A | Q60Q50 | - | Characterisation of moderate low flows; sixty percent exceedance flow relative to the median. | [19] |
| 27 | M | A | Q70Q50 | - | Characterisation of moderate low flows; seventy percent exceedance flow relative to the median. | [19] |
| 28 | M | A | Q75Q50 | - | Characterisation of low flows; seventy five percent exceedance flow relative to the median. | [2,3,4,7] |
| 29 | M | A | Q80Q50 | - | Characterisation of low flows; eighty percent exceedance flow relative to the median. | [7] |
| 30 | M | A | Q90Q50 | - | Characterisation of low flows; ninety percent exceedance flow relative to the median. | [2,3,4,7] |
| 31 | M | A | Q95Q50 | - | Characterisation of low flows; ninety five percent exceedance flow relative to the median. | This study. |
| 32 | M | A | Q99Q50 | - | Characterisation of low flows; ninety nine percent exceedance flow relative to the median. | This study. |
| 33 | M | H | Max | m3s−1 | Maximum flow. | [8,17] |
| 34 | M | H | MaxQ50 | - | Relative maximum flow; maximum flow divided by the median. | [7] |
| 35 | M | H | Q01 | - | One percent flow exceedance. | This study. |
| 36 | M | H | MaxMonthlyMed | - | Mean of the maximum monthly flow relative to the median flow value for the entire flow record. | [4,8] |
| 37 | M | H | MaxMonthlyVar | - | Variability of maximum monthly flows. | [19] |
| 38 | M | H | MaxMonthlyLogVar | - | Variability of log-transformed maximum monthly flows. | [5,8] |
| 39 | M | L | Min | m3s−1 | Minimum flow. | [8,17] |
| 40 | M | L | MinQ50 | - | Relative minimum flow; minimum flow divided by the median. | [2,3,6,7] |
| 41 | M | L | Q99 | - | Ninety nine percent flow exceedance. | This study. |
| 42 | M | L | MinMonthlyMed | - | Mean of the minimum monthly flow relative to the median flow value for the entire flow record. | [8,17] |
| 43 | M | L | MinMonthlyVar | - | Variability of minimum monthly flows. | [19] |
| 44 | M | L | MinMonthlyLogVar | - | Variability of log-transformed minimum monthly flows. | [19] |
| 45 | F | H | PlsQ25 | - | High flow pulse count; the number of flow events where flows are above a threshold equal to the twenty five percent exceedance flow value for the entire flow record. | [8,14,15,16] |
| 46 | F | H | PlsQ50 | - | Flow pulse count; the number of flow events where flows are above a threshold equal to the median flow value for the entire flow record. | [2,3,4,8] |
| 47 | F | L | PlsQ75 | - | Low flow pulse count; the number of flow events where flows falls below a threshold equal to the seventy five percent exceedance flow value for the entire flow record. | [8,14,15,16] |
| 48 | D | H | Mn7Max | m3s−1 | Seasonal maximum of 7-day moving average flow. | This study. |
| 49 | D | H | Mn7MaxQ50 | - | Seasonal maximum of 7-day moving average flow relative to the median. | This study. |
| 50 | D | H | Mn30MaxQ50 | - | Seasonal maximum of 30-day moving average flow relative to the median. | [8,14,15,16] |
| 51 | D | H | PlsDurQ25 | days−1 | Total duration of flow pulses above twenty five percent exceedance flow. | This study. |
| 52 | D | H | PlsDurQ25Mn | days−1 | Average duration of flow pulses above twenty five percent exceedance flow. | This study. |
| 53 | D | H | PlsDurQ25Var | days−1 | Variability in flow pulses above twenty five percent exceedance flow. | This study. |
| 54 | D | H | PlsDurQ50 | days−1 | Total duration of flow pulses above fifty percent exceedance flow. | This study. |
| 55 | D | H | PlsDurQ50Mn | days−1 | Average duration of flow pulses above fifty percent exceedance flow. | [2,3,4,8] |
| 56 | D | H | PlsDurQ50Var | days−1 | Variability in flow pulses above fifty percent exceedance flow. | This study. |
| 57 | D | L | Mn7Min | m3s−1 | Seasonal minimum of 7-day moving average flow. | This study. |
| 58 | D | L | Mn7MinQ50 | - | Seasonal minimum of 7-day moving average flow relative to the median. | This study. |
| 59 | D | L | Mn30MinQ50 | - | Seasonal minimum of 30-day moving average flow relative to the median. | [8,14,15,16] |
| 60 | D | L | PlsDurQ75 | days−1 | Total duration of flow pulses below seventy five percent exceedance flow. | This study. |
| 61 | D | L | PlsDurQ75Mn | days−1 | Average duration of flow pulses below seventy five percent exceedance flow. | [4,8] |
| 62 | D | L | PlsDurQ75Var | days−1 | Variability in flow pulses below seventy five percent exceedance flow. | This study. |
| 63 | R | A | fallMn | m3s−1 | Fall rate; mean change in flow for days in which the change is negative. | [8,14,15,16] |
| 64 | R | A | fallVar | - | Variability in fall rate; variability in flow for days in which the change is negative. | [8,14,15,16] |
| 65 | R | A | fallLogMed | m3s−1 | Log fall rate; the median change in log-transformed flow, for days in which the change is negative. | [4,8] |
| 66 | R | A | riseMn | m3s−1 | Rise rate; mean change in flow for days in which the change is positive. | [8,14,15,16] |
| 67 | R | A | riseVar | - | Variability in rise rate; variability in flow for days in which the change is positive. | [8,14,15,16] |
| 68 | R | A | riseLogMed | m3s−1 | Log rise rate; the median change in log-transformed flow, for days in which the change is negative. | [4,8] |
| 69 | R | A | RevNeg | - | Number of negative changes in flow from one day to the next. | [7,14,15,16] |
| 70 | R | A | RevPos | - | Number of positive changes in flow from one day to the next. | [7,14,15,16] |
| 71 | R | A | RevVar | - | Variability in the number of negative and positive changes in flow from one day to the next. | [8,15] |
| 72 | T | A | JDRng | - | Difference in the Julian date of the maximum and minimum daily average flow. | [19] |
| 73 | T | H | JDMax | - | Julian date of the 1-day maximum daily average flow. | [4,7,8,14,15,16] |
| 74 | T | H | JDMaxMn | - | Julian date of the mean 30-day maximum flow. | [19] |
| 75 | T | H | JDMaxSD | - | Standard deviation in the Julian date of the seven 1-day maximum daily average flow. | [7] |
| 76 | T | H | JDMaxVar | - | Variability in the Julian date of the seven 1-day maximum daily average flow. | This study. |
| 77 | T | L | JDMin | - | Julian date of the 1-day minimum daily average flow. | [4,7,8,14,15,16] |
| 78 | T | L | JDMinMn | - | Julian date of the mean 30-day minimum flow. | This study. |
| 79 | T | L | JDMinSD | - | Standard deviation in the Julian date of the seven 1-day minimum daily average flow. | [7] |
| 80 | T | L | JDMinVar | - | Variability in the Julian date of the seven 1-day minimum daily average flow. | This study. |
References
- Yeakley, J.; Ervin, D.; Chang, H.; Granek, E.F.; Dujon, V.; Shandas, V.; Brown, D. Ecosystem services of streams and rivers. In River Science; John Wiley & Sons, Ltd.: Hoboken, NJ, USA, 2016; pp. 335–352. [Google Scholar]
- MEA. Ecosystems and Human Well-Being: Synthesis [Millenium Ecosystem Assessment]; Island Press: Washington, DC, USA, 2005. [Google Scholar]
- Gilvear, D.J.; Spray, C.J.; Casas-Mulet, R. River rehabilitation for the delivery of multiple ecosystem services at the river network scale. J. Environ. Manag. 2013, 126, 30–43. [Google Scholar] [CrossRef] [PubMed]
- Febria, C.M.; Koch, B.J.; Palmer, M.A. Operationalizing an ecosystem services-based approach for managing river biodiversity. In Water Ecosystem Services: A Global Perspective; Gordon, I.J., Martin-Ortega, J., Ferrier, R.C., Khan, S., Eds.; Cambridge University Press: Cambridge, UK, 2015; pp. 26–34. [Google Scholar]
- Mace, G.M.; Norris, K.; Fitter, A.H. Biodiversity and ecosystem services: A multilayered relationship. Trends Ecol. Evol. 2012, 27, 19–26. [Google Scholar] [CrossRef] [PubMed]
- Durance, I.; Bruford, M.W.; Chalmers, R.; Chappell, N.A.; Christie, M.; Cosby, B.J.; Noble, D.; Ormerod, S.J.; Prosser, H.; Weightman, A.; et al. Chapter Three—The Challenges of Linking Ecosystem Services to Biodiversity: Lessons from a Large-Scale Freshwater Study. In Advances in Ecological Research; Woodward, G., Bohan, D.A., Eds.; Academic Press: London, UK, 2016; Volume 54, pp. 87–134. [Google Scholar]
- Vörösmarty, C.J.; McIntyre, P.B.; Gessner, M.O.; Dudgeon, D.; Prusevich, A.; Green, P.; Glidden, S.; Bunn, S.E.; Sullivan, C.A.; Liermann, C.R.; et al. Global threats to human water security and river biodiversity. Nature 2010, 467, 555–561. [Google Scholar] [CrossRef] [PubMed]
- Martin-Ortega, J.; Ferrier, R.C.; Gordon, I.J.; Khan, S. Water Ecosystem Services—A Global Perspective; Cambridge University Press: Cambridge, UK, 2015. [Google Scholar]
- Beck, M.W.; Claassen, A.H.; Hundt, P.J. Environmental and livelihood impacts of dams: Common lessons across development gradients that challenge sustainability. Int. J. River Basin Manag. 2012, 10, 73–92. [Google Scholar] [CrossRef]
- Auerbach, D.A.; Deisenroth, D.B.; McShane, R.R.; McCluney, K.E.; LeRoy Poff, N. Beyond the concrete: Accounting for ecosystem services from free-flowing rivers. Ecosyst. Serv. 2014, 10, 1–5. [Google Scholar] [CrossRef]
- Gilvear, D.J.; Beevers, L.C.; O’Keeffe, J.; Acreman, M. Chapter 8—Environmental Water Regimes and Natural Capital: Free-Flowing Ecosystem Services. In Water for the Environment; Academic Press: London, UK, 2017; pp. 151–171. [Google Scholar]
- Arthington, A. Chapter 4—River Ecology, The Natural Flow Regime Paradigm, and Hydroecological Principles. In Environmental Flows: Saving Rivers in the Third Millenium; Arthington, A., Ed.; University of California Press: Oakland, CA, USA, 2012. [Google Scholar]
- Grizzetti, B.; Lanzanova, D.; Liquete, C.; Reynaud, A.; Cardoso, A.C. Assessing water ecosystem services for water resource management. Environ. Sci. Policy 2016, 61, 194–203. [Google Scholar] [CrossRef]
- Costanza, R.; de Groot, R.; Braat, L.; Kubiszewski, I.; Fioramonti, L.; Sutton, P.; Farber, S.; Grasso, M. Twenty years of ecosystem services: How far have we come and how far do we still need to go? Ecosyst. Serv. 2017, 28, 1–16. [Google Scholar] [CrossRef]
- Visser, A.; Beevers, L.; Patidar, S. Macro-invertebrate Community Response to Multi-annual Hydrological Indicators. River Res. Appl. 2017, 33, 707–717. [Google Scholar] [CrossRef]
- Macadam, C.R.; Stockan, J.A. More than just fish food: Ecosystem services provided by freshwater insects. Ecol. Entomol. 2015, 40, 113–123. [Google Scholar] [CrossRef]
- Wallace, J.B.; Webster, J.R. The Role Of Macroinvertebrates In Stream Ecosystem Function. Annu. Rev. Entomol. 1996, 41, 115–139. [Google Scholar] [CrossRef] [PubMed]
- Chaube, U.C.; Sharma, S.; Sharma, P.; Kumar, P. Water quality assessment of River Satluj using benthic macroinvertebrates. In Proceedings of the Scientific Conference Rivers in the Hindu Kush-Himalay—Ecology & Environmental Assessment, Kathmandu and Dhulikhel, Nepal, 3–7 March 2008. [Google Scholar]
- Singh, N.; Sharma, R.C. Some Important Attributes Which Regulates The Life of Macro-Invertebrates: A Review. Int. J. Recent Sci. Res. 2014, 5, 357–361. [Google Scholar]
- Chauhan, A.; Verma, S.C. Distribution and Diversity of Aquatic Insects in Himachal Pradesh, India: A Review. Int. J. Curr. Microbiol. Appl. Sci. 2016, 5, 273–281. [Google Scholar] [CrossRef]
- Extence, C.A.; Balbi, D.M.; Chadd, R.P. River flow indexing using British benthic macroinvertebrates: A framework for setting hydroecological objectives. Regul. Rivers Res. Manag. 1999, 15, 545–574. [Google Scholar] [CrossRef]
- Monk, W.A.; Wood, P.J.; Hannah, D.M.; Wilson, D.A. Macroinvertebrate community response to inter-annual and regional river flow regime dynamics. River Res. Appl. 2008, 24, 988–1001. [Google Scholar] [CrossRef]
- Ghosh, D.; Biswas, J. Macroinvertebrate diversity indices: A quantitative bioassessment of ecological health status of an oxbow lake in Eastern India. J. Adv. Env. Health Res. 2015, 3, 78–90. [Google Scholar]
- Poff, N.L.; Zimmerman, J.K.H. Ecological responses to altered flow regimes: A literature review to inform the science and management of environmental flows. Freshw. Boil. 2010, 55, 194–205. [Google Scholar] [CrossRef]
- Clausen, B.; Biggs, B. Relationships between benthic biota and hydrological indices in New Zealand streams. Freshw. Boil. 1997, 38, 327–342. [Google Scholar] [CrossRef]
- Worrall, T.P.; Dunbar, M.J.; Extence, C.A.; Laizé, C.L.R.; Monk, W.A.; Wood, P.J. The identification of hydrological indices for the characterization of macroinvertebrate community response to flow regime variability. Hydrol. Sci. J. 2014, 59, 645–658. [Google Scholar] [CrossRef]
- Richter, B.D.; Baumgartner, J.V.; Powell, J.; Braun, D.P. A Method for Assessing Hydrologic Alteration within Ecosystems. Conserv. Boil. 1996, 10, 1163–1174. [Google Scholar] [CrossRef]
- Richter, B.D.; Baumgartner, J.; Wigington, R.; Braun, D. How much water does a river need? Freshw. Boil. 1997, 37, 231–249. [Google Scholar] [CrossRef]
- Richter, B.D.; Baumgartner, J.V.; Braun, D.P.; Powell, J. A spatial assessment of hydrologic alteration within a river network. Regul. Rivers Res. Manag. 1998, 14, 329–340. [Google Scholar] [CrossRef]
- The Nature Conservancy. Indicators of Hydrologic Alteration (IHA). Available online: https://www.conservationgateway.org/ConservationPractices/Freshwater/EnvironmentalFlows/MethodsandTools/IndicatorsofHydrologicAlteration/Pages/indicators-hydrologic-alt.aspx (accessed on 3 September 2018).
- Grumbine, R.E.; Pandit, M.K. Threats from India’s Himalaya Dams. Science 2013, 339, 36–37. [Google Scholar] [CrossRef] [PubMed]
- Jain, S.K.; Goswami, A.; Saraf, A.K. Assessment of Snowmelt Runoff Using Remote Sensing and Effect of Climate Change on Runoff. Water Resour. Manag. 2010, 24, 1763–1777. [Google Scholar] [CrossRef]
- Gopal, B. Ecosystem services of rivers and their relation to flows. In Environmental Flows: An Introduction for Water Resources Managers; National Institute of Ecology: New Delhi, India; Pretoria, South Africa, 2014; pp. 67–80. [Google Scholar]
- Clarke, R.T.; Armitage, P.D.; Horby, D.; Scarlett, P.; Davy-Bowker, J. Investigation of the Relationship between the LIFE Index and RIVPACS: Putting LIFE into RIVPACS; Environment Agency: Bristol, UK, 2003. [Google Scholar]
- Covich, A.P.; Palmer, M.A.; Crowl, T.A. The Role of Benthic Invertebrate Species in Freshwater Ecosystems: Zoobenthic species influence energy flows and nutrient cycling. BioScience 1999, 49, 119–127. [Google Scholar] [CrossRef]
- Covich, A.P.; Austen, M.C.; Bärlocher, F.; Chauvet, E.; Cardinale, B.J.; Biles, C.L.; Inchausti, P.; Dangles, O.; Solan, M.; Gessner, M.O.; et al. The Role of Biodiversity in the Functioning of Freshwater and Marine Benthic Ecosystems. BioScience 2004, 54, 767–775. [Google Scholar] [CrossRef]
- R Core Team. R: A Language and Environment for Statistical Computing. Available online: https://www.R-project.org/ (accessed on 4 September 2018).
- Visser, A.; Beevers, L.; Patidar, S. Complexity in hydroecological modelling, a comparison of stepwise selection and information theory. River Res. Appl. 2018. [Google Scholar] [CrossRef]
- Olden, J.D.; Poff, N.L. Redundancy and the choice of hydrologic indices for characterizing streamflow regimes. River Res. Appl. 2003, 19, 101–121. [Google Scholar] [CrossRef]
- Calcagno, V. Glmulti: Model Selection and Multimodel Inference Made Easy. Version 1.0.7. Available online: https://CRAN.R-project.org/package=glmulti (accessed on 4 September 2018).
- Warmink, J.J.; Janssen, J.A.E.B.; Booij, M.J.; Krol, M.S. Identification and classification of uncertainties in the application of environmental models. Environ. Model. Softw. 2010, 25, 1518–1527. [Google Scholar] [CrossRef]
- Sobol, I.M. Uniformly distributed sequences with an additional property of uniformity. USSR Comput. Math. Math. Phys. 1976, 16, 236–242. (In English) [Google Scholar] [CrossRef]
- Adeloye, A.J.; Soundharajan, B.S.; Ojha, C.S.P.; Remesan, R. Effect of Hedging-Integrated Rule Curves on the Performance of the Pong Reservoir (India) During Scenario-Neutral Climate Change Perturbations. Water Resour. Manag. 2016, 30, 445–470. [Google Scholar] [CrossRef]
- Jain, S.K.; Agarwal, P.K.; Singh, V.P. Indus Basin. In Hydrology and Water Resources of India; Springer: Dordrecht, The Netherlands, 2007; Volume 1, pp. 473–511. [Google Scholar]
- Manesh, K. Ecology of Some Selected Hillstreams of River Beas in the Vicinity of the Upper Himalayas of Himachal Pradesh India. Panjab University, India, Shodhganga@INFLIBNET Centre. 2011. Available online: http://hdl.handle.net/10603/82916 (accessed on 4 September 2018).
- Sharma, I.; Dhanze, R. Evaluation of macrobenthic fauna in hill stream environment of Western Himalaya, India. J. Threat. Taxa 2012, 4, 2875–2882. [Google Scholar] [CrossRef]
- Cleveland, W.S. Visualizing Data; Hobart Press: Summit, NJ, USA, 1993; 360p. [Google Scholar]
- Wilson, J.; Sevarkodiyone, S. Spatial and temporal distribution of mosquitoes (Culicidae) in Virudhunagar district, Tamil Nadu, South India. Int. J. Mosq. Res. 2014, 1, 4–9. [Google Scholar]
- White, D.S. Coleoptera (Beetles) in Aquatic Ecosystems A2—Likens, Gene E. In Encyclopedia of Inland Waters; Academic Press: Oxford, UK, 2009; pp. 144–156. [Google Scholar]
- Nogaro, G.; Mermillod-Blondin, F.; Montuelle, B.; Boisson, J.-C.; Gibert, J. Chironomid larvae stimulate biogeochemical and microbial processes in a riverbed covered with fine sediment. Aquat. Sci. 2008, 70, 156–168. [Google Scholar] [CrossRef]
- Matisoff, G.; Wang, X. Particle Mixing by Freshwater Infaunal Bioirrigators: Midges (Chironomidae: Diptera) and Mayflies (Ephemeridae: Ephemeroptera). J. Great Lakes Res. 2000, 26, 174–182. [Google Scholar] [CrossRef]
- Sivaramakrishnan, K.G. Systematics of the Ephemeroptera of India: Present status and future prospects. Zoosymposia 2016, 11. [Google Scholar] [CrossRef]
- Jacquemin, S.J.; Pyron, M.; Allen, M.; Etchison, L. Wabash River Freshwater Drum Aplodinotus grunniens Diet: Effects of Body Size, Sex, and River Gradient. J. Fish Wildl. Manag. 2014, 5, 133–140. [Google Scholar] [CrossRef]
- Ncube, S.; Beevers, L.; Adeloye, A.J.; Visser, A. Assessment of freshwater ecosystem services in the Beas River Basin, Himalayas region, India. Proc. IAHS 2018, 379, 67–72. [Google Scholar] [CrossRef]
- Cuffney, T.; Wallace, B.; Lugthart, J. Experimental evidence quantifying the role of benthic invertebrates in organic matter dynamics of headwater streams. Freshw. Boil. 1990, 23, 281–299. [Google Scholar] [CrossRef]
- Elahi, K.M.; Sikder, M.T. Mega Dams in the Himalayas: An Assessment of Environmental Degradation and Global Warming. In Proceedings of the International Conference on Environmental Aspects of Bangladesh (ICEAB), University of Kitakyushu, Kitakyushu, Japan, 4 September 2010; pp. 13–16. [Google Scholar]
- Handa, I.T.; Aerts, R.; Berendse, F.; Berg, M.P.; Bruder, A.; Butenschoen, O.; Chauvet, E.; Gessner, M.O.; Jabiol, J.; Makkonen, M.; et al. Consequences of biodiversity loss for litter decomposition across biomes. Nature 2014, 509, 218–221. [Google Scholar] [CrossRef] [PubMed]
- Noriega, J.A.; Hortal, J.; Azcárate, F.M.; Berg, M.P.; Bonada, N.; Briones, M.J.I.; Del Toro, I.; Goulson, D.; Ibanez, S.; Landis, D.A.; et al. Research trends in ecosystem services provided by insects. Basic Appl. Ecol. 2018, 26, 8–23. [Google Scholar] [CrossRef]
- United Nations. Sustainable Development Goals. Available online: https://sustainabledevelopment.un.org/sdgs (accessed on 4 September 2018).
- Wood, S.L.R.; Jones, S.K.; Johnson, J.A.; Brauman, K.A.; Chaplin-Kramer, R.; Fremier, A.; Girvetz, E.; Gordon, L.J.; Kappel, C.V.; Mandle, L.; et al. Distilling the role of ecosystem services in the Sustainable Development Goals. Ecosyst. Serv. 2018, 29, 70–82. [Google Scholar] [CrossRef]
- Biggs, B.J.F. Periphyton communities and their environments in New Zealand rivers. N. Z. J. Mar. Freshw. Res. 1990, 24, 367–386. [Google Scholar] [CrossRef]
- Clausen, B.; Biggs, B. Flow indices for ecological studies in temperate streams: Groupings based on covariance. J. Hydrol. 2000, 237, 184–197. [Google Scholar] [CrossRef]
- Clausen, B.; Iversen, H.; Ovesen, N. Ecological flow indices for Danish streams. In Nordic Hydrological Conference 2000; Nilsson, T., Ed.; Nordic Association for Hydrology: Uppsala, Sweden, 2000; pp. 3–10. [Google Scholar]
- Hughes, J.; James, B. A hydrological regionalization of streams in Victoria, Australia, with implications for stream Ecology. Mar. Freshw. Res. 1989, 40, 303–326. [Google Scholar] [CrossRef]
- Jowett, I.G.; Duncan, M.J. Flow variability in New Zealand rivers and its relationship to in-stream habitat and biota. N. Z. J. Mar. Freshw. Res. 1990, 24, 305–317. [Google Scholar] [CrossRef]
- Monk, W.A.; Wood, P.J.; Hannah, D.M.; Wilson, D.A.; Extence, C.A.; Chadd, R.P. Flow variability and macroinvertebrate community response within riverine systems. River Res. Appl. 2006, 22, 595–615. [Google Scholar] [CrossRef]
- Poff, N.L. A hydrogeography of unregulated streams in the United States and an examination of scale-dependence in some hydrological descriptors. Freshw. Boil. 1996, 36, 71–79. [Google Scholar] [CrossRef]
- Poff, N.L.; Ward, J.V. Implications of Streamflow Variability and Predictability for Lotic Community Structure: A Regional Analysis of Streamflow Patterns. Can. J. Fish. Aquat. Sci. 1989, 46, 1805–1818. [Google Scholar] [CrossRef]
- Puckridge, J.T.; Sheldon, F.; Walker, K.F.; Boulton, A.J. Flow variability and the ecology of large rivers. Mar. Freshw. Res. 1998, 49, 55–72. [Google Scholar] [CrossRef]
- Richards, R.P. Measures of Flow Variability for Great Lakes Tributaries. In Statistical Methods for the Assessment of Point Source Pollution, Proceedings of a Workshop on Statistical Methods for the Assessment of Point Source Pollution, Burlington, ON, Canada, 12–14 September 1988; Chapman, D.T., El-Shaarawi, A.H., Eds.; Springer: Dordrecht, The Netherlands, 1989; pp. 261–277. [Google Scholar] [CrossRef]
- Richards, R.P. Measures of Flow Variability and a New Flow-Based Classification of Great Lakes Tributaries. J. Great Lakes Res. 1990, 16, 53–70. [Google Scholar] [CrossRef]
- Wood, P.J.; Agnew, M.D.; Petts, G.E. Flow variations and macroinvertebrate community responses in a small groundwater-dominated stream in south-east England. Hydrol. Process. 2000, 14, 3133–3147. [Google Scholar] [CrossRef]
- Wood, P.J.; Hannah, D.M.; Agnew, M.D.; Petts, G.E. Scales of hydroecological variability within a groundwater-dominated stream. Regul. Rivers Res. Manag. 2001, 17, 347–367. [Google Scholar] [CrossRef]


| Flow Group | Flow Preference |
|---|---|
| I | Rapid flows |
| II | Moderate to fast flows |
| III | Slow or sluggish flows |
| IV | Slow flows and standing water |
| V | Standing water |
| VI | Drying or drought impacted |
| Month | Hydrological Season | Ecological Season |
|---|---|---|
| October | Autumn | Winter |
| November | Autumn | Winter |
| December | Winter | Winter |
| January | Winter | Winter |
| February | Winter | Winter |
| March | Summer | Summer |
| April | Summer | Summer |
| May | Summer | Summer |
| June | Monsoon | Monsoon |
| July | Monsoon | Monsoon |
| August | Monsoon | Monsoon |
| September | Monsoon | Winter |
| Role in Instream Supporting Ecosystem Services | Defined Instream Supporting Ecosystem Services | Taxonomic Order | Taxonomic Family | Season Observed | Flow Preference | Increasing Abundance Effect |
|---|---|---|---|---|---|---|
Filter and surface deposit feeders:
|
| Diptera (true fly) | Chironomidae (non-biting midges) | W; S | NA | NA |
| Ephemeroptera (mayfly) | Ephemeridae (Hexagenia sp.) | W; S | Moderate; fast. fg = II | + | ||
Facultative and specialist shredders:
|
| Diptera (true fly) | Simuliidae (black fly) | S (limited) | Moderate; fast. fg = II | + |
| Plecoptera (stonefly) | Leuctridae | W | Rapid; moderate; fast. fg = I/II | + | ||
| Trichoptera (caddisfly) | Limnephilidae | W | Flowing; standing. fg = IV | - | ||
| Sediment reworkers excavate and increase breakdown of buried leaf litter in the sand. |
| Ephemeroptera (mayfly) | Ephemeridae | NA | NA | NA |
| Odonata | Cordulegastridae (dragonfly) | Moderate; fast. fg = II | + | |||
| Trichoptera (caddisfly) | Limnephilidae | W | Flowing; standing. fg = IV | - | ||
| Food source for mammals, birds, reptiles, amphibians, bats, fish. |
| Diptera (true fly) | Chironomidae (non-biting midges) | W; S | NA | NA |
| Simuliidae (black fly) | S (limited) | Moderate; fast. fg = II | + | |||
| Ephemeroptera (mayfly) | All observed families | W; S | Moderate; fast. fg = II | + | ||
| Trichoptera (caddisfly) | Hydropsychidae | W; S | Moderate; fast. fg = II | + | ||
| Plecoptera (stonefly) | All observed families | M | Rapid; moderate; fast. fg = I/II | + |
| # | Index | Facet | Aspect | Definition | Unit | Coefficient | Importance | Confidence Interval |
|---|---|---|---|---|---|---|---|---|
| 0 | intercept | - | - | - | - | 7.03 | 1.00 | 17.78 |
| 1 | Mn30MaxQ50 | D | H | Seasonal maximum of 30-day moving average flow relative to the median. | - | −0.26 | 0.57 | 0.84 |
| 2 | Min | M | L | Seasonal minimum flow. | m3/s | −12.85 | 0.55 | 71.27 |
| 3 | Mn7Min | D | L | Seasonal minimum of seven-day moving average flow. | m3/s | 12.56 | 0.52 | 76.78 |
| 4 | 20R80 | M | A | Ratio of the 20th and 80th percentiles in daily average flow. | - | 7.88 | 0.52 | 40.34 |
| 5 | Q05Q50 | M | H | Five percent exceedance flow relative to the median. | - | 0.17 | 0.48 | 1.82 |
| 6 | JDMinSD | T | L | Standard deviation in the Julian data of the seven one-day minimum daily average flow. | - | −0.08 | 0.46 | 0.57 |
| 7 | PlsQ75 | F | L | Number of low flow pulses below a Q75 (seasonal, baseline) threshold. | - | 0.03 | 0.44 | 0.17 |
| 8 | Q01Q50 | M | H | Characterisation of extremes; one percent exceedance flow relative to the median. | - | -0.10 | 0.40 | 0.60 |
| 9 | Mn30MinQ50 | D | L | Seasonal minimum of 30-day moving average flow relative to the median. | - | 0.03 | 0.30 | 12.07 |
| Facet | Alteration | Ecological Response (∆Life) | Impact on Supporting Ecosystem Services | |
|---|---|---|---|---|
| Magnitude | Increase magnitude | NA | ▬ | ▬ |
| Duration | Increased distribution of high flow days | Positive | ▲ | Diverse macroinvertebrate community, increased rates and number of supporting ES delivered. |
| Increased distribution of low flow days | Positive | ▲ | Diverse macroinvertebrate community, increased rates and number of supporting ES delivered. | |
| Timing | Increased distribution of high flow days | NA | ▬ | ▬ |
| Increased distribution of low flow days | Negative | ▼ | Altered macroinvertebrate community, reduced rates/number of supporting ES delivered. | |
| Frequency | Increase the distribution of high flow days | Positive | ▲ | Diverse macroinvertebrate community, increased rates and number of supporting ES delivered. |
| Increase the distribution of low flow days | Positive | ▲ | Diverse macroinvertebrate community, increased rates and number of supporting ES delivered. | |
© 2018 by the authors. Licensee MDPI, Basel, Switzerland. This article is an open access article distributed under the terms and conditions of the Creative Commons Attribution (CC BY) license (http://creativecommons.org/licenses/by/4.0/).
Share and Cite
Ncube, S.; Visser, A.; Beevers, L. A Framework for Assessing Instream Supporting Ecosystem Services Based on Hydroecological Modelling. Water 2018, 10, 1247. https://doi.org/10.3390/w10091247
Ncube S, Visser A, Beevers L. A Framework for Assessing Instream Supporting Ecosystem Services Based on Hydroecological Modelling. Water. 2018; 10(9):1247. https://doi.org/10.3390/w10091247
Chicago/Turabian StyleNcube, Sikhululekile, Annie Visser, and Lindsay Beevers. 2018. "A Framework for Assessing Instream Supporting Ecosystem Services Based on Hydroecological Modelling" Water 10, no. 9: 1247. https://doi.org/10.3390/w10091247
APA StyleNcube, S., Visser, A., & Beevers, L. (2018). A Framework for Assessing Instream Supporting Ecosystem Services Based on Hydroecological Modelling. Water, 10(9), 1247. https://doi.org/10.3390/w10091247