Article

Detailed Source-Specific Molecular Composition of Ambient Aerosol Organic Matter Using Ultrahigh Resolution Mass Spectrometry and 1H NMR

by
Amanda S. Willoughby
,
Andrew S. Wozniak
and
Patrick G. Hatcher
*
Department of Chemistry and Biochemistry, Old Dominion University, Norfolk, VA 23529, USA
*
Author to whom correspondence should be addressed.
Current address: Department of Physical and Environmental Sciences, Texas A & M University—Corpus Christi, Corpus Christi, TX 78412, USA.
Atmosphere 2016, 7(6), 79; https://doi.org/10.3390/atmos7060079
Submission received: 1 March 2016 / Revised: 28 May 2016 / Accepted: 30 May 2016 / Published: 3 June 2016
(This article belongs to the Special Issue Air Quality and Source Apportionment)

Abstract

:
Organic aerosols (OA) are universally regarded as an important component of the atmosphere that have far-ranging impacts on climate forcing and human health. Many of these impacts are related to OA molecular characteristics. Despite the acknowledged importance, current uncertainties related to the source apportionment of molecular properties and environmental impacts make it difficult to confidently predict the net impacts of OA. Here we evaluate the specific molecular compounds as well as bulk structural properties of total suspended particulates in ambient OA collected from key emission sources (marine, biomass burning, and urban) using ultrahigh resolution mass spectrometry (UHR-MS) and proton nuclear magnetic resonance spectroscopy (1H NMR). UHR-MS and 1H NMR show that OA within each source is structurally diverse, and the molecular characteristics are described in detail. Principal component analysis (PCA) revealed that (1) aromatic nitrogen species are distinguishing components for these biomass burning aerosols; (2) these urban aerosols are distinguished by having formulas with high O/C ratios and lesser aromatic and condensed aromatic formulas; and (3) these marine aerosols are distinguished by lipid-like compounds of likely marine biological origin. This study provides a unique qualitative approach for enhancing the chemical characterization of OA necessary for molecular source apportionment.

1. Introduction

Organic matter (OM) comprises a significant portion of total aerosol mass, as much as 90% in certain areas [1,2], and is generated by a number of anthropogenic and biogenic emission sources. Organic aerosol (OA) compounds, once emitted into the atmosphere as primary OA or formed in situ as secondary OA (SOA) from gas-phase precursors, can undergo a myriad of atmospheric reactions forming new compounds that have different chemical structures and associated physical properties. The immense complexity of OA contributes to the difficulty in understanding the net impacts OA has on human health, biogeochemical cycling, and net radiative forcing.
The composition and relative concentrations of OA are expected to vary spatially and temporally due to differences in emission inputs and in the extent to which OA are transformed in the atmosphere by secondary aging processes [1]. The molecular composition of OA resulting from these emissions and aging processes will, in part, determine its impacts on e.g., aerosol hygroscopicity [3,4], light absorption [5], and biogeochemical cycling upon deposition [6,7]. The ability to apportion molecular compositions and impacts to specific aerosol emission sources and aging processes is therefore an important goal of the atmospheric community. Many studies have addressed similarities and differences of OA molecular composition among various aerosol sources, as well as seasonal and diurnal variability [6,8,9,10,11,12], but considerable work remains for a full understanding of this complex problem.
Fortunately, the adoption of new powerful analytical techniques such as nuclear magnetic resonance spectroscopy (NMR) and ultrahigh resolution mass spectrometry (UHR-MS) have enabled the characterization of important OA molecular and structural details. Solution-state proton NMR (1H NMR) enables the characterization of soluble extracts of OA without extensive sample preparation and has been thoroughly reviewed [13,14]. A 1H NMR spectrum can be analyzed to determine the relative contributions of major proton groups (e.g., alkyl protons) within OA, and also to identify specific compounds such as acetate, methanesulfonic acid, and levoglucosan that feature as sharp peaks in a spectrum [6,15,16,17,18]. Where NMR succeeds in providing these general structural details, it is unable to provide specific molecular details due to the overlapping signals from hydrogens associated with atmospherically relevant functional groups, and spectral interpretations must be simplified.
Pairing NMR with UHR-MS, which provides detailed molecular composition but only limited structural information, is therefore an attractive approach. UHR-MS, particularly Fourier transform ion cyclotron resonance mass spectrometry (FTICR-MS), allows for the determination of molecular formulas for thousands of high-molecular weight (>200 Da) compounds present within a single sample providing important chemical properties of OA. Its ultrahigh resolution (~500,000 over m/z 200–800) and mass accuracy (<1 ppm) can be used to obtain vital fingerprints, in the form of specific related molecular compound classes, that may be diagnostic for OA from specific emission sources and/or that have undergone molecular transformations. Numerous studies have used UHR-MS to reveal the molecular details of atmospheric OM [17,19,20,21,22,23,24,25,26,27,28,29,30,31,32,33]. UHR-MS techniques are generally regarded as non-quantitative, and structure can only be inferred from the molecular formula information, but when used in tandem with NMR extensive molecular and structural information can be achieved with minimal sample preparation. Such a pairing can provide fingerprints for the qualitative apportionment of OA molecular features that determine OA impact in the atmosphere and depositional environments.
The work presented here pairs these two powerful techniques (UHR-MS and 1H NMR) to provide source-specific molecular characteristics for ambient aerosol samples from key anthropogenic and biogenic emission sources that can be used to aid more traditional source apportionment studies. The emission sources chosen here (marine, mixed source, biomass burning, urban) have significant regional and global quantitative importance on atmospheric aerosol loadings. Water-soluble and pyridine-soluble extracts for multiple samples from each source were evaluated for molecular characteristics using FTICR-MS and 1H NMR. Compositional differences were elucidated using the chemometric approach, principal component analysis (PCA), to identify characteristic molecular features for each source type. Though qualitative in nature, this study sheds light on the sources of OA present in the ambient atmosphere and will be valuable for assessing the source-specific environmental impacts of OA as relationships between molecular characteristics and environmental impacts are strengthened.

2. Experiments

2.1. Aerosol Sample Collection

Ambient aerosol total suspended particulates (TSP, n = 14) were collected from four different locations to represent different emission source types. Air was drawn through pre-combusted (4 h, 475 °C) quartz microfiber filters (Whatman QM/A, 20.3 × 25.4 cm, 419 cm2 exposed area, 0.6 μm effective pore size) using a TSP high-volume air sampler (model GS2310, Thermo Andersen, Smyrna, GA, USA) at flow rates ranging between 0.7 and 0.9 m3·min−1. Air particles were collected for 8–29 h with total air volumes ranging between 410 and 1170 m3. The filters were transferred to combusted foil pouches immediately after collection and stored at 8 °C until analysis. Exact sampling dates and locations can be found in the supplemental methods. Briefly, marine TSP (n = 4) were collected aboard the R/V Knorr (Woods Hole, MA, USA) as part of the 2011 US GEOTRACES program cruise (GA03) [34] and as part of the 2014 second Western Atlantic Climate Study [35]. The US GEOTRACES samples (n = 3) are a subset of samples described in Wozniak et al. [7,31] where their WSOM FTICR-MS (negative ionization) and 1H NMR characteristics were described. Mixed source TSP samples (n = 3) were collected at sea level at the Virginia Institute of Marine Science in Gloucester Point, Virginia, USA. Data for these mixed source samples are also presented in Willoughby et al. [30], a study demonstrating the utility of pyridine as a method for extracting and analyzing water-insoluble aerosol OM. Biomass burning TSP samples (n = 2) were collected at sea level in Suffolk, VA downwind of heavy smoke pollution from a fire burning at the Great Dismal Swamp. Urban TSP samples (n = 5) were collected ~60 m above sea level on the roof of an academic building at Drexel University in downtown Philadelphia, PA, USA. A storage or field blank filter was analyzed for each respective aerosol sample.

2.2. Aerosol Mass and Carbon Measurements

The QM/A filters were weighed before and after sampling to determine the TSP mass loadings (Table 1). A portion of each aerosol filter was analyzed in triplicate for total carbon (TC) using a FlashEA 1112 elemental analyzer (Thermo Scientific, Waltham, Massachusetts, USA). Black carbon (BC) amounts were determined using the chemothermal oxidation at 375 °C method (CTO-375) [36] and measured on the same elemental analyzer. Solvent extracts of the aerosols and respective filter blanks were obtained by combining aerosol filter plugs of known OC masses with ultrapure water (Millipore Synergy Ultrapure Water System, Darmstadt, Germany) or pyridine (Sigma-Aldrich, St. Louis, Missouri, USA, ≥99.9%), and insoluble particles were removed using a syringe with a 0.45 μm PTFE filter cartridge. Percent water-soluble organic carbon (WSOC) for each water filtrate was determined by evaluating the non-purgeable organic carbon using a Shimadzu (Kyoto, Japan) TOC-VCPH analyzer. The pyridine-soluble organic carbon percentage (%PSOC) was determined by dissolving each of the aerosol samples into pyridine-D5 and comparing spectral signals determined by 1H NMR to that of a glucose standard [30]. These methods are described in greater detail in the supplementary methods. Due to limited sample availability, the marine aerosols were only measured for TC and WSOC.

2.3. FTICR-MS Analysis

For FTICR-MS analyses, the water extracts were desalted using an established procedure for Agilent PPL solid-phase extraction cartridges [37]. The desalted sample was eluted in methanol (Acros Organics, Geel, Belgium, 99.9%), and will be referred to as WSOMPPL to differentiate it from WSOM. All WSOMPPL samples were analyzed in both positive and negative electrospray ionization (ESI) mode (WSOM+ and WSOM−, respectively), and PSOM samples were analyzed in negative mode (PSOM−) only due to poor signal observed in the positive mode. A respective field blank extract was prepared identically and analyzed immediately prior to each of the sample extracts to obtain a representative experimental blank spectrum. Each of the samples was analyzed on a Bruker Daltonics (Bremen, Germany) 12 Tesla Apex Qe FTICR-MS with an Apollo II ESI source housed at the College of Sciences Major Instrumentation Cluster at Old Dominion University. Samples were infused to the ESI source at 120 nL·min−1, and spray voltages were optimized for each sample. Ions were accumulated in the hexapole for 0.5–2.0 s before transfer into the ICR cell, where exactly 300 transients were co-added. The instrument was externally calibrated daily using a polyethylene glycol standard. Each spectrum was internally calibrated using the naturally occurring molecules including fatty acids and other homologous series of compounds containing only carbon, hydrogen and oxygen [38]. Peaks consistent with salts (mass defect 0.4–0.98 for m/z < 400, and mass defect 0.6–0.97 for m/z > 400), blank peaks (those found in the respective filter blank), and 13C isotopologue peaks were subtracted from the mass list and not considered for formula assignments.

2.4. Molecular Formula Assignments

A unique molecular formula was assigned to a majority (82% ± 9%) of the measured peaks having a S/N ratio of at least 3 using an in-house generated MatLab (The MathWorks Inc., Natick, MA, USA) code according to the criteria 12C5-801H5-20016O1-3014N0-532S0-234P0-2 for negative ESI and 12C5-801H5-20016O1-3014N0-532S0-223Na0-1 for positive ESI, where the subscripts indicate the range of atoms allowed in a single formula. The assigned formulas were screened to remove any chemically unreasonable formulas for natural OM molecules according to previously published criteria (e.g., studies by Stubbins et al. [39] and Wozniak et al. [20]), and Kendrick mass defect homologous series (CH2, H2, and CO2) were used to verify ambiguous assignments. Each of the assigned formulas has a calculated mass within 1 ppm agreement with the measured m/z, where a large majority of the formulas (88% ± 7%) have less than 0.5 ppm error.

2.5. 1H NMR Spectroscopy

Each WSOM extract was diluted immediately before 1H NMR analysis using D2O (100% atom D, Acros Organics) at a ratio of 90:10 WSOM:D2O. The deuterated WSOM solutions were analyzed via 1H NMR spectroscopy using a Bruker Daltonics 400 MHz NMR with a BBI probe. Each sample was scanned 4000 (mixed source, biomass burning, and urban WSOM) or 8000 times (marine WSOM) using a standard Bruker water-suppression pulse program, where the 90° pulse and the transmitter offset were optimized individually for each sample. The signals obtained from 1H NMR spectra were integrated over the entire spectral range to obtain the total signal response, and were also integrated over four specific chemical shift ranges to determine contributions from major proton types [16,18]. The signal response was normalized to the total signal in these regions (i.e., total signal = Area0.6–4.4 ppm + Area6.0–9.0 ppm) to determine the average relative contributions for each region. The regions are defined based on the chemical environment of protons exhibiting signal at those chemical shifts: (1) aliphatic hydrogen (H-C, 0.6–1.8 ppm); (2) unsaturated alkyl hydrogen (H-C-C=, 1.8–3.2 ppm); (3) oxygenated aliphatic hydrogen (H-C-O, 3.2–4.4 ppm), and aromatic hydrogen (Ar-H, 6.0–9.0 ppm). Aldehyde and carboxylic acid hydrogen (H-C=O, and HO-C=O) would appear downfield of the aromatic protons (i.e., >9 ppm), but were not detected because these protons readily exchange with the deuterium in the D2O required for analysis.

2.6. Principal Component Analysis

Principal component analysis was applied separately to the molecular formulas assigned to FTICR mass spectra and peaks present in the 1H NMR spectra in order to reveal the components that describe the greatest amount of variance between the source types. The PCA was performed using an in-house MatLab script. The first PC (PC1) explains the most amount of variance, and the second PC (PC2) is orthogonal to PC1 and explains the second largest portion of the variance. Each successive PC explains less variance until a point of diminishing returns is reached (i.e., <1% variance explained).

2.6.1. FTICR-MS PCA

Similar to positive matrix factorization, PCA is a factor analysis technique for explaining the observed composition in complex mixtures. It uses an eigenvector analysis of a correlation matrix to calculate principal components and variable loadings. The molecular formulas from each FTICR mass spectrum for the WSOM−, WSOM+, and PSOM− were compiled into a master formula list containing the formulas present in 2–13 of the 14 samples (14,808 formulas). Formulas present in only one sample, and formulas present in all 14 samples were removed to avoid biasing the PCA toward rare formulas and to eliminate formulas that do not contribute to the sample variance, respectively [31,40,41]. A 14,808 × 14 matrix was created by using an input value of 1 if a formula is present and an input value of 0 for a formula not present within a given sample.

2.6.2. 1H NMR PCA

The 1H NMR spectra were analyzed in a PCA following previous studies [6,7]. Briefly, all of the peaks in the 1H NMR spectrum for each of the aerosol WSOM extracts between 0.0 and 11.0 ppm were binned to a resolution of 1 data point per 0.005 ppm from an initial resolution of 0.0008 ppm between data points. The discrete signal (peak area) at each chemical shift was normalized to the total area in the given spectrum, and the normalized area was used as the data input variables (n = 2769) for the PCA. The 1H NMR spectra were evaluated initially using all of the aerosol samples (n = 14), and a second time after omitting the marine aerosols (n = 10).

3. Results and Discussion

3.1. Aerosol Loadings

The aerosol samples from each of the emission sources show OM characteristics that distinguish the sources from one another. TSP and TC concentrations and BC, WSOC and PSOC percentages (relative to TC) were determined for each of the aerosol samples (Table 1). TSP, %BC, and %PSOC were not determined for the marine samples as discussed in the methods section. TSP loadings were highest for the biomass burning samples (73.2 μg·m−3) followed by the urban (47.1 μg·m−3) and mixed source (24.1 μg·m−3) samples. The marine samples show TC loadings (0.5 μg·m−3) one order of magnitude lower than the mixed source (5.7 μg·m−3) and urban (6.3 μg·m−3) samples and two orders of magnitude lower than the biomass burning samples (24.8 μg·m−3) as one would expect for samples collected over the middle of the ocean far from major terrestrial and anthropogenic sources. In spite of the urban samples having TSP loadings that are approximately twice that of the mixed source samples, they show similar TC concentrations indicating that the urban samples contain high amounts of inorganic materials. The biomass burning samples showed the highest %BC (6.5%) and lowest %WSOC (33.6%) values of the samples which is expected for samples collected in proximity (<30 km) to biomass combustion processes that produce BC and have not been exposed to aging processes known to increase water solubility. The marine samples show low but variable %WSOC values (39.6 ± 25.1%). The urban aerosol samples contained a higher %BC (3.4%) and lower %WSOC (40.8%) than the mixed source aerosol (%BC = 1.9, %WSOC = 50.5) samples. Like all elemental and BC measurements, the CTO-375 method used here is subject to artifacts; it is thought to be selective for highly condensed soot BC and is susceptible to potential positive bias from the charring of melanoidin-like species [42], and the BC results should be viewed with this in mind. In a multi-laboratory comparison study, CTO-375 of aerosol particulate materials yielded lower %BC (3.7%–14.3%) relative to elemental carbon measured using thermal optical reflectance and thermal optical transmittance methods (16%–50%) frequently used in atmospheric studies likely due to the latter two methods inclusion of a portion of OC and the CTO-375 method’s selectivity for highly condensed soot BC [42].
The %PSOC amounts were calculated from 1H NMR data (Supplemental Table S1) after Willoughby et al. [30] and are useful for understanding the amount of material analyzed in PSOM extracts for FTICR-MS analyses of water-insoluble OM. Because the pyridine extractions were conducted in parallel to the water extractions and some carbon compounds are soluble in both solvents and others are soluble in neither, the sum of these two percentages (%WSOC + %PSOC) may be more or less than 100%. The biomass burning samples can be expected to contain significant amounts of water-insoluble primary OA, and this is reflected in the high %PSOC and low %WSOC values. The calculation for PSOC percentage by the 1H NMR technique omits aromatic peaks due to interference by the exchanged pyridine protons. Because the biomass burning samples are expected to have high aromatic contributions, as indicated by the high %BC and increased signal in aromatic region of the 1H NMR spectrum for the WSOM (discussed in Section 3.4), this %PSOC value may be considered a low estimation. The urban and mixed source aerosols have considerably lower %PSOC (urban = 44%; mixed = 45%) reflecting their higher water solubility and suggesting that these two sample types have more influence from secondary and aging reactions that produce OA insoluble in pyridine.

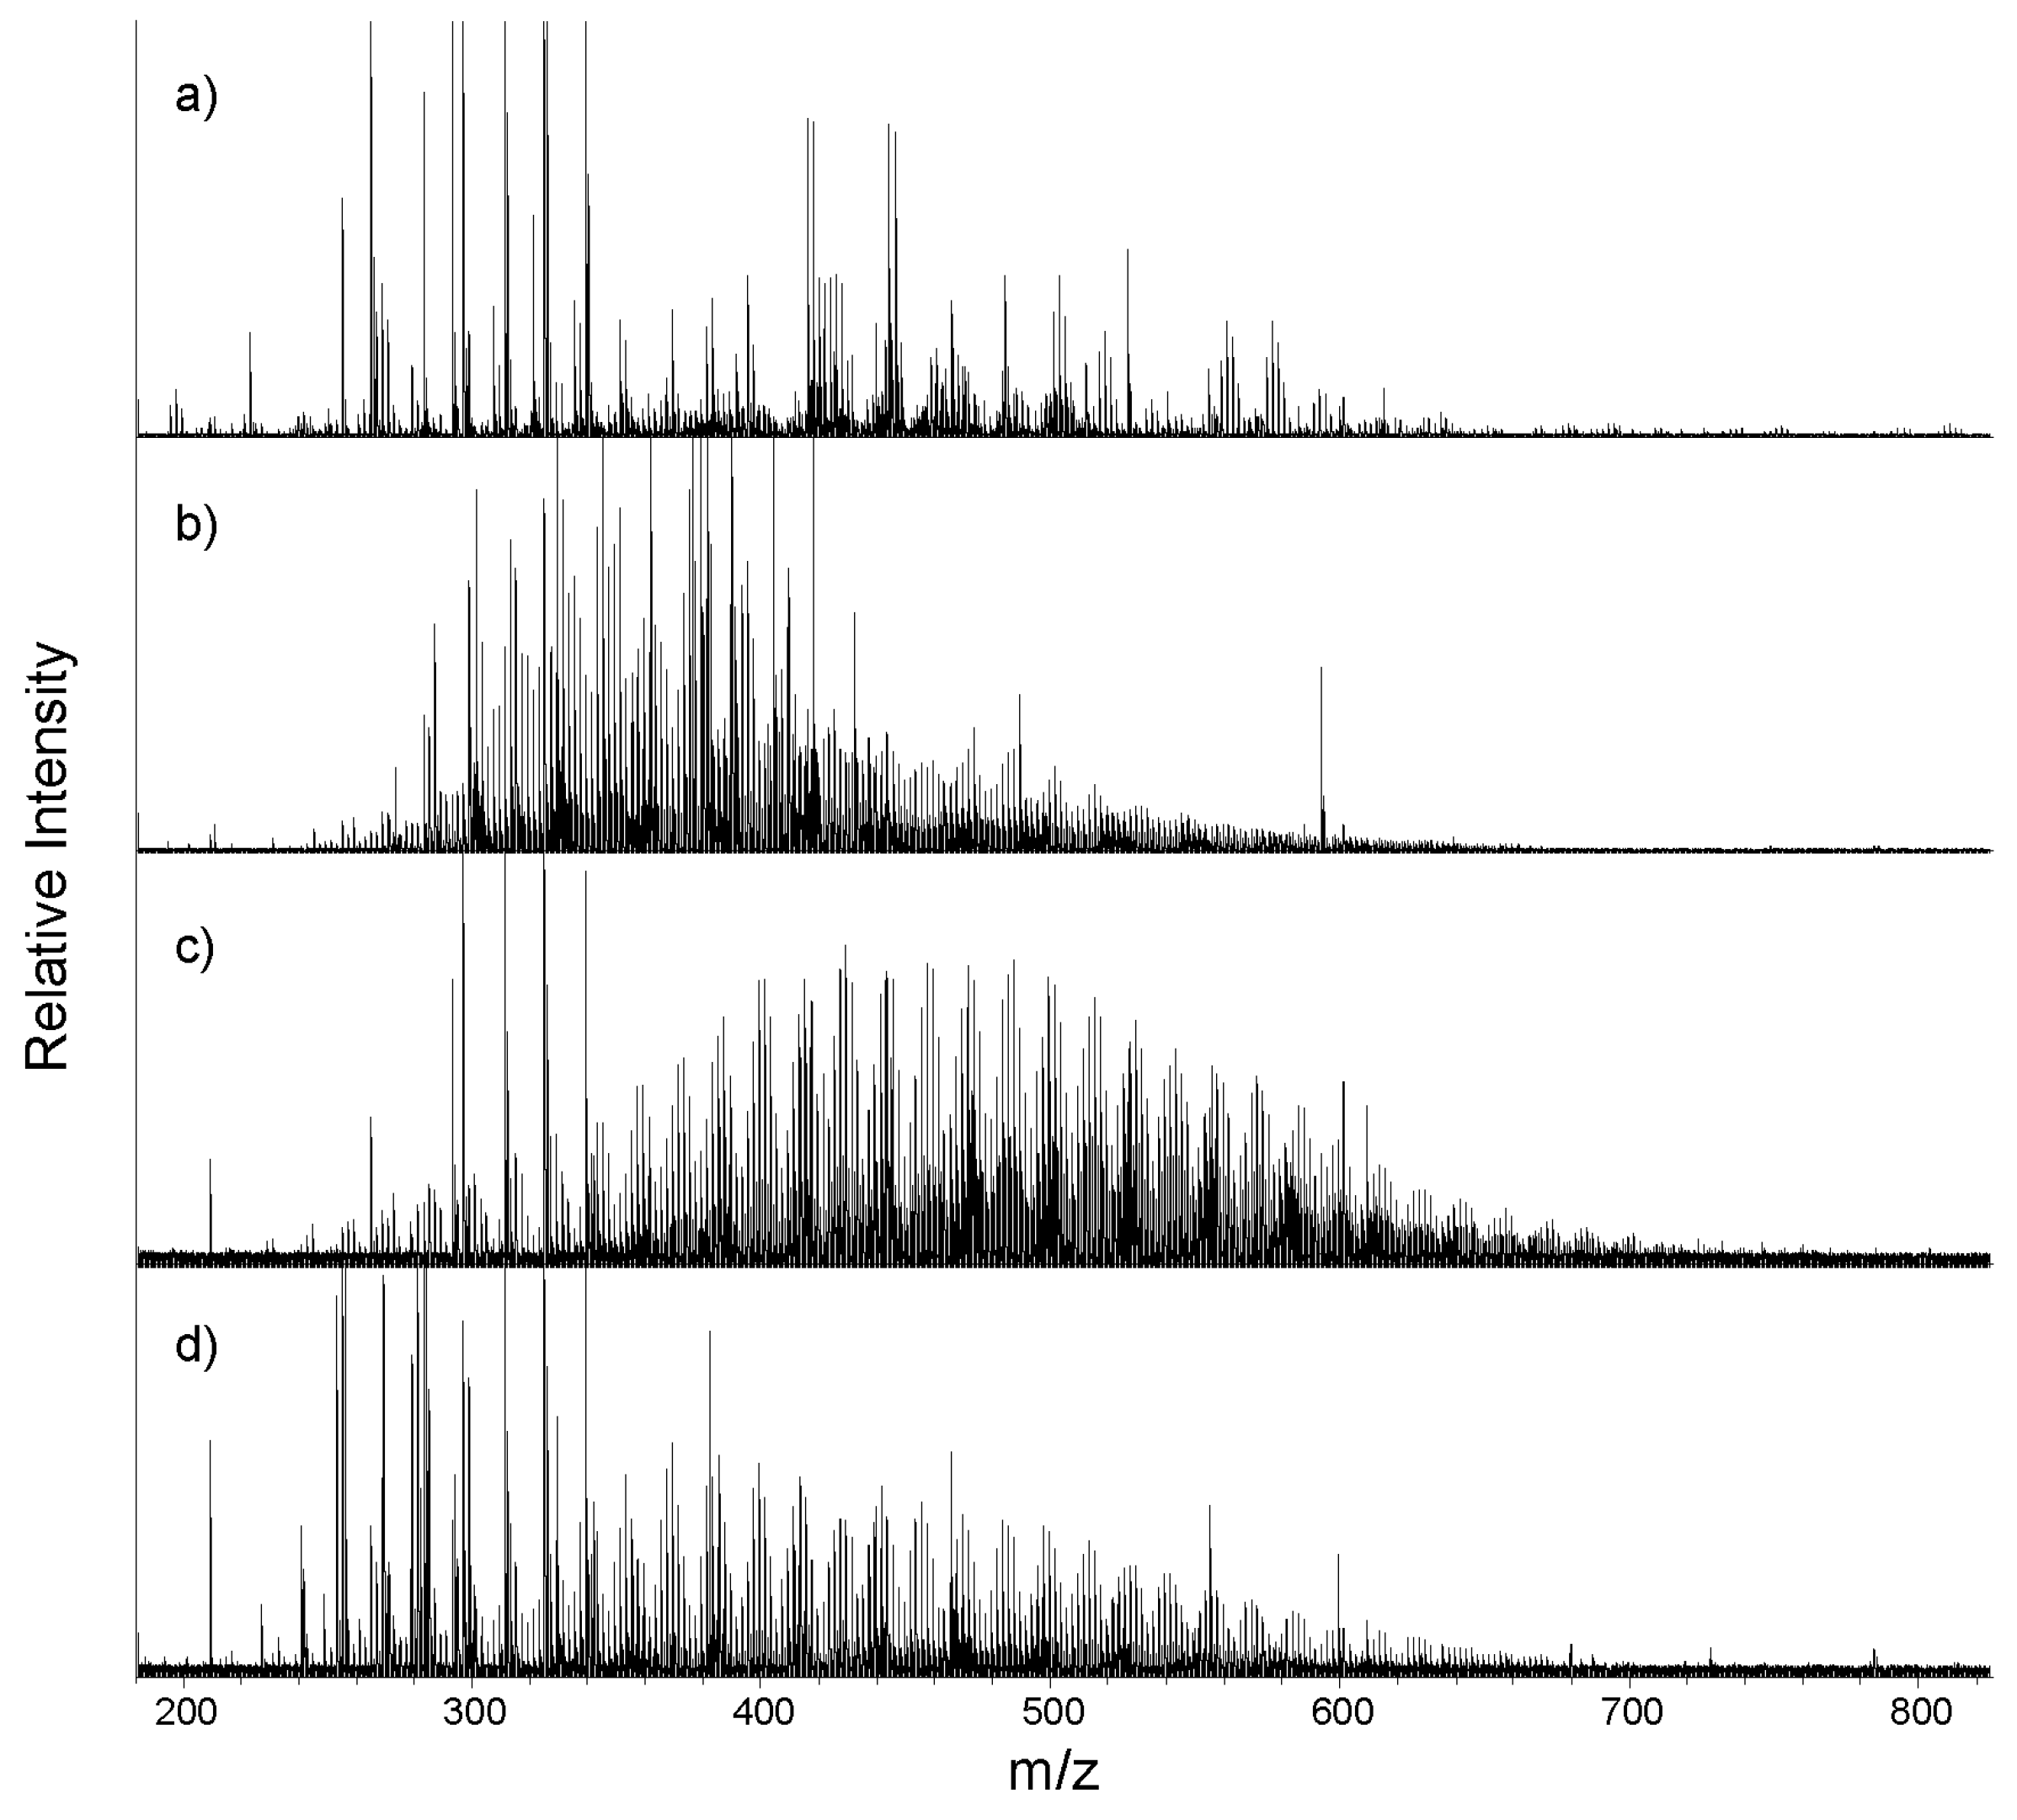
3.2. Mass Spectra and Average Source Molecular Characteristics
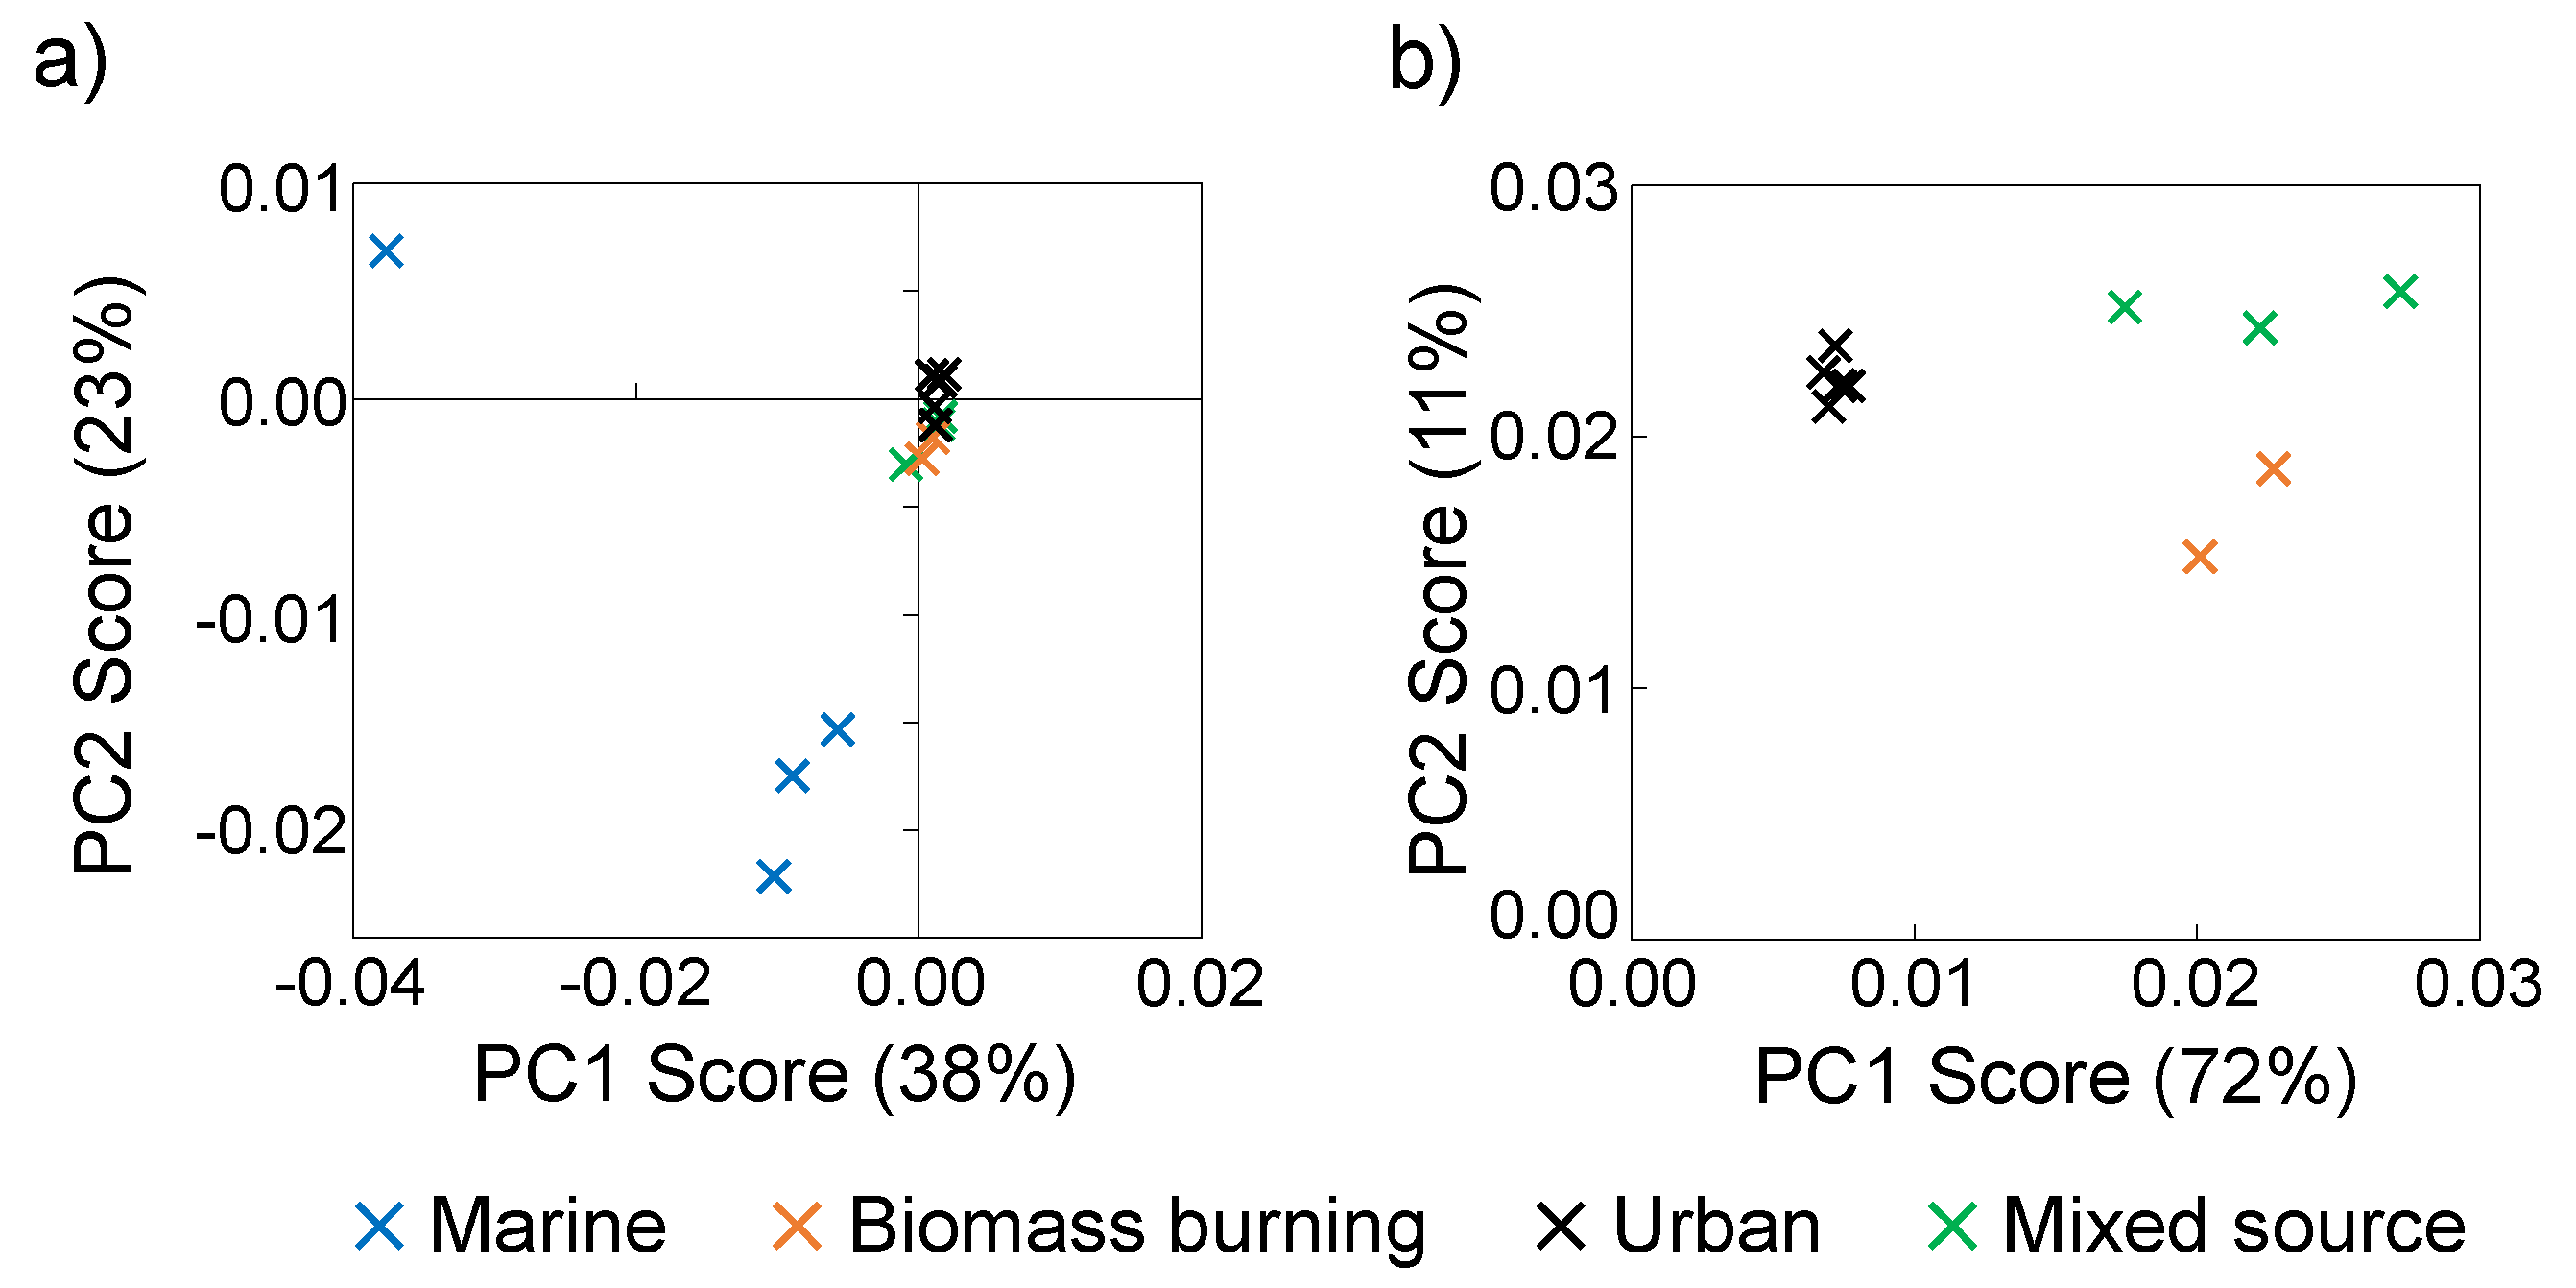
Averaged values calculated for properties determined using FTICR-MS molecular formulas for each of the sample types demonstrate some source-specific characteristics that differentiate them from one another. Each of the ESI-FTICR mass spectra for the ambient aerosol extracts average thousands of peaks across a broad range of 200–800 m/z (Figure 1). The average number of formulas found in each sample’s master formula list (i.e., WSOM−, WSOM+, and PSOM− combined) followed the same trend as was observed for the TSP and TC concentrations (Table 2). The biomass burning aerosols showed the highest TC loads and averaged 6579 (±173) formulas assigned to each sample and a total of 7891 formulas. The urban aerosols were the next most molecularly abundant sample type averaging 6527 (±173) formulas per sample and a total of 10,701 formulas in all samples. An average of 4104 (±467) formulas were assigned to each mixed source sample, and a total of 6134 formulas were identified. To go along with their lowest TC load (Table 1), the marine aerosol samples totaled just 4570 formulas, averaging 2569 (±736) formulas per aerosol sample. Higher quantities of organic carbon increase the overall number of compounds and the probability of a more diverse suite of compounds, and the similar trends in molecular formula abundances and TC loads are thus logical and likely related.
The marine aerosols share the lowest average O/C ratio (0.32 ± 0.19; Table 2) with the biomass burning aerosols, differentiating them from the urban and mixed source aerosols which had considerably higher average O/C ratios (0.45 ± 0.23 and 0.44 ± 0.23, respectively). The lower average O/C values for the biomass burning and marine aerosol samples suggest they are less oxidized than the mixed source and urban aerosols due to less post-emission atmospheric processing and/or lower characteristic O/C OM at emission. Atmospheric aging processes are known to increase the average O/C ratio of aerosol OM [43,44]. The average O/C ratio (0.45 ± 0.23) for the urban aerosols is the highest of all the samples, supporting previous work showing highly oxidized OM near urban regions due to active photochemistry and abundant inorganic oxidants [45,46] in spite of proximity to primary OA sources including vehicle exhausts that are expected to have a hydrocarbon-like (low O/C) profile. The similarly high average O/C ratio measured for the mixed source samples, however, demonstrates that the high O/C ratios and presumed high extent of atmospheric oxidation are not unique to urban environments.
The marine aerosols have the highest average H/C ratio (1.56 ± 0.39). The modified aromaticity index (AImod) was calculated for each molecular formula according to the formula proposed by Koch and Dittmar [47]. The average AImod for the marine aerosols (0.18) is equal to the mixed source and urban aerosols and indicative of the prevalence of olefinic/alicyclic (0 < AImod < 0.5) compounds. These ratios differentiate the marine aerosols from the biomass burning aerosols where the O/C ratios did not. The average H/C ratios for the biomass burning samples are the lowest (1.35 ± 0.39) of any of the aerosol sources indicating a large number of unsaturated molecules, and this is verified by its average AImod (0.29 ± 0.27), which is much higher than those of the other three types of samples. As was the case for the O/C ratios, the average H/C ratio (1.46 ± 0.35), and AImod (0.18 ± 0.23) of the mixed source aerosols are very similar to those calculated for the urban samples (H/C ratio = 1.44 ± 0.37, AImod = 0.18 ± 0.24) making them almost indistinguishable based on these properties alone (Table 2). The biomass burning aerosols have substantially more aromatic (0.5 ≤ AImod < 0.67, 16.7%, 1318 formulas) and condensed aromatic (AImod ≥ 0.67, 6.6%, 523 formulas), and fewer aliphatic (AImod = 0, 23.6%, 1864 formulas) formulas than any of the other emission sources but a similar amount of olefinic/alicyclic formulas (53.0%; Supplemental Table S2). The urban, marine, and mixed source aerosols all showed similar distributions with regard to AImod classifications.
The averaged contributions of elemental formula combinations to each master formula list also present a broad brush method for distinguishing among the four sample types. Details regarding the properties for each ionization source can be found in the supplementary information (Supplemental Table S3), but will not be discussed. CHO formulas were always the most abundant (marine, mixed source) or second most abundant (biomass burning, urban) formula type for each group (Supplemental Table S2). The relative distribution of CHOS and CHONS formulas are similar among all the sources (CHOS = 17.8%–20.9%, CHONS = 12.2%–15.4%) with the mixed source aerosols having the highest contributions from both formula types. The marine aerosols show the largest relative contributions from P-containing molecular formulas. The van Krevelen diagram enables a representation of all of the molecular formulas assigned to the samples including the variation of H/C and O/C ratios as well as a visualization of some of the differences and commonalities described by the averaged ratio values (Supplemental Figure S1), and can be used to characterize differences among the four sample types. However, any of several molecular formulas can plot at the same H/C and O/C ratios, and it is laborious and inefficient to evaluate similarities and differences among samples by looking at tens of van Krevelen diagrams. It is more efficient and statistically valid to identify the defining features among several samples with large molecular formula datasets using a factor analysis such as PCA.

3.3. FTICR-MS PCA

The majority of the variance (66.0%) in the FTICR-MS formula identifications among the four aerosol sample types is explained by the first three principal components (PC1, 32.5%; PC2, 22.4%; PC3, 11.1%; Figure 2). The aerosol samples show distinctive PC1–PC3 values based on their source characterization. Each of the marine samples have a negative PC1 score, a positive PC2 score, and a positive PC3 score. The mixed source samples have a positive PC1, a positive PC2, and a negative PC3 score. The biomass burning samples have a negative PC1, a negative PC2, and a positive PC3. The urban samples have a positive PC1, a negative PC2, and a positive PC3. These PC score classifications were used to identify the loadings (the molecular formulas used as PCA input variables; Supplemental Figure S2) diagnostic for each source. For example, if a molecular formula has negative PC1 loadings, and positive PC2 and PC3 loadings, it is classified as a formula characteristic of marine sources. This resulted in the identification of 1078 formulas characteristic for marine aerosols, 693 formulas for mixed source aerosols, 4174 formulas for biomass burning aerosols, and 3484 formulas for urban aerosols. The remaining 5379 formulas contain characteristics that are represented by multiple sources indicating that they are not diagnostic of a particular source and may be ubiquitous in aerosol OM or inconsistently present in a given source.

3.3.1. Marine Aerosols

In contrast with the average CHO contributions for the master formula list (41.1%), the PCA-identified formulas for the marine aerosols showed the lowest contributions from CHO formulas (31.6%, Table 3) of all the sample types. CHO formulas are still the most abundant formula type of the PC loadings associated with the marine aerosols, and the majority of these formulas are present at high H/C and low O/C ratios (Figure 3a). In fact, most of the formulas identified as specific to marine sources by PCA are localized to the upper-left region of the van Krevelen diagram (O/C ≤ 0.6, H/C ≥ 1.5), a region where many biologically-relevant compounds (lipids, fatty acids, proteins), suggesting that biological activity is an important source for marine aerosols (Figure 3a).
The PC loadings for the marine aerosols have the largest fraction of CHOS (27.4%), CHONS (19.0%), and CHOP (N,S) (8.6%) formulas of all the samples (Table 3). It appears thus, that the heteroatom containing formulas that are present in marine aerosols are very distinctive. The abundance of P-containing formulas in this region of the van Krevelen diagram is consistent with inputs of biologically-derived phospholipids as has been observed previously for marine aerosols [31]. Membrane phospholipids have characteristic fatty acid tails with hydrophobic alkyl chains and hydrophilic phosphate heads that can impart amphipathic characteristics, and these P-containing formulas are found in both the PSOM− and WSOM− (Supplemental Table S4; Figure S3) in agreement with this partial solubility. The large number of CHOS and CHONS formulas plotting in these regions have O/S ratios >4 and are suggestive of organosulfate compounds which have also been observed in marine aerosols [31,48,49]. Organosulfates are formed via photochemical aging reactions with the acid-catalyzed ring opening reactions of precursor molecules being the most kinetically favorable reaction mechanism [50,51,52]. In this instance, the sulfate available for reaction is likely to be marine-derived from biological emissions of dimethyl sulfide that is oxidized in the atmosphere or from sea salt sulfates emitted with sea spray. The low O/C ratios of the marine CHOS and CHONS molecular formulas suggest that any precursor organic compounds were lipid-like in nature and also had low O/C ratios.
Many studies have demonstrated the influence of biological activity on marine aerosols citing the importance of carbohydrate-like and amino-acid-like compounds, for example [53,54,55]. Carbohydrates are not strongly ionizable compounds under electrospray and are not observed in these samples, and it is important to note that these characteristics represent only the polar, ionizable fraction of marine aerosols. The high H/C and low O/C CHO, CHOP(N,S), CHOS, and CHONS molecular formulas are characteristic of that polar, ionizable fraction, and studies apportioning the sources of OA to a coastal site, for example, can use them as evidence for a marine input to coastal OA. Likewise, studies apportioning sources to OA collected in the marine environment can take large contributions from aromatic or highly oxygenated compounds (O/C > 0.6) as evidence for terrestrial sources.

3.3.2. Biomass Burning Aerosols

The biomass burning aerosol PC loadings are characterized by having the lowest average O/C and H/C values, and the highest AImod values (Table 3). These average ratios are consistent with the bulk properties discussed in Section 3.2 (Supplemental Table S2) but exaggerate the extreme ratios in the biomass burning aerosols to even lower H/C (1.24 vs. 1.35) and O/C (0.26 vs. 0.32) ratios and a higher AImod (0.37 vs. 0.29). The PC loadings that define the biomass burning aerosols thus have low O/C and H/C and high AImod and show the largest fraction of aromatic and condensed aromatic formulas (32.4%) of all the sample types (Table 3). Additionally, more than 80% of the biomass burning PC loading formulas are CHON (45.4%) and CHO (34.7%), suggesting that these two elemental formula groups are most responsible for distinguishing biomass burning aerosols from the other sample groups. Interestingly, the CHOS and CHONS formulas for the biomass burning aerosols master list of formulas made up nearly 20% and 12% of all assigned formulas and spanned a very wide O/C (0.10–1.20) and H/C (1–2) range (Figure 2). However, CHOS and CHONS formulas accounted for just 12% and 7.8% of the PC loadings associated with the biomass burning aerosols and plot in two clusters of the vK diagram (1) at H/C between 1.5 and 2.0 and O/C between 0.1 and 0.5; and (2) at H/C between 1.0 and 1.5 and O/C between 0.3 and 0.6. The much lower contributions of S-containing formulas attributable to biomass burning in the PC loadings suggests that the majority of the CHOS and CHONS formulas in the biomass burning samples (at high H/C and high O/C) are found in multiple sample types, and those particular CHOS and CHONS formulas may not be particularly useful as diagnostic of any one sample type. Studies of S-containing OA demonstrate the ability of existing OA and VOCs to form organosulfates via atmospheric oxidation reactions [17,56,57,58]. Emissions of inorganic sulfur are commonly associated with anthropogenic (e.g., fossil fuel emissions) [59,60] and marine sources (e.g., gas and aerosol-phase marine emissions) [61], but the abundance of CHOS and CHONS formulas in the mixed source and biomass burning aerosols demonstrates the ubiquity of organosulfur compounds in and beyond those environments.
The van Krevelen diagram shows the CHON and CHO formulas to make up a large portion of the aromatic and condensed aromatic PC loading formulas for the biomass burning aerosols, as indicated by their presence in the low O/C and low H/C regions (Figure 3b). Aromatic and condensed aromatic compounds have higher potential for absorbing light than more saturated molecules [5] and make up portions of the BC and brown carbon pools. The definitions of these two carbon pools are, by necessity, operational and remain a topic of debate [5,42,62]. Traditional definitions of BC assume it to be insoluble in water, but this has been challenged, and BC is recognized to exist on a continuum of solubility. Recent studies have shown that BC can become soluble upon oxidation [63,64] and have detected dissolved forms of BC in aerosols [20] and aquatic dissolved OM [65]. The definitive study relating dissolved BC determined by chemical techniques to thermal optically-defined BC has not to our knowledge been performed. However, the polyaromatic structures that are required for formulas defined as condensed aromatic using the AImod classification system [47] are consistent with structures proposed for BC [66]. The biomass burning PC loadings are distributed relatively evenly among the three extract-ionization pairings (Supplemental Figure S3). Interestingly, however, the majority of the aromatic and condensed aromatic formulas assigned as important to the biomass burning samples by the PCA were detected in the WSOM− and WSOM+ analyses (Supplemental Table S4). This may result because pyridine does not efficiently extract BC or because less oxygenated BC that is extracted into PSOM does not ionize efficiently in ESI, and it is unclear what fraction of the biomass burning BC is soluble.
A great many CHON formulas have very low O/C (0.05–0.40) and H/C (<1.0) ratios, indicating that they may contain reduced nitrogen functional groups (e.g., amines) or have heterocyclic rings. A subset of these compounds contributes to the black nitrogen (heterocyclic aromatic nitrogen produced during biomass combustion or derivatives of BC that have undergone reactions with inorganic nitrogen) compounds that have recently suggested to be important components of the nitrogen and carbon cycles in aquatic systems [65]. Indeed, the WSOM from these biomass burning aerosols do contain fluorophoric compounds, and the fluorescence intensity is substantially higher than the mixed source and urban aerosols (Willoughby et al., unpublished data). The brown color of the sample filters suggests that these samples do contain significant amounts of brown carbon which, like BC, has no unequivocal chemical definition [5]. Brown carbon is formed alongside BC in combustion processes [5], and has also been formed through model reactions of aqueous SOA with NH3 [67,68]. Though the global importance of brown carbon is still a topic of debate, it has recently been suggested that biomass burning is the predominant source of brown carbon to the world’s atmosphere [69], and the results presented here and elsewhere [70,71] suggest that aromatic N-containing compounds are major components of that brown carbon and diagnostic of biomass burning.

3.3.3. Urban Aerosols

The molecular formulas with PC loadings that identify them as important to the urban aerosols are also characterized by a large number of CHON (38.0%) and CHO (33.4%) formulas. The majority of these PC loadings are found in WSOM− measurements (Supplemental Figure S3) and have significantly higher O/C ratios than those found in the biomass burning aerosols (Figure 3c). The average O/C (0.55 ± 0.21) is double and the average AImod (0.18 ± 0.22) is half that of the biomass burning aerosols. The average O/C value for the urban aerosol PC loadings is much higher than the average value for the entire urban aerosol master list (0.45, Table 2) highlighting the distinguishing nature of those high O/C components. Many of the CHO and CHON formulas that the PCA associates as important to the urban aerosols have O/C ratios between 0.35 and 0.85 and H/C ratios between 0.8 and 1.8, an area of the van Krevelen diagram that overlaps with regions previously described for lignin-like or carboxyl-rich alicyclic molecules (CRAM) in the soil and aquatic literature (Figure 3c) [72,73]. In the atmosphere, formulas in this region are likely to be the result of atmospheric aging reactions which tend to increase the oxidation state of carbon [44] and transform OA compounds into new compounds that plot downwards and to the right on a van Krevelen diagram [43].
Aliphatic CHOS and CHONS molecular formulas plotting at O/C between 0.3 and 1.2 and H/C between 1.3 and 2.0 were also abundant among the PC loadings for the urban aerosols. Fossil fuel combustion and biological emissions are major sources for aliphatic compounds in the atmosphere [11,74], and the presence of heavy traffic and heavy industrial activity in short and long range proximity of the urban sampling site suggests that fossil fuel combustion as strong candidates for these compounds. The high O content in these formulas is suggestive of organosulfate (O/S > 4) and nitrooxyorganosulfate (O/S > 7, contains N) compounds as potential identities. The abundance of oxidized inorganic nitrogen and sulfur emitted in urban areas combined with emissions of aliphatic biological and anthropogenic compounds make for an excellent environment for organosulfate and nitrooxyorganosulfate compound formation [75,76].
Those two major distinguishing features (CHO and CHON formulas at 0.35 < O/C < 0.85 and CHOS and CHONS formulas at 0.8 < O/C < 1.8) can be used to apportion OA as anthropogenically-influenced urban aerosols. In fact, they have been used in a study of OA collected on a transect in the North Atlantic Ocean to apportion OA to North American terrestrial air mass influences [31]. The CHON, CHONS, and CHOS formulas identified as important to the urban OA have distinct characteristics from those identified as important to the marine and biomass burning aerosols. The carbon backbones to which N and S functional groups are bound (or incorporated) are very different, and the PCA has made this clear.

3.3.4. Mixed Source Aerosols

The mixed source aerosols contain the fewest formulas identified by PCA, indicating those samples have few compounds specific to a unique source and share many molecular features with the other aerosols. Given the potential influences to these aerosols, the lack of an abundance of truly defining features is perhaps expected. Nonetheless, the PCA did identify a few OA components specific to the mixed source aerosols. Like the urban aerosols, the majority of the PC loadings important to the mixed source samples were water-soluble. Unlike the urban aerosols, many of these PC loadings were in the WSOM+ measurements suggesting relatively higher amounts of compounds with basic functional groups in the mixed source environment (Supplementary Table S4, Figure S3).
A cluster of CHOS formulas at low O/C and H/C ratios (O/C < 0.4, H/C < 1.2) is evident in the PC loadings (Figure 3d). Most of these formulas do not contain sufficient oxygen to be organosulfates, and therefore must represent more reduced forms of organic sulfur (e.g., thiols). Examination of the master list van Krevelen diagram shows that these types of compounds are also present in the urban and biomass burning aerosols but not nearly to the extent of the mixed source OA (Figure S1). Sulfonates are a common anthropogenic pollutant and are ubiquitous in personal care products, and have been previously identified in aerosol OM [75]. Non-sulfate aromatic S-containing compounds have been identified in fossil fuels [77,78]. The presence of these reduced sulfur compounds in North American continental relative to marine aerosols lends support to the idea that this group of compounds may be anthropogenically-derived. A tight cluster of P-containing formulas (0.35 < O/C < 0.45, 1.45 < H/C < 1.55; Figure 3d) is also evident in the mixed source aerosols. OA compounds containing P have been attributed to biological sources [31,79], and a distinct local biological source is speculated for these formulas in the mixed source OA. The remaining CHO, CHON, and CHOS formulas with PC loadings assigned to the mixed source OA are scattered at O/C < 0.6 and H/C > 1.0, less oxygenated than the urban aerosol PC loadings and less aromatic than the biomass burning aerosols. The defining features for the mixed source aerosols are, as expected, indicative of the multiple potential sources to the sampling site.
As was found for each of the other sources, a portion of the mixed source PC loading formulas can be defined as condensed aromatic. The presence of condensed aromatic species, which may also be characterized as BC and functionalized derivatives of BC, in all of these samples reflects their ubiquity in the atmosphere even over the North Atlantic Ocean. BC is traditionally regarded as a product of combustion, as in the combustion of fossil fuel or biomass. Numerous pyrogenic sources exist on the east coast of the US (vehicular exhaust, shipping, biomass burning, and long-range transport from various anthropogenic activities), and are probably contributors to BC even in the rural environment where the mixed source aerosols were sampled and over the marine environment. It has been recently shown that BC-like compounds can also be produced from non-pyrogenic sources [80,81], but the prevalence of this mechanism has yet to be established for atmospheric systems. Regardless of origin, these aromatic and condensed aromatic species are capable of absorbing ultraviolet radiation resulting in a positive radiative forcing (i.e., climate warming) [5]. While ESI-FTICR-MS provides an immense amount of molecular information regarding complex OM mixtures, the limitations are well-established. The ability of a compound to be analyzed is highly dependent on its ability to ionize, and non-polar and non-ionizable compounds (e.g., hydrocarbons and carbohydrates) are largely omitted from this analysis. Additionally, this analysis is necessarily qualitative because a combination of charge competition, concentration, and ionization efficiency drive the peak intensities. However, 1H NMR does not have the same bias for the detection of OM, and provides a complementary set of information regarding the chemical makeup of these complex samples.

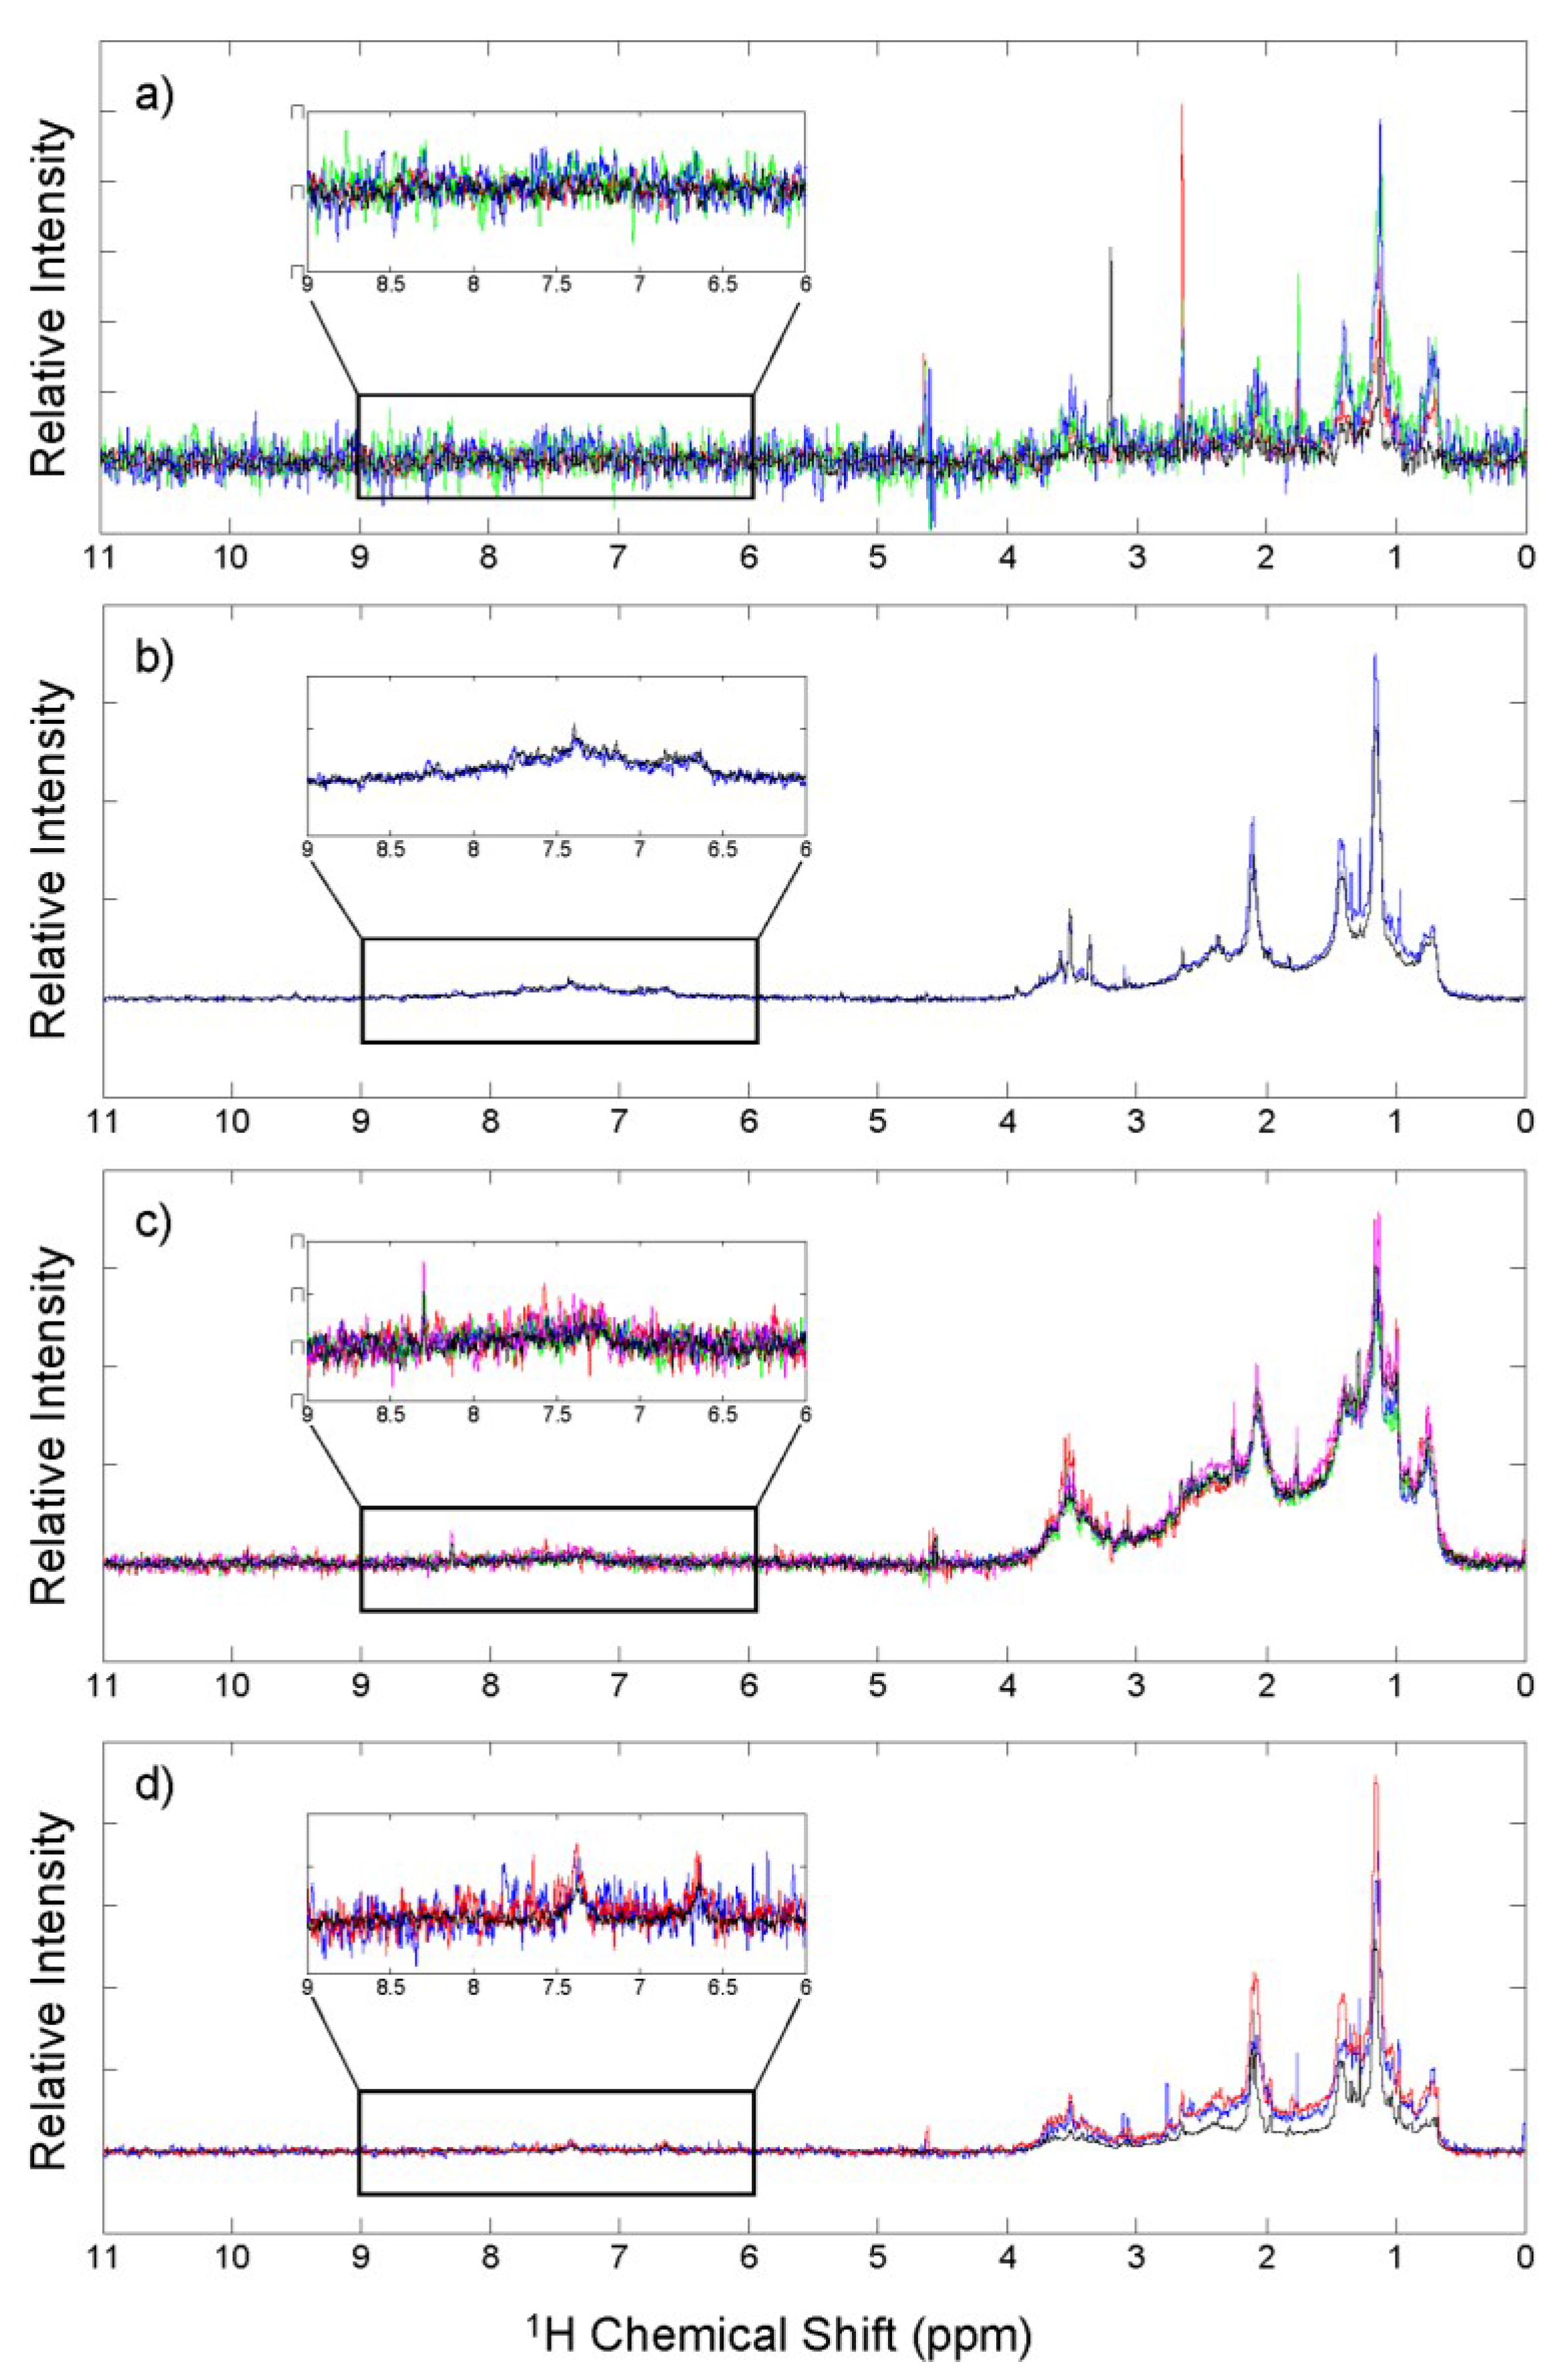
3.4. 1H NMR Analysis
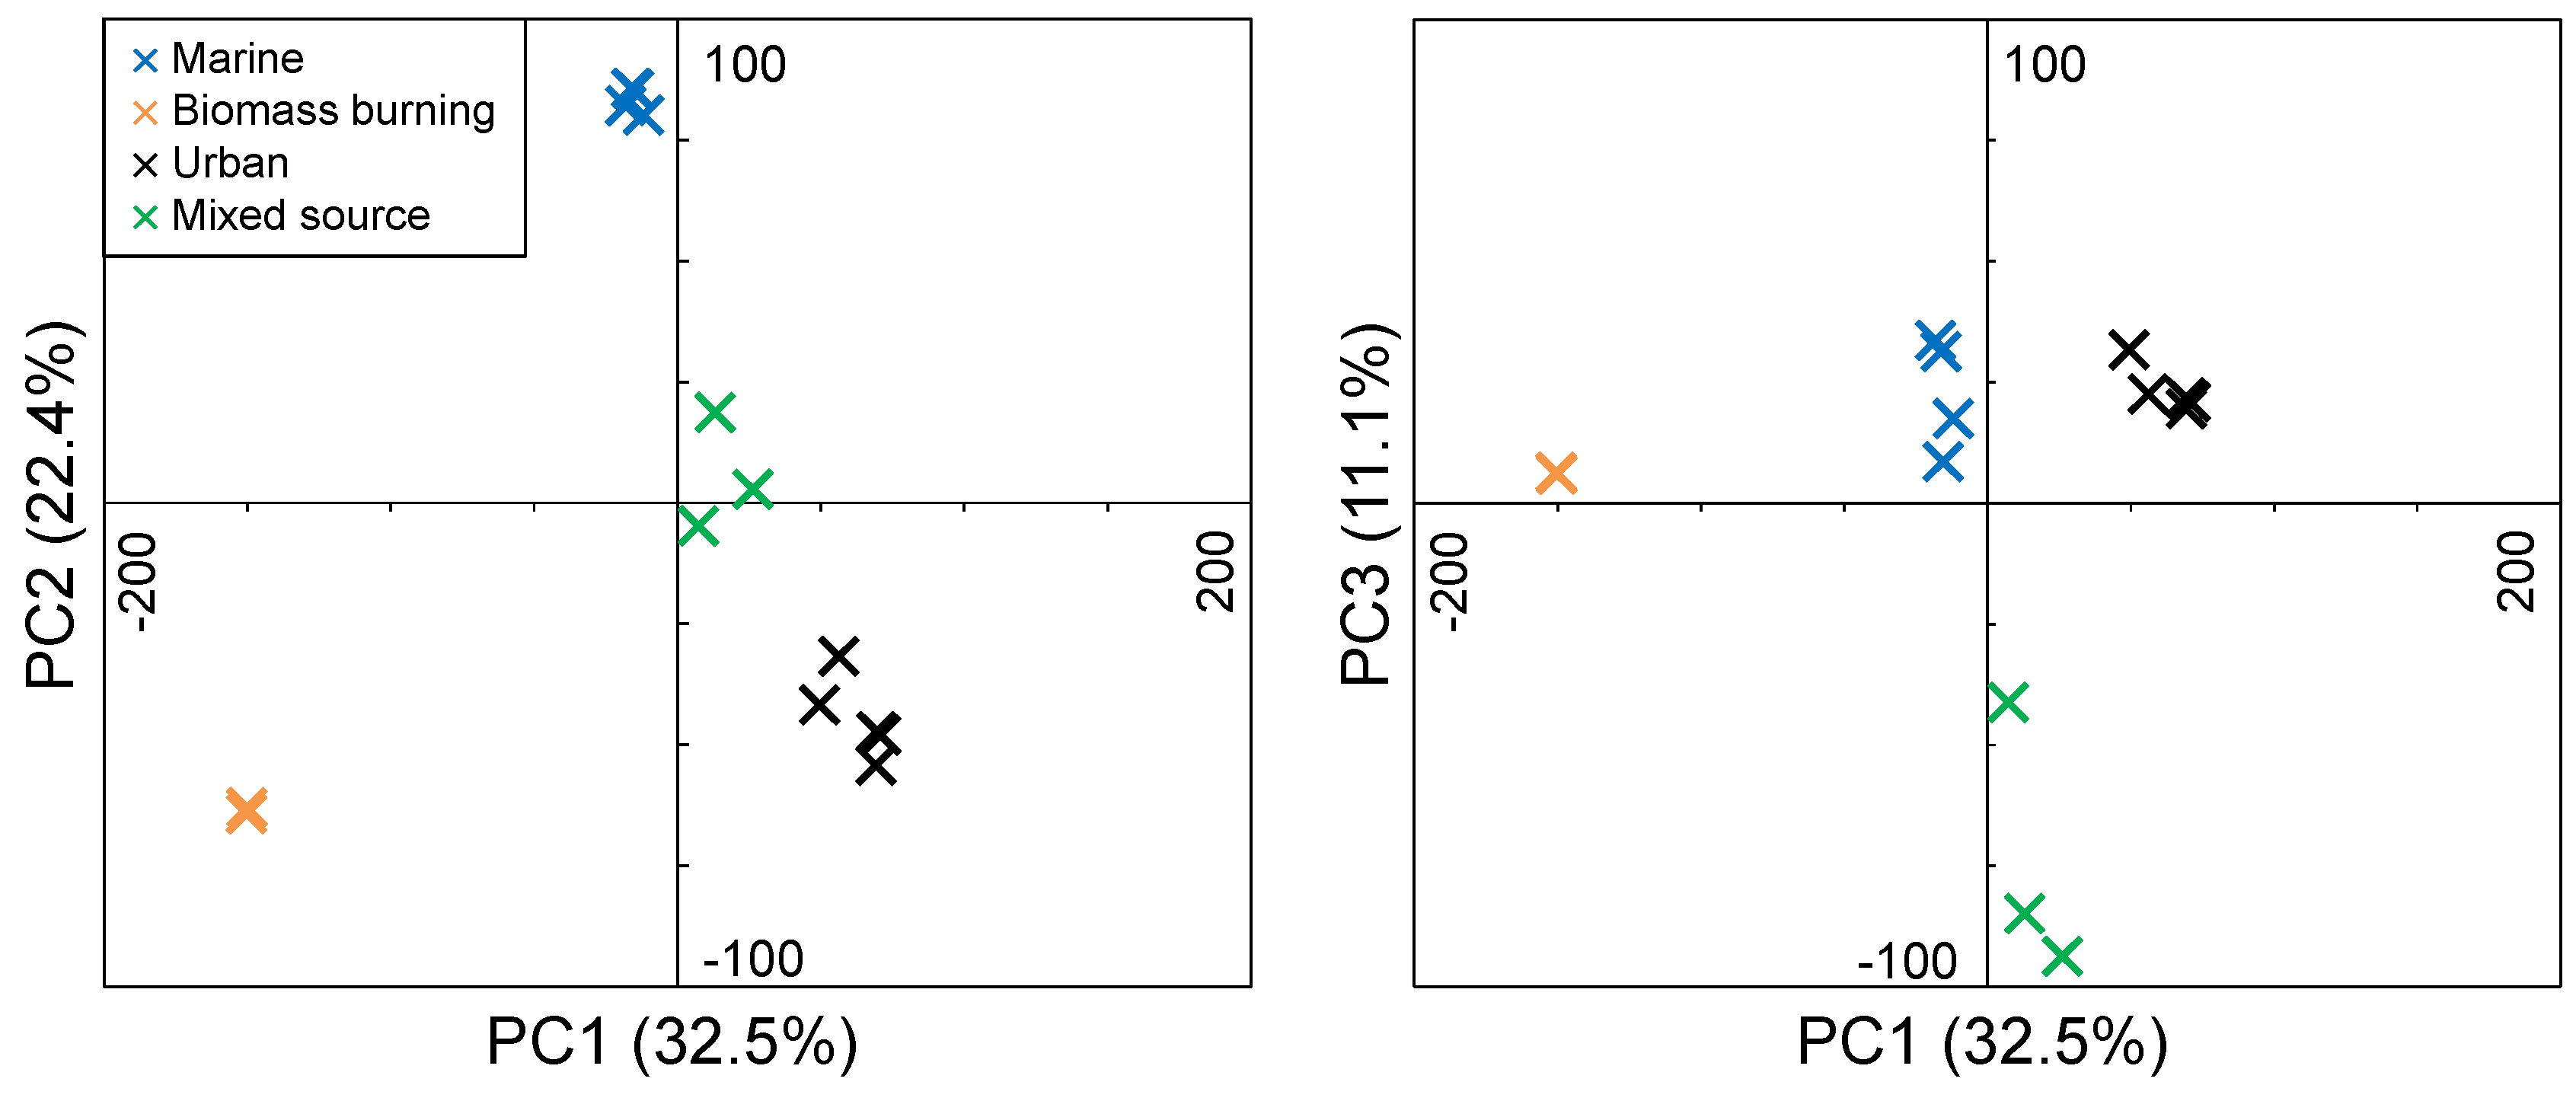
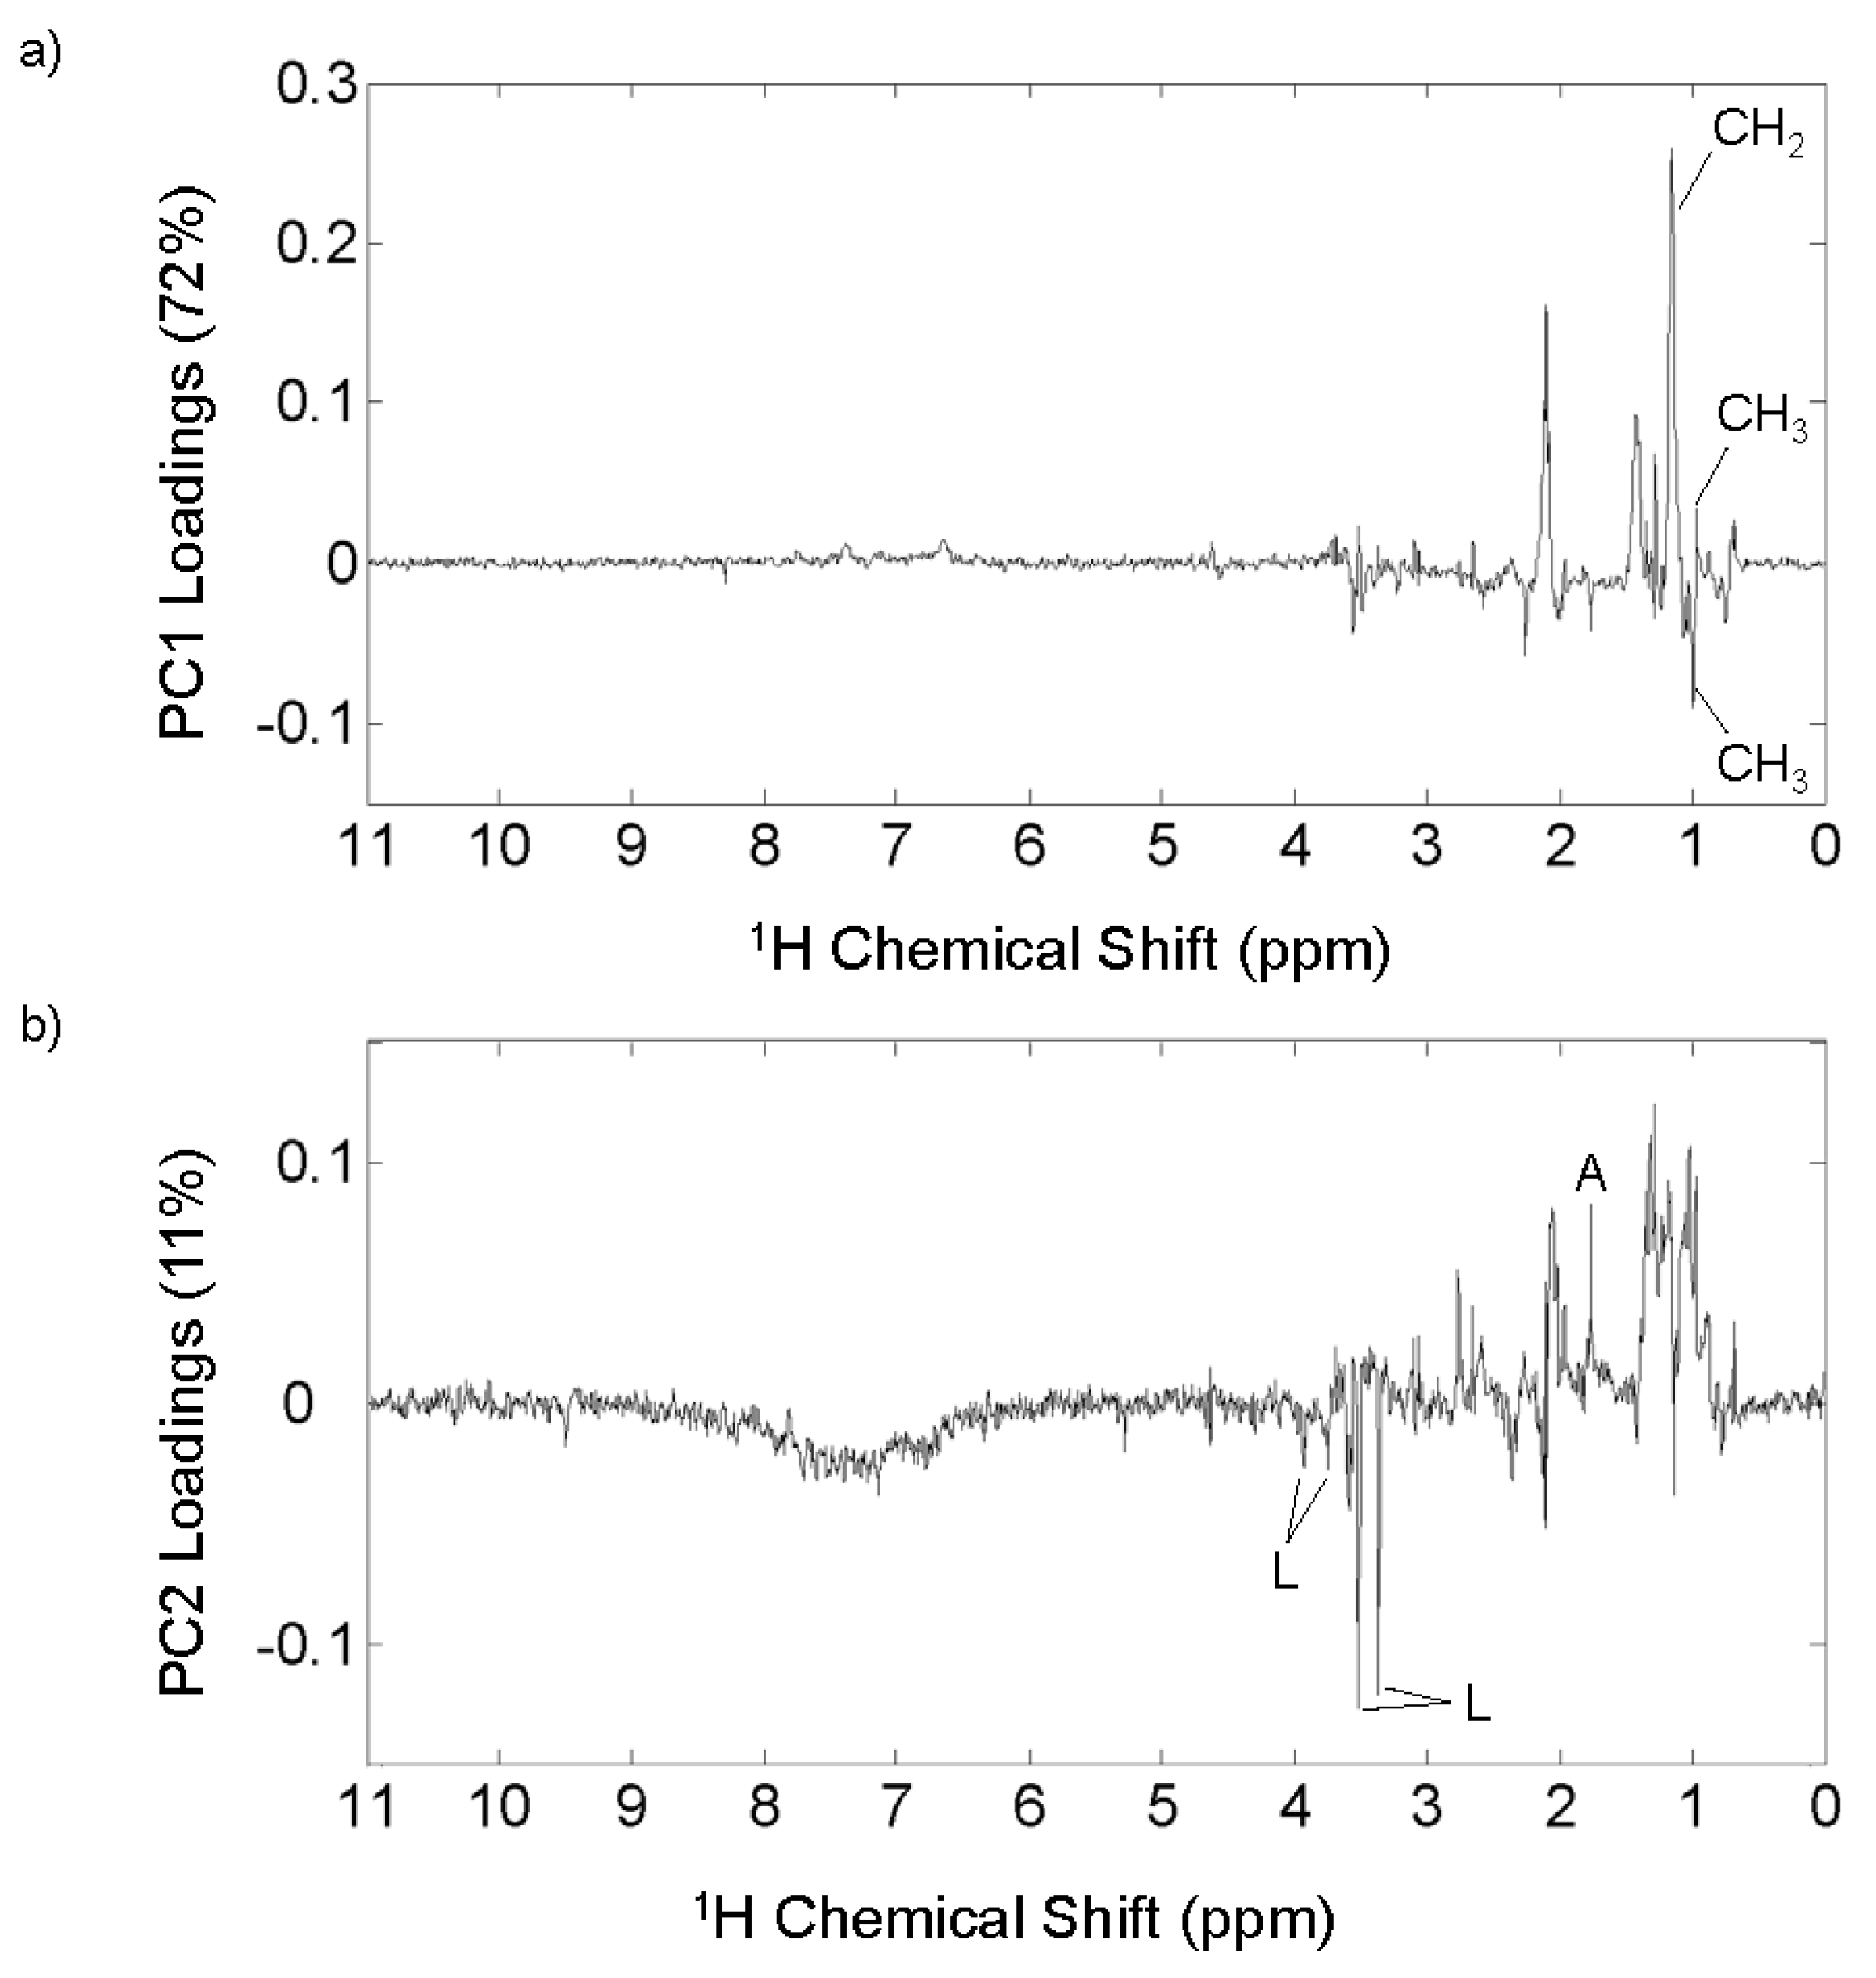
The WSOM for each of the aerosols display an array of proton types spanning the spectral region between 0 and 11 ppm (Figure 4). The observed chemical shifts are related to the chemical environment of each proton, and provides clues to the structural connectivity of the atoms within each sample. The region between 0 and 4.4 ppm contains at least 90% of the signal in each of the spectra. Most of the spectra contain broad peaks indicating similar proton types attached to varying carbon chain lengths or located in varying proximity to polar functional groups. These broad peaks exemplify the complexity of aerosol WSOM, and make it difficult to identify individual compounds. However, the region in which a proton signal is detected can indicate the general class of compounds to which that proton belongs. For example, the most intense peak in each spectrum is located at 1.2 ppm and is indicative of protons that are part of a CH2 group, which represent those that are part of an alkyl chain. This peak is broadest in the urban aerosols, suggesting the alkyl chains are longer, and the CH2 protons in these aerosols are attached to the widest variety of structural entities. Conversely, the narrower CH2 peak in the marine, mixed source, and biomass burning aerosols suggests shorter chain lengths and less diversity regarding chemical environments among CH2 groups. Smaller chain lengths could indicate decomposition of larger molecules by photochemical degradation, or suggest that the molecules have not undergone substantial oligomerization reactions, such as those that add small volatile species like isoprene.
Dividing the spectrum into key proton regions and evaluating the relative contributions of the total spectral intensity can reveal important differences among the different sources (Table 4). The region where signal from aromatic protons are found (6–9 ppm) is the most variable among the sources. A broad signal is observed in the aromatic region of the biomass burning aerosols spectra (Figure 4b inset) and it makes up 9.2% of the total intensity, a percentage more than 4 times greater than the other sources (Table 4). Protons in this region are attached to aromatic or condensed aromatic rings, and the broadness of the peak indicates a high degree of structural diversity among the aromatic protons in these aerosols. There is little signal in the aromatic region in the urban and mixed source aerosols, and essentially no signal in the marine aerosols, indicating there are either very few aromatic compounds in these aerosols or that only water-insoluble aromatic species are present. The observation of a much larger intensity in the aromatic region of the biomass burning aerosols supports the detection of more aromatic and condensed aromatic formulas in the FTICR mass spectra as well as the higher concentration of BC, and suggests that the biomass burning aerosols contain a larger quantity of chromophoric OM than the other aerosol sources investigated here.
As previously mentioned, the majority of the signal in each NMR spectrum falls in the region between 0.6 and 4.4 ppm, and the relative signal in each of the major proton regions does not vary greatly between the sources. At least 50% of the signal falls in the H-C region (0.6–1.8 ppm) in all cases, indicating that a majority of the protons are part of alkyl groups. The larger H-C fractions observed in the urban and mixed source aerosols suggest that OM contains larger carbon backbones (linear or branched). Carbon can be added to existing OM via oligomerization reactions, and the larger carbon chains present in the mixed and urban aerosols suggests that they have undergone oligomerization reactions more extensively than the marine and biomass burning aerosols. Protons that are more downfield in this region (1.4–1.8 ppm) are often attributed to an H-C group that is β to a carbon attached to heteroatoms (H-C-C-C-X, where X = N, S, or O) [14]. The presence of a large number of heteroatomic compounds identified in each of the mass spectra (CHON, CHOS, and CHONS) indicates some portion of the signal in this region represents these species as can be expected for OA and was noted previously (Section 3.2).
Approximately one-third of the signal intensity falls in the unsaturated alkyl region (H-C-C=; 1.8–3.2 ppm), which includes carbonyl, carboxyl, alkenes, and also hydrogen attached to carbons adjacent to a nitrogen or sulfur (i.e., amines, thiols, etc.). The marine and urban aerosols have the highest relative percentage of proton signal in this region, but are also the most variable. On average, approximately 9% of the proton signals are found in the oxygenated aliphatic region (3.2–4.4 ppm) for the aerosols collected over terrestrial environments and a much higher percentage is observed in the marine aerosols (14.5%). The greater signal intensity in this region of the marine aerosols is surprising given the low O/C ratios of the molecules identified in the FTICR mass spectra, but this could be due to the presence of oxygenated species that are outside of the ESI-FTICR-MS analytical window (i.e., nonionizable compounds, compounds < 200 m/z) as suggested by the presence of a sharp, intense peak in this region. This region includes protons attached to carbons that are singly bound to an oxygen atom such as ethers, esters, alcohols, and carbohydrates. Carbohydrates are thought to be important components of aerosols produced via bubble bursting [54] but do not ionize efficiently via electrospray ionization. The complexity of aerosol OM limits the ability to identify each of the individual components within the mixture, but 1H NMR provides valuable information regarding the connectivity of the compounds present and because of its complementarity to FTICR-MS we can gather complementary chemical features contained within these complex mixtures. The important and distinguishing features can be observed more clearly with the help of PCA.

3.5. 1H NMR PCA

PCA was performed on the whole 1H NMR spectra for each of the aerosol WSOM extracts, similar to previous studies [6,7,82]. The initial PCA results indicate that the marine aerosols are significantly different than the mixed source, biomass burning, and urban aerosols and inclusion of the marine aerosols does not adequately explain the variance between the three terrestrial sources (Figure 5a). The main differences include the fact that the marine aerosols contain a few sharp peaks (e.g., methanesulfonic acid at 2.7 ppm, and acetate at 1.8 ppm), and the other aerosols contain multiple broad signals throughout each spectrum. The PCA was evaluated a second time using only the mixed source, biomass burning, and urban aerosols, and key differences among those sources are discussed further. The key features of marine aerosol WSOM that distinguish them from continentally-influenced air masses have been discussed at length in previous studies [6,7]. Briefly, the marine aerosols differ from those influenced by the North American continent in that the marine aerosols have more saturated aliphatic chains and are less structurally diverse.
The first two principal components (PC1 and PC2) explain more than 80% of the variance between the mixed source, biomass burning, and urban aerosol WSOM (Figure 5b). The urban aerosols have lower PC1 scores than the mixed source and biomass burning aerosols, the biomass burning aerosols have lower PC2 scores than the urban and mixed source aerosols, and the mixed source aerosols do not have unique PC values (Figure 5b). Thus, PC1 shows the spectral characteristics that differentiate the urban aerosols from the biomass burning and mixed source aerosols, and PC2 shows the spectral characteristics that differentiate the biomass burning aerosols from the other aerosols.
The most intense peak in the variable loadings plot for PC1 (Figure 6a) is positive and represents a CH2 group (1.2 ppm), suggesting that alkyl chain length is important in distinguishing aerosol emission sources. The CH2 peak in the mixed source and biomass burning aerosols is more narrow than in the urban aerosols, so the positive peak in the PC1 loadings may be indicative of shorter alkyl chains (i.e., less variability). A splitting of the CH3 peak (0.9 ppm) is observed, and the negative peak is more downfield than the positive peak. This splitting suggests that the urban aerosols (represented by negative PC1 variable loadings) contain terminal methyl groups in closer proximity to polar functional groups, which is supported by the presence of broad peaks in the region where polar functional groups appear (1.8–3.2 ppm). Another intense positive peak is found around 2.1 ppm, which can represent hydrogen bound to a carbon α to a carbonyl group (Figure 6a). There is an intense peak in this area in each of the whole sample spectra, but the width of the peaks vary (Figure 4) indicating varying structural diversity of similar functional groups. This peak is sharper in the mixed source and biomass burning aerosols, and broad in the urban aerosols. In fact, the edges of the peak at 2.1 ppm can be found as negative peaks in PC1 indicating that the broadness of that peak is characteristic of the urban aerosols. While protons bound to carbon adjacent to a carbonyl group are widespread among the aerosols as indicated by a strong signal around 2.1 ppm in each 1H NMR spectrum, the urban aerosols contain protons that are in more diverse chemical environments.
The variable loadings plot for PC2 (Figure 6b) shows the spectral characteristics important to the biomass burning aerosols. A broad negative peak in the aromatic region (6–9 ppm) is apparent, and is equivalent to the aromatic signal observed in the individual spectra of the biomass burning aerosols. Peaks consistent with levoglucosan (3.36, 3.52, 3.75, and 3.93 ppm) [15] are identified in the negative PC2 loadings, indicating that they are important in distinguishing the biomass burning aerosols from the other source. Levoglucosan is a common product of the combustion of cellulose material and is widely used as a tracer compound for biomass burning aerosols [83]. Levoglucosan does produce additional 1H NMR peaks, but they are obscured by the water-suppression pulse program due to their proximity to the peak generated by water (~4.7 ppm). A slight negative peak at 2.3 ppm is consistent with hydrogen attached to nitrogen. The peak is broad indicating that there are many compounds with the same functional group attached to varying carbon structures. Without standards, it cannot be confirmed that this peak represents amino groups, but the large number of CHON formulas identified in the FTICR mass spectra supports the presence of a diverse suite of N-containing OM in the biomass burning aerosols. Positive peaks in the aliphatic region (0.8–1.5 ppm) and at 1.8 ppm representing acetate or acetic acid demonstrate that the higher PC2 scores for the urban and mixed source aerosols have a more oxygenated and aliphatic WSOM composition.
Overall, there is good consistency and complementarity between the 1H NMR and FTICR-MS techniques. Both techniques identify aromatic compounds and nitrogen-containing compounds that are not extensively oxidized as important for distinguishing the OM from biomass burning aerosols from the other sources. The lower degree of oxidation in the OM found in the biomass burning and also the marine aerosols suggests that these aerosols are collected close to their source and/or have not been exposed to conditions that promote extensive oxidative or oligomeric transformations. The urban aerosols are characteristically more polar as indicated by 1H NMR peaks that are shifted more slightly downfield than in the other aerosols and also the higher O/C ratios of the formulas, with more structurally diverse carbon chains. This structural diversity may be represented by longer and/or more branched carbon chains indicative of more oligomeric or other chain elongation reactions. While some of these features were readily apparent, the PCA was able to highlight and confirm some of these variations.
The combination of 1H NMR and FTICR-MS provides an incredible amount of molecular-level information regarding the chemical composition of aerosol OM. While 1H NMR overcomes some of the bias introduced by ESI-FTICR-MS, it comes with its own limitations. The 1H NMR analysis used here requires a liquid sample, so the water-insoluble OM is not analyzed by this method. Solid-state NMR techniques that analyze a whole solid sample do exist but require very large samples that require extremely large sample volumes which typically can only be obtained over weeks of sampling. Additionally, the water-suppression removes all signal in the region of 4.7 ppm and may reduce the signal in the region within ±0.5 ppm including protons directly attached to carbon-carbon double bonds (H-C=C) which are typically found around 5 ppm.

4. Conclusions

The 1H NMR and FTICR-MS results described here, while not fully quantitative in nature, provide detailed, source-specific distinguishing characteristics of the water- and pyridine- extractable and ionizable components of marine, urban, biomass burning, and mixed source OA. PCA efficiently highlights the molecular formulas and 1H NMR structural components that distinguish the OM contained within aerosols from each of these sources. Marine aerosols contain molecules consistent with biological inputs including lipid- and phospholipid-like compounds as well as a large fraction of low O/C ratio organosulfur compounds, likely derived from reactions with sulfate derived from biological dimethyl sulfide emissions. The carbon backbones of these molecules are more aliphatic and less diverse than terrestrial OA, and the OM is overall less oxidized. The OM in biomass burning aerosols has more aromatic character and less oxygen content than the other OA groups. Aromatic, nitrogen containing compounds are a defining feature of biomass burning aerosols, and nitrogen-incorporation reactions play a major role in the formation or transformation of these aerosols. The urban aerosols are also characteristically more oxygenated and more structurally complex, suggesting they have been subject to more extensive atmospheric aging. Nitrogen-containing formulas of lesser aromaticity than described for the biomass burning OA are an important feature of urban aerosols. These compounds likely reflect the prevalence of OA transformations that incorporate inorganic NOx, either through NOx additions to aliphatic/olefinic compounds or ring-opening reactions of biomass burning OA. The combined results of the FTICR-MS and 1H NMR PCAs show the mixed source OA to be very similar to but less chemically diverse than the urban aerosols.
These defining OA molecular features can be used in future work to provide clues to the primary inputs and degree of atmospheric transformation. In environments impacted by multiple emission sources, these molecular features can help identify key sources. Further, as the relationships between molecular composition and atmospheric impacts (e.g., hygroscopicity, ice and cloud condensation formation, light absorption) and environmental fates (e.g., photochemical and microbial lability, metal complexing ability) are strengthened, these source-specific molecular characteristics can be used to partition the relative importance of each of these emission sources to these impacts and fates. The highly aliphatic nature of and biological source for the marine aerosols suggests them to be highly susceptible to microbial components, while the aromatic nature of biomass burning OA are likely to be less microbially labile and more susceptible to photodegradation. Though the exact relationship is yet to be fully understood, the extent of oxidation is associated with hygroscopicity and the ability of aerosols to act as cloud condensation nuclei, and the high O/C content of urban and mixed source aerosols present them as high hygroscopic candidates. The additional molecular formula and structural details provided here may help understand deviations from the expected O/C ratio—hygroscopic behavior relationship. The highly aromatic, nitrogen compounds are likely an important component of atmospheric brown carbon, which makes a significant contribution to light-absorbing carbon in the atmosphere. Any extensive light absorption found for other source components may be due to higher amounts of inorganic components or olefinic or non-ionizable OA.
Aerosol FTICR-MS and 1H NMR analyses provide a complementary set of information regarding OA chemical composition, and PCA provides a useful tool for deconstructing the important components that define each of the aerosol sources. While this study presents several aerosols from some key sources, application of this method to a larger number of samples from more emission sources are needed for a more comprehensive inventory of atmospherically-relevant OA. Additionally, pairing these analysis with highly time-resolved methods, such as aerosol mass spectrometry, would provide an excellent accounting of the inorganic ions and volatile OM that influence aerosol atmospheric and environmental impacts and fates.

Supplementary Materials

The following are available online at https://www.mdpi.com/2073-4433/7/6/79/s1,
  • Supplementary methods.
  • Table S1: Percent area contributions from the major proton regions and calculated H/C ratios in 1H NMR spectra for aerosol PSOM.
  • Table S2: Total formulas and average elemental properties for aerosol WSOMPPL and PSOM from each emission source determined using FTICR mass spectra. The distribution of molecular formulas based on atomic content and AImod structure type are listed as number of formulas with the percentage of total formulas in parentheses directly below.
  • Table S3: Total formulas and average elemental properties for aerosol WSOM−, WSOM+, and PSOM− from each emission source determined using FTICR-MS. Atomic content and structure type values are expressed as the number of formulas. The values in parentheses are the percentage of total molecular formulas in each sample, an average for each source.
  • Table S4: Total formulas and average elemental properties for aerosol WSOM−, WSOM+, and PSOM from each emission source identified by PCA. Distributions of formulas based on atomic content and AImod structure type are listed as percentage of total formulas.
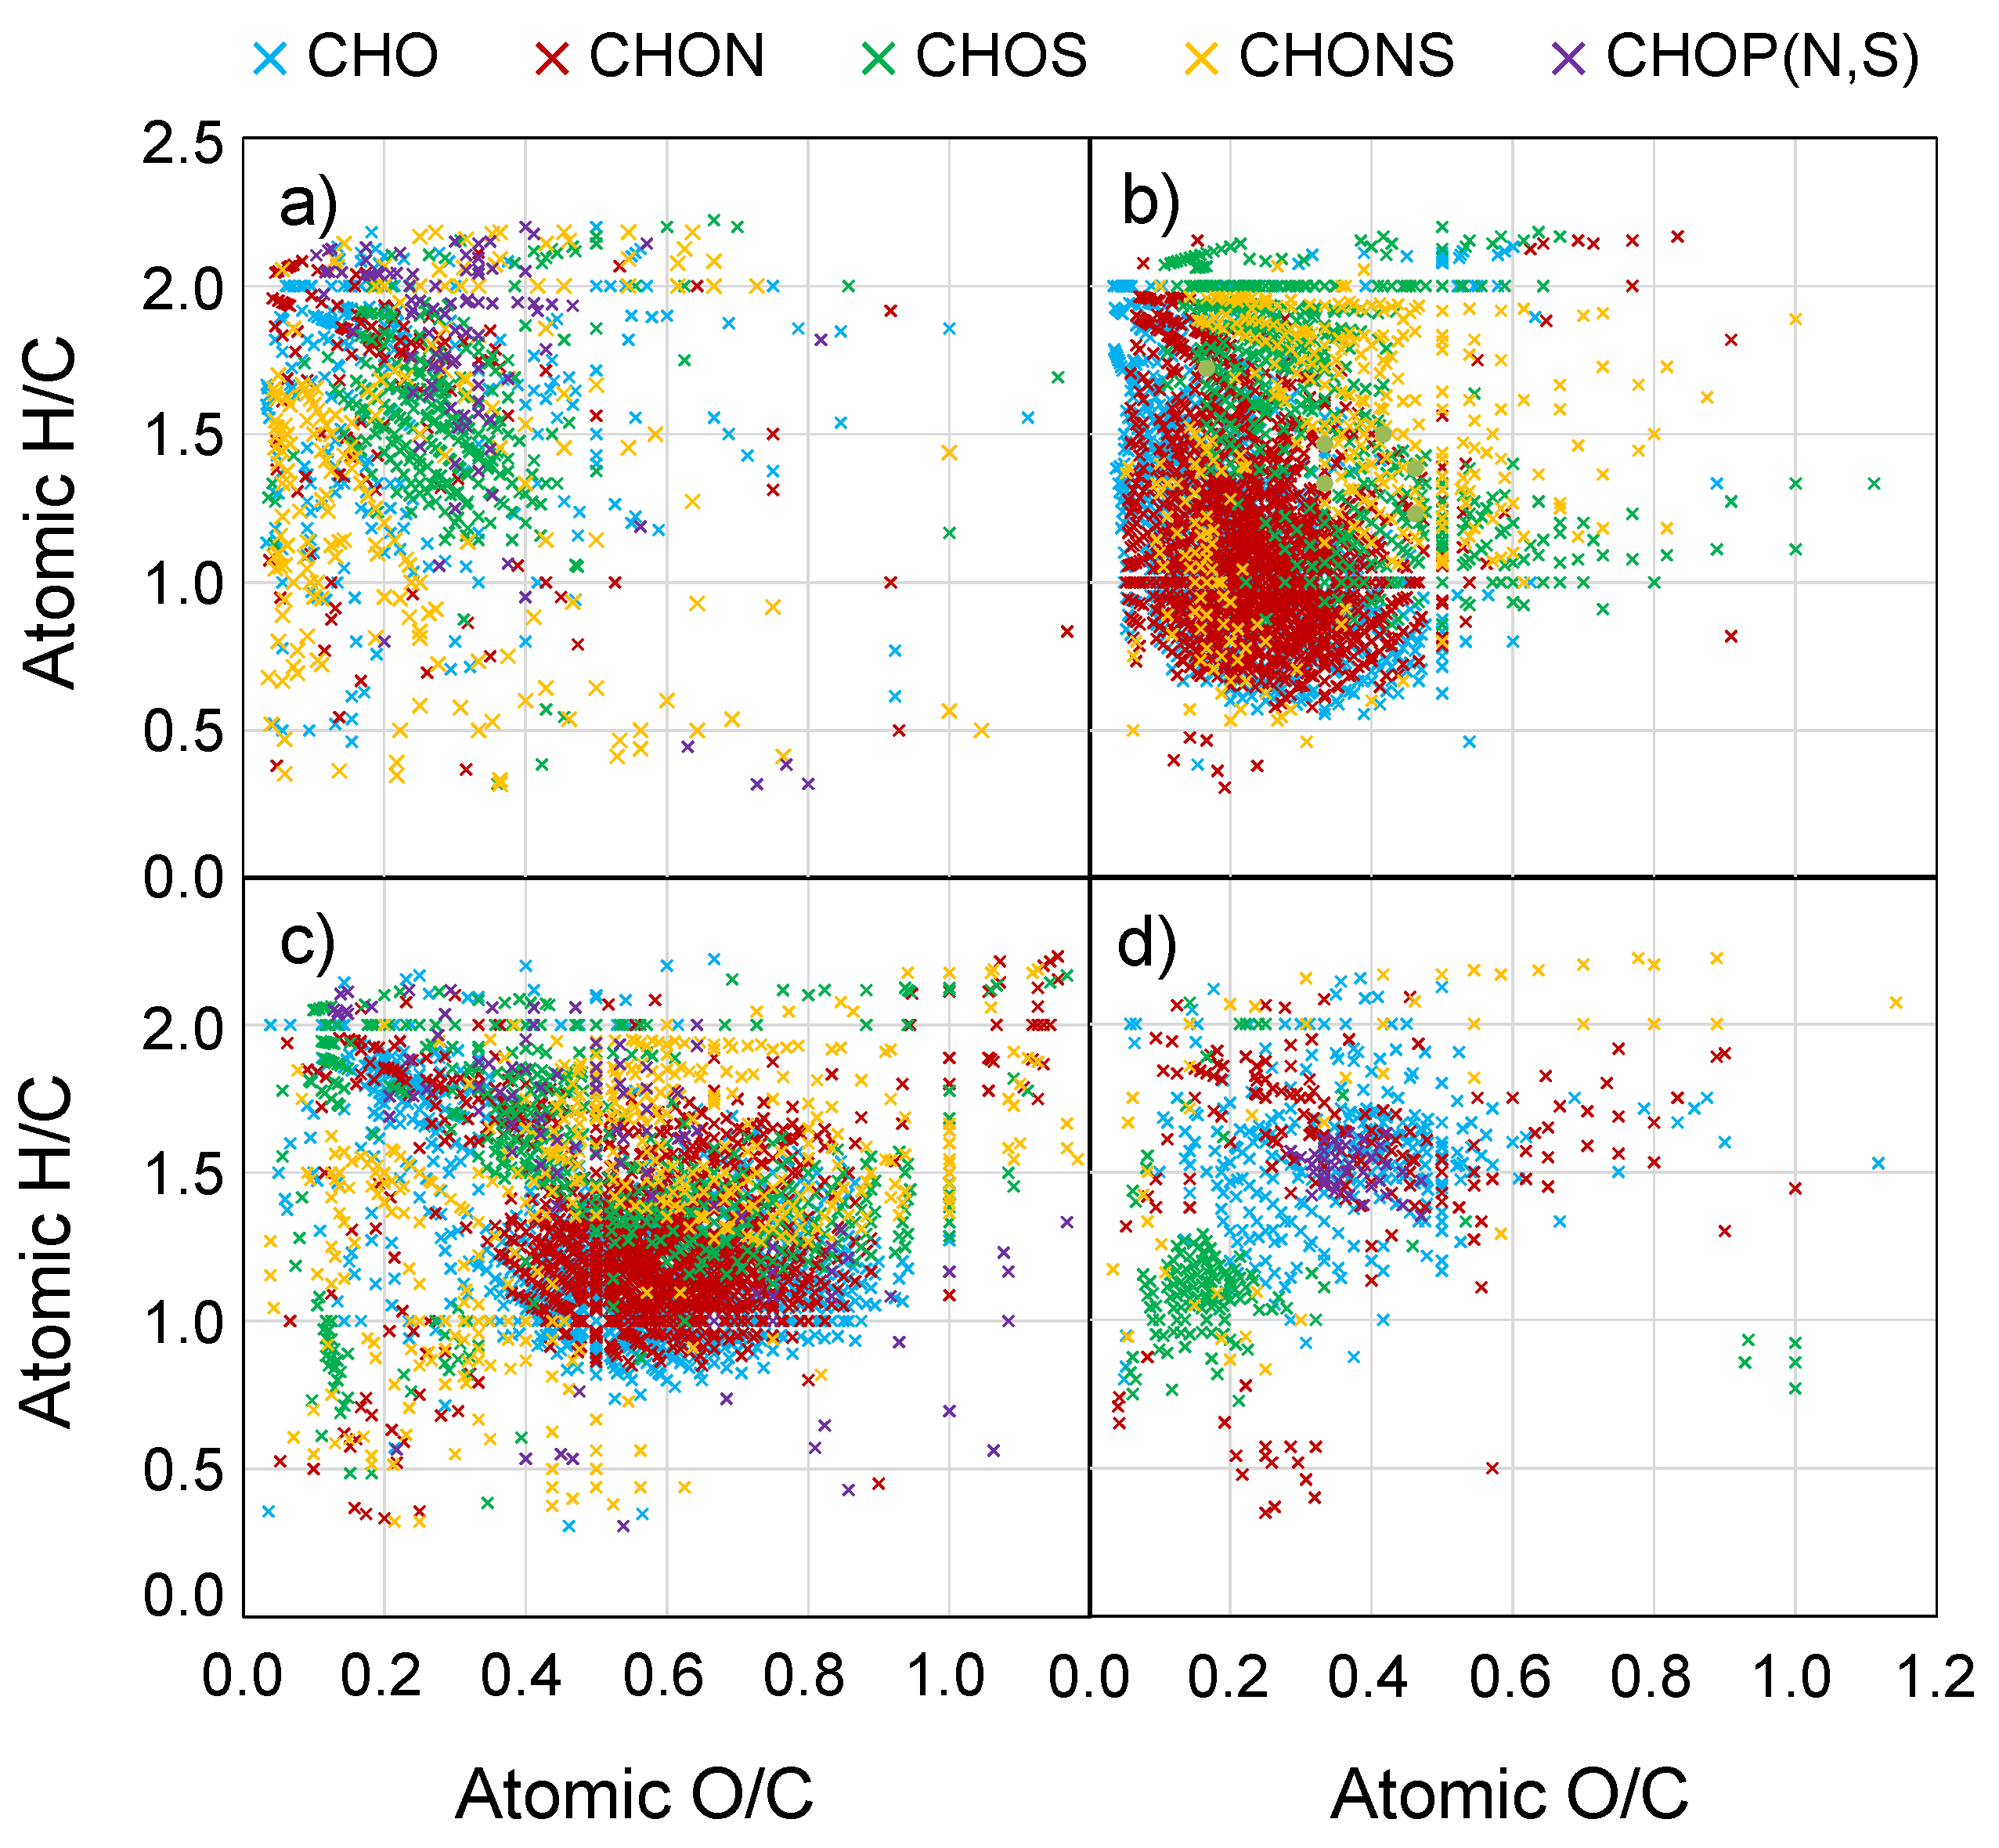
  • Figure S1: Van Krevelen diagrams for molecular formulas identified in the FTICR mass spectra for the marine, biomass burning, urban, and mixed source aerosols. Each row represents a different source, and each column represents only those formulas with a specific elemental makeup (CHO, CHON, or CHOS). Each “×” represents one or more molecular formulas.
  • Figure S2: The loadings for (a) PC1 and PC2 and (b) PC1 and PC3 from the PCA analysis of the FTICR-MS molecular formulas.
  • Figure S3: Venn diagrams showing the relative distribution of PCA molecular formulas present in any of the three solvent/ionization methods (WSOM−, WSOM+, and PSOM) for each aerosol source. Areas of overlap represent percentages of molecular formulas that appear in two or more of those samples. Areas with no overlap represent the percentage of molecular formulas unique to that individual solvent/ionization method.

Acknowledgments

This work was funded by the Frank Batten Endowment to Patrick Hatcher. Amanda Willoughby was supported by a US EPA STAR graduate fellowship program (Grant: FP 91736001). The EPA has not officially endorsed this publication and the views expressed herein may not reflect the views of the EPA. The authors thank Peter DeCarlo and Anita Johnson at Drexel University for assistance in the collection of the urban aerosol samples, Siddhartha Mitra for BC analyses, and Susan Hatcher and Jared Callan of the COSMIC facility at Old Dominion University for assistance with the FTICR-MS. We thank the crew of the R/V Knorr for assistance in collecting the marine samples and William Landing for sharing the GEOTRACES marine samples collected as part of NSF grants OCE-0752351, 0929919, and 1132766. Any opinions, findings, and conclusions or recommendations expressed in this material are those of the authors and do not necessarily reflect the views of the National Science Foundation. Finally, we thank two anonymous reviewers for their valuable suggestions that have improved this manuscript.

Author Contributions

All authors conceived and designed the experiments; Amanda Willoughby performed the experiments; Amanda Willoughby and Andrew Wozniak analyzed the data; Patrick Hatcher contributed reagents/materials/analysis tools; Amanda Willoughby and Andrew Wozniak wrote the paper.

Conflicts of Interest

The authors declare no conflict of interest.

Abbreviations

The following abbreviations are used in this manuscript:
AImodmodified aromaticity index
BCblack carbon
CTO-375chemothermal oxidation at 375 °C
ESIelectrospray ionization
FTICR-MSFourier transform ion cyclotron resonance mass spectrometry
H/Chydrogen-to-carbon atomic ratio
1H NMRproton nuclear magnetic resonance spectroscopy
NMRnuclear magnetic resonance spectroscopy
O/Coxygen-to-carbon atomic ratio
OAorganic aerosols
OMorganic matter
PCprincipal component
PCAprincipal component analysis
PPLsolid phase extraction medium
PSOCpyridine-soluble organic carbon
PSOMpyridine-soluble organic matter
SOAsecondary organic aerosol
TCtotal carbon
TSPtotal suspended particulates
UHR-MSultrahigh resolution mass spectrometry
WSOCwater-soluble organic carbon
WSOMwater-soluble organic matter
WSOMPPLPPL-extracted water-soluble organic matter

References

  1. Jimenez, J.L.; Canagaratna, M.R.; Donahue, N.M.; Prevot, A.S.H.; Zhang, Q.; Kroll, J.H.; DeCarlo, P.F.; Allan, J.D.; Coe, H.; Ng, N.L.; et al. Evolution of organic aerosols in the atmosphere. Science 2009, 326, 1525–1529. [Google Scholar] [CrossRef] [PubMed]
  2. Kanakidou, M.; Seinfeld, J.; Pandis, S.; Barnes, I.; Dentener, F.; Facchini, M.; Van Dingenen, R.; Ervens, B.; Nenes, A.; Nielsen, C.; et al. Organic aerosol and global climate modelling: A review. Atmos. Chem. Phys. 2005, 5, 1053–1123. [Google Scholar] [CrossRef]
  3. Chan, M.N.; Choi, M.Y.; Ng, N.L.; Chan, C.K. Hygroscopicity of water-soluble organic compounds in atmospheric aerosols: Amino acids and biomass burning derived organic species. Environ. Sci. Technol. 2005, 39, 1555–1562. [Google Scholar] [CrossRef] [PubMed]
  4. Cerully, K.; Bougiatioti, A.; Hite, J., Jr.; Guo, H.; Xu, L.; Ng, N.; Weber, R.; Nenes, A. On the link between hygroscopicity, volatility, and oxidation state of ambient and water-soluble aerosols in the southeastern united states. Atmos. Chem. Phys. 2015, 15, 8679–8694. [Google Scholar] [CrossRef]
  5. Andreae, M.O.; Gelencsér, A. Black carbon or brown carbon? The nature of light-absorbing carbonaceous aerosols. Atmos. Chem. Phys. 2006, 6, 3131–3148. [Google Scholar] [CrossRef]
  6. Wozniak, A.S.; Shelley, R.U.; Sleighter, R.L.; Abdulla, H.A.; Morton, P.L.; Landing, W.M.; Hatcher, P.G. Relationships among aerosol water soluble organic matter, iron and aluminum in European, North African, and marine air masses from the 2010 US GEOTRACES cruise. Mar. Chem. 2013, 54, 557–898. [Google Scholar] [CrossRef]
  7. Wozniak, A.S.; Shelley, R.U.; McElhenie, S.D.; Landing, W.M.; Hatcher, P.G. Aerosol water soluble organic matter characteristics over the North Atlantic Ocean: Implications for iron-binding ligands and iron solubility. Mar. Chem. 2015, 173, 162–172. [Google Scholar] [CrossRef]
  8. Samburova, V.; Szidat, S.; Hueglin, C.; Fisseha, R.; Baltensperger, U.; Zenobi, R.; Kalberer, M. Seasonal variation of high-molecular-weight compounds in the water-soluble fraction of organic urban aerosols. J. Geophys. Res. Atmos. 2005, 110. [Google Scholar] [CrossRef]
  9. Takegawa, N.; Miyakawa, T.; Kondo, Y.; Jimenez, J.L.; Zhang, Q.; Worsnop, D.R.; Fukuda, M. Seasonal and diurnal variations of submicron organic aerosol in Tokyo observed using the Aerodyne aerosol mass spectrometer. J. Geophys. Res. Atmos. 2006, 111. [Google Scholar] [CrossRef]
  10. Baduel, C.; Voisin, D.; Jaffrezo, J. Seasonal variations of concentrations and optical properties of water soluble HULIS collected in urban environments. Atmos. Chem. Phys. 2010, 10, 4085–4095. [Google Scholar] [CrossRef] [Green Version]
  11. Alves, C.; Vicente, A.; Pio, C.; Kiss, G.; Hoffer, A.; Decesari, S.; Prevôt, A.S.H.; Cruz Minguillón, M.; Querol, X.; Hillamo, R. Organic compounds in aerosols from selected European sites—Biogenic versus anthropogenic sources. Atmos. Environ. 2012, 59, 243–255. [Google Scholar] [CrossRef]
  12. Kieber, R.J.; Adams, M.B.; Willey, J.D.; Whitehead, R.F.; Avery, G.B.; Mullaugh, K.M.; Mead, R.N. Short term temporal variability in the photochemically mediated alteration of chromophoric dissolved organic matter (CDOM) in rainwater. Atmos. Environ. 2012, 50, 112–119. [Google Scholar] [CrossRef]
  13. Chalbot, M.G.; Kavouras, I.G. Nuclear magnetic resonance spectroscopy for determining the functional content of organic aerosols: A review. Environ. Pollut. 2014, 191, 232–249. [Google Scholar] [CrossRef] [PubMed]
  14. Duarte, R.M.; Freire, S.M.; Duarte, A.C. Investigating the water-soluble organic functionality of urban aerosols using two-dimensional correlation of solid-state 13C NMR and FTIR spectral data. Atmos. Environ. 2015, 116, 245–252. [Google Scholar] [CrossRef]
  15. Decesari, S.; Facchini, M.; Matta, E.; Lettini, F.; Mircea, M.; Fuzzi, S.; Tagliavini, E.; Putaud, J. Chemical features and seasonal variation of fine aerosol water-soluble organic compounds in the Po Valley, Italy. Atmos. Environ. 2001, 35, 3691–3699. [Google Scholar] [CrossRef]
  16. Moretti, F.; Tagliavini, E.; Decesari, S.; Facchini, M.; Rinaldi, M.; Fuzzi, S. NMR determination of total carbonyls and carboxyls: A tool for tracing the evolution of atmospheric oxidized organic aerosols. Environ. Sci. Technol. 2008, 42, 4844–4849. [Google Scholar] [CrossRef] [PubMed]
  17. Schmitt-Kopplin, P.; Gelencser, A.; Dabek-Zlotorzynska, E.; Kiss, G.; Hertkorn, N.; Harir, M.; Hong, Y.; Gebefugi, I. Analysis of the unresolved organic fraction in atmospheric aerosols with ultrahigh-resolution mass spectrometry and nuclear magnetic resonance spectroscopy: Organosulfates as photochemical smog constituents. Anal. Chem. 2010, 82, 8017–8026. [Google Scholar] [CrossRef] [PubMed]
  18. Shakya, K.M.; Place, P.F.; Griffin, R.J.; Talbot, R.W. Carbonaceous content and water-soluble organic functionality of atmospheric aerosols at a semi-rural New England location. J. Geophys. Res. Atmos. 2012, 117, D03301. [Google Scholar] [CrossRef]
  19. Altieri, K.E.; Seitzinger, S.P.; Carlton, A.G.; Turpin, B.J.; Klein, G.C.; Marshall, A.G. Oligomers formed through in-cloud methylglyoxal reactions: Chemical composition, properties, and mechanisms investigated by ultra-high resolution FT-ICR mass spectrometry. Atmos. Environ. 2008, 42, 1476–1490. [Google Scholar] [CrossRef]
  20. Wozniak, A.; Bauer, J.; Sleighter, R.; Dickhut, R.; Hatcher, P. Technical note: Molecular characterization of aerosol-derived water soluble organic carbon using ultrahigh resolution electrospray ionization fourier transform ion cyclotron resonance mass spectrometry. Atmos. Chem. Phys. 2008, 8, 5099–5111. [Google Scholar] [CrossRef]
  21. Heaton, K.J.; Sleighter, R.L.; Hatcher, P.G.; Hall, W.A., IV; Johnston, M.V. Composition domains in monoterpene secondary organic aerosol. Environ. Sci. Technol. 2009, 43, 6950–6955. [Google Scholar]
  22. Laskin, J.; Laskin, A.; Roach, P.; Slysz, G.; Anderson, G.; Nizkorodov, S.; Bones, D.; Nguyen, L. High-resolution desorption electrospray ionization mass spectrometry for chemical characterization of organic aerosols. Anal. Chem. 2010, 82, 2048–2058. [Google Scholar] [CrossRef] [PubMed]
  23. Mazzoleni, L.; Ehrmann, B.; Shen, X.; Marshall, A.; Collett, J., Jr. Water-soluble atmospheric organic matter in fog: Exact masses and chemical formula identification by ultrahigh-resolution Fourier transform ion cyclotron resonance mass spectrometry. Environ. Sci. Technol. 2010, 44, 3690–3697. [Google Scholar] [CrossRef] [PubMed]
  24. Nguyen, T.; Bateman, A.; Bones, D.; Nizkorodov, S.; Laskin, J.; Laskin, A. High-resolution mass spectrometry analysis of secondary organic aerosol generated by ozonolysis of isoprene. Atmos. Environ. 2010, 44, 1032–1042. [Google Scholar] [CrossRef]
  25. LeClair, J.P.; Collett, J.L.; Mazzoleni, L.R. Fragmentation analysis of water-soluble atmospheric organic matter using ultrahigh-resolution FT-ICR mass spectrometry. Environ. Sci. Technol. 2012, 46, 4312–4322. [Google Scholar] [CrossRef] [PubMed]
  26. Mazzoleni, L.R.; Saranjampour, P.; Dalbec, M.M.; Samburova, V.; Hallar, A.G.; Zielinska, B.; Lowenthal, D.H.; Kohl, S. Identification of water-soluble organic carbon in non-urban aerosols using ultrahigh-resolution FT-ICR mass spectrometry: Organic anions. Environ. Chem. 2012, 9, 285–297. [Google Scholar] [CrossRef]
  27. Mead, R.; Mullaugh, K.; Brooks Avery, G.; Kieber, R.; Willey, J.; Podgorski, D. Insights into dissolved organic matter complexity in rainwater from continental and coastal storms by ultrahigh resolution Fourier transform ion cyclotron resonance mass spectrometry. Atmos. Chem. Phys. 2013, 13, 4829–4838. [Google Scholar] [CrossRef]
  28. Mitra, S.; Wozniak, A.S.; Miller, R.; Hatcher, P.G.; Buonassissi, C.; Brown, M. Multiproxy probing of rainwater dissolved organic matter (DOM) composition in coastal storms as a function of trajectory. Mar. Chem. 2013, 154, 67–76. [Google Scholar] [CrossRef]
  29. Kourtchev, I.; Fuller, S.J.; Giorio, C.; Healy, R.M.; Wilson, E.; O’Connor, I.; Wenger, J.C.; McLeod, M.; Aalto, J.; Ruuskanen, T.M. Molecular composition of biogenic secondary organic aerosols using ultrahigh-resolution mass spectrometry: Comparing laboratory and field studies. Atmos. Chem. Phys. 2014, 14, 2155–2167. [Google Scholar] [CrossRef] [Green Version]
  30. Willoughby, A.S.; Wozniak, A.S.; Hatcher, P.G. A molecular-level approach for characterizing water-insoluble components of ambient organic aerosol particulates using ultrahigh-resolution mass spectrometry. Atmos. Chem. Phys. 2014, 14, 10299–10314. [Google Scholar] [CrossRef]
  31. Wozniak, A.S.; Willoughby, A.S.; Gurganus, S.C.; Hatcher, P.G. Distinguishing molecular characteristics of aerosol water soluble organic matter from the 2011 Trans-North Atlantic US GEOTRACES cruise. Atmos. Chem. Phys. 2014, 14, 8419–8434. [Google Scholar] [CrossRef]
  32. Kourtchev, I.; Doussin, J.-F.; Giorio, C.; Mahon, B.; Wilson, E.; Maurin, N.; Pangui, E.; Venables, D.; Wenger, J.; Kalberer, M. Molecular composition of fresh and aged secondary organic aerosol from a mixture of biogenic volatile compounds: A high-resolution mass spectrometry study. Atmos. Chem. Phys. 2015, 15, 5683–5695. [Google Scholar] [CrossRef]
  33. Reinhardt, A.; Emmenegger, C.; Gerrits, B.; Panse, C.; Dommen, J.; Baltensperger, U.; Zenobi, R.; Kalberer, M. Ultrahigh mass resolution and accurate mass measurements as a tool to characterize oligomers in secondary organic aerosols. Anal. Chem. 2007, 79, 4074–4082. [Google Scholar] [CrossRef] [PubMed]
  34. Geotraces: An international study of the marine biogeochemical cycles of trace elements and their isotopes. Available online: http://www.geotraces.org/ (accessed on 1 June 2016).
  35. National Oceanic and Atmospheric Administration: Pacific Marine Environmental Laboratory. WACS2 (2014) Western Atlantic Climate Study. Available online: http://saga.pmel.noaa.gov/field_WACS2 (accessed on 1 June 2016).
  36. Gustafsson, Ö.; Haghseta, F.; Chan, C.; MacFarlane, J.; Gschwend, P. Quantification of the dilute sedimentary soot phase: Implications for pah speciation and bioavailability. Environ. Sci. Technol. 1997, 31, 203–209. [Google Scholar] [CrossRef]
  37. Dittmar, T.; Koch, B.; Hertkorn, N.; Kattner, G. A simple and efficient method for the solid-phase extraction of dissolved organic matter (SPE-DOM) from seawater. Limnol. Oceanogr. Methods 2008, 6, 230–235. [Google Scholar] [CrossRef]
  38. Sleighter, R.; McKee, G.; Liu, Z.; Hatcher, P. Naturally present fatty acids as internal calibrants for Fourier transform mass spectra of dissolved organic matter. Limnol. Oceanogr. Methods 2008, 6, 246–253. [Google Scholar] [CrossRef]
  39. Stubbins, A.; Spencer, R.G.M.; Chen, H.; Hatcher, P.G.; Mopper, K.; Hernes, P.J.; Mwamba, V.L.; Mangangu, A.M.; Wabakanghanzi, J.N.; Six, J. Illuminated darkness: Molecular signatures of Congo River dissolved organic matter and its photochemical alteration as revealed by ultrahigh precision mass spectrometry. Limnol. Oceanogr. 2010, 55, 1467–1477. [Google Scholar] [CrossRef]
  40. Sleighter, R.; Liu, Z.; Xue, J.; Hatcher, P. Multivariate statistical approaches for the characterization of dissolved organic matter analyzed by ultrahigh resolution mass spectrometry. Environ. Sci. Technol. 2010, 44, 7576–7582. [Google Scholar] [CrossRef] [PubMed]
  41. Gurganus, S.C.; Wozniak, A.S.; Hatcher, P.G. Molecular characteristics of the water soluble organic matter in size-fractionated aerosols collected over the North Atlantic Ocean. Mar. Chem. 2015, 170, 37–48. [Google Scholar] [CrossRef]
  42. Hammes, K.; Schmidt, M.W.; Smernik, R.J.; Currie, L.A.; Ball, W.P.; Nguyen, T.H.; Louchouarn, P.; Houel, S.; Gustafsson, Ö.; Elmquist, M. Comparison of quantification methods to measure fire-derived (black/elemental) carbon in soils and sediments using reference materials from soil, water, sediment and the atmosphere. Glob. Biogeochem. Cycles 2007, 21. [Google Scholar] [CrossRef] [Green Version]
  43. Heald, C.; Kroll, J.; Jimenez, J.; Docherty, K.; DeCarlo, P.; Aiken, A.; Chen, Q.; Martin, S.; Farmer, D.; Artaxo, P. A simplified description of the evolution of organic aerosol composition in the atmosphere. Geophys. Res. Lett. 2010, 37. [Google Scholar] [CrossRef]
  44. Kroll, J.H.; Donahue, N.M.; Jimenez, J.L.; Kessler, S.H.; Canagaratna, M.R.; Wilson, K.R.; Altieri, K.E.; Mazzoleni, L.R.; Wozniak, A.S.; Bluhm, H. Carbon oxidation state as a metric for describing the chemistry of atmospheric organic aerosol. Nat. Chem. 2011, 3, 133–139. [Google Scholar] [CrossRef] [PubMed]
  45. Zhang, Q.; Alfarra, M.R.; Worsnop, D.R.; Allan, J.D.; Coe, H.; Canagaratna, M.R.; Jimenez, J.L. Deconvolution and quantification of hydrocarbon-like and oxygenated organic aerosols based on aerosol mass spectrometry. Environ. Sci. Technol. 2005, 39, 4938–4952. [Google Scholar] [CrossRef] [PubMed]
  46. Aiken, A.C.; Decarlo, P.F.; Kroll, J.H.; Worsnop, D.R.; Huffman, J.A.; Docherty, K.S.; Ulbrich, I.M.; Mohr, C.; Kimmel, J.R.; Sueper, D. O/C and OM/OC ratios of primary, secondary, and ambient organic aerosols with high-resolution time-of-flight aerosol mass spectrometry. Environ. Sci. Technol. 2008, 42, 4478–4485. [Google Scholar] [CrossRef] [PubMed]
  47. Koch, B.; Dittmar, T. From mass to structure: An aromaticity index for high-resolution mass data of natural organic matter. Rapid Commun. Mass Spectrom. 2006, 20, 926–932. [Google Scholar] [CrossRef] [Green Version]
  48. Claeys, M.; Wang, W.; Vermeylen, R.; Kourtchev, I.; Chi, X.; Farhat, Y.; Surratt, J.D.; Gómez-González, Y.; Sciare, J.; Maenhaut, W. Chemical characterisation of marine aerosol at Amsterdam Island during the austral summer of 2006–2007. J. Aerosol Sci. 2010, 41, 13–22. [Google Scholar] [CrossRef]
  49. Hawkins, L.; Russell, L.; Covert, D.; Quinn, P.; Bates, T. Carboxylic acids, sulfates, and organosulfates in processed continental organic aerosol over the southeast Pacific Ocean during VOCALS-REX 2008. J. Geophys. Res. 2010, 115. [Google Scholar] [CrossRef]
  50. Iinuma, Y.; Müller, C.; Berndt, T.; Böge, O.; Claeys, M.; Herrmann, H. Evidence for the existence of organosulfates from β-pinene ozonolysis in ambient secondary organic aerosol. Environ. Sci. Technol. 2007, 41, 6678–6683. [Google Scholar] [CrossRef] [PubMed]
  51. Minerath, E.C.; Casale, M.T.; Elrod, M.J. Kinetics feasibility study of alcohol sulfate esterification reactions in tropospheric aerosols. Environ. Sci. Technol. 2008, 42, 4410–4415. [Google Scholar] [CrossRef] [PubMed]
  52. Minerath, E.C.; Elrod, M.J. Assessing the potential for diol and hydroxy sulfate ester formation from the reaction of epoxides in tropospheric aerosols. Environ. Sci. Technol. 2009, 43, 1386–1392. [Google Scholar] [CrossRef] [PubMed]
  53. Kuznetsova, M.; Lee, C.; Aller, J. Characterization of the proteinaceous matter in marine aerosols. Mar. Chem. 2005, 96, 359–377. [Google Scholar] [CrossRef]
  54. Hawkins, L.N.; Russell, L.M. Polysaccharides, proteins, and phytoplankton fragments: Four chemically distinct types of marine primary organic aerosol classified by single particle spectromicroscopy. Adv. Meteorol. 2010, 2010, 1–14. [Google Scholar] [CrossRef]
  55. Russell, P.; Bergstrom, R.; Shinozuka, Y.; Clarke, A.; DeCarlo, P.; Jimenez, J.; Livingston, J.; Redemann, J.; Dubovik, O.; Strawa, A. Absorption angstrom exponent in AERONET and related data as an indicator of aerosol composition. Atmos. Chem. Phys. 2010, 10, 1155–1169. [Google Scholar] [CrossRef]
  56. Surratt, J.D.; Kroll, J.H.; Kleindienst, T.E.; Edney, E.O.; Claeys, M.; Sorooshian, A.; Ng, N.L.; Offenberg, J.H.; Lewandowski, M.; Jaoui, M. Evidence for organosulfates in secondary organic aerosol. Environ. Sci. Technol. 2007, 41, 517–527. [Google Scholar] [CrossRef] [PubMed]
  57. Noziere, B.; Ekström, S.; Alsberg, T.; Holmström, S. Radical-initiated formation of organosulfates and surfactants in atmospheric aerosols. Geophys. Res. Lett. 2010, 37. [Google Scholar] [CrossRef]
  58. McNeill, V.F.; Woo, J.L.; Kim, D.D.; Schwier, A.N.; Wannell, N.J.; Sumner, A.J.; Barakat, J.M. Aqueous-phase secondary organic aerosol and organosulfate formation in atmospheric aerosols: A modeling study. Environ. Sci. Technol. 2012, 46, 8075–8081. [Google Scholar] [CrossRef] [PubMed]
  59. Cullis, C.; Hirschler, M. Atmospheric sulphur: Natural and man-made sources. Atmos. Environ. 1980, 14, 1263–1278. [Google Scholar] [CrossRef]
  60. Möller, D. Estimation of the global man-made sulphur emission. Atmos. Environ. 1984, 18, 19–27. [Google Scholar] [CrossRef]
  61. Andreae, M.O. Dimethylsulfoxide in marine and freshwaters. Limnol. Oceanogr. 1980, 25, 1054–1063. [Google Scholar] [CrossRef]
  62. Masiello, C. New directions in black carbon organic geochemistry. Mar. Chem. 2004, 92, 201–213. [Google Scholar] [CrossRef]
  63. Decesari, S.; Facchini, M.; Matta, E.; Mircea, M.; Fuzzi, S.; Chughtai, A.; Smith, D. Water soluble organic compounds formed by oxidation of soot. Atmos. Environ. 2002, 36, 1827–1832. [Google Scholar] [CrossRef]
  64. Kamegawa, K.; Nishikubo, K.; Kodama, M.; Adachi, Y.; Yoshida, H. Oxidative degradation of carbon blacks with nitric acid II. Formation of water-soluble polynuclear aromatic compounds. Carbon 2002, 40, 1447–1455. [Google Scholar] [CrossRef]
  65. Wagner, S.; Dittmar, T.; Jaffé, R. Molecular characterization of dissolved black nitrogen via electrospray ionization Fourier transform ion cyclotron resonance mass spectrometry. Org. Geochem. 2015, 79, 21–30. [Google Scholar] [CrossRef]
  66. Goldberg, E. Black Carbon in the Environment: Properties and Distribution; John Wiley and Sons: New York, NY, USA, 1985. [Google Scholar]
  67. Bateman, A.P.; Nizkorodov, S.A.; Laskin, J.; Laskin, A. High-resolution electrospray ionization mass spectrometry analysis of water-soluble organic aerosols collected with a particle into liquid sampler. Anal. Chem. 2010, 82, 8010–8016. [Google Scholar] [CrossRef] [PubMed]
  68. Lee, H.J.; Aiona, P.K.; Laskin, A.; Laskin, J.; Nizkorodov, S.A. Effect of solar radiation on the optical properties and molecular composition of laboratory proxies of atmospheric brown carbon. Environ. Sci. Technol. 2014, 48, 10217–10226. [Google Scholar] [CrossRef] [PubMed]
  69. Washenfelder, R.A.; Attwood, A.R.; Brock, C.A.; Guo, H.; Xu, L.; Weber, R.J.; Ng, N.L.; Allen, H.M.; Ayres, B.R.; Baumann, K. Biomass burning dominates brown carbon absorption in the rural southeastern United States. Geophys. Res. Lett. 2015, 42, 1–12. [Google Scholar] [CrossRef]
  70. Knicker, H.; Almendros, G.; González-Vila, F.J.; Martín, F.; Lüdemann, H.-D. 13C- and 15N-NMR spectroscopic examination of the transformation of organic nitrogen in plant biomass during thermal treatment. Soil Biol. Biochem. 1996, 28, 1053–1060. [Google Scholar] [CrossRef]
  71. Laskin, A.; Smith, J.; Laskin, J. Molecular characterization of nitrogen-containing organic compounds in biomass burning aerosols using high-resolution mass spectrometry. Environ. Sci. Technol. 2009, 43, 3764–3771. [Google Scholar] [CrossRef] [PubMed]
  72. Hertkorn, N.; Benner, R.; Frommberger, M.; Schmitt-Kopplin, P.; Witt, M.; Kaiser, K.; Kettrup, A.; Hedges, J.I. Characterization of a major refractory component of marine dissolved organic matter. Geochim. Cosmochim. Acta 2006, 70, 2990–3010. [Google Scholar] [CrossRef]
  73. Ohno, T.; He, Z.; Sleighter, R.L.; Honeycutt, C.W.; Hatcher, P.G. Ultrahigh resolution mass spectrometry and indicator species analysis to identify marker components of soil-and plant biomass-derived organic matter fractions. Environ. Sci. Technol. 2010, 44, 8594–8600. [Google Scholar] [CrossRef] [PubMed]
  74. Wozniak, A.S.; Bauer, J.E.; Dickhut, R.M. Characteristics of water-soluble organic carbon associated with aerosol particles in the eastern United States. Atmos. Environ. 2012, 46, 181–188. [Google Scholar] [CrossRef]
  75. Altieri, K.E.; Turpin, B.J.; Seitzinger, S.P. Oligomers, organosulfates, and nitrooxy organosulfates in rainwater identified by ultra-high resolution electrospray ionization FT-ICR mass spectrometry. Atmos. Chem. Phys. 2009, 9, 2533–2542. [Google Scholar] [CrossRef]
  76. Surratt, J.D.; Gómez-González, Y.; Chan, A.W.H.; Vermeylen, R.; Shahgholi, M.; Kleindienst, T.E.; Edney, E.O.; Offenberg, J.H.; Lewandowski, M.; Jaoui, M. Organosulfate formation in biogenic secondary organic aerosol. J. Phys. Chem. A 2008, 112, 8345–8378. [Google Scholar] [CrossRef] [PubMed]
  77. Nishioka, M. Aromatic sulfur compounds other than condensed thiophenes in fossil fuels: Enrichment and identification. Energy Fuels 1988, 2, 214–219. [Google Scholar] [CrossRef]
  78. Panda, S.K.; Andersson, J.T.; Schrader, W. Mass-spectrometric analysis of complex volatile and nonvolatile crude oil components: A challenge. Anal. Bioanal. Chem. 2007, 389, 1329–1339. [Google Scholar] [CrossRef] [PubMed]
  79. Anderson, L.; Faul, K.; Paytan, A. Phosphorus associations in aerosols: What can they tell us about P bioavailability? Mar. Chem. 2010, 120, 44–56. [Google Scholar] [CrossRef]
  80. Chen, H.; Abdulla, H.A.; Sanders, R.L.; Myneni, S.C.; Mopper, K.; Hatcher, P.G. Production of black carbon-like and aliphatic molecules from terrestrial dissolved organic matter in the presence of sunlight and iron. Environ. Sci. Technol. Lett. 2014, 1, 399–404. [Google Scholar] [CrossRef]
  81. Waggoner, D.C.; Chen, H.; Willoughby, A.S.; Hatcher, P.G. Formation of black carbon-like and alicyclic aliphatic compounds by hydroxyl radical initiated degradation of lignin. Org. Geochem. 2015, 82, 69–76. [Google Scholar] [CrossRef]
  82. Decesari, S.; Finessi, E.; Rinaldi, M.; Paglione, M.; Fuzzi, S.; Stephanou, E.; Tziaras, T.; Spyros, A.; Ceburnis, D.; O’Dowd, C. Primary and secondary marine organic aerosols over the North Atlantic Ocean during the map experiment. J. Geophys. Res. Atmos. 2011, 116. [Google Scholar] [CrossRef]
  83. Simoneit, B.R.T.; Schauer, J.J.; Nolte, C.; Oros, D.R.; Elias, V.O.; Fraser, M.; Rogge, W.; Cass, G.R. Levoglucosan, a tracer for cellulose in biomass burning and atmospheric particles. Atmos. Environ. 1999, 33, 173–182. [Google Scholar] [CrossRef]
Figure 1. Representative full ESI(−) FTICR mass spectra for WSOMPPL extracts of (a) marine; (b) biomass burning; (c) urban; and (d) mixed source aerosols between 200 and 800 m/z. Some intense peaks are shown off scale.
Atmosphere 07 00079 g001
Figure 2. PCA score plots for PC2 versus PC1 (left) and PC3 versus PC1 (right). PCA was performed using molecular formulas identified in FTICR mass spectra for aerosol OM extracts from marine, biomass burning, urban, and mixed source areas.
Atmosphere 07 00079 g002
Figure 3. Van Krevelen diagrams for molecular formulas identified by PCA for (a) marine; (b) biomass burning; (c) urban; and (d) mixed source aerosols. Each data point is colored according to the atomic content of the molecular formula.
Atmosphere 07 00079 g003
Figure 4. 1H NMR spectra for WSOM of (a) marine; (b) biomass burning; (c) urban; and (d) mixed source aerosols, where each colored line represents a different sample spectrum. The region between 6 and 9 ppm represents aromatic protons, and is expanded in the inset of each spectrum.
Atmosphere 07 00079 g004
Figure 5. Aerosol WSOM (a) PC1 and PC2 scores for PCA of full 1H NMR spectra of marine, mixed source, biomass burning, and urban aerosols and (b) PC1 and PC2 scores for PCA omitting marine aerosols. The amount of variation explained by each PC is indicated in parentheses on each axis.
Atmosphere 07 00079 g005
Figure 6. Variable loadings plots for (a) PC1 and (b) PC2 resulting from PCA using full 1H NMR spectra of mixed source, biomass burning, and urban aerosol WSOM. Some peaks are labeled with the functional group region and some peaks labeled with a single letter to indicate a specific compound, where A = acetic acid or acetate and L = levoglucosan.
Atmosphere 07 00079 g006
Table 1. Average total suspended particulates (TSP) and total carbon (TC) concentrations and carbon percentages (relative to TC) for each aerosol source type.
Aerosol SourcenTSP (μg·m−3)TC (μg·m−3)%BC%WSOC%PSOC
* Marine4-0.5 ± 0.7-39.6 ± 25.1-
Biomass burning273.2 ± 5.324.8 ± 4.46.5 ± 0.733.6 ± 2.666 ± 20
Urban547.1 ± 11.06.3 ± 1.33.4 ± 3.240.8 ± 5.544 ± 6
Mixed source324.1 ± 2.95.7 ± 0.71.9 ± 2.550.5 ± 10.645 ± 13
* Some parameters for the marine aerosols could not be evaluated due to limited sample availability.
Table 2. Total formulas and average elemental properties for aerosol WSOMPPL and PSOM from each emission source determined using FTICR mass spectra.
Marine Aerosols
n = 4
Biomass Burning Aerosols
n = 2
Urban Aerosols
n = 5
Mixed Source Aerosols
n = 3
Average formulas2569 ± 7366579 ± 1736527 ± 1734104 ± 467
Total formulas4570789110,7016134
Average O/C0.32 ± 0.190.32 ± 0.190.45 ± 0.230.44 ± 0.23
Average H/C1.56 ± 0.391.35 ± 0.391.44 ± 0.371.46 ± 0.35
Average AImod0.18 ± 0.260.29 ± 0.270.18 ± 0.240.18 ± 0.23
Table 3. Total formulas and average elemental properties for molecular formulas identified by PCA. Distributions of formulas based on atomic content and AImod structure type are listed as percentage of total formulas.
Marine AerosolsBiomass Burning AerosolsUrban AerosolsMixed Source Aerosols
Total formulas107841743484693
Average O/C0.27 ± 0.170.26 ± 0.130.55 ± 0.210.33 ± 0.18
Average H/C1.55 ± 0.411.24 ± 0.371.36 ± 0.341.48 ± 0.34
Average AImod0.20 ± 0.250.37 ± 0.230.18 ± 0.220.20 ± 0.21
Atomic Content (%)
CHO31.634.733.445.0
CHON13.445.438.024.4
CHOS27.412.013.318.3
CHONS19.07.812.56.6
CHOP(N,S)8.60.12.85.6
Structure Type (%)
Aliphatic31.412.034.124.0
Olefinic/alicyclic56.655.660.667.8
Aromatic5.526.83.14.9
Condensed aromatic6.65.62.33.3
Table 4. Average relative contributions of total spectral intensity for integrations of major proton regions in 1H NMR spectra for each of the aerosol sources. Standard deviations of the relative signal in each region among aerosols from the same source are provided.
Aerosol SourceH-C
(0.6–1.8 ppm)
H-C-C=
(1.8–3.2 ppm)
H-C-O-R
(3.2–4.4 ppm)
Ar-H
(6.0–9.0 ppm)
Marine50.3 ± 5.534.2 ± 3.914.5 ± 3.61.0 ± 0.3
Biomass burning50.9 ± 3.431.1 ± 0.69.4 ± 0.99.2 ± 1.9
Urban53.2 ± 1.535.0 ± 2.09.4 ± 1.12.4 ± 0.6
Mixed source57.0 ± 1.332.9 ± 0.48.4 ± 0.81.7 ± 0.3

