Abstract
Poor air quality in India has sparked our interest in studying the time series dynamics of PM2.5 in India’s five most populous cities (Mumbai, New Delhi, Hyderabad, Chennai, and Kolkata). Daily data for the period 2014–2023 are examined in the paper. Using fractional integration methods, we analyze the persistence, seasonality, and time trends of the data. The results indicate that all seriGewekees display fractional degrees of integration, being smaller than 1 and thus presenting mean reversion. Moreover, the time trends are significantly negative only for New Delhi and Kolkata, implying a continuous reduction in the level of pollution. These findings suggest that targeted interventions, such as stricter emission regulations, improved urban planning, and the promotion of clean technologies, are essential to sustain and amplify the observed improvements in air quality. The study also highlights the need for consistent and long-term efforts to address pollution in Mumbai, Hyderabad, and Chennai, where no significant reductions have been observed, emphasizing the importance of adapting policies to regional conditions. The paper’s findings can serve as a guide for air pollution management and for policymakers at the Central Pollution Control Board (CPCB), the governmental body responsible for monitoring and regulating environmental pollution in India.
1. Introduction
According to the HEI 2022 report, New Delhi and Kolkata are the most polluted cities in the world, ranking first in terms of fine particulate matter (PM2.5) levels. In 2021, the World Air Quality Report (WHO, 2021) [1] listed New Delhi as the capital with the most polluted air for the fourth year in a row despite the government launching the National Clean Air Programme (NCAP) [2] in 2019 to reduce particulate matter levels by 20–30% by 2024.
Breathing air with dangerous levels of PM2.5 causes approximately four million premature deaths each year worldwide, and of these, 25% of deaths occur in India (Chafe et al., 2021) [3]. The average annual levels of PM2.5 in an area should not exceed 40 μg/m3, according to the Central Pollution Control Board (CPCB) [4], which is India’s main body for pollution control; this figure is far from that recommended by the World Health Organization (WHO), which has set the limit to 5 μg/m3 (WHO, 2021) [1]
The average PM2.5 concentration in India, measured in micrograms per cubic meter (μg/m3), was 53.3 in 2022, compared to the WHO’s recommended annual guideline level of 5 μg/m3 (HEI, 2022) [5]. IQAir (2022) [6] has developed a cost estimator that calculates the health and economic costs of air pollution in some of the world’s largest cities; it is based on an algorithm that combines real-time data from ground-level air quality sensors (PM2.5 and NO2). This study provided an alarming estimate of the cost of air pollution for the world’s five most populous cities (Tokyo, Delphi, Shanghai, Brazil, and Mexico City) for the entirety of 2020 in terms of lives and productivity lost. In these five cities alone, air pollution caused nearly 200,000 deaths and cost USD 106 billion during 2020. Rao et al. (2021) [7] pointed out that 20–50% of pollutants in the air originate from the combustion of residential solid fuels in India. Despite the Indian government’s initiatives to promote the use of liquefied petroleum gas, about 70% of the Indian population still relies on solid fuels for cooking.
Another major driver of air pollution in India comes from the burning of cow dung and municipal solid waste (Stewart et al., 2021) [8]. Chakrabarti et al. (2019) [9] estimated the health and economic costs of burning agricultural crop residues in northern India, pointing to the need for investment and alternative solutions for crop residue disposal and for this to translate into economic benefits. Cusworth et al. (2018) [10], using a combination of observed and modeled variables, including surface measurements of PM2.5, quantified the influence of agricultural fire emissions on air pollution in Delhi, underlining the potential health benefits of changes in agricultural practices to reduce fires. A study by the World Bank (The World Bank, 2022) [11] revealed that a 20% decrease in PM2.5 is associated with a 16% increase in the employment growth rate and a 33% increase in labor productivity. In its report, the World Bank estimated that the cost of health damage caused by air pollution amounted to USD 8.1 trillion annually, or 6.1% of global GDP.
This study focuses on the analysis of the statistical properties of PM2.5 in cities in India during the 2014–2023 period, with daily data. The choice of Mumbai, New Delhi, Hyderabad, Chennai, and Kolkata as the objects of analysis is based on two key criteria. First, these cities are the most populous in India, according to the 2011 census, and represent areas of high industrial, vehicular, and economic activity. Their inclusion ensures that the findings are relevant to highly dynamic and densely populated urban contexts, which are major contributors to air pollution. Second, these cities have complete PM2.5 daily data series for the period 2014–2023, ensuring the consistency and quality of the results.
The selection also responds to their strategic importance in the implementation of air quality policies, as they are indicators of compliance with the National Clean Air Program (NCAP, 2019 [2]), aiming for a reduction in particulate matter levels by 20–30% by 2024, and allow us to know whether the effects of PM2.5 pollution shocks are transient or permanent. In addition, the climatic and geographic diversity of these cities allows for a comprehensive analysis that considers different environmental conditions and pollution patterns, providing a robust and representative perspective of air quality dynamics in India.
For analysis, we use fractional integration, an advanced statistical technique that allows us to characterize the long-term memory properties of the time series. This approach not only identifies the persistence of the data but also assesses the reversion to the mean and quantifies the degree of persistence of disturbances, offering greater accuracy in detecting underlying patterns when modeling complex phenomena such as air pollution and thus providing a solid basis for the formulation of policies and mitigation strategies.
2. Literature Review
Studies on air pollution are numerous; some focus on health effects (Smith et al., 2000 [12]; Balakrishnan et al., 2018 [13]; Hang et al., 2022 [14], Shen et al., 2022 [15]; etc.); others look at the causes of air pollution (Badami, 2005 [16], Puthussery et al., 2022 [17]; Ravindra et al., 2023 [18]) and the costs of pollution (Cropper et al., 2019 [19]; Pandey et al., 2021 [20]).
ARIMA (AutoRegressive Integrated Moving Average) models have been a traditional tool in time series analysis related to air quality. Previous studies, such as those by Naveen (2017) [21] and Abhilash et al. (2018) [22], have applied this approach to model and predict the concentration of air pollutants in regions of India. For example, Naveen (2017) [21] used ARIMA and SARIMA models to analyze data in Kerala, concluding that these techniques provide high accuracy in short-term forecasting. On the other hand, Abhilash et al. (2018) [22] integrated NO2, PM10, and SO2 data in Bangalore, demonstrating that ARIMA effectively captures local trends and seasonalities.
Furthermore, Gopu et al. (2021) [23] and Kulkarni et al. (2018) [24] extended the use of ARIMA to air pollution time series analysis in Hyderabad and Nanded, respectively, showing that this approach is capable of identifying specific emission and dispersion patterns in urban regions. Chaudhuri et al. (2014) [25], on the other hand, applied ARIMA to detect trends in pollutants and meteorological parameters in Kolkata, highlighting its usefulness in contexts where time series present marked seasonalities.
Our study focuses on another branch, focused on modeling and analyzing time series of air pollutants, in this case PM2.5, in five of the most populous cities in India (Mumbai, New Delphi, Hyderabad, Chennai, and Kokalta) for the time period of 2014–2023, with daily observations using a fractional integration framework; this approach is broader than the standard approach, based on stationary I(0) (e.g., ARMA) and non-stationary I(1) (ARIMA), used in most air pollution studies. The analyzed PM2.5 series are characterized by a long memory with integration orders in the interval (0, 1), which allows us to study the reversion to the mean and whether the shocks have permanent or transient effects (Gil Alana et al., 2020 [26,27]; Lin et al., 2022 [28]; Chen et al., 2023 [29]; etc.).
This methodological advance is crucial for understanding pollution dynamics in cities such as Mumbai and Kolkata, where the trends detected reflect both public policy impacts and specific environmental conditions. Comparing our approach with previous studies highlights how fractional integration not only allows capturing reversion to the mean but also identifies shocks that have deeper implications in the formulation of pollution mitigation and control strategies.
Chen et al. (2016) [30] analyzed pollution in four Chinese cities between 2013 and 2015 using fractional integration methods, revealing persistent behavior in pollution levels and underscoring the need for sustained interventions to achieve long-term improvements. This study set an important precedent by highlighting that shocks to pollution levels can have long-lasting effects in the absence of appropriate policies.
For their part, Caporale et al. (2021) [31] applied the same methodology to ten European capitals, managing to demonstrate not only reversion to the mean in PM10 concentrations, but also that the observed perturbations have no permanent effects. This finding has significant implications for European air quality policies, as it underlines the effectiveness of current interventions in reducing air pollutants. Finally, Gil-Alana et al. (2020) [26] analyzed air pollution in London, addressing seven different pollutants and finding consistent patterns of persistence. This study provides further validation of the utility of fractional integration methods for understanding underlying dynamics in complex urban contexts, highlighting the need to maintain consistent pollution control efforts to avoid setbacks.
3. Data
PM2.5 data have been extracted from the World Air Quality Index (WAQI) [32] in https://aqicn.org/map/world/es/ (accessed on 27 March 2025).
The data have been converted using the U.S. EPA (United States Environmental Protection Agency) standard. WAQI data come from the following original sources: the US. Embassy and consulates in India [33].
The air quality data collected are translated into actionable insights using the U.S. Environmental Protection Agency’s (EPA) NowCast algorithm. This algorithm converts raw PM2.5 readings into an air quality index (AQI) value that can help inform health-related decisions. The index is calculated based on data from a period of 3 to 12 h, depending on the variability of particulate matter concentration (US. Embassy and consulates).
The series analyzed correspond to the daily data, between 10 December 2014 and 16 September 2023, of PM2.5 (μg/m3) in Mumbai (the U.S. Consulate General’s air pollution monitor covers the area of Bandra), New Delphi (the U.S. Embassy’s air pollution monitor covers the Chanakyapuri area), Hyderabad (the U.S. Consulate General’s air pollution monitor covers the Secundarad area), Chennai (the U.S. Consulate General’s air pollution monitor covers the Gopalapurum area), and Kokalta (the U.S. Consulate General’s air pollution monitor covers the Park Street area) (Figure 1, Figure 2, Figure 3, Figure 4 and Figure 5). Although there are other monitoring stations available, these were chosen because they have complete PM2.5 data sets. In addition, they are all operated by the U.S. Embassy, which ensures greater uniformity in monitoring conditions among the different cities. In addition, they are all operated by the U.S. Embassy, which ensures greater uniformity in monitoring conditions among different cities. Figure 6 shows their locations.
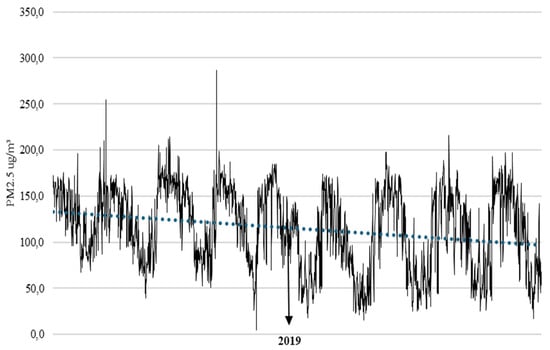
Figure 1.
PM2.5 (2014–2023) Hyderbad.
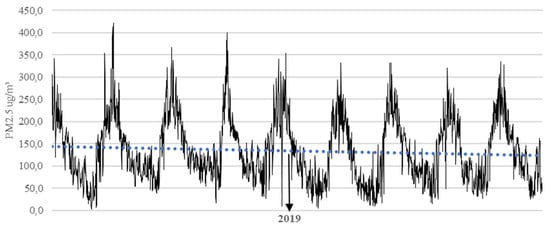
Figure 2.
PM2.5 (2014–2023) Kolkata.
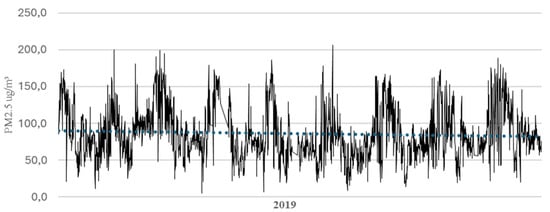
Figure 3.
PM2.5 (2014–2023) Chennai.
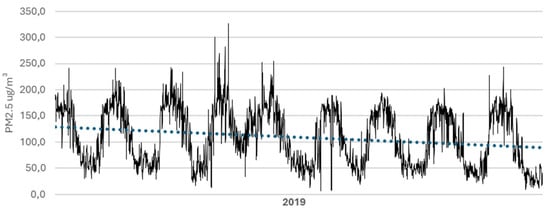
Figure 4.
PM2.5 (2014–2023) Mumbai.
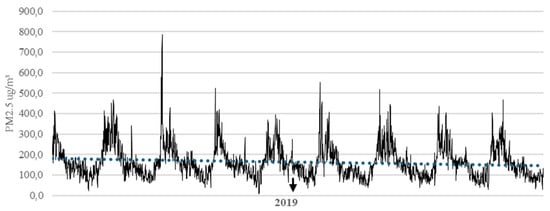
Figure 5.
PM2.5 (2014–2023) New Delhi.
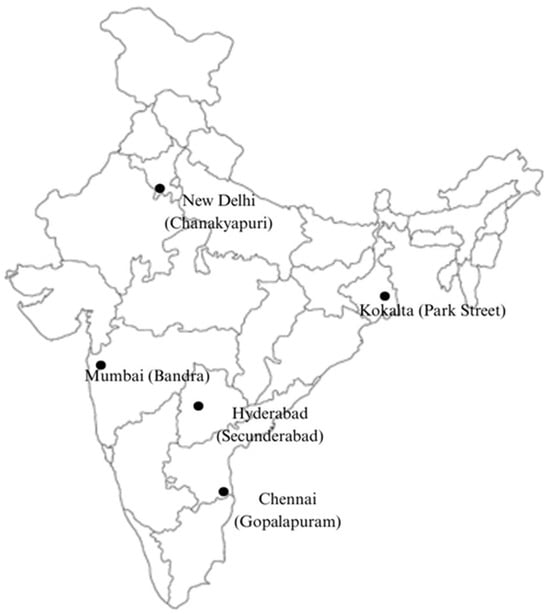
Figure 6.
Air quality monitoring Stations.
4. Methodology and Empirical Results
As mentioned earlier, we use a time series technique denominated fractional integration, which is characterized by the fact that the number of differences required in the series to render it stationary I(0) may be a fractional value. Having said this, we define the concept of integration of order 0 or I(0), also named short memory. A covariance stationary process, x(t), with mean μ is short memory or I(0) if the infinite sum of the autocovariances, defined as γ(u) = E[(x(t) − μ)(x(t + u) − μ)], is finite; that is,
Short memory processes can encompass the classical AutoRegressive Moving Average (ARMA) processes, widely used in the modeling of time series data; however, the data may display much higher time dependence, for instance, in the case where first differences are required, as in the ARIMA models. Specifically, if the first differences follow an ARMA (p, q) pattern, then the original series is denominated ARIMA (p, 1, q). These two representations, ARMA and ARIMA, have been widely used in the literature to describe, respectively, stationary and nonstationary processes. However, it is a well-known stylized fact that many series, particular those related to natural phenomena, may display a degree of time dependence smaller than the one obtained with first integration, and this is the case of fractional integration or fractional differentiation (Granger, 1980 [34]; Granger and Joyeux, 1980 [35]; Hosking, 1981 [36]).
A process is said to be I(d) or integrated of order d if it admits the following representation,
where L refers to the lag operator, i.e., Lx(t) = x(t − 1), and d is a fractional value. In this context, if d is positive, the infinite sum of autocorrelations becomes unbounded, i.e.,
Several values of d are relevant for our purposes. Thus, d = 0 is relevant because it indicates short memory, while d > 0 produces long memory patterns; from a statistical viewpoint, d < 0.50 implies that the series is stationary while values of d above 0.5 produce nonstationarity. Another relevant value is 1. Thus, d < 1 is associated with mean reversion, with shocks disappearing by themselves in the long run, unlike what happens with d ≥ 1, i.e., a lack of mean reversion and permanency of shocks.
The fractional differencing parameter d is called the measure of persistence in the sense that the higher this value is, the higher the level of dependence between observations. This can be seen using binomial expansion on the polynomial in the Lin Equation (2), noting that for all real d,
and thus, the equality appearing in Equation (1) can be expressed as follows:
Following standard parameterization, we incorporate a linear time trend of the following form:
where y(t) might represent the data under consideration; α and β are coefficients that need estimation—namely, a constant and a time trend, respectively. The variable x(t) is determined by Equation (2). Thus, a significant value of β indicates a long-run increasing trend in the data.
In the application discussed below, our initial estimation involves a model specified by Equations (2) and (4). We assume that the error term u(t) follows a white noise process, with zero mean and constant variance. Then, autocorrelations are also permitted in u(t); however, instead of imposing a specific ARMA(p, q) model, we choose the approach developed by Bloomfield (1973) [37], which approximates ARMA models with few numbers of parameters in a non-parametric way. We say that this approximation is non-parametric because it does not have an explicit formula but is expressed exclusively in the frequency domain through its spectral density function, which log form approximates very well the one obtained with autoregressions (more details of this approach and its implementation in the context of fractional integration can be found in Gil-Alana, 2004, 2008 [27,38,39]).
The estimation is conducted via the likelihood function, using its expression in the frequency domain and Robinson’s (1994) [40] tests for the computation of the confidence intervals of the non-rejection values of d. Remember here that, from a policy perspective, the crucial issue is to determine if the differencing parameter d is lower than 1 or equal to or higher than 1; thus, in the first of the cases, the series will be mean-reverting with shocks disappearing by themselves in the long run, while d ≥ implies permanency of shocks.
Table 1 and Table 2 refer to the model with uncorrelated errors, while Table 3 and Table 4 demonstrate autocorrelation in the mode of Bloomfield (1973) [37]. In all cases, upper tables report results based on original data, while the lower panel is associated with results based on logarithm form. In Table 1 and Table 3, we report the estimates of the differencing parameter d and their associated 95% confidence intervals for the three standard cases of (i) no deterministic regressors (i.e., with no intercept and no time trend, results displayed in column 2), with an intercept (in column 3), and with an intercept and a time trend, i.e., using Equation (1) (in column 4). In the two tables, we have marked in bold the most adequate specification for each series, based on the significance of the estimates of deterministic terms (i.e., the constant and the time trend).

Table 1.
Estimates of d and 95% confidence intervals with uncorrelated errors.
Table 2.
Estimated coefficients of the selected models. Uncorrelated errors.
Table 3.
Estimates of d and 95% confidence intervals with autocorrelated errors.
Table 4.
Estimated coefficients of the selected models. Autocorrelated errors.
Starting with the results based on uncorrelated u(t), (Table 1 and Table 2), the first thing we observe is that the model with an intercept is the selected specification in all cases, using both original and logged data. The estimates of d are all in the interval (0, 1), thus supporting the hypothesis of fractional integration. Moreover, all values are significantly higher than 0.50, which implies that the series are nonstationary, and more importantly, are all below 1, which indicates that the series revert to the mean. The values of d range between 0.66 (New Delhi) and 0.75 (Kolkata), with the original data; for the logged values, the estimates range between 0.64 (New Delhi) and 0.70 (Kolkata).
If autocorrelation is permitted on u(t), in Table 3, we observe that a time trend is required in the cases of Mumbai and Kolkata. The time trend coefficient is negative in the two cases, and the slope is higher in magnitude for Kolkata with the original data, but for Mumbai with the logged values. Looking at the estimated values of d, they are smaller than in the case of uncorrelated errors. The lowest estimate of d occurs for Chennai, with a value of d of 0.46 with the original data and 0.43 with the logged values. The highest values are obtained for Kolkata (d = 0.60) and Mumbai (0.59) with the original data, and for Kolkata (0.55) with the logged form. As with the uncorrelated results, mean reversion takes place in all cases.
5. Conclusions
This paper contributes to the air pollution literature by using fractional integration to analyze the behavior of PM2.5 in the five most populated cities of India—Mumbai, New Delhi, Hyderabad, Chennai, and Kolkata. Daily data from the World Air Quality Index (WAQI) between 10 December 2014 and 16 September 2023 were used.
The results obtained allow the assessment of compliance with the National Clean Air Program (NCAP, 2019), which aims to reduce particulate matter levels by 20% to 30% by 2024. This analysis is fundamental to determine whether the effects of PM2.5 pollution are transient or permanent.
The values obtained for the integration parameter, all greater than 0.50, indicate that the time series are not stationary. This could be attributed to climatic factors, such as monsoon patterns, temperature fluctuations, and wind speed variations, as well as seasonal human activities like agricultural burning, festivals, and increased vehicular emissions during certain times of the year. These natural and anthropogenic influences play a critical role in shaping the evolution of pollution levels. However, all data are less than 1, indicating that the series tend to return to their historical mean and that disturbances disappear on their own in the long term.
The presence of a transitory component in the disturbances implies that, even if a substantial reduction in emission levels is achieved, the authorities must implement control strategies that ensure the sustainability of such progress in the long term. Without continuous and effective measures, it is likely that pollution levels will tend to return to their previous levels. Therefore, it is recommended that, in addition to current policies, additional measures be implemented, such as the promotion of cleaner technologies, the optimization of public transportation, and the implementation of stricter regulations for particulate-emitting industries.
The time trend coefficient shows negative results for Mumbai and Kolkata, indicating an improvement in air quality in both cities. This trend could be attributed to the adoption of cleaner technologies, improvements in urban infrastructure, or changes in citizen behavior. In particular, Kolkata has the steepest magnitude slope with respect to the original data, suggesting that the control measures implemented in the city have been particularly effective in reducing PM2.5 concentrations. In Mumbai, the recorded data reflect that the policies adopted have had a positive impact and that air quality has improved.
However, in the remaining three cities, additional efforts are required to avoid a return to historical pollution levels. It is crucial to implement long-term policies that not only seek to reduce emissions but also encourage structural changes in urban planning, energy use, and transportation to ensure that improvements in air quality are sustainable.
New Delhi, with the highest concentrations of PM2.5, faces complex challenges due to agricultural waste burning and heavy vehicular traffic, underscoring the need for greater enforcement of NCAP policies. Climatic factors, such as the dry winter season and limited atmospheric dispersion during colder months, exacerbate pollution levels in the city. Hyderabad and Chennai also present significant challenges, as the lack of significant reductions could be linked to climatic factors or insufficient implementation of robust environmental policies.
To strengthen the findings, a more detailed assessment of the specific sources of pollution in each city is recommended, which would allow for the design of more targeted strategies. In addition, the implementation of economic incentives for the adoption of sustainable practices in key sectors, such as agriculture and transportation, could accelerate the necessary improvements. This approach would not only complement existing policies but also ensure long-term sustainable progress.
In conclusion, the findings underscore the importance of environmental planning tailored to the unique conditions and characteristics of each city. Mumbai and Kolkata demonstrate the positive impact of well-designed interventions, but New Delhi, Hyderabad, and Chennai require additional efforts to ensure sustainable improvements in air quality. The interplay of natural factors and anthropogenic activities highlights the complexity of air pollution management and the need for dynamic, multi-faceted strategies. This study provides a solid foundation to guide targeted policy formulation, ensuring cleaner air and a healthier future for generations to come.
Author Contributions
Methodology, L.A.G.-A.; Software, L.A.G.-A.; Formal analysis, L.A.G.-A.; Resources, N.C.-G.; Data curation, N.C.-G.; Writing—original draft, N.C.-G., Conceptualization, N.C.-G., L.A.G.-A. All authors have read and agreed to the published version of the manuscript.
Funding
Luis A. Gil-Alana gratefully acknowledges financial support from the MINEIC-AEI-FEDER ECO2017-85503-R project from ‘Ministerio de Economía, Industria y Competitividad’ (MINEIC), ‘Agencia Estatal de Investigación’ (AEI), Spain, and ‘Fondo Europeo de Desarrollo Regional’ (FEDER). He also acknowledges support from an internal project of the Universidad Francisco de Vitoria. Comments from the editor and four anonymous reviewers are gratefully acknowledged.
Institutional Review Board Statement
Not applicable.
Informed Consent Statement
Not applicable.
Data Availability Statement
No new data were created or analyzed in this study.
Conflicts of Interest
The authors declare no conflict of interest.
References
- WHO. WHO Global Air Quality Guidelines. 2021. Available online: https://www.who.int/es/news-room/questions-and-answers/item/who-global-air-quality-guidelines (accessed on 28 March 2025).
- National Clean Air Programme (NCAP). Ministry of Environment, Forest and Climate Change. Government of India. 2019. Available online: https://prana.cpcb.gov.in/#/about (accessed on 28 March 2025).
- Chafe, Z.; Chowdhury, S. A deadly double dose for India’s. Nat. Sustain. 2021, 4, 835–836. [Google Scholar] [CrossRef]
- Central Pollution Control Board (CPCB). Ministry of Environment, Forest and Climate Change Government of India. Available online: https://cpcb.nic.in/air-pollution/ (accessed on 28 March 2025).
- Health Effects Institute (HEI). Air Quality and Health. In Cities: A State of Global Air Report 2022; Health Effects Institute: Boston, MA, USA, 2022; Available online: https://www.stateofglobalair.org/sites/default/files/documents/2022-08/2022-soga-cities-report.pdf (accessed on 28 March 2025).
- IQAir World’s most Polluted Cities. 2022. Available online: https://www.iqair.com/world-most-polluted-cities (accessed on 28 March 2025).
- Rao, N.D.; Kiesewetter, G.; Min, J.; Pachauri, S.; Wagner, F. Household contributions to and impacts from air pollution in India. Nat. Sustain. 2021, 4, 859–867. [Google Scholar] [CrossRef]
- Stewart, G.J.; Nelson, B.S.; Acton, W.J.F.; Vaughan, A.R.; Farren, N.J.; Hopkins, J.R.; Ward, M.W.; Swift, S.J.; Arya, R.; Mondal, A.; et al. Emissions of intermediate-volatility and semi-volatile organic compounds from domestic fuels used in Delhi, India. Atmos. Chem. Phys. 2021, 21, 2407–2426. [Google Scholar] [CrossRef]
- Chakrabarti, M.; Khan, T.; Kishore, A.; Roy, D.; Scott, S.P. Risk of acute respiratory infection from crop burning in India: Estimating disease burden and economic welfare from satellite and national health survey data for 250 000 persons. Int. J. Epidemiol. 2019, 48, 1113–1124. [Google Scholar] [CrossRef]
- Cusworth, D.H.; Mickley, L.J.; Sulprizio, M.P.; Liu, T.; Marlier, M.E.; DeFries, R.S.; Guttikunda, S.K.; Gupta, P. Quantifying the influence of agricultural fires in northwest India on urban air pollution in Delhi, India. Environ. Res. Lett. 2018, 13, 044018. [Google Scholar] [CrossRef]
- The World Bank. What You Need to Know About Climate Change and Air Pollution. 2022. Available online: https://www.worldbank.org/en/news/feature/2022/09/01/what-you-need-to-know-about-climate-change-and-air-pollution (accessed on 28 March 2025).
- Smith, K.R. National burden of disease in India from indoor air pollution. Proc. Natl. Acad. Sci. USA 2000, 97, 13286–13293. [Google Scholar] [CrossRef]
- Balakrishnan, K.; Dey, S.; Gupta, T.; Dhaliwal, R.S.; Brauer, M.; Cohen, A.J.; Dandona, L. The impact of air pollution on deaths, disease burden, and life expectancy across the states of India: The Global Burden of Disease Study 2017. Lancet Planet Health 2018, 3, e26–e39. [Google Scholar] [CrossRef]
- Hang, Y.; Meng, X.; Li, T.; Wang, T.; Cao, J.; Fu, Q.; Dey, S.; Li, S.; Huang, K.; Liang, F.; et al. Assessment of long-term particulate nitrate air pollution and its health risk in China. iScience 2022, 25, 104899. [Google Scholar] [CrossRef]
- Shen, J.; Cai, W.; Chen, X.; Chen, X.; Zhao, Z.; Ma, Z.; Yang, F.; Zhang, S. Synergies of carbon neutrality, air pollution control, and health improvement a case study of China energy interconnection scenario. Glob. Energy Interconnect. 2022, 5, 531–542. [Google Scholar] [CrossRef]
- Badami, M.G. Transport and urban air pollution in India. Environ. Manag. 2005, 36, 195–204. [Google Scholar] [CrossRef]
- Puthussery, J.V.; Dave, J.; Shukla, A.; Gaddamidi, S.; Singh, A.; Vats, P.; Salana, S.; Ganguly, D.; Rastogi, N.; Tripathi, S.N.; et al. Effect of Biomass Burning, Diwali Fireworks, and Polluted Fog Events on the Oxidative Potential of Fine Ambient Particulate Matter in Delhi, India. Environ. Sci. Technol. 2022, 56, 14605–14616. [Google Scholar] [CrossRef]
- Ravindra, K.; Singh, T.; Singh, V.; Chintalapati, S.; Beig, G.; Mor, S. Understanding the influence of summer biomass burning on air quality in North India: Eight cities field campaign study. Sci. Total Environ. 2023, 861, 160361. [Google Scholar] [CrossRef]
- Cropper, M.L.; Guttikunda, S.; Jawahar, P.; Lazri, Z.; Malik, K.; Song, X.P.; Yao, X. Applying benefit-cost analysis to air pollution control in the Indian power sector. J. Benefit-Cost Anal. 2019, 10 (Suppl. S1), 185–205. [Google Scholar] [CrossRef] [PubMed]
- Pandey, A.; Brauer, M.; Cropper, M.L.; Balakrishnan, K.; Mathur, P.; Dey, S.; Dandona, L. Health and economic impact of air pollution in the states of India: The Global Burden of Disease Study 2019. Lancet Planet. Health 2021, 5, e25–e38. [Google Scholar] [CrossRef] [PubMed]
- Naveen, V.; Anu, N. Time series analysis to forecast air quality indices in Thiruvananthapuram District, Kerala, India. J. Eng. Res. Appl. 2017, 7, 66–84. [Google Scholar] [CrossRef]
- Abhilash, M.S.K.; Thakur, A.; Gupta, D.; Sreevidya, B. Time Series Analysis of Air Pollution in Bengaluru Using ARIMA Model. In Ambient Communications and Computer Systems. Advances in Intelligent Systems and Computing; Perez, G., Tiwari, S., Trivedi, M., Mishra, K., Eds.; Springer: Singapore, 2018; Volume 696. [Google Scholar] [CrossRef]
- Gopu, P.; Panda, R.R.; Nagwani, N.K. Time Series Analysis Using ARIMA Model for Air Pollution Prediction in Hyderabad City of India. In Soft Computing and Signal Processing; Reddy, V.S., Prasad, V.K., Wang, J., Reddy, K.T.V., Eds.; Advances in Intelligent Systems and Computing; Springer: Singapore, 2021; Volume 1325. [Google Scholar] [CrossRef]
- Kulkarni, G.E.; Muley, A.A.; Deshmukh, N.K.; Bhalchandra, P.U. Autoregressive integrated moving average time series model for forecasting air pollution in Nanded city, Maharashtra, India. Model. Earth Syst. Environ. 2018, 4, 1435–1444. [Google Scholar] [CrossRef]
- Chaudhuri, S.; Dutta, D. Mann–Kendall trend of pollutants, temperature and humidity over an urban station of India with forecast verification using different ARIMA models. Environ. Monit. Assess. 2014, 186, 4719–4742. [Google Scholar] [CrossRef]
- Gil-Alana, L.A.; Yaya, O.S.; Carmona-González, N. Air quality in London: Evidence of persistence, seasonality and trends. Theor. Appl. Climatol. 2020, 142, 103–115. [Google Scholar] [CrossRef]
- Gil-Alana, L.A.; Yaya, O.; Awolaja, O.; Cristofaro, L. Long memory and time trends in PM pollution in US states. J. Appl. Meteorol. Climatol. 2020, 59, 1351–1367. [Google Scholar] [CrossRef]
- Lin, G.-Y.; Lee, Y.-M.; Tsai, C.-J.; Lin, C.-Y. Spatial-temporal characterization of air pollutants using a hybrid deep learning/Kriging model incorporated with a weather normalization technique. Atmos. Environ. 2022, 289, 119304. [Google Scholar] [CrossRef]
- Chen, M.; Chen, Y.; Zhu, H.; Wang, Y.; Xie, Y. Analysis of pollutants transport in heavy air pollution processes using a new complex-network-based model. Atmos. Environ. 2023, 292, 19395. [Google Scholar] [CrossRef]
- Chen, Z.; Barros, C.P.; Gil-Alana, L.A. The persistence of air pollution in four mega-cities of China. Habitat Int. 2016, 56, 103–108. [Google Scholar] [CrossRef]
- Caporale, G.M.; Gil-Alana, L.A.; Carmona-González, N. Particulate matter 10 (PM10): Persistence and trends in eight European capitals. Air Quality. Atmos. Health 2021, 14, 1097–1102. [Google Scholar] [CrossRef]
- World Air Quality Index (WAQI). Available online: https://aqicn.org/map/world/es/ (accessed on 28 March 2025).
- US. Embassy & Consulates in India. Available online: https://in.usembassy.gov/embassy-consulates/new-delhi/air-quality-data/ (accessed on 28 March 2025).
- Granger, C.W.J. Long memory relationships and the aggregation of dynamic models. J. Econom. 1980, 14, 227–238. [Google Scholar] [CrossRef]
- Granger, C.W.J.; Joyeux, R. An Introduction to Long-Memory Time Series Models and Fractional Differencing. J. Time Ser. Anal. 1980, 1, 15–29. [Google Scholar] [CrossRef]
- Hosking, J.R. Fractional differencing. Biometrika 1981, 68, 165–176. [Google Scholar] [CrossRef]
- Bloomfield, P. An Exponential Model for the Spectrum of a Scalar Time Series. Biometrika 1973, 60, 217–226. [Google Scholar] [CrossRef]
- Gil-Alana, L.A. The use of the Bloomfield model as an approximation to ARMA processes in the context of fractional integration. Math. Comput. Model. 2004, 39, 429–436. [Google Scholar] [CrossRef]
- Gil-Alana, L.A. Fractional integration with Bloomfield exponential spectral disturbances. A Monte Carlo experiment and an application. Braz. J. Probab. Stat. 2008, 22, 69–93. [Google Scholar]
- Robinson, P.M. Efficient Tests of Nonstationary Hypotheses. J. Am. Stat. Assoc. 1994, 89, 1420–1437. [Google Scholar] [CrossRef]
Disclaimer/Publisher’s Note: The statements, opinions and data contained in all publications are solely those of the individual author(s) and contributor(s) and not of MDPI and/or the editor(s). MDPI and/or the editor(s) disclaim responsibility for any injury to people or property resulting from any ideas, methods, instructions or products referred to in the content. |
© 2025 by the authors. Licensee MDPI, Basel, Switzerland. This article is an open access article distributed under the terms and conditions of the Creative Commons Attribution (CC BY) license (https://creativecommons.org/licenses/by/4.0/).